 Open Access Article
iR drop correction in electrocatalysis: everything one needs to know!
Sengeni
Anantharaj
 *ab and
Suguru
Noda
 ab
ab
aDepartment of Applied Chemistry, School of Advanced Science and Engineering, Waseda University, 3-4-1 Okubo, Shinjuku-ku, Tokyo 169-8555, Japan. E-mail: ananth@aoni.waseda.jp; anantharaj1402@gmail.com
bWaseda Research Institute for Science and Engineering, Waseda University, 3-4-1 Okubo, Shinjuku-ku, Tokyo 169-8555, Japan
First published on 30th March 2022
Abstract
Direct current (DC) voltammetric techniques in which the potential is controlled while the response is measured as current are in use for decades now in the screening of electrocatalysts used in energy conversion devices, sensors, and electrolyzers despite being inferior in many ways to alternating current (AC) techniques and other advanced voltammetric techniques because of their simplicity to use and handle resultant data. One of the major issues with the controlled-potential DC techniques where the applied potential is controlled by means of a reference electrode is the potential drop at the interface. This drop in potential affects the obtained results to an inconceivably greater extent in some cases. Hence, this drop in potential is manually corrected by following Ohm's law. However, there exists a pile of miscalculated potential drop corrections in the literature because of the challenges in understanding them and the unawareness of the protocols that need to be followed. To help the beginners of this field, this article is dedicated to defining and elaborating a potential drop, the factors influencing it, commonly made mistakes, and best practices.
Introduction
The activity of every electrocatalyst used in energy conversion devices (batteries and fuel cells), electrolyzers (H2O, CO2, N2, etc.), and electrochemical sensors that involve electron transfer is determined using controlled-potential DC voltammetric techniques.1–4 Among the variety of such techniques, linear sweep voltammetry (LSV), cyclic voltammetry, and chronoamperometry (CA) are the most commonly used ones.5,6 In sensors, pulse voltammetry and differential pulse voltammetry (DPV) are also used for analytes that have low detection limits and with inseparable (by LSV and CV) redox peaks.7 Regardless of the technique used during the controlled-potential operation, there are numerous sources for potential drop at the WE-electrolyte interface.5,8 The possible sources can be low electronic conductivity of the catalyst, the low electrolytic conductivity of the solution, the distance between the RE and WE, the resistance of the contacts, and the roughness of the electrode surface.7 When the surface of the electrode is large and roughened in the DC mode, the passage of current from CE to WE initially leads the charging of the capacitor through the resistor in the circuit.9,10 This charging takes up some time and results in a time lag before the interface can reach the desired potential. This time lag is called the RC time constant, which is mathematically defined as the time needed to charge the capacitor of the DC circuit to 63.2%.11 Beyond this point, electron transfer pertaining to the catalysis of the reaction of interest occurs. Hence, an electrocatalyst is anticipated to have the lowest possible RC time constant as this is one of the main sources of potential drop.12 Thus, the area of the double layer also contributes to the potential drop. In a three-electrode system, at the open circuit potential (OCP), the current that flows between RE and WE is usually in the range of nA or even lower. However, when the current passes at WE (i.e., during operation), there is a significant current flow between WE and the tip of the RE. Hence, the electrolytic conductivity and the distance between RE and WE are the major contributors to the potential drop.7 This infers that an inevitable drop in the potential is witnessed in all cases of DC operations in electrochemistry.As a result, any activity evidenced as a function of the applied potential often has a slightly lower potential at the interface than the applied potential. Hence, to present the actual activity of an electrocatalyst13 and to use the polarization curves for Tafel analysis,14 the complete compensation for potential drops is done manually.5 This drop in potential is also known as ohmic drop or iRu drop. As the main sources of this drop are the low electrolytic conductivity and the distance between RE and WE, there have been several successful attempts to minimize the contribution of resistance from the solution (Rs) to the overall uncompensated resistance (Ru). Two of the most significant strategies ever used are the use of redox inactive supporting electrolytes to improve the electrolytic conductivity and the deployment of Luggin capillary.7 The latter enables us to place the reference electrode (RE) at the closest possible distance from the working electrode (WE). Since there are also other aforementioned sources of potential drop, avoiding the iRu drop completely is impossible and it must be corrected to present the intrinsic activity and to use the polarization curves for Tafel analyses. However, there are several challenges in correcting iRu drop (Fig. 1) and there also exists a pile of incorrectly iRu drop compensated polarization curves in the literature because of the unawareness of the protocols and the best practices to be followed. This article details what is iRu drop? why should it be corrected? how should it be corrected? the challenges, commonly made mistakes, and the best practices.
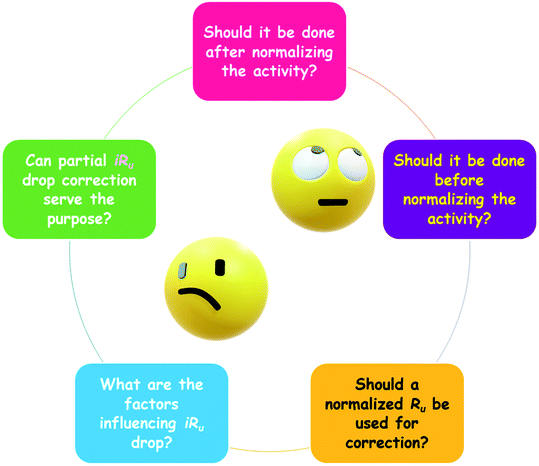 | ||
| Fig. 1 Commonly encountered challenges in understanding and correcting iRu drop in controlled-potential electrolysis. | ||
Factors influencing iRu drop
There are several things that can influence iRu drop as mentioned briefly above. Here, we explain a significant few of them in detail.7,15Electrolytic conductivity
A lower conductivity of the electrolyte is apparently a prime contributor to the overall Ru. Improving electrolytic conductivity is an utmost goal in all solution-based electrocatalysis. The most common way to improve the electrolytic conductivity is to add redox inactive salts. These salts are ideally expected to unalter the pH, and hence, should be formed by the neutralization of a strong acid and a strong base (e.g. KNO3). In some cases, buffers are used to tackle the issue of changing pH upon the addition of supporting electrolytes. If adding a supporting electrolyte is not an option, the alternative options to improve the electrolytic conductivity to a notable extent are stirring the solution, rotating the electrode, heating the solution, and applying ultrasonic waves. However, as water electrolysis and the electrolysis of CO2, N2, O2, etc., are carried out in extreme pH conditions, the addition of supporting electrolytes or the other mentioned means are mostly not necessary and may only be needed for improving the selectivity and yield in N2 and CO2 electrolysis.16–18 However, as the current of electrolysis is usually several orders of magnitude higher than what flows between the WE and the tip of the RE during operation, high electrolytic conductivity achieved at extreme pH conditions is also insufficient to completely avoid Rs, which is a major contributor to the overall Ru.The distance between RE and WE
Since the highest electrolytic conductivity that one can realize even at extreme pH conditions is not enough to alleviate Rs completely, the distance between RE and WE could have further influence in increasing the Rs. Hence, it is essential to place RE and WE as close as possible.19,20 The Luggin capillary is a setup that allows one to bring the tip of the RE to a closer proximity to the surface of the WE. However, as a general rule of thumb, it is said that a RE of diameter d should be placed at a distance of 2d from the surface of the WE. This may be suitable for highly sensitive sensor studies but not for electrolyzers that afford gaseous products and have a thicker double layer (in the cases of a large WE and WE with a high specific surface area (SSA)). Hence, the optimal distance between RE and WE should be determined by one's own discretion depending on the reaction, cell design, and the nature of the catalyst. At all costs, one should avoid touching the WE with the tip of the RE as it would cause the potential difference to cease to 0.0 V and mislead measurements. However, by compensating the iRu drop by 100%, one can easily eliminate the effect of WE and RE distances on iRu drop since Rs and the intrinsic resistance of the electrode (electrocatalyst-substrate electrode) contribute more than 90% to the overall Ru.Electronic conductivity of catalyst/electrode
A poor electronic conductivity can add up its own resistance to the overall Ru. Hence, it is important to have high electronic conductivity with WE. For catalytic electrodes with self-supported catalysts grown directly on the substrate electrodes, this issue is minimized to a greater extent. However, modified electrodes, such ascatalyst ink-coated substrate electrodes, suffer from high intrinsic resistance. In such cases, ensuring the substrate to be a better current collector and the catalyst ink to be a better electronic conductor is necessary. In instances where an electrocatalyst suffers from poor electronic conductivity, carbonization is the most commonly used strategy to improve its electronic conductivity. This works well with batteries and supercapacitors and even in some sensors too. However, carbon is not stable enough at high anodic potentials with which water electrolyzers and electrolyzers of CO2 and N2 work. In those cases, it is essential to modify the catalysts to have excellent electronic conductivity right from the synthesis/fabrication step.The roughness of WE and double-layer thickness
As stated earlier, the charging capacitor takes up some time in all DC circuits and the time required to charge the capacitor up to 63.2% of its total capacity via the resistor is known as the RC time constant.21 The lesser the RC time constant, the faster the interface can reach the desired applied potential and can begin the charge transfer associated with the reaction of interest. As high surface roughness and large area can result in a thicker double-layer, the RC time constant can also be higher, thus leading to more iRu drop. Hence, upon fabricating or synthesizing high surface area catalysts, one should be mindful of this factor as well. The factors governing the thickness of the double-layer are not only the surface roughness and active area but also the cell dimensions, the quantity of electrolyte, and A/V (area to volume ratio) values. The thickness of the double-layer can vary from a few nanometers to a few millimeters depending on the cell dimensions, the quantity of electrolyte, and A/V values. In general, a large area WE and a low volume of electrolyte always result in the formation of a thicker double-layer. These conditions are met with most thin-film cells. As for the electrolyzers that evolve gaseous products, such a high surface area could increase the resistance indirectly as a result of activity sites blocking by the gas bubbles formed at the surface. This issue is predominant with catalytic materials of high porosity such as 3D foam and felt-type catalytic electrodes.By optimizing the electrolytic conductivity, the electronic conductivity, the distance between WE and RE, and the thickness of the double-layer, one can greatly minimize the iRu drop. However, it is essentially impossible to completely avoid the iRu drop with controlled-potential operations. Apart from these factors, corroded clips and other heterojunctions with their own interfacial potentials along the circuit also add significant resistance to the charge transfer. This makes the complete elimination of the iRu drop a literally impossible task. Hence, one should learn to correct iRu drop appropriately. As highlighted in Fig. 1, there are ambiguities among researchers in both understanding iRu drop and correcting it. The following sections deal with these problems coherently.
iR u drop correction
Before or after normalizing the activity? or with normalized or as acquired Ru?
Errors in iRu drop correction are usually made when one does not know when it is done and with which it needs to be done. Let's look the first case: mostly, in all energy conversion electrocatalytic reactions, the area of WE is usually less than 1 cm2 and hence, to get the apparent activity, the current response obtained is normalized by the geometrical surface area of the WE.22 Similarly, the values of Ru obtained from electrochemical measurements are usually presented without normalizing by the geometrical area. In such instances, the as-acquired Ru value without normalization is mostly used for iRu drop correction, which is incorrect if the activity is already normalized. This often would result in abnormally corrected iRu drop polarization curves. To show this, a stainless steel OER electrode of area 0.3 cm2 with stabilized activity (through extended potential cycling) is chosen as an example. The Nyquist plot of this electrode with and without geometrical area normalized impedance data points are shown in Fig. 2. It can be seen that after normalization, the Ru value decreased significantly.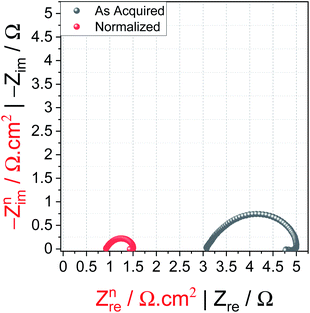 | ||
| Fig. 2 Nyquist plot of the SS electrode (0.3 cm2) acquired at 1.674 V vs. RHE from 100 kHz to 0.1 Hz with (red) and without (black) geometrical area normalization. | ||
Similarly, an LSV for examining the OER activity was also acquired. In Fig. 3a, as acquired activity is presented without normalizing using the geometrical area of the electrode in which the red datapoints are completely (i.e., for 100%) iRu drop corrected and the black ones are not. After the iRu drop correction, the polarization curve is still valid and acceptable because both activity (i.e., current) and Ru were not normalized. In cases where one wishes to use the as-acquired Ru for iRu drop correction, the current should also not be normalized. After making iRu drop correction using as acquired activity and as-acquired Ru, the activity can then be normalized using the geometrical area, as shown in Fig. 3c.
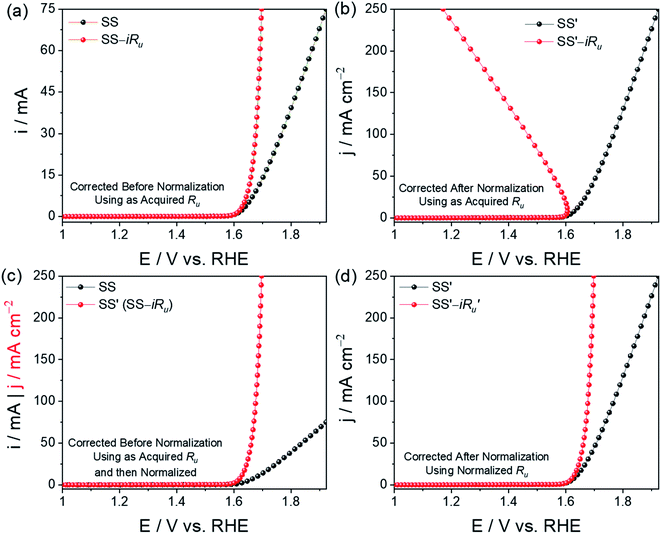 | ||
| Fig. 3 (a–d) LSVs of the SS electrode with (red) and without (black) iRu drop correction following different practices of iRu drop correction. | ||
Fig. 3b shows another instance of error in iRu drop correction, wherein one tries to correct the activity normalized polarization curve with the as-acquired Ru value. Since this type of error results in unacceptably iRu drop corrected LSVs, as shown in Fig. 3b, people often perform partial iRu drop correction in order to avoid this issue. However, this can simply be avoided if one does not use the as-acquired Ru for the iRu drop correction of a normalized polarization curve. As seen from Fig. 3b, such practice would always result in unacceptable polarization curves with huge errors. If the electrode area is 1 cm2 or the activity obtained is already normalized by the system coupled with the workstation, it is essential to normalize the Ru too before it is used for iRu drop correction. If not, the error witnessed in Fig. 3b will be encountered. Fig. 3d shows an acceptably iRu drop-corrected polarization curve when both activity and Ru were normalized with the geometrical area. The correct way of correcting the iRu drop is to either have both activity and Ru be normalized or not. If iRu drop correction is done using the as-acquired activity and as-acquired Ru value, normalization can be done after iRu drop correction without any error.
Performing partial iRu drop correction even when 100% correction is possible!
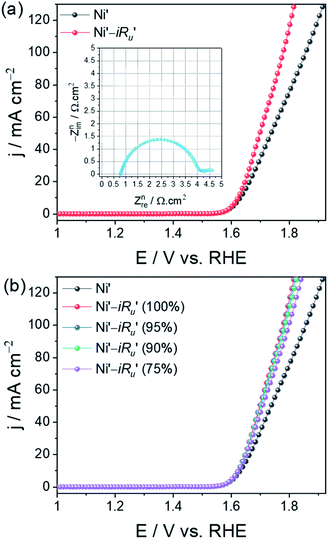
Another error that is very commonly seen in the literature is the partial iRu drop correction even when 100% iRu drop correction is possible with the activity measured and Ru obtained. This has been followed by many without knowing why. In our recent works, we have stressed why partial iRu drop correction is incorrect and up to what extent it could affect the results of Tafel analysis and overpotential determination.14 The idea of iRu drop correction is to report the activity free from the ohmic drop and to ensure that the Tafel analysis is done using completely iRu drop-free potential and current responses. Performing partial iRu drop correction is basically undermining the idea of Tafel analysis. Here, we show how partial iRu drop correction would affect the polarization curve by taking the activity stabilized Ni foam in which both activity and Ru were normalized with their geometrical area (Fig. 4a and b). The inset of Fig. 4a is the normalized Nyquist plot of the Ni foam electrode from which the normalized Ru was taken for iRu drop correction. When the normalized activity is corrected for iRu drop for different percentages of normalized Ru, a change in overpotential can be seen at all current densities. Such changes will largely affect the obtained exchange current density values while using these partially iRu drop-corrected LSVs. Hence, it is always essential to perform 100% iRu drop correction when it is possible.However, one can notice from Fig. 4b that if overpotential determination is what these LSVs are to be used for, an iR drop compensation ranging from 90% (sometimes even 85%) to 100% would be serving the purpose with no issues because the difference in overpotentials among the LSVs corrected for iR drop by 90–100% will be highly negligible.
Challenges in iRu drop correction
Even with the protocols explained above, it may sometimes become impossible to make 100% iRu drop corrections. In those cases, there is no other way than performing partial iRu drop correction or not performing any at all. When either 100% iRu drop correction is not possible or the iRu drop correction is not done at all, one should never use such polarization curves for Tafel analysis.5 For cases like these, we recommend the use of steady-state responses for Tafel analysis. Challenges in 100% iRu drop correction occur when the activity is in the range of hundreds of milliamperes. In such cases, when the normalized Ru is as small as 1 ohm cm2, large errors could occur. For example, consider a catalyst with an onset potential of 1.5 V delivering an activity of 500 mA cm−2 at 1.8 V and possesses a Ru of 1 ohm cm2. The potential at 500 mA cm−2 after 100% iRu drop correction would be 1.3 V, which is 0.2 V lesser than that of the onset potential. This is an unacceptable polarization curve. Similarly, when the value of Ru is higher, even for an electrocatalyst delivering just a few tens of milliamperes of activity, 100% iRu drop correction will be impossible. For example, consider a catalyst with a normalized Ru of 5 ohm cm2 and an onset of 1.5 V, and an activity of 80 mA cm−2 at 1.8 V. The potential at 80 mA cm−2 would be 1.4 V, which is 0.1 V lesser than the onset potential, and hence, is not an acceptable polarization curve. In such cases, it is better to use steady-state responses obtained in a selective potential range for Tafel analysis and use galvanostatic measurements to find iR drop-free activity in which the potential is monitored as a function of applied current instead of not controlled.Fig. 5a shows the normalized Nyquist plot of anodized Cu foam with Ni impurity and Fig. 5b shows the methanol oxidation reaction (MOR) LSVs with different percentages of iRu drop correction.23 This is an example of the first kind mentioned above. This catalyst delivers high activity but also has a relatively higher Ru value. As a result, even a 50% iRu drop compensation results in an unacceptable polarization curve. Hence, one should decide on his/her own discretion whether to correct their polarization curve for iRu drop or not. If not they must opt for other electroanalytical tools (such as steady-state chronoamperometry and chronopotentiometry) that can avoid this issue. If one deems that 100% iRu drop correction is possible for their catalyst with no issues, one should always go for 100% iRu drop correction especially when the same polarization curve is to be used for Tafel analysis.
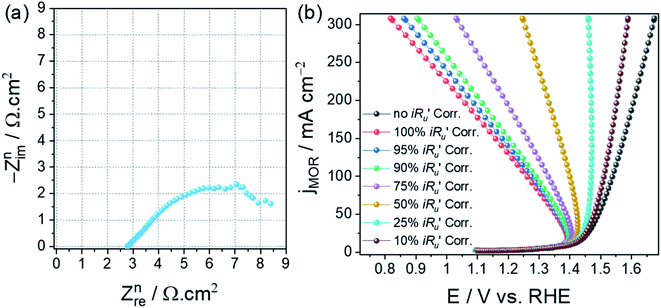 | ||
| Fig. 5 (a) Normalized Nyquist plot of anodized Cu foam containing Ni impurities. (b) MOR LSVs of the same with different percentages of iRu drop correction. Reproduced and modified from our earlier work (ref. 23) (Copyright 2021, American Chemical Society). | ||
Best practices in iRu drop correction
Since iRu drop correction is an essential operation in all controlled-potential electrocatalytic conversions, it is important to ensure that it is done appropriately to avoid the miscalculated data in the literature. There are two instances where mistakes in iRu drop correction can occur: (1) when confused with which (normalized or as acquired data) iRu drop correction is to be done. And (2) performing partial iRu drop correction even when 100% iRu drop correction is possible. The second can be avoided by always remembering to perform 100% iRu drop correction. The first issue can be avoided by using both activity and Ru before or after normalization. When the iRu drop correction is done using the as acquired data, the normalization of activity is to be done afterwards to determine overpotential at benchmarking normalized activity. Scheme 1 shows the correct and incorrect ways of handling normalized and as-acquired activity and Ru data to appropriately perform iRu drop correction.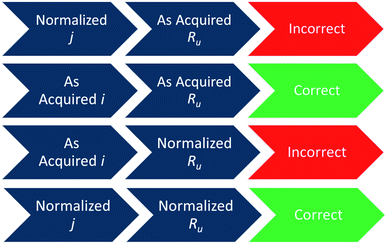 | ||
| Scheme 1 Correct and incorrect ways of handling normalized and as acquired activity and Ru data in iRu drop correction. | ||
Summary
Wherever there is a control of applied potential in an electrolysis process and the response of the interface is monitored in terms of current passing through it, there is always a drop in potential at the interface known familiarly as the iRu drop because of the uncompensated resistance Ru that exists in all DC circuits. Since most of the polarization curves obtained using voltammetric techniques suffer from the iRu drop, it is essential to correct them before they can be inferred and used for further analysis (such as in Tafel analysis). However, there exist several ambiguities in understanding the iRu drop and the practices of correcting it appropriately. This perspective defines what iRu drop is, elaborates the factors influencing iRu drop, highlights common errors made in iRu drop correction, explains existing challenges in iRu drop correction, and also suggests the best practices for performing appropriate iRu drop correction. With the insights provided in this perspective, it is expected that the clouding miscalculated (for iRu drop correction) polarization curves in the literature will be greatly minimized and the accuracy of data in the field of energy conversion electrocatalysis will be improved.Conflicts of interest
There are no conflicts to declare.Acknowledgements
This work was supported by the Grant-in-Aid for Researchers of Research Institute for Science and Engineering, Waseda University, Japan.References
- H. Yang, X. Wang, Q. Hu, X. Chai, X. Ren, Q. Zhang, J. Liu and C. He, Small Methods, 2020, 4, 1900826 CrossRef CAS.
- S. Anantharaj, S. Noda, V. R. R. Jothi, S. C. Yi, M. Driess and P. W. Menezes, Angew. Chem., Int. Ed., 2021, 60, 18981–19006 CrossRef CAS PubMed.
- J. Wang, S. Chen, Z. Li, G. Li and X. Liu, ChemElectroChem, 2020, 7, 1067–1079 CrossRef CAS.
- S. C. Perry, D. Pangotra, L. Vieira, L. I. Csepei, V. Sieber, L. Wang, C. Ponce de León and F. C. Walsh, Nat. Rev. Chem., 2019, 3, 442–458 CrossRef CAS.
- S. Anantharaj, S. R. Ede, K. Karthick, S. Sam Sankar, K. Sangeetha, P. E. Karthik, S. Kundu, E. K. Pitchiah and S. Kundu, Energy Environ. Sci., 2018, 11, 744–771 RSC.
- S. Anantharaj, S. Kundu and S. Noda, J. Electrochem. Soc., 2022, 169, 014508 CrossRef.
- A. J. Bard and L. R. Faulkner, Electrochemical Methods : Fundamentals and Applications, Wiley, 2001 Search PubMed.
- L. Yu and Z. Ren, Mater. Today Phys., 2020, 14, 100253 CrossRef.
- X. Meng, C. Yu, X. Song, J. Iocozzia, J. Hong, M. Rager, H. Jin, S. Wang, L. Huang, J. Qiu and Z. Lin, Angew. Chem., Int. Ed., 2018, 57, 4682–4686 CrossRef CAS PubMed.
- Y. Du, X. Meng, Z. Wang, X. Zhao and J. Qiu, Acta Phys.-Chim. Sin., 2021, 38, 2101009 Search PubMed.
- S. Anantharaj and S. Noda, ChemElectroChem, 2020, 7, 2297–2308 CrossRef CAS.
- J. O. Bockris, A. K. N. Reddy and M. E. Gamboa-Aldeco, Modern Electrochemistry, Plenum Press, 1998 Search PubMed.
- S. Anantharaj, S. R. Ede, K. Sakthikumar, K. Karthick, S. Mishra and S. Kundu, ACS Catal., 2016, 6, 8069–8097 CrossRef CAS.
- S. Anantharaj, S. Noda, M. Driess and P. W. Menezes, ACS Energy Lett., 2021, 6, 1607–1611 CrossRef CAS.
- A. M. Bond, R. G. Compton, D. A. Fiedler, G. Inzelt, H. Kahlert, H. Lohse, M. Lovric, S. K. Lovric, F. Marken, A. Neudeck, U. Retter, F. Scholz and Z. Stojek, Electroanalytical Methods Guide to Experiments and Applications 2nd, revised and extended edition, 2009 Search PubMed.
- M. König, J. Vaes, E. Klemm and D. Pant, iScience, 2019, 19, 135–160 CrossRef PubMed.
- G. Chen, S. Ren, L. Zhang, H. Cheng, Y. Luo, K. Zhu, L. Ding and H. Wang, Small Methods, 2019, 3, 1800337 CrossRef.
- R. Chen, ChemElectroChem, 2019, 6, 603–612 CrossRef CAS.
- F. Zhang, J. Liu, I. Ivanov, M. C. Hatzell, W. Yang, Y. Ahn and B. E. Logan, Biotechnol. Bioeng., 2014, 111, 1931–1939 CrossRef CAS PubMed.
- A. Battistel, M. Fan, J. Stojadinović and F. La Mantia, Electrochim. Acta, 2014, 135, 133–138 CrossRef CAS.
- K. B. Oldham, Electrochem. Commun., 2004, 6, 210–214 CrossRef CAS.
- S. Anantharaj and S. Kundu, ACS Energy Lett., 2019, 4, 1260–1264 CrossRef CAS.
- S. Anantharaj, T. Nagamatsu, S. Yamaoka, M. Li and S. Noda, ACS Appl. Energy Mater., 2021, 5, 419–429 CrossRef.
| This journal is © The Royal Society of Chemistry 2022 |


