Hierarchical trace copper incorporation activated cobalt layered double hydroxide as a highly selective methanol conversion electrocatalyst to realize energy-matched photovoltaic-electrocatalytic formate and hydrogen co-production

Bin Liu *a, Tongyao Xiao a, Xiaoliang Sun a, Hui-Qing Peng a, Xiao Wang a, Yufei Zhao a, Wenjun Zhang *b and Yu-Fei Song *a
aState Key Laboratory of Chemical Resource Engineering, Beijing Advanced Innovation Center for Soft Matter Science and Engineering, Beijing University of Chemical Technology, Beijing 100029, P. R. China. E-mail: binliu@buct.edu.cn; songyf@mail.buct.edu.cn
bCenter of Super-Diamond and Advanced Films (COSDAF), Department of Materials Science and Engineering, City University of Hong Kong, Tat Chee Avenue, Kowloon, Hong Kong, China. E-mail: apwjzh@cityu.edu.hk

Received 10th February 2022 , Accepted 16th March 2022

First published on 16th March 2022


Abstract

Novel hierarchical copper cobalt layered double hydroxide (CuxCoCo-LDH) nanosheet networked with tunable stoichiometry are designed and synthesized for the first time by in situ pseudomorphic transformation of heterometallic CuxCo-MOFs as electrocatalysts for the methanol-oxidation-to-formate reaction (MOFR). The incorporation of trace Cu with a strong Jahn–Teller effect induces collective impacts on the morphology and electronic structure, leading to a superior MOFR performance (i.e., an overpotential of only 50 mV at 10 mA cm−2, and a faradaic efficiency of nearly 100% for formate production). Density functional theory (DFT) reveals that Cu incorporation initiates lattice distortion and charge redistribution and further finely tunes the surface adsorption properties of the catalyst for reactants and intermediates (i.e., Cu doping enhances the adsorption of methanol and weakens the adsorption of formic acid on the catalyst surface). Based on the successful synthesis of high-efficiency MOFR electrocatalysts, we present a valuable approach to optimize the electrolysis voltage through replacing the conventional anodic water oxidation with the thermodynamically more favorable MOFR, and thus realize the energy match between the photovoltaic cell and electrolysis cell, further achieving spontaneous and efficient co-generation of formate and hydrogen.
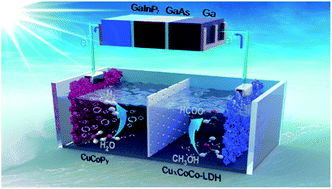

image file: d2ta01104b-p1.tif

Bin Liu

Dr Bin Liu received his PhD from Technical Institute of Physics and Chemistry (TIPC), Chinese Academy of Sciences (CAS), under the supervision of Professor Li-Zhu Wu and Professor Chen-Ho Tung in 2015. From 2015 to 2019, he worked at the Center of Super-Diamond and Advanced Films (COSDAF), and the Department of Materials Science and Engineering, City University of Hong Kong (CityU HK), successively as Senior Research Assistant, Senior Research Associate and Research Fellow. Then he joined State Key Laboratory of Chemical Resource Engineering at Beijing University of Chemical Technology (BUCT) as an associate professor. His research interests include energy electrocatalysis, artificial photosynthesis, and solar photochemical conversion.

1. Introduction

Serious environmental problems and the energy crisis resulting from non-renewable fossil fuels have stimulated global efforts to exploit and utilize clean and sustainable energy.1 Hydrogen (H2) is recognized as a promising alternative due to its zero carbon footprints and high gravimetric energy density.2 Solar water splitting provides a path for sustainably producing hydrogen, in which photovoltaic-electrolysis (PV-EC) systems have shown a higher energy conversion efficiency in comparison with the photo-electrocatalytic (PEC) and photocatalytic (PC) systems in current studies.3–7 To obtain the optimal overall energy efficiency, the energy match between PV and EC plays a pivotal role in achieving optimal energy efficiency of the PV-EC system. That is, the operating point of the PV-EC system should be close to the maximum power point (MPP) of PV, which requires a match between the current–voltage (JV) curve of PV and the JV curve of EC.8,9 For a given PV, the matching can be achieved by tuning the characteristics of the EC part, e.g., by regulating the potential of the anodic oxygen evolution reaction (OER) to adjust the JV curve. In this regard, employing the OER electrocatalysts to reduce the overpotential is a commonly used strategy in the previous reports.10–12 Replacing the OER with reactions with faster reaction kinetics can also shift the JV curve of EC, thereby matching the JV curve of PV, yet which is seldom reported.

Utilizing the upgrading reactions of organic molecules to replace the OER is a win–win strategy for the PV-EC approach. This is because the unique combination can not only avoid the large overpotential of the OER to regulate the JV curve at the EC side,13,14 but also produce more valuable liquid chemicals than oxygen ($ 4–9 per ton).15 Among the organic molecules, methanol is the simplest monohydric alcohol mainly derived from the coal chemical industry. Owing to its massive production and low cost (∼$ 350 per ton), methanol has been employed as a general platform for various molecule syntheses of chemicals.16,17 For example, one of its partial oxidation products, formic acid, is an important industrial intermediate that can be used in diverse fields of the chemical industry.18–20 Currently, industrial production of formic acid is mainly based on an energy-intensive high-pressure process (>4.0 MPa).21 The large energy consumption in the synthesis and the great market demand give rise to a high price of formic acid (∼$ 1285 per ton), about fourfold higher than that of methanol.22

Oxidizing methanol by electrocatalysis provides a sound approach for producing formic acid.23–25 As the methanol oxidation is employed at the anode in water electrolysis, high value-added formic acid can be produced, and hydrogen also can be simultaneously generated with an obviously reduced energy consumption owing to the significantly lower equilibrium potential for oxidizing methanol to formic acid (0.103 V vs. the standard hydrogen electrode (SHE)) than that of the OER (1.23 V vs. SHE). Moreover, it is easy to separate the anodic and cathodic products with no need of any membrane, greatly simplifying the electrolysis system. In the electrosynthesis of formic acid from methanol, the key lies in controlling the oxidation degree of methanol.26,27 A considerable fraction of electrocatalysts developed thus far enables complete oxidation of methanol to form CO2, endangering the environment.28,29 It is still challenging to construct efficient and robust electrocatalysts to achieve the methanol oxidation to formate reaction (MOFR) with high selectivity at a low potential. To date, some electrocatalysts have been developed which exhibit decent catalytic activity for the electrooxidation of methanol to formate (the formed formic acid is in situ converted to formate in alkaline electrolysis), mainly including nickel-based catalysts (e.g., branched Ni3C,30 FeCoNi disulfide nanosheets,31 Ni(OH)2/NF,32 NiCoPO,33 and Pt-NP/NiO-NS (ref. 34)) and Co-based catalysts (e.g., Co(OH)2@HOS,35 Pt–Co3O4,36 and Cu2Se/Co3Se4 (ref. 37)). However, their performances for methanol oxidation to formate (e.g., the electrochemical potentials and stabilities) still need to be improved for practical applications. In addition, to the best of our knowledge and from the available literature data, optimization of the electrochemical methanol oxidation reaction at the EC side to match the photovoltaic device to achieve energy-matched solar-driven spontaneous hydrogen and formate co-production is not reported thus far.

In this work, we incorporate Cu2+ into cobalt layered double hydroxide (CoCo-LDH) to synthesize novel MOFR electrocatalysts (hierarchical CuxCoCo-LDH nanosheet networks) through in situ pseudomorphic transformation from the as-prepared heterometallic CuxCo-MOFs (Fig. 1a). Due to the specific d orbitals (t62ge3g) of Cu2+, the concomitant strong Jahn–Teller effect will affect the local atomic arrangement and the electron interaction between atoms of the original CoCo-LDH, further tailoring the electronic structure and even the morphology. Therefore, the overpotential of the MOFR is optimized to be only 50 mV on Cu0.33CoCo-LDH with appropriate Cu doping. Meanwhile, the selectivity for formate production is significantly elevated (a faradaic efficiency of nearly 100%). Furthermore, density functional theory (DFT) is applied to study the influence mechanism of Cu incorporation on the high-efficiency MOFR activity of Cu0.33CoCo-LDH. The calculations indicate that Cu incorporation disturbs the original lattice structure of CoCo-LDH, resulting in the lattice distortion and charge redistribution, and meanwhile increases the density of states near the Fermi level, leading to higher electroconductibility of Cu0.33CoCo-LDH. Moreover, the specific electronic structure of Cu0.33CoCo-LDH induced by substitutional copper doping at an optimal level enhances the adsorption for methanol and weakens the adsorption for formic acid on the catalyst surface, thus achieving the high-selectivity electrooxidation of methanol to formic acid. Further, we introduce for the first time the MOFR reaction in a PV-EC device using the Cu0.33CoCo-LDH as an anode powered by a III–V triple-junction photovoltaic cell. Such replacement significantly regulates the operating point of the PV-EC system to be close to the MPP, achieving energy-matched spontaneous and efficient co-generation of formate and H2.


image file: d2ta01104b-f1.tif
Fig. 1 (a) Schematic illustration of the fabrication of CuxCoCo-LDHs/CFs (x = 0.25, 0.33, 0.50); the XRD patterns of the prepared (b) Co-MOF/CF and CuxCo-MOFs/CFs (x = 0.25, 0.33, 0.50), and (c) Co(OH)2/CF and CuxCoCo-LDHs/CFs (x = 0.25, 0.33, 0.50).

2. Experimental section

2.1. Materials synthesis

2.1.1 Synthesis of CuxCo-MOFs/CFs. Prior to the synthesis, the carbon fibers (CFs) were placed in a mixture of deionized water and concentrated HNO3, which then was transferred into a 100 mL Teflon-lined autoclave for the treatment at 140 °C for 5 h. The CFs were taken out when the Teflon-lined autoclave cooled down to room temperature, and then washed with deionized water and ethanol, respectively. CuxCo-MOF nanosheet arrays with different Cu/Co molar ratios were synthesized on CFs via room temperature liquid synthesis. In a typical synthesis, Co(NO3)2·6H2O and Cu(NO3)2·3H2O with different mole ratios of Cu/Co (0, 0.25, 0.33, and 0.50) at a constant total metal ion mole number of 2.0 mmol were dissolved in 40 mL distilled water under stirring to form a clear solution. An aqueous solution containing 2-methylimidazole (16 mmol) was poured into the above solution. Subsequently, a piece of the pre-treated CFs (2 cm × 3 cm) was immersed in the solution mixture, followed by stirring for 40 minutes and then resting for 2 h at room temperature. A purple film grew on the CF, which was washed with distilled water and ethanol several times and dried at room temperature.
2.1.2 Synthesis of CuxCoCo-LDHs/CFs. The as-synthesized CuxCo-MOFs/CFs were placed in the mixed solution of 40 mL ethanol and 10 mL deionized water, and heated at 85 °C for 1.5 h.
2.1.3 Synthesis of CuCoPy/CF. The CuCoPy/CF was obtained by phosphating the Cu0.33CoCo-LDH/CF in a tube oven with NaH2PO2 (0.5 g) as the phosphorus source in a N2 atmosphere at 300 °C for 2 h with a slow ramp rate of 2 °C min−1.

2.2. Structural characterization

X-ray diffraction (XRD) patterns of the samples were obtained by X-ray diffraction spectroscopy (Shimadzu, XRD-6000). Morphology structures were characterized by scanning electron microscopy (SEM, Carl Zeiss AG, Supra 55) and transmission electron microscopy (TEM, JEOL, JEM-2100). Fourier transform infrared spectra (FTIR) were collected by using a Fourier transform infrared spectrometer (Thermo Electron, Nicolet 380). In situ Raman spectroscopy was performed by using a Raman spectrometer (HORIBA Jobin Yvon S.A.S, LabRAM Aramis). Element content was determined by inductively coupled plasma mass spectrometry (ICP-MS, Shimadzu, ICPMS-2030). The chemical composition and valence spectra of the samples were analyzed by X-ray photoelectron spectroscopy (XPS, THERMO VG, Escalab 250). The ultraviolet and visible (UV-Vis) diffuse reflectance spectra were collected on an ultraviolet and visible spectrophotometer (CRAIC, 20/30 PV). The liquid electrolysis products were analyzed by using a 400 M nuclear magnetic resonance spectrometer (NMR, Bruker, AVANCE III HD 400). Hydrogen was detected using gas chromatography (GC, Shimadzu, GC-2014C).

2.3. Electrochemical measurements

The electrochemical performance of all samples was tested on an electrochemical workstation (CHI760E, Shanghai, China) using a three-electrode system, where a Pt electrode (2 cm × 2 cm) was used as the counter electrode, a saturated calomel electrode (SCE) was used as the reference electrode, and the fabricated sample electrode was used as the working electrode. Linear sweep voltammetry (LSV) tests of the hydrogen evolution reaction (HER), OER, and MOFR were carried out in 1 mol L−1 KOH or 1 mol L−1 KOH + 3 mol L−1 CH3OH electrolyte. The CV curves, which were used to calculate the double-layer capacitances (Cdl), were tested at 1.10–1.15 V vs. RHE at different scan speeds to estimate the electrochemically active specific surface area of the electrocatalyst. The two-electrode measurements were carried out using Cu0.33CoCo-LDH/CF and CuCoPy/CF as the anode and cathode, respectively, in 1 mol L−1 KOH or 1 mol L−1 KOH + 3 mol L−1 CH3OH electrolyte. For solar powered hydrogen and formate co-production, a III–V triple-junction solar cell (GaInP2/GaAs/Ge) was employed to supply the energy of the electrochemical module comprising the Cu0.33CoCo-LDH/CF anode and CuCoPy/CF cathode.

The generated formate ion at the anode side was detected by NMR with dimethyl sulfoxide (DMSO) as an internal standard. The generated H2 at the cathode side was measured by GC. The faradaic efficiency (FE) of formate and H2 can be obtained using the following equation: FE= (n × z × F)/Q × 100%, where n is the number of moles of the generated formate ion or H2; z is the number of electrons transferred to correspondingly produce 1 mole of formate ions or H2, which is 4.0 for the MOFR or 2.0 for the HER, respectively; F is the Faraday constant of 96[thin space (1/6-em)]485 C mol−1; Q is the charge passing through the circuit during electrolysis. When the MOFR replaces the OER, the energy saved can be calculated according to the following equation: W = (V2V1) × I × t, where V2 is the potential at a certain current density for the OER, V1 is the corresponding potential at the same current density for the MOFR, I is current density, and t is time. The corresponding energy consumption (η) can be obtained from (V2V1)/V2 × 100%.35

2.4. DFT calculation method

Two models were constructed and named CoCo-LDH and CuCoCo-LDH, respectively.

CoCo-LDH was built with the space group of R[3 with combining macron]m. The lattice parameters were α = β = 90° and γ = 120°, and a, b, and c referred to the experimental X-ray diffraction measurement. The supercell of CoCo-LDH is 1 × 1 × 1 in the a-, b-, and c-directions. A carbonate anion was placed into the interlayer space of CoCo-LDH to balance the positive charge of the LDH matrix. In our previous work, the (003) facet of LDH had been calculated to be a preferentially exposed surface because of its smallest surface energy. Therefore, the (003) facet of CoCo-LDH was selected as the adsorption interface for the reaction intermediates. Then, the model CoCo-LDH was built by cleaving the (003) facet of CoCo-LDH, containing 1 bilayer of the LDH matrix and an interlayer carbonate anion.

The calculations in this work were performed using the CASTEP code in the Materials Studio software package.38 The spin-polarized DFT+U calculations were carried out using a plane wave implementation with the generalized gradient approximation (GGA) Perdew–Burke–Ernzerhof (PBE) as the exchange correlation functional.39,40 Hubbard correction was applied for the first-row transition-metal, Co. The value of UJ (Ueff) for Co, referring to the unrestricted Hartree–Fock theory calculations, was 2.5 eV.41 The DFT dispersion correction was dealt with the Tkatchenko–Scheffler method to describe the weak interaction such as hydrogen bonding and van der Waals forces.42 The ultrasoft pseudopotentials were applied to describe the ionic cores to enhance transferability and reduce the number of plane waves required in the expansion of the Kohn–Sham orbitals according to previous work.43 The potential energy surface was searched with the Broyden–Fletcher–Goldfarb–Shanno (BFGS) algorithm. The cutoff energy was set at 380 eV to balance the cost and effectiveness.44,45 The geometry optimization was based on the following points: (1) an energy tolerance of 1.0 × 10⁻⁵ eV per atom, (2) a maximum displacement tolerance of 1.0 × 10⁻³ Å, and (3) a maximum force tolerance of 0.1 eV Å−1. A Fermi smearing of 0.1 eV and Pulay mixing were used to ensure the fast convergence of the self-consistent field iterations. When calculating the density of states, the Γ-point-centered k-point meshes for the Brillouin zone integrations were 1 × 1 × 1 in the a-, b-, and c-directions.

3. Results and discussion

3.1. Structure and morphology of catalysts

CuxCoCo-LDHs/CFs were synthesized facilely by the growth of CuxCo-MOFs on conductive carbon fibers through room-temperature liquid deposition, followed by a pseudomorphic transformation of CuxCo-MOFs (Fig. 1a). The bare Co-MOF first grew on CFs using cobalt salt and 2-methylimidazole as the metal center and ligand, respectively, and its XRD result shows a typical pattern of the ZIF-L structure (Fig. 1b).46 After adding various amounts of Cu salts (the molar ratios of Cu/Co gradually increases to 0.25, 0.33, and 0.50) in the reaction system, the obtained samples display the same XRD patterns as those of Co-MOF, without the appearance of XRD characteristics of the individual Cu-MOF (Fig. S1). Evidently, the Cu was incorporated into the crystalline lattice of Co-MOFs, forming the bimetal CuxCo-MOFs. The SEM images of Co-MOF/CF show that vertical and well-interconnected nanosheet arrays compactly and uniformly covered the skeleton of carbon fibers, and the representative Co-MOF nanosheets are 1.5–3.0 μm in lateral size and 200–400 nm in thicknesses (Fig. S2a and b). With the addition of Cu and increase of its content, CuxCo-MOF nanosheets present gradually decreased thickness but nearly unchanged lateral sizes (Fig. S2c–h). The as-prepared series of MOFs were used to produce the LDHs via refluxing in ethanol solution. Fig. 1c presents the XRD patterns of the obtained samples after refluxing. It is revealed that Co-MOF is converted to Co(OH)2 (JCPDS no. 01-074-1057),47 while the CuxCo-MOFs are transformed into CuxCoCo-LDHs without residual MOFs. The SEM images show that the morphology of vertical and interconnected nanosheet arrays for all samples is well-retained after reactions with the assistance of MOF templates (Fig. 2). Interestingly, different from the morphology of LDHs prepared by other methods (such as coprecipitation, electrodeposition, and hydrothermal growth),48–50 that of LDHs formed by the pseudomorphic transformation of MOFs shows a hierarchical structure composed of many interconnected large nanosheets assembled by numerous small ones with similar thickness. In addition, because the Jahn–Teller distortion of Cu2+ destabilizes the octahedral lattice structure and thus affects the nucleation and growth orientation, CuxCoCo-LDH nanosheets become curly compared to Co(OH)2 nanosheets with the upright state, making LDHs more loose and open. The unique hierarchical architecture provides abundant exposed active sites for catalysis, and meanwhile facilitates the mass transfer of the electrolyte and liquid products. The above results verify the successful synthesis of hierarchical CuxCoCo-LDH through the pseudomorphic transformation of CuxCo-MOFs, in which the chemical components of the host MOF change to form a new LDH phase, while the host shape structures are well-preserved. During the synthesis, the coordination bonds between the metal ions and ligating atoms in CuxCo-MOFs were first broken to release Cu2+ and Co2+,51 and meanwhile, 2-methylimidazole was hydrolyzed to produce OH.52 Then the Cu2+, Co2+, Co3+ (from the oxidation of Co2+ with O2 in the ethanol solution), and OH formed laminates of LDH. For balancing the positive charges of laminates, CO32− ions (generated by the CO2 in air dissolved in ethanol solution) were intercalated between the two laminates as anions (see the FTIR result analysis in Fig. S3).53,54 ICP-MS was used to investigate the factual metal contents in the synthesized CuxCo-MOFs and CuxCoCo-LDHs, with the results shown in Table S1. The Cu/Co molar ratios in the CuxCo-MOFs are the appropriate half of the original feed ratios, indicating slower kinetics of Cu2+ inserting into the crystalline structure of MOFs than that of Co2+. Further, the Cu/Co molar ratios sharply decrease in CuxCoCo-LDHs. Taking a Cu/Co feed molar ratio of 0.33 as an example, the Cu/Co molar ratio is 0.16 in the MOF but obviously reduces to 0.08 in LDH. The results suggest that only a very small quantity of Cu2+ was involved in the formation of LDH, which might be caused by the strong Jahn–Teller effect of Cu2+.55 The Jahn–Teller effect of Cu2+ results in the formation of distorted Cu–O octahedra in an unstable state, thus making Cu difficult to enter the LDH laminate.
image file: d2ta01104b-f2.tif
Fig. 2 The SEM images of (a1–a3) Co(OH)2/CF; (b1–b3) Cu0.25CoCo-LDH/CF; (c1–c3) Cu0.33CoCo-LDH/CF; (d1–d3) Cu0.50CoCo-LDH/CF.

High-resolution transmission electron microscopy (HRTEM) was further employed to study the microstructure of the Cu0.33CoCo-LDH, considering the best presentation of Cu0.33CoCo-LDH in electrocatalytic activity. As shown in Fig. S4a, Cu0.33CoCo-LDH nanosheets with a lateral size of ∼50 nm constitute a large multilevel-structure hydrotalcite sheet, consistent with the SEM observation. Further, the magnified image presents the ultrathin LDH nanosheets of less than 2 nm (corresponding to a stacking of two-layer laminates, Fig. 3a). The more detailed HRTEM image and the corresponding fast Fourier transform (FFT) pattern indicate the (015) lattice plane of the LDH structure with an interplanar crystal distance of 0.234 nm (Fig. 3b). The surface chemical states of Cu0.33CoCo-LDH/CF were characterized by XPS. In the high-resolution spectrum of Co (Fig. 3c), two main representative peaks at 781.3 eV and 796.9 eV, followed by respective satellite peaks at 786.0 eV and 802.5 eV, can be assigned to Co 2p3/2 and Co 2p1/2, respectively. Further deconvolution identifies that Co2+ and Co3+ are coexistent in Cu0.33CoCo-LDH,56 and the ratio Co2+/Co3+ is estimated to be 2.15, which is higher than that in CoCo-LDH (1.17, Fig. S5).57 This verifies that the low-valence Co2+ species increases after introducing Cu, indicating the impact of Cu ions on the electronic structure of original Co ions. In the high-resolution Cu 2p XPS spectrum (Fig. 3d), two typical main peaks at 934.5 eV and 953.7 eV are observed, which can be attributed to 2p3/2 and 2p1/2 of Cu2+, respectively, in Cu0.33CoCo-LDH.58 The O 1s XPS spectra (Fig. S4b) can be divided into two peaks at 531.5 eV and 533.2 eV, which are associated with the metal–OH and the absorbed water, respectively, consistent with the previous reports on LDH.59 XPS valence-band spectra were collected to further investigate the electronic properties of CoCo-LDH before and after Cu introduction, shown in Fig. 3e. The valence band maximum (VBM) is determined to be ≈0.83 eV for Cu0.33CoCo-LDH and 0.43 eV for CoCo-LDH. Considering d orbital’s main contribution at the Fermi level, the shift of the valence band illustrates that the d-band of Cu0.33CoCo-LDH also shifts compared to that of CoCo-LDH, which may lead to a decent binding interaction between the catalyst and adsorbates, thus contributing to the catalytic activity.60 Further, in UV-vis absorbance spectroscopy measurement, pristine CoCo-LDH shows a broad peak around 260–410 nm due to the charge transfer from O to Co ions and a broad peak located in the regions around 600–750 nm, attributed to d–d transitions of Co ions.61 The corresponding absorption peaks in the Cu0.33CoCo-LDH show an obvious shift, verifying that the Cu doping induces strong electronic interaction (Fig. 3f), which is consistent with the XPS and valence band spectra results.62


image file: d2ta01104b-f3.tif
Fig. 3 (a and b) The HRTEM images and FFT pattern of Cu0.33CoCo-LDH. (c and d) High-resolution XPS spectra of the Cu0.33CoCo-LDH: (c) Co 2p; (d) Cu 2p; (e and f) Valence band spectra of XPS and UV-Vis diffuse reflectance spectra of the Cu0.33CoCo-LDH and CoCo-LDH.

3.2. Evaluation of the electrocatalytic activity

The obtained self-standing electrocatalysts can be directly used as the integrated electrodes for electrochemical tests. Fig. 4a shows the LSV curves of Cu0.33CoCo-LDH/CF in 1.0 M KOH with and without 3.0 M CH3OH. Without methanol, the potentials delivering current densities of 10 and 50 mA cm−2 on Cu0.33CoCo-LDH/CF are 1.55 V and 1.61 V, respectively, suggesting the mediocre electrocatalytic OER activity. In contrast, after adding methanol into the electrolyte, the potential is significantly reduced, e.g., the potential at 10 mA cm−2 is substantially reduced to 1.28 V (a negative shift of 270 mV) (Fig. 4a). In this case, we assumed that the electrode ran at a current density of 10 mA cm−2 for one hour with a FE of 100% for cathodic H2 production in KOH solution with or without CH3OH. Then an energy of 9.72 J cm−2 can be saved, and the corresponding energy consumption saving reaches 17.4%, demonstrating the efficiency of the methanol-to-formate oxidation reaction instead of the OER to reduce the energy consumption. Fig. 4b shows the LSV curves of CuxCoCo-LDHs with different Cu doping contents in KOH with CH3OH. It is revealed that all the Cu doped CoCo-LDHs/CFs exhibit lower potential than pure CoCo-LDH/CF at the same current density, suggesting that Cu incorporation can indeed enhance the electrochemical activity of methanol oxidation. Particularly, the Cu0.33CoCo-LDH/CF electrode exhibits the highest activity among the CuxCoCo-LDHs/CFs. Specifically, for current densities of 20, 50, and 100 mA cm−2, the needed potentials on Cu0.33CoCo-LDH/CF are 1.31 V, 1.34 V, and 1.36 V, respectively (Fig. 4c), all of which are smaller than the corresponding potentials of other CuxCoCo-LDHs/CFs. Meanwhile, the overall performance of Cu0.33CoCo-LDH/CF is among the best electrocatalysts for the MOFR including noble and non-noble metal based electrocatalysts (Table S2). In addition, the Tafel slops of the electrodes were calculated, as shown in Fig. 4d. It can be seen that the Tafel slope of Cu0.33CoCo-LDH/CF is 67.8 mV dec−1, obviously smaller than those of other samples. Because the Tafel slope is directly associated with the reaction kinetics of electrocatalysts,63 the lower Tafel slope of Cu0.33CoCo-LDH/CF implies its faster kinetics and higher catalytic activity for methanol oxidation than those of other samples, which coincides with the observations of the largest electrochemically active surface area (Fig. 4e) (based on the electrochemical double-layer capacitance measurements as shown in Fig. S6) and the smallest charge-transfer resistance (Fig. 4f).
image file: d2ta01104b-f4.tif
Fig. 4 (a) The polarization curves of Cu0.33CoCo-LDH/CF in 1 M KOH or 1 M KOH + 3 M CH3OH solution; (b) polarization curves of CuxCoCo-LDHs/CFs (x = 0, 0.25, 0.33, 0.50) in 1 M KOH + 3 M CH3OH solution: (c) the comparison of potentials at 20, 50 and 100 mA cm−2 of CuxCoCo-LDHs/CFs (x = 0, 0.25, 0.33, 0.50); (d) Tafel slopes, (e) double-layer capacitors, and (f) impedance diagrams of CuxCoCo-LDHs/CFs (x = 0, 0.25, 0.33, 0.50).

To trace the anodic and cathodic products, continuous electrolysis was performed at a constant potential of 1.35 V for 1 h. The generated nongaseous substances at the anode were detected by 1H NMR and 13C NMR,36,64 and the results are presented in Fig. 5a and S7a. Evidently, the value-added formate ion is detected at a chemical shift of 8.33 in 1H NMR and 170.82 in 13C NMR, and the yield rate of formate is calculated to be 0.47 mmol h−1 cm−2 with a corresponding FE of about 99% according to the standard curve (Fig. 5b and S7b), which elucidates the prominently high selectivity for the conversion of methanol to formic acid at the anode by the Cu0.33CoCo-LDH/CF electrode. The product at the cathode is quantitated by GC, and the results are shown in Fig. 5b. The yield rate of hydrogen is 0.95 mmol h−1 cm−2, twofold than that of formate at the anode, close to a theoretical rate ratio of 2[thin space (1/6-em)]:[thin space (1/6-em)]1 (hydrogen[thin space (1/6-em)]:[thin space (1/6-em)]formate). Additionally, the amount of generated H2 matches well with the theoretical values as a function of passed charges, reaching a FE of 99%. More importantly, the electrocatalytic methanol upgrading can greatly boost the H2 production in the cathode compartment. As shown in Fig. 5c, the generation rate of H2 has a low value of 0.048 mmol h−1 cm−2 after electrolysis at 1.35 V for 2 h from the cathode compartment without methanol added into the anode compartment, accompanied by a FE of 91.1%. Remarkably, the generation rate of H2 is only one twentieth of that in the presence of methanol. Moreover, the yield rates and FEs of formate at different potentials on Cu0.33CoCo-LDH/CF are much superior to those on CoCo-LDH/CF (Fig. 5d), which proves the profound effect of Cu incorporation on MOFR activity and selectivity. Fig. 5e shows the cycling test results of the Cu0.33CoCo-LDH/CF electrode under an applied potential of 1.35 V with an electrolysis time of 2 h for each cycle. For both formate and hydrogen, no obvious change in the yield rate and FE was revealed under the given experimental conditions. Moreover, the chronopotentiometry measurement shows that the Cu0.33CoCo-LDH/CF electrode can stably run in the 24 h electrolysis (Fig. 5f). The above results highlight the outstanding stability of the electrode. Besides, during long-term electrolysis, no bubble could be observed at the anode since formate was the only product without O2 or CO2 evolution, while numerous hydrogen bubbles were evolved at the cathode (Fig. 5f). It is further identified that the electrode can realize simultaneous hydrogen evolution and highly selective oxidation of methanol to produce value-added formate.


image file: d2ta01104b-f5.tif
Fig. 5 (a) 1H NMR spectrum of the electrolyte after the electrochemical test at 1.35 V for 1 h on Cu0.33CoCo-LDH/CF in 1 M KOH + 3 M CH3OH solution; (b) comparison of the faradaic efficiency and yield rate for formate and H2 on Cu0.33CoCo-LDH/CF; (c) comparison of the faradaic efficiency and yield rate of H2 on Cu0.33CoCo-LDH/CF in KOH solution with CH3OH and without CH3OH at the anode compartment; (d) comparison of the faradaic efficiency and yield rate for formate on Cu0.33CoCo-LDH/CF and CoCo-LDH/CF at different potentials; (e) faradaic efficiency and the yield rate for formate and H2 during the cycling test; (f) chronopotentiometry curve of Cu0.33CoCo-LDH/CF in 1 M KOH + 3 M CH3OH solution at 20 mA cm−2, and the digital photos of the anode and the cathode during electrolysis.

3.3. Origination of the catalytic activity

DFT calculations were further performed to clarify the origins of the high activity and selectivity of methanol conversion to formate after incorporating Cu into CoCo-LDH. Fig. 6a and b show the optimized structures of CoCo-LDH and CuCoCo-LDH. It can be found that the bond length of Co–O in pristine CoCo-LDH is 2.07 Å. After Cu doping, the bond length of newly formed Cu–O in CuCoCo-LDH is 2.19 Å, while that of Co–O decreases to 1.97 Å. This indicates that the introduction of Cu disturbs the original lattice structure of CoCo-LDH, resulting in the lattice distortion due to the strong Jahn–Teller effect of Cu. The lattice distortion is also reflected by CoO6 octahedral models of CoCo-LDH and CoO6 and CuO6 octahedral models of CuCoCo-LDH, where the obvious distortions can be observed for CuCoCo-LDH. It is rational to imply that the lattice distortion might result in the charge redistribution in lattices, and thus the charge density distribution of CoCo-LDH and CuCoCo-LDH was calculated (Fig. 6c and d). It is revealed that the electron density of Co atoms around Cu atoms substantially increases in CuCoCo-LDH in comparison with that of CoCo-LDH, which is consistent with the increase of Co2+/Co3+ revealed by the XPS measurements. The density-of-states (DOS) functions of CoCo-LDH and CuCoCo-LDH were further calculated, as presented in Fig. 6e and f. The DOS of CuCoCo-LDH near the Fermi level increases in comparison with that of CoCo-LDH, indicating that the Cu introduction leads to higher electroconductibility and charge transfer capability of CuCoCo-LDH. The electron would be fastly transmitted from the reactants and intermediates to the active sites during electrochemical reactions, which agrees well with the electrochemical impedance spectroscopy (EIS) measurements.
image file: d2ta01104b-f6.tif
Fig. 6 (a and b) The DFT optimized structure models of CoCo-LDH and CuCoCo-LDH; (c and d) the calculated charge density distribution of CoCo-LDH and CuCoCo-LDH; (e and f) the DOS functions of CoCo-LDH and CuCoCo-LDH; (g) the calculated adsorption energy of methanol and formic acid molecules on the surfaces of CoCo-LDH and CuCoCo-LDH; (h) the schematic process of transformation of CH3OH molecules into HCOOH instead of CO2 on the surface of CuCoCo-LDH.

For the methanol electrooxidation, the adsorption of the CH3OH molecule is the first step, which plays a pivotal role in the subsequent electrooxidation process. Hence the adsorption energies of the CH3OH molecule on the surface of CoCo-LDH with and without Cu incorporation were calculated, as shown in Fig. 6g. Apparently, the methanol adsorption energy value (−0.99 eV) at CuCoCo-LDH is more negative than that at CoCo-LDH (−0.25 eV), which ensures the more effective methanol adsorption and subsequent activation on the CuCoCo-LDH, benefitting from the ameliorative electron structure of Cu incorporation. The electrooxidation of CH3OH generally undergoes a multiple-step dehydrogenation to form the adsorbed HCOOH intermediate on the catalyst surface.37 The surface adsorption behavior of the HCOOH intermediate is closely related to the final products of methanol electrooxidation. Stronger surface adsorption might result in the further oxidation of HCOOH to generate CO2, while relatively weak surface adsorption is favorable for the timely desorption on the catalyst surface to produce HCOOH. Therefore, the adsorption energy of HCOOH on the catalyst surface was calculated, as shown in Fig. 6g. The adsorption energy of HCOOH on the CoCo-LDH surface is −1.03 eV, while for the CuCoCo-LDH, the corresponding value is strikingly decreased to −0.023 eV, which indicates that the adsorbed HCOOH on the CuCoCo-LDH surface could be quickly desorbed. The quick release of adsorbed HCOOH on the one hand avoids the over-oxidation of methanol, thereby leading to the high selectivity of HCOOH, and on the other hand, allows continual exposing of active sites to the electrolyte for further methanol oxidation (Fig. 6h).

3.4. Detection of structure evolution of the catalyst

Then the morphology and structure changes of the Cu0.33CoCo-LDH/CF electrode were investigated after long-term electrolysis in 1 M KOH + 3 M CH3OH. The SEM images show that the nanosheet arrays after electrolysis become sparse and more distorted compared to the original ones (Fig. S8a and b). In the XRD pattern, new diffraction peaks belonging to CuCoOOH appear, while those of Cu0.33CoCo-LDH disappear (Fig. S8c), indicating that Cu0.33CoCo-LDH is oxidized to form CuCoOOH during the electrolysis.65 The high-resolution XPS spectrum of Co in the sample after electrolysis shows the dramatic decrease of the Co2+/Co3+ molar ratio from 2.15 to 0.802 due to the oxidation of Co2+ in LDH to Co3+ in CuCoOOH (Fig. S9a). In addition, the high-resolution XPS spectrum of Cu 2p indicates the divalent Cu in CuCoOOH (Fig. S9b). In situ electrochemical Raman spectroscopy was utilized to further study the structure evolution of Cu0.33CoCo-LDH in the MOFR process (Fig. 7a). Fig. 7b shows the in situ Raman spectra of the Cu0.33CoCo-LDH/CF electrode obtained under various applied potentials. When no potential is applied to the electrode, the Raman spectrum shows two representative characteristic absorption bands of LDH at 462 and 526 cm−1.66 When the applied anodic potential is below 1.10 V, the Raman bands verify that the phase is still Cu0.33CoCo-LDH. Upon increasing the anodic potential to 1.20 and 1.35 V, the Raman bands at 462 and 526 cm−1 disappear, while three new peaks appear at 466, 513 and 667 cm−1, assigned to the phase of CuCoOOH.67 This proves the transformation from Cu0.33CoCo-LDH into CuCoOOH in the electrocatalytic MOFR process. In addition, the Raman bands are recovered when the potential is back to 1.10 V again, indicating that the Cu0.33CoCo-LDH undergoes a reversible structure evolution. The reversible transformation and recovery between LDH and oxyhydroxide can be described as follows, shown in eqn (1), (2) and Fig. 7c.
 
CuCoCo-LDH(s) + OH(aq) → CuCoOOH(s) + H2O(l)(1)
 
CuCoOOH(s) + CH3OH(aq) → CuCoCo-LDH(s) + HCOO(aq)(2)

image file: d2ta01104b-f7.tif
Fig. 7 (a) The schematic picture of the in situ Raman system used in this work; (b) in situ Raman spectra of the Cu0.33CoCo-LDH catalyst obtained after holding for 2 min at each potential; (c) the schematic diagram of the structure evolution of Cu0.33CoCo-LDH under various potentials.

3.5. Evaluation of the PV-EC system performance

To construct a two-electrode electrolyzer with the non-noble metal-based electrodes, Cu0.33CoCo-LDH/CF was subjected to phosphating treatment to fabricate the CuCoPy/CF cathode for catalyzing the hydrogen evolution reaction (the XRD pattern and SEM images of CuCoPy/CF are presented in Fig. S10a–d).Fig. 8a shows the LSV curves of CuCoPy/CF and Cu0.33CoCo-LDH/CF electrodes in 1 M KOH + 3 M CH3OH solution. To reach a current density of 50 mA cm−2, Cu0.33CoCo-LDH/CF needs an overpotential of 348 mV, while the CuCoPy/CF electrode only needs 215 mV, suggesting a good HER activity of CuCoPy/CF. Based on the remarkable performances of the Cu0.33CoCo-LDH/CF and CuCoPy/CF in the respective anodic MOFR and cathodic HER, they were employed to equip a two-electrode electrolyzer for co-production of formate and hydrogen. Fig. 8b shows the LSV curves of the two-electrode electrolyzer in 1 M KOH with and without CH3OH solution. For a current density of 10 mA cm−2, the potential of the HER‖MOFR is 1.38 V, whereas the corresponding value of the HER‖OER is 1.68 V. The substantially reduced potential suggests the merit of energy-efficiency using the MOFR to replace the OER. In addition, for the electrolysis in the two-electrode electrolyzer, similar to the aforementioned three-electrode system, no bubble was produced at the Cu0.33CoCo-LDH/CF anode, while hydrogen bubbles were released at the CuCoPy/CF cathode (Movie S1 and S2).
image file: d2ta01104b-f8.tif
Fig. 8 (a) LSV curves of CuCoPy/CF and Cu0.33CoCo-LDH/CF in 1 M KOH + 3 M CH3OH for the HER test; (b) LSV curves of the CuCoPy/CF‖Cu0.33CoCo-LDH/CF two-electrode system in 1 M KOH with and without CH3OH; (c) the schematic diagram of the PV-EC system; (d) JV curves of the individually measured PV and EC parts making up the PV-EC device. The dark blue curve represents the JV curve of the PV module measured under AM 1.5 illumination. The light blue curve and the red curve show the JV curves of the two-electrode device measured in the 1 M KOH electrolyte and 1 M KOH + 3 M CH3OH electrolyte, respectively. The points of intersection represent the operating points of the coupled system; (e) current density–time curve of the integrated formate and hydrogen co-synthesis device using a solar cell under chopped simulated AM 1.5G illumination; (f) faradaic efficiency and the yield rate of formate and hydrogen.

Considering the utilization of solar energy, a PV-EC system was constructed using Cu0.33CoCo-LDH/CF and CuCoPy/CF as the anode and cathode in the EC module, respectively, and a III–V triple-junction solar cell (GaInP2/GaAs/Ge) as the energy supplier of the EC part (Fig. 8c). To regulate the operating point, we introduced the MOFR to replace the OER at the EC side. The operating point can be determined from the intersection of the JV curve of the PV and the JV curve of the EC module. As depicted in Fig. 8d, the operating point (1.67 V, 9.2 mA cm−2) is obtained for the PV-powered HER‖OER process, which is far away from the MMP of PV, causing much energy loss in converting electrical energy to chemical energy. Impressively, for the PV-powered HER‖MOFR process, the operating point is significantly shifted to be a point (1.40 V, 16.6 mA cm−2) close to the MPP of PV due to the shift of the EC JV curve, indicating minimal energy loss.9 This demonstrates the superiority of the replacement of the OER with the MOFR. Therefore, this research provides a valuable approach to optimize the electrolysis voltage to match the PV output power through regulating electrocatalytic reactions and designing high-efficiency electrocatalysts. In addition, the operating current density determined by curves’ intersection in the PV-EC system is close to the actual recorded operating current density (Fig. 8e). Further product analysis verifies that the integrated PV-EC system can spontaneously produce formate and hydrogen under simulated solar irradiation (AM 1.5, 100 mW cm−2, see Movie S3). After one-hour operation, formate is produced with a yield rate of about 0.12 mmol h−1 cm−2 and a FE of 97% at the Cu0.33CoCo-LDH/CF anode, and hydrogen is evolved with a yield rate of about 0.24 mmol h−1 cm−2 and a FE of close to 100% at the CuCoPy/CF cathode. Moreover, cycling tests were carried out to assess the long-term stability of the integrated PV-EC system. As shown in Fig. 8f, for the anode part, the yield rate and FE of formate production remain unchanged during the 10 cycles. The same is true for the hydrogen evolution at the cathode. These results illustrated the excellent stability of this PV-EC device.

4. Conclusion

In conclusion, a series of hierarchical CuxCoCo-LDHs were synthesized through in situ pseudomorphic transformation from heterometallic CuxCo-MOFs. The collective effects of special morphological design and electronic structure engineering through optimizing the chemical composition enabled the Cu0.33CoCo-LDH/CF to have high catalytic activity for directed oxidation of methanol to formate (e.g., a very low overpotential of 1.28 V at a current density of 10 mA cm−2) and a high FE of over 98%. DFT verified that Cu incorporation resulted in the lattice distortion and high electrical conductivity. The specific electronic structure of Cu0.33CoCo-LDH induced by Cu doping at an optimal level enhanced the adsorption for methanol, while it weakened the adsorption for formic acid, thus achieving the electrooxidation of methanol to formic acid with high selectivity. Through introducing the MOFR to replace the OER at the EC side to regulate the anodic reaction potential, the PV-EC system using the Cu0.33CoCo-LDH/CF and CuCoPy/CF as the anode and cathode, respectively, achieved the optimized operation at close to the MMP of PV, which could spontaneously and efficiently co-generate formate (a yield rate of about 0.12 mmol h−1 cm−2, and a FE of 97%) and H2 (a yield rate of about 0.24 mmol h−1 cm−2 and a FE of close to 100%). Our study demonstrates a promising route to optimize the electrolysis voltage to match the PV output power through regulating electrocatalytic reactions and designing a high-efficiency electrocatalyst. Additionally, this work provides valuable guidance for the development of photovoltaic electrolysis for hydrogen and value-added chemical production.

Conflicts of interest

There are no conflicts to declare.

Acknowledgements

We are grateful for financial support from the National Science Foundation of China (52002015, 22178019, U1707603, 21625101, and 21521005), the Fundamental Research Funds for the Central Universities (buctrc202006, 51372213, and 21401206), and the Key Laboratory of Photochemical Conversion and Optoelectronic Materials, TIPC, CAS.

References

  1. M. S. Dresselhaus and I. L. Thomas, Nature, 2001, 414, 332 CrossRef CAS PubMed .
  2. N. Danilovic, R. Subbaraman, D. Strmcnik, K.-C. Chang, A. P. Paulikas, V. R. Stamenkovic and N. M. Markovic, Angew. Chem., Int. Ed., 2012, 51, 12495 CrossRef CAS PubMed .
  3. S.-H. Hsu, J. Miao, L. Zhang, J. Gao, H. Wang, H. Tao, S.-F. Hung, A. Vasileff, S. Z. Qiao and B. Liu, Adv. Mater., 2018, 30, 1707261 CrossRef PubMed .
  4. C. R. Cox, J. Z. Lee, D. G. Nocera and T. Buonassisi, Proc. Natl. Acad. Sci. U. S. A., 2014, 111, 14057 CrossRef CAS PubMed .
  5. M. Gong, W. Zhou, M. J. Kenney, R. Kapusta, S. Cowley, Y. Wu, B. Lu, M.-C. Lin, D.-Y. Wang, J. Yang, B.-J. Hwang and H. Dai, Angew. Chem., Int. Ed., 2015, 54, 11989 CrossRef CAS PubMed .
  6. M. Gratzel, Nature, 2001, 414, 338 CrossRef CAS PubMed .
  7. X. Wang, K. Maeda, A. Thomas, K. Takanabe, G. Xin, J. M. Carlsson, K. Domen and M. Antonietti, Nat. Mater., 2009, 8, 76 CrossRef CAS PubMed .
  8. S. M. Bashir, M. A. Nadeem, M. Al-Oufi, M. Al-Hakami, T. T. Isimjan and H. Idriss, ACS Omega, 2020, 5, 10510 CrossRef PubMed .
  9. J. Luo, J.-H. Im, M. T. Mayer, M. Schreier, M. K. Nazeeruddin, N.-G. Park, S. D. Tilley, H. J. Fan and M. Graetzel, Science, 2014, 345, 1593 CrossRef CAS PubMed .
  10. J. Gao, F. Sahli, C. Liu, D. Ren, X. Guo, J. Werner, Q. Jeangros, S. M. Zakeeruddin, C. Ballif, M. Gratzel and J. Luo, Joule, 2019, 3, 2930 CrossRef CAS .
  11. H. Chen, L. Song, S. Ouyang, J. Wang, J. Lv and J. Ye, Adv. Sci., 2019, 6, 1900465 CrossRef PubMed .
  12. Z. Li, S. Wu, J. Zhang, K. C. Lee, H. Lei, F. Lin, Z. Wang, Z. Zhu and A. K. Y. Jen, Adv. Energy Mater., 2020, 10, 2000361 CrossRef CAS .
  13. J. Zhang, L. Yu, Y. Chen, X. F. Lu, S. Gao and X. W. Lou, Adv. Mater., 2020, 32, 1906432 CrossRef CAS PubMed .
  14. E. Hu, Y. Feng, J. Nai, D. Zhao, Y. Hu and X. W. Lou, Energy Environ. Sci., 2018, 11, 872 RSC .
  15. B. You and Y. Sun, Acc. Chem. Res., 2018, 51, 1571 CrossRef CAS PubMed .
  16. J. W. Shabaker, R. R. Davda, G. W. Huber, R. D. Cortright and J. A. Dumesic, J. Catal., 2003, 215, 344 CrossRef CAS .
  17. X. Wei, S. Wang, Z. Hua, L. Chen and J. Shi, ACS Appl. Mater. Interfaces, 2018, 10, 25422 CrossRef CAS PubMed .
  18. D. A. Bulushev and J. R. H. Ross, ChemSusChem, 2018, 11, 821 CrossRef CAS PubMed .
  19. F. Valentini, V. Kozell, C. Petrucci, A. Marrocchi, Y. Gu, D. Gelman and L. Vaccaro, Energy Environ. Sci., 2019, 12, 2646 RSC .
  20. C. E. Shaffer and C.-Y. Wang, J. Power Sources, 2010, 195, 4185 CrossRef CAS .
  21. D. Gao, Z. Wang, C. Wang, L. Wang, Y. Chi, M. Wang, J. Zhang, C. Wu, Y. Gu, H. Wang and Z. Zhao, Chem. Eng. J., 2019, 361, 953 CrossRef CAS .
  22. X. Wei, Y. Li, L. Chen and J. Shi, Angew. Chem., Int. Ed., 2021, 60, 3148 CrossRef CAS PubMed .
  23. N. Kumar TR, S. Kamalakannan, M. Prakash, B. Viswanathan and B. Neppolian, ACS Appl. Energy Mater., 2022, 5, 2104–2111 CrossRef CAS .
  24. B. Zhao, C. Xu, M. Shakouri, R. Feng, Y. Zhang, J. Liu, L. Wang, J. Zhang, J.-L. Luo and X.-Z. Fu, Appl. Catal. B, 2022, 305, 121082 CrossRef CAS .
  25. M. Zhang, J. Zhu, R. Wan, B. Liu, D. Zhang, C. Zhang, J. Wang and J. Niu, Chem. Mater., 2022, 34, 959–969 CrossRef CAS .
  26. L. Huang, X. Zhang, Q. Wang, Y. Han, Y. Fang and S. Dong, J. Am. Chem. Soc., 2018, 140, 1142 CrossRef CAS PubMed .
  27. C. Cao, D.-D. Ma, J. Jia, Q. Xu, X.-T. Wu and Q.-L. Zhu, Adv. Mater., 2021, 33, 2008631 CrossRef CAS PubMed .
  28. N. Munichandraiah, K. McGrath, G. K. S. Prakash, R. Aniszfeld and G. A. Olah, J. Power Sources, 2003, 117, 98 CrossRef CAS .
  29. M. Ahmed and I. Dincer, Int. J. Energy Res., 2011, 35, 1213 CrossRef CAS .
  30. J. Li, R. Wei, X. Wang, Y. Zuo, X. Han, J. Arbiol, J. Llorca, Y. Yang, A. Cabot and C. Cui, Angew. Chem., Int. Ed., 2020, 59, 20826 CrossRef CAS PubMed .
  31. Y. Yi, J. Li and C. Cui, Chin. Chem. Lett., 2021, 33, 1006–1010 CrossRef .
  32. Y.-C. He, D.-D. Ma, S.-H. Zhou, M. Zhang, J.-J. Tian and Q.-L. Zhu, Small, 2021, 17, 2105246 Search PubMed .
  33. H. Cheng, Y. Liu, J. Wu, Z. Zhang, X. Li, X. Wang and H. J. Fan, Small Methods, 2021, 5, 2100871 CrossRef CAS PubMed .
  34. G. Ma, X. Zhang, G. Zhou and X. Wang, Chem. Eng. J., 2021, 411, 128292 CrossRef CAS .
  35. K. Xiang, D. Wu, X. Deng, M. Li, S. Chen, P. Hao, X. Guo, J.-L. Luo and X.-Z. Fu, Adv. Funct. Mater., 2020, 30, 1909610 CrossRef CAS .
  36. K. Xiang, Z. Song, D. Wu, X. Deng, X. Wang, W. You, Z. Peng, L. Wang, J.-L. Luo and X.-Z. Fu, J. Mater. Chem. A, 2021, 9, 6316 RSC .
  37. B. Zhao, J. Liu, C. Xu, R. Feng, P. Sui, J.-X. Luo, L. Wang, J. Zhang, J.-L. Luo and X.-Z. Fu, Appl. Catal. B, 2021, 285, 119800 CrossRef CAS .
  38. S.-H. Lin, K.-J. Huang, C.-F. Weng and D. Shiuan, Drug Des. Devel. Ther., 2015, 9, 3313 CAS .
  39. M. C. Payne, T. A. Arias and J. D. Joannopoulos, Rev. Mod. Phys., 1992, 64(4), 1045 CrossRef CAS .
  40. J. P. Perdew, K. Burke and M. Ernzerhof, Phys. Rev. Lett., 1996, 77, 3865 CrossRef CAS PubMed .
  41. P. Liao, J. A. Keith and E. A. Carter, J. Am. Chem. Soc., 2012, 134, 13296 CrossRef CAS PubMed .
  42. A. Tkatchenko and M. Scheffler, Phys. Rev. Lett., 2009, 102, 073005 CrossRef PubMed .
  43. M. Bajdich, M. Garcia-Mota, A. Vojvodic, J. K. Norskov and A. T. Bell, J. Am. Chem. Soc., 2013, 135, 13521 CrossRef CAS PubMed .
  44. S.-M. Xu, H. Yan and M. Wei, J. Phys. Chem. C, 2017, 121, 2683 CrossRef CAS .
  45. S. Grimme, J. Antony, S. Ehrlich and H. Krieg, J. Chem. Phys., 2010, 132, 154104 CrossRef PubMed .
  46. Y. Zhang, Q. Su, W. Xu, G. Cao, Y. Wang, A. Pan and S. Liang, Adv. Sci., 2019, 6, 1900162 CrossRef PubMed .
  47. J.-F. Qin, J.-Y. Xie, N. Wang, B. Dong, T.-S. Chen, Z.-Y. Lin, Z.-Z. Liu, Y.-N. Zhou, M. Yang and Y.-M. Chai, J. Colloid Interface Sci., 2020, 562, 279 CrossRef CAS PubMed .
  48. X. Zhang, Y. Zhao, Y. Zhao, R. Shi, G. I. Waterhouse and T. Zhang, Adv. Energy Mater., 2019, 9, 1900881 CrossRef .
  49. J. Zhang, J. Liu, L. Xi, Y. Yu, N. Chen, S. Sun, W. Wang, K. M. Lange and B. Zhang, J. Am. Chem. Soc., 2018, 140, 3876 CrossRef CAS PubMed .
  50. Z. Sun, Y. Wang, L. Lin, M. Yuan, H. Jiang, R. Long, S. Ge, C. Nan, H. Li and G. Sun, Chem. Commun., 2019, 55, 1334 RSC .
  51. W. Wang, H. Yan, U. Anand and U. Mirsaidov, J. Am. Chem. Soc., 2021, 143, 1854 CrossRef CAS PubMed .
  52. R. Ramachandran, T. Sakthivel, M. Li, H. Shan, Z.-X. Xu and F. Wang, Chemosphere, 2021, 271, 128509 CrossRef CAS PubMed .
  53. J. Zhang, L. Zhang, X. Wang, W. Zhu and Z. Zhuang, Chem. Commun., 2020, 56, 90 RSC .
  54. A. Li, W. Xu, R. Chen, Y. Liu and W. Li, Compos. Part A Appl. Sci. Manuf., 2018, 112, 558 CrossRef CAS .
  55. K. Parida, L. Mohapatra and N. Baliarsingh, J. Phys. Chem. C, 2012, 116, 22417 CrossRef CAS .
  56. J. Qin, S. Wang and X. Wang, Appl. Catal. B, 2017, 209, 476 CrossRef CAS .
  57. J. Yu, Y. Zhong, X. Wu, J. Sunarso, M. Ni, W. Zhou and Z. Shao, Adv. Sci., 2018, 5, 1800514 CrossRef PubMed .
  58. P. Gholami, L. Dinpazhoh, A. Khataee, A. Hassani and A. Bhatnagar, J. Hazard. Mater., 2020, 381, 120742 CrossRef CAS PubMed .
  59. S. Bai, H. Chu, X. Xiang, R. Luo, J. He and A. Chen, Chem. Eng. J., 2018, 350, 148 CrossRef CAS .
  60. L. Wen, X. Zhang, J. Liu, X. Li, C. Xing, X. Lyu, W. Cai, W. Wang and Y. Li, Small, 2019, 15, 1902373 CrossRef PubMed .
  61. H. Liu and G. R. Patzke, Chem.–Asian J., 2014, 9, 2249 CrossRef CAS PubMed .
  62. Y. Liu, N. Han, J. Jiang and L. Ai, Int. J. Hydrogen Energy, 2019, 44, 10627 CrossRef CAS .
  63. Y.-H. Fang and Z.-P. Liu, ACS Catal., 2014, 4, 4364 CrossRef CAS .
  64. P. Kang, C. Cheng, Z. Chen, C. K. Schauer, T. J. Meyer and M. Brookhart, J. Am. Chem. Soc., 2012, 134, 5500 CrossRef CAS PubMed .
  65. D. Guo, E. Shangguan, J. Li, T. Zhao, Z. Chang, Q. Li, X.-Z. Yuan and H. Wang, Int. J. Hydrog. Energy, 2014, 39, 3895 CrossRef CAS .
  66. E. Musella, I. Gualandi, E. Scavetta, A. Rivalta, E. Venuti, M. Christian, V. Morandi, A. Mullaliu, M. Giorgetti and D. Tonelli, J. Mater. Chem. A, 2019, 7, 11241 RSC .
  67. L. Aguilera, P. C. M. Aguiar, Y. L. Ruiz, A. Almeida, J. A. Moreira, R. R. Passos and L. A. Pocrifka, J. Mater. Sci. Mater. Electron., 2020, 31, 3084 CrossRef CAS .

Footnote

Electronic supplementary information (ESI) available. See DOI: 10.1039/d2ta01104b

This journal is © The Royal Society of Chemistry 2022