 Open Access Article
Creative Commons Attribution 3.0 Unported Licence
Efficient harvesting and storage of solar energy of an all-vanadium solar redox flow battery with a MoS2@TiO2 photoelectrode†
Gengyu
Tian
a,
Rhodri
Jervis
 b,
Joe
Briscoe
 a,
Magdalena
Titirici
 c and
Ana
Jorge Sobrido
 *a
*a
aSchool of Engineering and Materials Science, Queen Mary University of London, E1 4NS, UK. E-mail: a.sobrido@qmul.ac.uk
bElectrochemical Innovation Lab, Department of Chemical Engineering, University College London, WC1E 7JE, UK
cDepartment of Chemical Engineering, Imperial College London, South Kensington Campus, SW7 2AZ, UK
First published on 5th April 2022
Abstract
Solar redox flow batteries constitute an emerging technology that provides a smart alternative for the capture and storage of discontinuous solar energy through the photo-generation of the discharged redox species employed in traditional redox flow batteries. Here, we show that a MoS2-decorated TiO2 (MoS2@TiO2) photoelectrode can successfully harvest light to be stored in a solar redox flow battery using vanadium ions as redox active species in both the catholyte and anolyte, and without the use of any bias. The MoS2@TiO2 photoelectrode achieved an average photocurrent density of ∼0.4 mA cm−2versus 0.08 mA cm−2 for bare TiO2, when tested for the oxidation of V4+ to V5+, attributed to a more efficient light harvesting and charge separation for the MoS2@TiO2 relative to TiO2. The designed solar redox flow cell exhibited an optimal overall solar-to-output energy conversion efficiency (SOEE) of ∼4.78%, which outperforms previously reported solar redox flow batteries. This work demonstrates the potential of the MoS2@TiO2 photoelectrode to efficiently convert solar energy into chemical energy in a solar redox flow battery, and it also validates the great potential of this technology to increase reliability in renewable energies.
Introduction
The direct storage of sunlight in the form of hydrogen via overall water splitting using photoelectrochemical cells (PECs) has been the subject of extensive research in the last few decades.1–4 The main benefit of this technology is the clean production of hydrogen through the use of solar energy.5,6 However, the sluggish kinetics of water splitting, particularly the oxygen evolution reaction, the low overall energy conversion efficiency, and the high cost of transportation and storage of hydrogen have somewhat slowed down the take-off of the hydrogen economy.7,8 Because of this, researchers are increasingly shifting their efforts towards the development of alternative technologies that can offer faster chemical reaction kinetics to store solar energy. Among them, solar redox flow batteries (SRFBs) have attracted recent attention. SRFBs are hybrids between PECs and redox flow batteries (RFBs). They use renewable light energy to charge redox substances and solar energy in the form of chemical energy.9–16 One example of recent developments in this area is the SRFB designed by Yangen et al. that used I3−/I− and Br−/Br3− as redox active pairs.17 The SRFB was driven by a WO3-decorated BiVO4 photoanode and provided 1.25% solar-to-output energy conversion efficiency. Yan et al. reported a SRFB consisting of a Li2WO4/LiI redox couple and a dye-sensitised TiO2 photoelectrode, enabling a battery capacity of 0.0195 mA h mL−1 at a discharge density of 0.075 mA cm−2.1 Recently, Amirreza et al. built a tandem with a bare hematite photoanode and two dye-sensitised solar cells connected in series;2 the conversion efficiency from solar to chemical energy of the AQDS (anthraquinone-2,7-disulfonate)/iodide SRFB using only hematite as the photoanode was about 0.1%.Due to their high reversibility and fast reaction kinetics, all-vanadium redox flow batteries, including vanadium-based SRFBs, have been widely investigated and developed around the world.3–6 Hao et al. applied a nitrogen-doped TiO2 photoanode to a microfluidic all-vanadium photoelectrochemical cell with an average photocurrent density of 0.1 mA cm−2.7 Zi et al. demonstrated an AQDS/V4+ SRFB able to generate a relatively stable photocurrent of 0.14 mA cm−2 using TiO2 nanoparticles supported on fluorine-doped tin oxide (FTO) as a photoanode.8 Titanium dioxide (TiO2) has been extensively investigated as a photocatalyst since the discovery of its unique properties in 1972, including remarkable stability against photocorrosion and wide band gap, large enough to provide sufficient energy to drive a variety of useful reactions.9–12 Although the stability of TiO2 is excellent, the lack of visible light absorption along with the rapid recombination of photogenerated electron–hole pairs produced usually results in low quantum efficiency and poor photocatalytic activity.13 Multiple strategies to improve the photocatalytic performance of TiO2 have been explored, including doping with different elements,7,14,15 decorating with noble metals,16,17 and engineering heterojunctions with other semiconductors.18,19 Coupling TiO2 with other semiconductors to form heterojunctions is an effective way to boost the performance of TiO2 (ref. 20 and 21) via bending of the photoelectrode band structure, which in turn provides an easier transfer path for the photogenerated electrons and holes and enables a more efficient process.22,23 In addition, the design of a heterojunction with a semiconductor of smaller band gap provides a pathway to utilise the visible region of the solar spectrum, increasing the overall efficiency.24,25 Some reported examples of such systems include Cu2O@TiO2,26 g-C3N4@TiO2 (ref. 27) and MoS2@TiO2.28,29
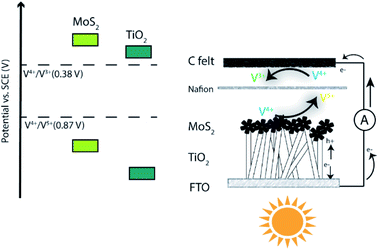
Here we present for the first time a SRFB with exceptional solar-to-output energy conversion efficiency (SOEE), consisting of a MoS2@TiO2 photoelectrode (photoanode) and carbon felt as the counter electrode (cathode). Specifically, we have studied the redox pairs V5+/V4+ and V4+/V3+, whose redox potentials match the band gap of the photoelectrode heterojunction. We synthesised MoS2@TiO2 thin films supported on an FTO glass substrate via a hydrothermal route. The deposition of MoS2 decorated TiO2 ensured an increased specific surface area and effective light response, which translated into enhanced photon capturing and charge transfer. When sunlight reaches the photoelectrode, the photogenerated holes oxidize V4+ to V5+ at the interface between the photoelectrode and anolyte, while the photogenerated electrons reduce V4+ to V3+ at the interface between the carbon felt and catholyte. Thus, the oxidized and reduced forms of V4+, V5+ and V3+, respectively, retain the chemical energy that can be converted to electricity via the reverse reaction (Fig. 1). This SRFB can be written as TiO2/MoS2(s)|V4+, V5+‖V4+, V3+|carbon. The developed system provides a ∼0.4 mA cm−2 photocurrent which is higher than those of similar TiO2-based all-vanadium systems with acidic electrolytes.7,8 This is the first time that the MoS2@TiO2 photoelectrode has shown good catalytic activity for vanadium redox couples, with an overall SOEE of 4.78%, remarkably higher than those of previously reported SRFB systems (Table S1, ESI†).30,31
Experimental
Material preparation
Characterisation
The morphology and microstructure of the prepared photoelectrodes were characterised using a field-emission scanning electron microscope (FESEM, Philips FEI Quanta 200 FEG) equipped with an energy dispersive X-ray spectrometer (EDS, operating at an accelerating voltage of 30 kV). The crystal phases of samples were determined by X-ray diffraction (XRD) with a Panalytical Xpert Pro diffractometer using a Cu Kα radiation source (1.5418 Å). The optical absorption properties were determined using a UV-vis spectrophotometer (Lambda 950, PerkinElmer) equipped with an integrating sphere (PerkinElmer) within a wavelength range of 350 to 800 nm and a step of 1 nm. The surface chemical states of photocatalysts were analysed by X-ray photoelectron spectroscopy (XPS, Thermo Fisher Nexsa X-ray spectrometer, Al Kα monochromatic X-ray source). ICP-MS analysis was performed using a microwave plasma atomic emission spectrometer (4210 MP-AES).Electrochemical and photoelectrochemical characterisation
A three-electrode electrochemical cell was employed to study the electrochemical behaviour of the carbon felt electrode against vanadium ion species. The carbon felts (3.18 mm thick, 99.0% Alfa Aesar) were pre-treated in an MTI 1200× tube furnace at 800 °C for 2 h, using a heating rate of 3 °C min−1 and a nitrogen flow rate of 0.5 L min−1.33 The size of the carbon felt electrodes was 1.0 cm2 (0.32 cm3). A KCl saturated calomel Hg2Cl2 electrode (SCE) and Pt foil were employed as reference and counter electrodes, respectively. Cyclic voltammetry (CV) experiments were conducted between −1.0 and 1.6 V versus SCE, at a scan rate of 10 mV s−1, and in an electrolyte with a concentration of 0.1 M or 1.0 M V4+ (vanadium(IV) oxide sulfate hydrate, Sigma-Aldrich, 97%) and 1.0, 2.0 or 3.0 M H2SO4 (Sigma, 98%). Electrochemical impedance spectroscopy (EIS) experiments were conducted using a frequency range of 0.1 MHz to 0.1 Hz and a perturbation of 10 mV. All the electrochemical experiments were carried out using a potentiostat (Gamry IFC5000-05520).Photoelectrochemical studies were conducted in a three-electrode electrochemical cell using TiO2 or MoS2@TiO2 as a working electrode, and an SCE and Pt foil as reference and counter electrodes, respectively. 0.1 M and 1.0 M V4+ in 3.0 M H2SO4 were used as the electrolyte. Linear sweep voltammetry (LSV) measurements were conducted at a scan rate of 10 mV s−1 in the voltage range of −0.5 V to 0.5 V vs. SCE. EIS photoelectrochemical experiments were also conducted at a frequency range of 0.1 MHz to 0.1 Hz and 10 mV perturbation. The illuminated area (back illumination) of the working electrode was 1.0 cm2. The photoelectrode was irradiated by simulated solar light (400 W Xe lamp) using an AM 1.5G filter. The power density of the incident light was calibrated to 100 mW cm−2 using an optical power meter with a silicon photodetector (Newport 818-SL) as a certified reference. The illuminated area of the working electrode was 1.0 cm2.
Redox flow battery testing
Charge–discharge experiments were conducted in the voltage range 0 to 1.1 V using a current density of 1.0 mA cm−2 with 1.0 M V4+. The electrolyte was pre-discharged to 0 V at a current density of 0.1 mA cm−2. Carbon felts separated by a Nafion® membrane were used as positive and negative electrodes. The discharge current density after photocharge is 0.4 mA cm−2. The carbon felts underwent the same thermal treatment described in the Electrochemical characterisation section. The Nafion membrane (115, 0.005 in. thick, DuPont de Nemours & Co) was subjected to the following treatment prior to its use: firstly, it was immersed in 50 mL 5 wt% H2O2 at 80 °C for 1 h, followed by treatment for an hour at 80 °C in distilled water, and another hour at 80 °C in 1.0 M H2SO4. The membrane was finally treated at 80 °C for 1 h in distilled water. A volume of 20 mL was employed as the initial catholyte and anolyte, respectively. The experiment was carried out using a peristaltic pump with a double head to control the flow of electrolyte on both sides of the redox flow cell to 2.5 mL min−1. The size of carbon felt as the working electrode for redox flow battery testing is 5.0 cm2 (1.59 cm3).Solar flow battery testing
The SRFB consisted of a modified redox flow battery (Fig. S1a, ESI†), with a window in the anolyte side to enable the irradiation of the photoanode with the Xe lamp light source, and a redox flow battery (Fig. S1b, ESI†), coupled with two electrolyte tanks and a peristaltic pump. All electrochemical data were collected using a Gamry IFC5000-05520 potentiostat. The solar flow cell assembly included the MoS2@TiO2 photoelectrode and carbon felt, separated by a Nafion® membrane. Both carbon felts and Nafion® membrane were pretreated as explained in the previous section. Photocharging of the SRFB was conducted without any external bias through irradiation of the photoanode using simulated solar light (400 W Xe lamp) using an AM 1.5G filter. As the SRFB photocharges, the V4+ present oxidises to V5+ in the anolyte and reduces to V3+ in the catholyte. EIS studies of MoS2@TiO2-0.5 were conducted in a SRFB configuration, using 1.0 M V4+ in 3.0 M H2SO4, frequency range 0.1 MHz–0.1 Hz and perturbation of 10 mV. The illuminated area of the working electrode in the solar flow cell was 5.0 cm2.Results and discussion
Three TiO2 thin films were synthesised using different amounts of titanium(IV) butoxide (0.1, 0.3 and 0.5 mL) and deposited onto FTO using a hydrothermal route. The TiO2 films (Fig. 2) displayed a rod-like morphology typically observed in the literature36 with a crystal structure corresponding to rutile, as determined by X-ray diffraction (Fig. S2, ESI†).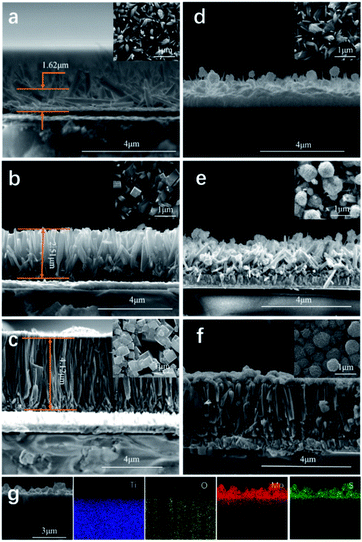 | ||
| Fig. 2 SEM images of TiO2 thin films obtained using (a) TiO2-0.1, (b) TiO2-0.3, (c) TiO2-0.5, (d) MoS2@TiO2-0.1, (e) MoS2@TiO2-0.3 and (f) MoS2@TiO2-0.5; (g) EDS mapping of MoS2@TiO2-0.5. | ||
The TiO2 rods became larger with increasing the amount of titanium(IV) butoxide. The TiO2 rods produced using 0.1 mL of precursor were relatively short (∼1.6 μm) and randomly oriented (Fig. 2a). As the amount of precursor is increased to 0.3 mL, generally the TiO2 rods thickened and their length increased, by almost 1 μm, to ∼2.5 μm (Fig. 2b). However, in this case, the size, length, and orientation of the rods was still inhomogeneous. As the amount of titanium(IV) butoxide was further increased to 0.5 mL, the TiO2 rods became much thicker (4.12 μm). Moreover, the orientation and size of the rods tended to be more uniform (Fig. 2c). The film itself also grew into a denser more compacted layer with additional titanium(IV) butoxide.
MoS2 nanoflowers were grown on the three TiO2 films prepared. In the case of the MoS2@TiO2-0.1 film, only a small amount of MoS2 was deposited onto the TiO2 rods, and also in the space between rods (Fig. 2d). The synthesis and growth of MoS2 on TiO2 with a tighter surface structure (MoS2@TiO2-0.3 and MoS2@TiO2-0.5) prevented the MoS2 nanoflowers from depositing into the space between TiO2 rods, leading to the formation of more uniform MoS2 layers (Fig. 2e and f). A higher magnification of the MoS2 nanoflowers on the upper right corner of Fig. 2f showed that each MoS2 nanoflower had a diameter of ∼500 nm and exhibited >100 sheets. According to the literature, the higher the number of layers of MoS2 nanosheets, the higher the photocatalytic performance, as more nanosheets will provide more active sites and area for the reaction.32,34,35 EDS data (Fig. 2g and S3, ESI†) for the MoS2@TiO2-0.5 material supported the SEM data.
The UV-vis absorption spectra of TiO2 and MoS2@TiO2 photoelectrodes in the front illumination mode (Fig. 3a) showed an increase in light absorption within the visible range for the samples containing MoS2, as expected. The back illumination spectra (Fig. S4, ESI†) displayed similar behaviour with additional features due to interference in the case of MoS2@TiO2 photoelectrodes, although some reports have suggested that the additional bands observed may be due to MoS2.25–30 XPS was used to analyse the oxidation state and electronic environment of Ti, Mo, S and O. The Ti 2p line XPS spectrum for TiO2-0.5 (Fig. 3b) confirmed that the surface of TiO2 mainly consists of Ti4+ 2p1/2, Ti4+ 2p3/2, Ti–O bond and O–H bond as expected for TiO2, with binding energies of 465.1 eV, 459.4 eV, 530.6 eV and 532.3 eV, respectively.32 In Fig. 3c and d, the Mo 3d and S 2p line XPS spectra for MoS2@TiO2-0.5 are shown, respectively. The Mo 3d line XPS spectrum indicated the existence of two different states of MoS2: 1T-MoS2 and 2H-MoS2, both with Mo4+ as the dominant oxidation state. Previous research has indicated that the Mo 3d and S 2p XPS signals of the 1T-MoS2 phase exhibit a higher binding energy (about 1 eV) than the corresponding signals for 2H-MoS2.36 The 2H and 1T phases exhibited binding energies of 229.4 and 232.2 eV for 3d1/2 and 3d3/2, respectively, for 2H-MoS2 and 228.1 and 231.3 eV for 3d5/2 and 3d3/2, respectively, for 1T-MoS2.37 Two small features at 235.2 eV (Mo 3d3/2) and 233.6 eV (Mo 3d5/2) attributed to Mo6+ from some MoO3 formed at the surface were also observed.38,39 A clear peak corresponding to S 2s at 225.5 eV could also be detected. The S 2p line (Fig. 3d) exhibited two doublets corresponding to 2p1/2 and 2p3/2 at binding energies of 163.2 eV and 161.4 eV, respectively.40 Additionally, peak contributions corresponding to bridging disulfides found in 1T-MoS2 were observed at 162.3 eV for 2p1/2 and at 160.9 eV for 2p3/2.41 The XPS survey spectra corresponding to TiO2-0.5 and MoS2@TiO2-0.5 and the XPS O 1s line for MoS2@TiO2-0.5 are shown in Fig. S5, ESI.†
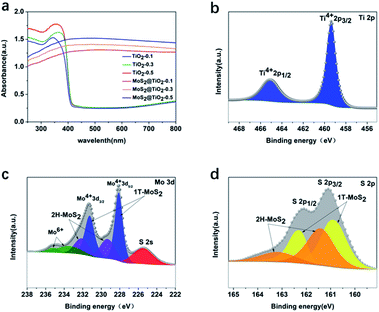 | ||
| Fig. 3 UV-vis spectra of TiO2-0.5 and MoS2@TiO2-0.5 using (a) front-illumination mode, XPS spectra of (b) Ti 2p from TiO2-0.5, and XPS spectra of (c) Mo 3d and (d) S 2p from MoS2@TiO2-0.5. | ||
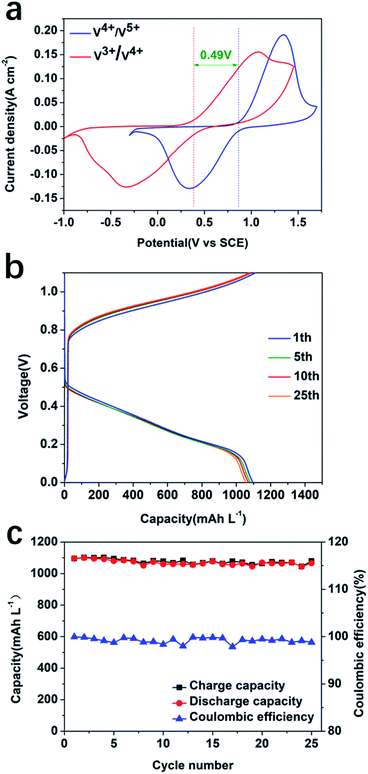
To study the influence of the electrolyte on the performance of the system, a CV experiment using carbon felt as a working electrode with 1.0 M/2.0 M/3.0 M sulfuric acid (without any V species) was conducted (Fig. S6, ESI†). The results showed that the ionic conductivity increased with increasing the concentration of sulfuric acid. CV and EIS of 0.1 M V4+ at different sulfuric acid concentrations were also conducted in a three-electrode electrochemical cell configuration (Fig. S7, ESI†). The results suggested that a higher concentration of H2SO4 facilitates the electrochemical reaction, resulting in more reversible redox processes at the highest concentration, 3.0 M H2SO4. The EIS result in Fig. S7c and d† confirmed that a higher concentration of sulfuric acid as an electrolyte can decrease the resistance through increasing the ionic conductivity of the electrolyte. The CV result indicated a redox potential difference between 0.1 M V3+/V4+ and V4+/V5+ of ∼0.49 V in 3.0 M H2SO4 using thermally treated carbon felt as the working electrode (Fig. 4a). There exists a reduction peak corresponding to V3+/V2+; however, no peak for oxidation of V2+ to V3+ was observed. This has been previously reported in the literature, due to the extremely easy oxidation of V2+ in air.42,43 In order to match the photocurrent density, 1.0 mA cm−2 was selected as the charge and discharge current density to test the reversibility and stability of the V3+/V4+ and V4+/V5+ redox pairs. The redox flow cell assembled with the same carbon felts and redox pairs exhibited a good reversibility upon charge and discharge cycling (Fig. 4b) with an average capacity of 1077 mA h L−1 and coulombic efficiency of 99.2% at a current density of 1.0 mA cm−2 within 25 cycles (Fig. 4c).
The redox processes of V4+/V5+ and V4+/V3+ redox pairs in the SRFB are summarised in eqn (1)–(3) as follows:
Anolyte:
| V4+ ⇌ V5+ + e−E0 = 0.87 V vs. SCE | (1) |
Catholyte:
| V3+ ⇌ V4+ + e−E0 = 0.38 V vs. SCE | (2) |
Overall:
| 2V4+ ⇌ V5+ + V3+E0 = 0.49 V vs. SCE | (3) |
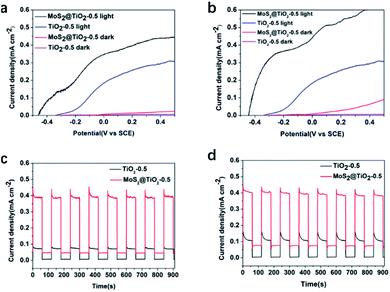
After testing the performance of the RFB using V3+/V4+ and V4+/V5+, the electrochemical behaviour of the TiO2 and MoS2@TiO2 photoanodes against V4+ was examined. Fig. 5a and b show the LSV measurements in 0.1 M and 1.0 M V4+, respectively, in 3.0 M H2SO4 for TiO2-0.5 and MoS2@TiO2-0.5. The MoS2@TiO2 photoelectrode exhibited much higher performance than TiO2-0.5, being able to achieve a photovoltage of ∼450 mV vs. SCE, about 100 mV higher than that of the TiO2-0.5 photoelectrode for both V4+ concentrations. Upon applying a potential bias, there is an expected increase in photocurrent for both photoelectrodes, which is also more noticeable in the case of MoS2@TiO2-0.5. In the case of the MoS2@TiO2-0.5, the increase rate is faster for the more concentrated V4+ electrolyte (1.0 M), reaching 0.6 mA cm−2 compared to ∼0.4 mA cm−2 for 0.1 M V4+ at 0.4 V vs. SCE. Interestingly, there was no significant effect on the photocurrent response when increasing the V4+ concentration for the TiO2-0.5 photoelectrode when applying a bias. We attribute this to the fact that the TiO2 photoelectrode is already performing at its maximum capacity, in terms of the holes that can be produced at a given time, so a higher concentration of V4+ would not change the number of holes that can reach the electrolyte/TiO2 interface.
Chronoamperometric measurements of all the photoelectrodes (TiO2-0.1, TiO2-0.3, and TiO2-0.5 and their MoS2@TiO2 counterparts, Fig. S8, ESI†) conducted in a SRFB configuration showed that the performance of the samples was much more affected by the densification level and thickness of the TiO2 layer than by the presence of MoS2 in the TiO2-0.1, TiO2-0.3, MoS2@TiO2-0.1 and MoS2@TiO2-0.3 samples, all of which exhibited a similar photocurrent response. This is likely due to a better alignment of the TiO2 rods for the more compact samples,32 TiO2-0.5 and MoS2@TiO2-0.5. Therefore, a significant enhancement in the photoresponse when adding MoS2 was only observed for these more compact TiO2 layers, with the MoS2@TiO2-0.5 sample exhibiting a photocurrent density of 0.4 mA cm−2versus 0.08 mA cm−2 for TiO2-0.5 in 0.1 M V4+. Chopped-chronoamperometry experiments in 0.1 M (Fig. 5c) and 1.0 M V4+ (Fig. 5d), in 3.0 M H2SO4, also revealed that the MoS2@TiO2-0.5 photoanode presented a stable photocurrent density and quick photoresponse in V4+ flowing electrolyte.
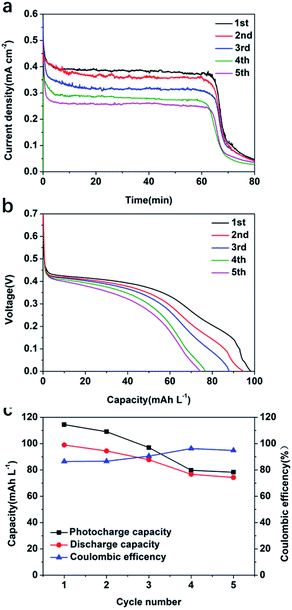
A stability test was carried out for the best performing photoelectrode, MoS2@TiO2-0.5 in 1.0 M V4+, in 3.0 M H2SO4 electrolyte, using a SRFB configuration. Fig. 6a shows the photocharging process conducted for five cycles. As can be observed, a full photocharge was achieved in ∼60 min. As the number of charge/discharge cycles increased, the photocurrent density of MoS2@TiO2-0.5 decreased. After each full photocharge and discharge, the photocurrent density decreased from ∼0.4 mA cm−2 to 0.26 mA cm−2 for the 5th cycle. This is attributed to the low stability of MoS2 under the harsh acidic working conditions and more studies to protect the MoS2 are currently being explored to mitigate this effect. The fluctuations observed in the charge profiles are due to the slow photocorrosion process affecting the MoS2 under the acidic working environment. When the photons inject into the MoS2@TiO2 photoanode, the photoanode tries to create a stable equipotential interface and dynamic equilibrium between the MoS2@TiO2 photoanode surface and electrolyte. Due to the existence of MoS2 photocorrosion, the interface must re-establish itself after the photocorrosion of MoS2, leading to photocharge fluctuations. This phenomenon was also observed for the 0.1 M V4+ concentration electrolyte (Fig. S9a, ESI†). Fig. 6b shows the discharge experiment after each full photocharge. Compared to the poor discharge performance (25.52 mA h L−1 to 18.11 mA h L−1) when using 0.1 M V4+ electrolyte (Fig. S9b, ESI†), the much higher capacity (98.93 mA h L−1 to 74.26 mA h L−1) of 1.0 M V4+ (Fig. 6c) can provide higher discharge potential to overcome the multiple resistances present in the system. The coulombic efficiency for 1.0 M and 0.1 M V4+ after five cycles is ∼90% (Fig. 7c) and ∼80% (Fig. S9c, ESI†), respectively. A SOC of 9.03% after 80 min of the first photocharging cycle was observed, decreasing to 6.78% after 80 min into the fifth photocharging cycle.
During the photocharging process, the carriers from the semiconductor are excited to the conduction band and oxidise V4+ to V5+. The photoexcitation and electron transfer can be represented as follows:
| TiO2 + hν = e− (TiO2) + h+ (TiO2) (formation) (step 1) |
| e− (TiO2) + h+ (TiO2) = TiO2 + hν (recombination) (step 2) |
| e− (TiO2) + h+ (TiO2) = e− (MoS2) + h+ (MoS2) (interface) (step 3) |
| e− (MoS2) + h+ (MoS2) = MoS2 + hν (recombination) (step 4) |
| V4+ + h+ (MoS2) = V5+ (production) (step 5) |
The average SOEE during photocharge in the SRFB was calculated according to eqn (4):44
| SOEE (%) = (∫Idis × dt × ΔE0)/(Pin × S × t) × 100 | (4) |
As recorded in Table 1, the calculations showed that the SOEE of the SRFB in 1.0 M V4+ reaches a value of 4.78% in the first cycle and remains at 3.26% in the fifth cycle.
| Cycle | Sample | |||||
|---|---|---|---|---|---|---|
| 0.1 M | 1.0 M | |||||
| Photocharge capacity (mA h L−1) | Discharge capacity (mA h L−1) | SOEE (%) | Photocharge capacity (mA h L−1) | Discharge capacity (mA h L−1) | SOEE (%) | |
| 1 | 32.68 | 25.52 | 0.17 | 114.44 | 98.93 | 4.78 |
| 2 | 26.23 | 22.50 | 0.14 | 109.09 | 94.47 | 4.31 |
| 3 | 23.92 | 21.00 | 0.12 | 96.99 | 87.79 | 3.99 |
| 4 | 21.38 | 18.69 | 0.11 | 79.72 | 76.74 | 3.49 |
| 5 | 21.28 | 18.11 | 0.09 | 78.29 | 74.26 | 3.26 |
EIS studies showed an increase in the impedance of MoS2@TiO2-0.5 with photocharging (Fig. S10, ESI†) reaching almost three times the initial value after 2 hours, revealing an increase in resistance as the photocharging process progresses, which was attributed to the low stability of the photoelectrode under strong acid electrolyte. This was confirmed via SEM images acquired after each cycle (Fig. S11, ESI†). The SEM images clearly show degradation of the MoS2 layer upon cycling and suggest that the increase in resistance observed in the EIS may be linked to this degradation of MoS2. The photoexcitation and electron transfer may be represented as shown in eqn (S1), ESI.† The amounts of Mo and Ti leached from the photoanode were determined by ICP-MS and the results are shown in Fig. S12, ESI.† The concentration of Mo in the electrolyte increases with the number of cycles, as expected, supporting the results obtained by SEM and EIS. The TiO2 layer was less affected by the cycling, but slight leaching was also detected for the 1.0 M V4+ electrolyte.
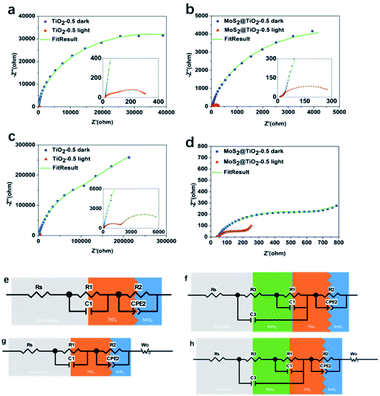
To understand the influence of the photoanode structure and to use its light absorption ability to effectively photocharge our solar flow cell, EIS was measured under both dark and light conditions for 0.1 and 1.0 M V4+ (Fig. 7a–d). EIS data for TiO2 and MoS2@TiO2 photoanodes both for low (0.1 M V4+) and high electrolyte concentration (1.0 M V4+) showed that the increase in thickness of the TiO2 leads to a decrease in impedance, an effect that remains after adding the MoS2 layer. In the low frequency range under dark conditions, the mass transfer dominates the reaction for TiO2-0.5.
However, under illumination, the upward trend disappears, which means that charge transfer dominates in that case (Fig. 7a and c). For MoS2@TiO2-0.5, EIS results demonstrate that the addition of MoS2 to the TiO2 layer enhances the charge transfer properties of the photoelectrode (Fig. 7b and d). Under illumination, the process remains dominated by the mass transport effect for the MoS2@TiO2-0.5 photoanode at low frequencies, confirming its better performance compared to TiO2-0.5. The equivalent circuits for TiO2-0.5 and MoS2@TiO2-0.5 in 0.1 M V4+ (Fig. 7e and f) exhibit slightly different interface components due to the differences in morphology and roughness of both photoelectrodes.45 The EIS data taken in a three-electrode electrochemical cell and equivalent circuit for TiO2/FTO and MoS2@TiO2/FTO systems show that at lower V4+ concentration, the diffusion resistance is also lower, because when the charge transfer dynamics are not very fast, the charge transfer process and the mass transfer process (caused by diffusion) control the overall reaction: electrochemical polarisation and concentration polarisation coexist. When the concentration is low, the charge transfer process is the rate-determining process. At higher concentration of V4+, mass transport is introduced in the equivalent circuit as the Warburg impedance (Wo) in the equivalent circuit (Fig. 7g and h), in addition to the charge transfer resistance, as there is an increase in diffusion resistance with increasing concentration of V4+.
The fitted data for the TiO2-0.5 and MoS2@TiO2-0.5 photoelectrodes in 0.1 M V4+ and 1.0 M V4+ are consistent with the results obtained from both dark and light experiments. Rs represents the series resistance (resistance of the electrolyte solution and cable of the potentiostat), R1 and C1 represent the charge transfer resistance and capacitance of the electrolyte/TiO2 interface in TiO2-0.5 while in MoS2@TiO2-0.5 they represent the MoS2/TiO2 interface, and R2 and CPE2 represent the charge transfer equivalent structure of the interface between SnO2 (FTO) and TiO2. In MoS2@TiO2-0.5, the R1 and C1 represent the impedance of MoS2/TiO2. Because the MoS2 nanoflowers cannot form a dense layer to separate the TiO2 and the electrolyte, R3 and C3 have a collective effect representing the charge transfer resistance and capacitance of the electrolyte/MoS2 and electrolyte/TiO2 interfaces. The C3 element in parallel with R1, C1 and R3 is also associated with the same phenomenon. The main values of the circuit elements in the dark and in light are listed in Table 2. The results from the fitting models of TiO2-0.1/0.3 and MoS2@TiO2-0.1/0.3 in 0.1 M V4+ and 1.0 M V4+ fit well with the original data in Fig. S13 and S14, ESI.† The equivalent circuit is applicable for all the TiO2 and MoS2@TiO2 combinations.
| Sample | Element | |||||||
|---|---|---|---|---|---|---|---|---|
| R3 (Ω) | C3 (F) | R1 (Ω) | C1 (F) | R2 (Ω) | CPE2-T (F) | CPE2-P | ||
| 0.1 M V4+ | TiO2-0.5 dark | N/A | N/A | 1.7 | 5.0 × 10⁻⁶ | 70![[thin space (1/6-em)]](https://www.rsc.org/images/entities/char_2009.gif) 441 441 |
1.9 × 10⁻⁵ | 0.9 |
| TiO2-0.5 light | N/A | N/A | 32.9 | 4.3 × 10⁻⁵ | 297.3 | 7.5 × 10⁻⁴ | 0.5 | |
| MoS2@TiO2-0.5 dark | 6.6 | 3.7 × 10⁻⁶ | 13.4 | 2.0 × 10⁻⁵ | 10![[thin space (1/6-em)]](https://www.rsc.org/images/entities/char_2009.gif) 160 160 |
1.9 × 10⁻⁴ | 0.8 | |
| MoS2@TiO2-0.5 light | 3.1 | 1.3 × 10⁻⁵ | 23.9 | 1.1 × 10⁻³ | 291.3 | 1.4 × 10⁻³ | 0.9 | |
| 1.0 M V4+ | TiO2-0.5 dark | N/A | N/A | 1921 | 3.1 × 10⁻⁶ | 2.6 × 10⁵ | 1.4 × 10⁻⁶ | 0.9 |
| TiO2-0.5 light | N/A | N/A | 2943 | 1.4 × 10⁻⁴ | 1776 | 4.3 × 10⁻⁶ | 0.8 | |
| MoS2@TiO2-0.5 dark | 100.2 | 9.3 × 10⁻⁵ | 53.8 | 3.4 × 10⁻⁴ | 377.3 | 5.4 × 10⁻⁴ | 0.8 | |
| MoS2@TiO2-0.5 light | 40.5 | 1.1 × 10⁻⁴ | 19.3 | 6.2 × 10⁻⁴ | 30.9 | 2.7 × 10⁻³ | 1.0 | |
Under dark conditions, due to the poor conductivity of the TiO2, a large charge transfer resistance (Rct) is generated at the interface between TiO2 and SnO2 (TiO2/SnO2), hindering electron transport. In 0.1 M V4+ and 1.0 M V4+, under illumination, by comparing the sum of the charge transfer resistance of R1 + R2 + R3, it is demonstrated that the introduction of the MoS2 interface makes it easier for electrons to transfer in the photoanode, which makes the transmission of the photogenerated electrons in the photoelectrode more efficient. In addition, the injection of photons significantly reduces the Rct of the interface, especially in the TiO2/SnO2 interface. Due to the photon injection, many carriers are generated and moved to the interface (MoS2/TiO2, TiO2/SnO2, electrolyte/TiO2 and electrolyte/MoS2). The enrichment of positive and negative charges on both sides of the interface increases the capacitance under illumination. By comparing the capacitance of TiO2 and MoS2@TiO2, it can be concluded that MoS2@TiO2 exhibits more carrier accumulation at the interface, which also confirms that the heterojunction of MoS2@TiO2 can effectively increase the carrier density in the photoanode.
Conclusions
TiO2 and MoS2@TiO2 thin films supported on FTO were synthesised and tested as photoelectrodes in a solar redox flow battery using vanadium redox active species. Different thicknesses of the TiO2 layer were produced. The results showed that a larger amount of Ti precursor resulted in a more uniform, thicker, and denser TiO2 thin film with more aligned TiO2 rods. This, in turn, led to a more efficient attachment of the MoS2 nanoflower overlayer which also translated into a higher photocurrent response. The designed MoS2@TiO2 photoelectrode exhibited around 5 times higher activity than bare TiO2 for charging the all-V SRFB tested in this work. This was attributed to a better separation of charge carriers. The SRFB with 1.0 M V4+ electrolyte exhibited a remarkable performance, with an average capacity of 1077 mA h L−1 and coulombic efficiency of 99.2% at a current density of 1.0 mA cm−2 within 25 cycles, charged only by solar energy without the need for any bias. The SOEE reached 4.78%. The photoelectrode interfaces were analysed in detail through EIS, and successfully confirmed the enhancement of the photocurrent response with the addition of the MoS2 layer to the TiO2 photoelectrode. This indicates that the highly active MoS2@TiO2 photoanode is promising for the enhancement of photocurrent density in the system studied. The MoS2 facilitated charge carrier separation and provided active sites for oxidation of redox species. However, the low stability of the photoanode under strong acidic conditions led to a significant degradation of the photoelectrode after only five cycles, resulting in the leaching of metal to the electrolyte. More research is currently under way into approaches to protect the photoelectrode against degradation.Author contributions
GT: investigation, formal analysis, methodology, visualisation, writing – original draft and editing. RJ: formal analysis, writing and editing. JB: writing and editing. MT: writing and editing. AJS: conceptualisation, formal analysis, resources, funding acquisition, writing and editing.Conflicts of interest
There are no conflicts to declare.Acknowledgements
The authors acknowledge Dr Ryan Wang, Jay Yan, Zhangyi Yao, Junrun Feng and Yue Wen at UCL Department of Chemical Engineering for their help with the ICP measurements. GT acknowledges his PhD scholarship funded by the Chinese Scholarship Council. AJS acknowledges her UKRI Future Leaders Fellowship (MR/T041412/1) for funding support.Notes and references
- N. Yan, G. Li and X. Gao, J. Mater. Chem. A, 2013, 1, 7012–7015 RSC.
- A. Khataee, J. Azevedo, P. Dias, D. Ivanou, E. Dražević, A. Bentien and A. Mendes, Nano Energy, 2019, 62, 832–843 CrossRef CAS.
- M. Skyllas-Kazacos, M. Rychcik, R. G. Robins, A. Fane and M. Green, J. Electrochem. Soc., 1986, 133, 1057 CrossRef CAS.
- M. Skyllas-Kazacos, M. Chakrabarti, S. Hajimolana, F. Mjalli and M. Saleem, J. Electrochem. Soc., 2011, 158, R55 CrossRef CAS.
- J. Vázquez-Galván, C. Flox, J. Jervis, A. Jorge, P. Shearing and J. Morante, Carbon, 2019, 148, 91–104 CrossRef.
- N. M. Delgado, R. Monteiro and A. Mendes, Nano Energy, 2021, 106372 CrossRef CAS.
- H. Feng, X. Jiao, R. Chen, X. Zhu, Q. Liao, D. Ye, B. Zhang and W. Zhang, J. Power Sources, 2019, 419, 162–170 CrossRef CAS.
- Z. Wei, H. Almakrami, G. Lin, E. Agar and F. Liu, Electrochim. Acta, 2018, 263, 570–575 CrossRef CAS.
- A. Fujishima, T. N. Rao and D. A. Tryk, J. Photochem. Photobiol., C, 2000, 1, 1–21 CrossRef CAS.
- H. Cui, W. Zhao, C. Yang, H. Yin, T. Lin, Y. Shan, Y. Xie, H. Gu and F. Huang, J. Mater. Chem. A, 2014, 2, 8612–8616 RSC.
- T. Butburee, Y. Bai, H. Wang, H. Chen, Z. Wang, G. Liu, J. Zou, P. Khemthong, G. Q. M. Lu and L. Wang, Adv. Mater., 2018, 30, e1705666 CrossRef.
- A. Fujishima and K. Honda, nature, 1972, 238, 37–38 CrossRef CAS.
- K. Nakata and A. Fujishima, J. Photochem. Photobiol., C, 2012, 13, 169–189 CrossRef CAS.
- U. Akpan and B. Hameed, Appl. Catal., A, 2010, 375, 1–11 CrossRef CAS.
- T. Ohno, T. Mitsui and M. Matsumura, Chem. Lett., 2003, 32, 364–365 CrossRef CAS.
- V. Subramanian, E. E. Wolf and P. V. Kamat, J. Am. Chem. Soc., 2004, 126, 4943–4950 CrossRef CAS PubMed.
- Z. Zheng, B. Huang, X. Qin, X. Zhang, Y. Dai and M.-H. Whangbo, J. Mater. Chem., 2011, 21, 9079–9087 RSC.
- C. Gao, T. Wei, Y. Zhang, X. Song, Y. Huan, H. Liu, M. Zhao, J. Yu and X. Chen, Adv. Mater., 2019, 31, e1806596 CrossRef.
- M. Humayun, F. Raziq, A. Khan and W. Luo, Green Chem. Lett. Rev., 2018, 11, 86–102 CrossRef CAS.
- Y. Bessekhouad, D. Robert and J.-V. Weber, Catal. Today, 2005, 101, 315–321 CrossRef CAS.
- J. Low, J. Yu, M. Jaroniec, S. Wageh and A. A. Al-Ghamdi, Adv. Mater., 2017, 29, 1601694 CrossRef PubMed.
- C. Sotelo-Vazquez, R. Quesada-Cabrera, M. Ling, D. O. Scanlon, A. Kafizas, P. K. Thakur, T. L. Lee, A. Taylor, G. W. Watson and R. G. Palgrave, Adv. Funct. Mater., 2017, 27, 1605413 CrossRef.
- H. Wang, L. Zhang, Z. Chen, J. Hu, S. Li, Z. Wang, J. Liu and X. Wang, Chem. Soc. Rev., 2014, 43, 5234–5244 RSC.
- J. Li, M. Zhang, X. Li, Q. Li and J. Yang, Appl. Catal., B, 2017, 212, 106–114 CrossRef CAS.
- N. Yuan, J. Zhang, S. Zhang, G. Chen, S. Meng, Y. Fan, X. Zheng and S. Chen, J. Phys. Chem. C, 2020, 124, 8561–8575 CrossRef CAS.
- B. Y. Cheng, J. S. Yang, H. W. Cho and J. J. Wu, ACS Appl. Mater. Interfaces, 2016, 8, 20032–20039 CrossRef CAS.
- M. Alcudia-Ramos, M. Fuentez-Torres, F. Ortiz-Chi, C. Espinosa-González, N. Hernández-Como, D. García-Zaleta, M. Kesarla, J. Torres-Torres, V. Collins-Martínez and S. Godavarthi, Ceram. Int., 2020, 46, 38–45 CrossRef CAS.
- H. He, J. Lin, W. Fu, X. Wang, H. Wang, Q. Zeng, Q. Gu, Y. Li, C. Yan and B. K. Tay, Adv. Energy Mater., 2016, 6, 1600464 CrossRef.
- L. Yang, K. Majumdar, H. Liu, Y. Du, H. Wu, M. Hatzistergos, P. Y. Hung, R. Tieckelmann, W. Tsai, C. Hobbs and P. D. Ye, Nano Lett., 2014, 14, 6275–6280 CrossRef CAS PubMed.
- W. Li, H. C. Fu, L. Li, M. Caban-Acevedo, J. H. He and S. Jin, Angew. Chem., Int. Ed. Engl., 2016, 55, 13104–13108 CrossRef CAS.
- Q. Cheng, W. Fan, Y. He, P. Ma, S. Vanka, S. Fan, Z. Mi and D. Wang, Adv. Mater., 2017, 29, 1700312 CrossRef.
- Y. Liu, Y. Li, F. Peng, Y. Lin, S. Yang, S. Zhang, H. Wang, Y. Cao and H. Yu, Appl. Catal., B, 2019, 241, 236–245 CrossRef CAS.
- M. C. Ribadeneyra, L. Grogan, H. Au, P. Schlee, S. Herou, T. Neville, P. L. Cullen, M. D. Kok, O. Hosseinaei and S. Danielsson, Carbon, 2020, 157, 847–856 CrossRef CAS.
- D. Wang, Y. Xu, F. Sun, Q. Zhang, P. Wang and X. Wang, Appl. Surf. Sci., 2016, 377, 221–227 CrossRef CAS.
- C. Liu, L. Wang, Y. Tang, S. Luo, Y. Liu, S. Zhang, Y. Zeng and Y. Xu, Appl. Catal., B, 2015, 164, 1–9 CrossRef CAS.
- X. Geng, W. Sun, W. Wu, B. Chen, A. Al-Hilo, M. Benamara, H. Zhu, F. Watanabe, J. Cui and T. P. Chen, Nat. Commun., 2016, 7, 10672 CrossRef CAS PubMed.
- K. Chang, X. Hai, H. Pang, H. Zhang, L. Shi, G. Liu, H. Liu, G. Zhao, M. Li and J. Ye, Adv. Mater., 2016, 28, 10033–10041 CrossRef CAS.
- X. Zhou, M. Licklederer and P. Schmuki, Electrochem. Commun., 2016, 73, 33–37 CrossRef CAS.
- H. Liu, T. Lv, C. Zhu, X. Su and Z. Zhu, J. Mol. Catal. A: Chem., 2015, 396, 136–142 CrossRef CAS.
- H. Vrubel, D. Merki and X. Hu, Energy Environ. Sci., 2012, 5, 6136–6144 RSC.
- M. Sun, Y. Wang, Y. Fang, S. Sun and Z. Yu, J. Alloys Compd., 2016, 684, 335–341 CrossRef CAS.
- W. Wang and X. Wang, Electrochim. Acta, 2007, 52, 6755–6762 CrossRef CAS.
- M. Ulaganathan, A. Jain, V. Aravindan, S. Jayaraman, W. C. Ling, T. M. Lim, M. P. Srinivasan, Q. Yan and S. Madhavi, J. Power Sources, 2015, 274, 846–850 CrossRef CAS.
- S. Liao, X. Zong, B. Seger, T. Pedersen, T. Yao, C. Ding, J. Shi, J. Chen and C. Li, Nat. Commun., 2016, 7, 11474 CrossRef CAS.
- H. Fakhr Nabavi and M. Aliofkhazraei, Surf. Coat. Technol., 2019, 375, 266–291 CrossRef CAS.
Footnote |
| † Electronic supplementary information (ESI) available. See https://doi.org/10.1039/d2ta00739h |
| This journal is © The Royal Society of Chemistry 2022 |

