
 Open Access Article
 This Open Access Article is licensed under a
 Creative Commons Attribution 3.0 Unported Licence
Study of thermal material properties for Ta- and Al-substituted Li7La3Zr2O12 (LLZO) solid-state electrolyte in dependency of temperature and grain size†
Julian
Neises
 *a,
Walter Sebastian
Scheld
b,
Ah-Ram
Seok
b,
Sandra
Lobe
b,
Martin
Finsterbusch
bc,
Sven
Uhlenbruck
bc,
Roland
Schmechel
a and
Niels
Benson
*a
*a,
Walter Sebastian
Scheld
b,
Ah-Ram
Seok
b,
Sandra
Lobe
b,
Martin
Finsterbusch
bc,
Sven
Uhlenbruck
bc,
Roland
Schmechel
a and
Niels
Benson
*a
aInstitute of Technology for Nanostructures (NST), University Duisburg-Essen, 47057 Duisburg, Germany. E-mail: niels.benson@uni-due.de
bInstitute of Energy and Climate Research – Materials Synthesis and Processing (IEK-1), Forschungszentrum Juelich GmbH, 52425 Juelich, Germany
cHelmholtz Institute Muenster, Wilhelm-Johnen Str., 52425 Juelich, Germany
First published on 19th May 2022
Abstract
Solid-state electrolytes such as tantalum (Ta)- and aluminum (Al)-substituted Li7La3Zr2O12 (LLZO) are seen as the key component for the next generation of mainstream battery technology. However, this development often lacks specific information on decisive material parameters. Therefore, this work experimentally investigates the thermal material parameters such as the thermal conductivity (κ) and the specific heat capacity (Cp) of LLZO between room temperature and 1225 K using laser flash analysis (LFA) and differential scanning calorimetry (DSC). The DSC measurements reveal a Cp of 0.55–0.80 J g−1 K−1. Furthermore, a decomposition of the cubic LLZO phase to pyrochlore La2Zr2O7 is detected between 1500 K and 1750 K, which is substantiated by Raman- and SEM-analysis. The impact of the grain size on κ is also considered, as the Al-substitution leads to the formation of significantly larger grain sizes compared to a Ta-substitution. The LFA measurements yield a relatively constant κ between 1.45–1.55 W m−1 K−1 for both materials and grain sizes, which is the consequence of a phonon mean free path in the range of the interatomic distance of the LLZO crystal. This implies that phonon scattering at grain boundaries is negligible and the main scattering occurs at inhomogeneities in the crystal lattice.
1 Introduction
All-solid-state batteries are considered a potential candidate for the next generation of mainstream battery technology, as they offer higher operational safety, larger energy densities, and potentially faster charging when compared to conventional lithium (Li)-ion batteries.1 Research has shown that garnet-based Li-oxides exhibit the required high ionic conductivity, as well as good chemical stability against possible electrode materials.1–4 Especially the solid electrolyte with the nominal formula Li7La3Zr2O12 (LLZO) has been extensively studied due to its high Li+ conductivity (σLi > 10−4 S cm−1) at room temperature (RT) and stability in conjunction with Li metal anodes.1 LLZO possesses a cubic phase which crystallizes in the space group Ia![[3 with combining macron]](https://www.rsc.org/images/entities/char_0033_0304.gif) d and a tetragonal phase (I41/acd).1,5,6 The tetragonal phase shows a higher-ordered arrangement of Li+ compared to the cubic crystal phase.6 The distorted arrangement of Li+ in the cubic crystal phase leads to two orders of magnitude higher Li+ conductivity.1,5,6 The tetragonal phase, which is the thermodynamically stable phase at ambient conditions, undergoes a phase transition to cubic between 100 °C and 150 °C.5,7,8 It has been reported that doping the LLZO with elements such as Al,5,9,10 Ga,9,11 Ta,9,12–14 or Nb15 stabilizes the cubic crystal phase at room temperature after sintering at high temperatures (T > 1000 °C). Doping with such super valent cations leads to a decrease in Li content by forming Li site vacancies, in order to restore electro-neutrality. The substitution cations can either reside on the Li site, e.g. M = Al or Ga (Li7−3xMxLa3Zr2O12) creating two Li vacancies per substitution or on the Zr site, e.g. M = Ta or Nb (Li7−yLa3Zr2−yMyO12) which creates one vacancy for each substitution. The critical level of Li site vacancies to stabilize the cubic phase was experimentally found to be 0.2–0.6 mol per LLZO formula unit.9,12,16,17
d and a tetragonal phase (I41/acd).1,5,6 The tetragonal phase shows a higher-ordered arrangement of Li+ compared to the cubic crystal phase.6 The distorted arrangement of Li+ in the cubic crystal phase leads to two orders of magnitude higher Li+ conductivity.1,5,6 The tetragonal phase, which is the thermodynamically stable phase at ambient conditions, undergoes a phase transition to cubic between 100 °C and 150 °C.5,7,8 It has been reported that doping the LLZO with elements such as Al,5,9,10 Ga,9,11 Ta,9,12–14 or Nb15 stabilizes the cubic crystal phase at room temperature after sintering at high temperatures (T > 1000 °C). Doping with such super valent cations leads to a decrease in Li content by forming Li site vacancies, in order to restore electro-neutrality. The substitution cations can either reside on the Li site, e.g. M = Al or Ga (Li7−3xMxLa3Zr2O12) creating two Li vacancies per substitution or on the Zr site, e.g. M = Ta or Nb (Li7−yLa3Zr2−yMyO12) which creates one vacancy for each substitution. The critical level of Li site vacancies to stabilize the cubic phase was experimentally found to be 0.2–0.6 mol per LLZO formula unit.9,12,16,17
Besides the need for the cubic crystal phase to attain high Li+ conductivity, a dense microstructure is required which also reduces the grain boundary resistance.18 In order to achieve highly dense materials, various methods have been investigated, such as long-term sintering at high temperatures of isostatic cold-pressed pellets,1,5 hot-pressing,9,11 or the usage of sintering aids.19–22 For all of these methods, the thermal budget of the LLZO must not be exceeded as this would lead to Li loss and finally to the decomposition of the cubic LLZO phase.23,24 Even though this garnet-based solid electrolyte has attracted a lot of scientific attention in the last decade, its thermal material parameters such as thermal conductivity and specific heat capacity are often unknown. Their knowledge could lead to a better understanding of thermal processes in LLZO, especially regarding computational simulations of such thermal treatments25 or heat distributions in battery cells26 where they are crucial input parameters.
The present study therefore experimentally determines the temperature-dependent thermal conductivity of cubic LLZO using laser flash analysis (LFA). Simultaneous thermal analysis (STA) is applied to determine the temperature dependence of the specific heat capacity, as well as the decomposition temperature of cubic LLZO. The latter is verified by Raman spectroscopy and SEM measurements. Furthermore, the influence of the grain size on the thermal conductivity is discussed by comparing two differently substituted LLZO's (Ta or Al) with clearly different grain sizes.
2 Experimental
Ta-substituted LLZO (LLZO:Ta), nominally without any addition of Al, and Al-substituted LLZO (LLZO:Al, Li6.4Al0.2La3Zr1.6O12) powder were synthesized via a standard solid-state reaction route. Al diffused from the alumina crucible into LLZO:Ta during the sintering step which led to an equivalent composition of Li6.45Al0.05La3Zr1.6Ta0.4O12. The prepared powder was calcinated at 850 °C and 1000 °C in several steps. The material was sintered in a rod at 1175 °C for four hours in air and cut with a low-speed saw (Buehler IsoMet™) in pellets with the required thickness. The preparation process followed the method described by Tsai et al. and can be found in detail in the corresponding publications.27,28The grain size of the samples was determined by scanning electron microscope (SEM) analysis. Prior to measurement, the samples were prepared via a thermal etching process to enhance grain boundary grooving.29,30 For this purpose, the samples were polished with 4000 grit sandpaper and then heated to 1100 °C with a heating rate of 10 K min−1. SEM measurements were performed after cooling. The obtained SEM images were then analyzed with the software ImageJ (version 1.52a) in order to measure the diameter of the visible grains. Despite the fact that SEM analyses of polished and thermally etched surfaces lead to an underestimation of the real grain size, due to the presence of irregular transgranular cuts,30 this method is sufficient to compare the grain size of the examined LLZO:Ta and LLZO:Al.
The crystal phase of the samples was determined by X-ray diffraction (XRD) in air, using a Bruker D 4 Endeavor device with Cu Kα radiation. Measurements were done with sintered pellets of LLZO:Ta and LLZO:Al between 2θ = 10–80° with the Bragg–Brentano geometry. A Rietveld refinement of the measured diffractograms was performed with the software MAUD (version 2.98)31,32 using reference phase data of cubic LLZO from the inorganic crystal structure database (ICSD, Li7La3Zr2O12 #422259).
Measurements of the ionic conductivity were done by electrochemical impedance spectroscopy (EIS) at room temperature with a Biologic VMP-300 from 1 Hz to 7 MHz. Au was sputtered on the samples as a blocking electrode. The measured impedance spectra were analyzed by ZView software.
Raman measurements to evaluate the structural phases of sintered LLZO:Ta and LLZO:Al pellets were carried out in air with a Renishaw InVia Raman microscope in backscattering geometry using a solid-state 532 nm excitation laser and an 1800 l mm−1 grating. The laser power was set to 0.39 mW in order to prevent laser-induced sample damage during the measurement. A 100× objective was chosen, resulting in a laser spot diameter of ∼1 μm.
Simultaneous thermal analysis (STA), which combines differential scanning calorimetry (DSC) and thermogravimetry (TG) were carried out with a NETZSCH STA 449 F5 Jupiter in order to investigate the specific heat capacity (Cp) and decomposition temperature of sintered LLZO:Ta. Sintered LLZO:Ta powder was pressed into a pellet (5 mm diameter) with a uniaxial pressure of 15 kN for 15 min, resulting in a relative density of 55%. The pressed pellet was placed into a Pt crucible with a perforated lid. A connected quadrupole mass spectrometer (QMS, NETZSCH QMS 403 Aeolos Quadro) enables for analysis of evaporated species. Two continuous heating steps were conducted in an argon (Ar) atmosphere (70 ml min−1). During the first heating step, to analyze evaporated species, a heating rate of 20 K min−1 was applied to heat the sample from room temperature (RT) to 1273 K. After cooling down to room temperature again, the sample was heated to 1773 K with 20 K min−1 in the second heating step, to determine the specific heat capacity (Cp; with index p indicating constant pressure), using a sapphire reference following the method described by O'Neill.33
Laser flash measurements were performed with a NETZSCH LFA 457 MicroFlash to assess the temperature-dependent thermal conductivity of LLZO:Ta and LLZO:Al and to investigate the influence of the grain size on this material parameter. The sintered pellets, with a diameter of approximately 10 mm and a thickness of 1.7–2.0 mm were heated for three hours at 1073 K in an Ar-atmosphere before the measurement to remove surface lithium carbonate (Li2CO3). The samples were then coated with graphite on both surfaces to improve their absorption/emission characteristic. Measurements were done within a temperature range from RT to 1225 K in temperature steps of 100 K. The thermal conductivity was calculated employing the procedure introduced by Parker et al.34 using a transparent (radiation) model in the analyzation software provided by the LFA manufacturer (NETZSCH LFA Analysis version 7.1.0).35 The measurements were carried out in a reducing argon/hydrogen (5% H2 in Ar) atmosphere (purge flow of 75 ml min−1) in order to prevent a reaction at elevated temperatures between LLZO, the necessary graphite coating for the LFA measurement and any remaining oxygen in the system. In a technical argon atmosphere (purity grade 4.9), which always contain an amount of oxygen and water, the graphite coating disappeared completely when heating up to 973 K. This led to a partial transmission of the laser flash through the sample so that the LFA signals could not be evaluated anymore. This phenomenon indicates the reaction of LLZO with graphite and oxygen forming lithium carbonate (Li2CO3) at the sample surface, which starts to melt between 925–973 K (compare DSC measurement in Fig. 3a).
3 Results and discussion
3.1 Grain size and density
The grain size of LZZO:Ta and LLZO:Al was determined using SEM analysis of thermally etched samples (Fig. 1a and b). The analysis revealed D10, D50, and D90 percentile values of 5.8 μm, 11.6 μm, and 18.6 μm for LLZO:Ta and 284.2 μm, 512.5 μm, and 909.3 μm for LLZO:Al (see Fig. S1 in ESI†). The true grain size is thought to be slightly larger than the measured grain size, as the cross-section cuts randomly through the grains and the sizing of the visible transgranular cuts leads to the grains size being systematically measured too small.30 However, the analysis revealed clearly different grain sizes for LLZO:Ta and LLZO:Al. The larger grain size for the Al-substituted LLZO, despite both materials being synthesized via the same reaction route and with the same temperature treatment, is attributed to aluminum as substitution cation, which is known to be a sintering aid enhancing grain growth.28,36 The effective density (ρeff) was geometrically determined to 4.62 g cm−3 for LLZO:Ta and 4.68 g cm−3 for LLZO:Al. | ||
| Fig. 1 Top view scanning electron microscope (SEM) images of thermally etched samples of (a) LLZO:Ta and (b) LLZO:Al (10 kV acceleration voltage). | ||
3.2 X-ray diffraction
The diffractograms for Al- and Ta-substituted LLZO correspond well with the cubic garnet-phase Li7La3Zr2O12 (ICSD #422259)37 with space group Iad. The Rietveld refinement with the software MAUD reveals no side phases or impurities in the diffractograms (Fig. 2). It converges for LLZO:Al to Rwp = 8.08%, Rexp = 2.98%, χ2 = Rwp/Rexp = 2.71 and results in a lattice constant of a = 12.950 Å. The final R-values for LLZO:Ta are Rwp = 10.31%, Rexp = 2.95%, χ2 = 3.61 and the lattice constant refines to a = 12.943 Å. The refined lattice constants correspond well with reported results in the literature for LLZO:Al (a = 12.957 Å (ref. 38)) and LLZO:Ta (a = 12.945–12.948 Å (ref. 12, 14 and 38)). Both substitutions cause a slight decrease of the lattice parameter compared to unsubstituted cubic LLZO (a = 12.968 Å (ref. 1) and a = 12.983 Å (ref. 37)). This decrease can be explained by a lattice shrinkage, as the ionic radii of the substitution ions Ta5+ (0.64 Å) and Al3+ (0.53 Å) are smaller than that of the respectively replaced ions Zr4+ (0.72 Å) and Li+ (0.76 Å).39–41
 | ||
| Fig. 2 X-ray diffraction pattern of Al- and Ta-substituted LLZO phase. Data are refined with the Rietveld method. The vertical lines indicate the Bragg reflection positions of cubic garnet-phase Li7La3Zr2O12 (ICSD #422259) with space group Iad. | ||
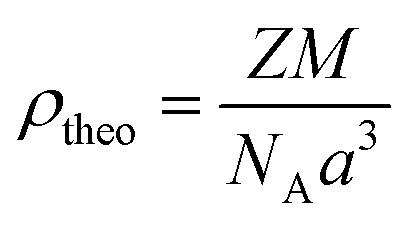
The refined lattice parameters can be used to calculate the theoretical density ρtheo of the investigated material using the following formula:
 | (1) |
| Material | LLZO:Ta | LLZO:Al |
|---|---|---|
| a [Å] | 12.943 | 12.950 |
| M [g mol−1] | 973.16 | 840.97 |
| Z | 8 | 8 |
| ρ theo [g cm−3] | 5.35 | 5.15 |
| ρ eff [g cm−3] | 4.62 | 4.68 |
| ρ rel [%] | 86 | 91 |
3.3 Electrical properties
EIS measurements were conducted at RT to determine the ionic conductivity of LLZO:Ta and LLZO:Al (see Fig. S2 in ESI†). The total ionic conductivity was calculated to 0.696 mS cm−1 for LLZO:Ta and 0.370 mS cm−1 for LLZO:Al which is comparable to other reported LLZO with similar substitutions.9,12,28,42,433.4 Simultaneous thermal analysis
As the calculation of the Cp requires a constant sample mass, a pre-heating step up to 1270 K was applied to the sample prior to the actual measurement, in order to evaporate thermally unstable components (Fig. 3a). | ||
| Fig. 3 (a) Differential scanning calorimetry (DSC) and thermogravimetric (TG) measurements of sintered LLZO:Ta powder upon first heating after exposure to air; (b) with the relative mass spectrum of H2O (m/z = 18) and CO2 (m/z = 44). | ||
Three separate mass loss steps can be identified, resulting in a total mass loss of −2.4%. The first mass loss step of −1.7% between 470 K and 700 K, along with an endothermic peak at 600 K, can be ascribed to the evaporation of H2O molecules inserted in the garnet structure.44 Here, a quadrupole mass spectrometer (QMS) was used to quantify the evaporation of H2O (m/z = 18), which is shown in Fig. 3b. A quantitative assessment of the evaporated water is difficult, as it is influenced by condensation in the DSC equipment and therefore numbers might differ between different nominally identical experiments. The second endothermic peak at 690 K with a subsequent mass loss of −0.2% at 770 K and the emission of H2O (m/z = 18) are suggested to be associated with the melting and decomposition of LiOH.45 The third endothermic peak at 973 K without a mass loss can be assigned to the melting of Li2CO3, present at the LLZO:Ta surface.46,47 The third mass loss step of −0.5% between 1000 K and 1200 K accompanied with a broad endothermic peak in the DSC signal centered at 1157 K is caused by the decomposition of Li2CO3,24,46,48 which results in the emission of CO2 (m/z = 44), as detected by QMS analysis (Fig. 3b). No further weight loss is found beyond 1200 K.
The STA analysis of sintered LLZO:Ta powder suggests the presence of LiOH and Li2CO3 on the LLZO surface.49,50 Here, Xia et al.49 proposed a three-stage mechanism at the LLZO surface upon air exposure: (i) water vapor is adsorbed to sample surface; (ii) Li+/H+ exchange occurs to form LiOH·H2O and hydrated LLZO; and (iii) LiOH·H2O reacts with CO2 to form Li2CO3. During heating, the reaction would take place in reverse order.44
The consecutive heating step up to 1780 K for the actual Cp evaluation of the LLZO:Ta sample results in only a minor mass loss of −0.1% above 1600 K. The constant mass below 1600 K allows for calculating the specific heat capacity Cp of the LLZO:Ta sample (Fig. 4). As Cp is not defined during any phase transitions, such as centered at 1266 K and 1694 K, the derived Cp is only valid for T < 1225 K (inset in Fig. 4). The large endothermic peak centered at 1694 K, is interpreted as the decomposition of the cubic LLZO crystal phase which starts at 1500 K. The determined decomposition enthalpy is 463.5 J g−1. This decomposition was further investigated with Raman and SEM analysis in the following section. The origin of the minor endothermic event at 1266 K with an enthalpy of 12.4 J g−1 is still unclear. However, none of the present components show a common phase transition at this temperature and this peak is not present in comparable measurements with LLZO:Al. Consequently, it can be concluded that this endothermic event does not originate from a Li–Al side phase and it could be an indication that it is related to the tantalum substitution of LLZO. Hwang et al.51 report the reduction of tantalum oxide (Ta2O5) in the presence of magnesium gas, as a reducing agent, for a temperature range of 1173–1223 K. Therefore, the endothermic peak at 1266 K could be related to a partial reduction of Ta2O5 in a lithium enriched atmosphere under the prevailing experimental conditions.
 | ||
| Fig. 4 Thermogravimetric (TG) curve (red) and the derived temperature-dependent specific heat capacity (Cp, cyan) of sintered LLZO:Ta from a DSC measurement in Ar-atmosphere. Inset: closeup to Cp in a temperature range from 300–1225 K with a polynomial fit (eqn (2)). | ||
The specific heat capacity Cp of LLZO:Ta increases from 0.544 J g−1 K−1 at 300 K to 0.771 J g−1 K−1 at 1225 K (inset Fig. 4). The temperature dependence of Cp can be expressed with the following equation in the often used polynomial form52 (dashed black line in inset Fig. 4):
| Cp(T) = a + bT +cT−2 | (2) |
A theoretical estimation of the molar heat capacity (Cp,m) can be done by the Neumann–Kopp rule (NKR). In its primary form, it describes the molar heat capacity of a compound as the, by mass fraction weighted sum of the heat capacities of its components.53 More accurate results can be obtained for binary compounds in a complex form, whereas the heat capacity of complex compounds can be calculated as follows:54–57
| Cp,m(CO) = ∑n(BO)Cp,m(BO) | (3) |
| Cp,m(LLZO:Ta) = 3.225Cp,m(Li2O) + 0.025Cp,m(Al2O3) + 1.5Cp,m(La2O3) + 1.6Cp,m(ZrO2) + 0.2Cp,m(Ta2O5) | (4) |
The molar heat capacities of the binary oxides (Li2O, Al2O3, La2O3, ZrO2, Ta2O5) can be taken from the NIST database.58 The molar heat capacity is converted to the specific heat capacity by division with the molar mass of LLZO:Ta (MLLZO:Ta = 873.16 g mol−1). The estimation of Cp,m by NKR is most accurate at ambient temperature. However, a first estimate of the temperature dependency of Cp,m can be done by taking the temperature-dependent heat capacities of the binary oxides into account. Nonetheless, the accuracy of the estimate is clearly reduced at elevated temperatures.56 For the present material LLZO:Ta, the measured Cp and the estimated Cp by NKR (orange line in inset Fig. 4) coincide well at ambient temperature (difference 1.6%). Both values first diverge for rising temperatures (differences up to 14.3%) but start to converge again for elevated temperatures due to a slightly steeper slope of the Cp curve estimated by NKR. Other reported data for the temperature-dependent heat capacity of LLZO in a temperature range from 300–800 K by Il'ina et al.57 corresponds relatively well with the measurement of the present study (difference of 7%). Differences between the measured Cp and reported data can be related to a varying LLZO substitution, the composition and the exact synthesis method of the sample. The measured values are in excellent agreement with a basic theoretical estimation: assuming a rigorously harmonic crystal lattice approximation, Cp and Cv (constant volume) are identical, and Cv = 3nkB, where n is the number of atoms/ions per volume, and kB = 1.38 × 10⁻²³ J K−1 (Boltzmann's constant).59 A lattice constant of 1.3 nm of a cubic unit cell leads to a cell volume of 2.2 nm3, while the number of atoms/ions is n = 192 (24 ions in the sum formula Li7La3Zr2O12, of which 8 are necessary to create the cubic cell with the lattice constant of 1.3 nm). This leads to Cv = 3.61 J K−1 cm−3, or – by using a density of 5.2 g cm−3 – Cv = 0.69 J g−1 K−1 (see Fig. 4).
3.5 Raman spectroscopy
In order to confirm the assumed decomposition of LLZO:Ta which starts in an argon atmosphere around 1500 K, as derived from DSC measurements (Fig. 4), normalized Raman spectra of LLZO:Ta samples which were heated ex situ in ambient atmosphere up to 1473 K and 1773 K (III and IV in Fig. 5a) are compared to the non-heated sample (II in Fig. 5a). The corresponding SEM images of the respective sample surfaces are shown in Fig. 5b. All samples were polished before the measurement to remove surficial Li2CO3. As the decomposition of LLZO is associated with its cubic crystal phase, the presented results for the heating of LLZO:Ta are thought to be conferrable to LLZO:Al. The measured Raman spectra of the unheated LLZO:Al and LLZO:Ta samples (I and II in Fig. 5a) can both be assigned to the expected cubic garnet-phase of LLZO.16,44,60 Bands between 100–150 cm−1 correspond to the vibration of the heavy La cations.44 The vibrational modes of LiO6 octahedra occur between 200–300 cm−1, while the vibrational modes of LiO4 tetrahedra appear in the range of 300–500 cm−1, as it has been shown for several other lithium metal oxides.61,62 The bands centered at 650 cm−1 correspond to the stretching vibration of ZrO6 octahedra.44,60 The additional bands centered at 740 cm−1 which are only present in Ta substituted LLZO spectra can be allocated to the stretching vibration of TaO6 octahedra.16 | ||
| Fig. 5 (a) Raman spectra and (b) corresponding SEM images of (II) polished LLZO:Ta without heat-treatment (III) polished LLZO:Ta heated up to 1473 K and (IV) polished LLZO:Ta heated up to 1773 K (all with 10 kV acceleration voltage). | ||
The SEM image of the unheated and polished LLZO:Ta sample (I in Fig. 5b) shows a marbled surface, which is related to the surface topography. Some lower surface areas are still – or again - covered with a thin Li2CO3 layer which could not be removed during polishing and which results in a minor Raman signal at 1091 cm−1, due to vibrational modes of CO32−.49,63 The heat treatment of the sample up to 1473 K did not result in a phase change of the LLZO:Ta, as apparent from the Raman spectrum of the heated sample (III in Fig. 5a), which is comparable to the unheated sample (II in Fig. 5a). However, despite a comparable Raman signal, SEM measurements revealed a distinct change of the surface morphology (III in Fig. 5b). After heating, the LLZO grains can be recognized individually, as the result of a grain boundary grooving comparable to a thermal etching process.29,64 The single LLZO grains are partly covered with a thin Li2CO3 layer due to air exposure during cooling, which causes a minor Li2CO3-Raman signal at 1091 cm−1. The heat treatment up to 1773 K led to the decomposition of the highly conductive cubic LLZO phase. The corresponding Raman spectrum (IV in Fig. 5a) shows four major Raman modes at 300, 395, 496, and 513 cm−1, which can be assigned to the pyrochlore La2Zr2O7 (LZ) phase.65,66 This phase change was verified using SEM imaging, where large characteristic pyrochlore crystal phase octahedral crystals (IV in Fig. 5b) were detected.67 The decomposition of LLZO to pyrochlore LZ phase due to lithium loss at elevated temperatures is reported several times in the literature, whereas experimental decomposition temperatures vary in a range from 1523 K (ref. 68) to 1613 K (ref. 23) in air for LLZO without Ta-substitution. Miara et al.69 predict a theoretical decomposition temperature of 1873 K for LLZO:Ta.
3.6 Laser flash analysis
The thermal conductivity (κ) is the product of thermal diffusivity (α), density (ρ) and specific heat capacity (Cp):| κ = αρCp | (5) |
The thermal diffusivity can be determined from the LFA measurements employing the procedure introduced by Parker et al.34 using a transparent (radiation) model.35 For this experiment the density and temperature-dependent specific heat capacity as described above were considered. For the comparison of LLZO:Ta and LLZO:Al, a porosity correction for κ was done with eqn (6),70 which is valid for materials with low emissivity and pore size typical for dense polycrystalline ceramics at temperatures below 1273 K.71
 | (6) |
The comparison of LLZO:Ta and LLZO:Al shows a similar progression of their thermal conductivity, which remains relatively constant at similar values for both materials between RT and 900 K at 1.45–1.55 W m−1 K−1 (Fig. 6). A slight increase for T > 900 K up to 1.60 W m−1 K−1 is detected, whereas LLZO:Al shows a little larger values. Despite the clearly different grain sizes between LLZO:Ta (D50 = 11.6 μm) and LLZO:Al (D50 = 512.5 μm), their thermal conductivity is almost similar. This behavior indicates that the phonon scattering at grain boundaries is negligible, which is expected for ceramics above room temperature.71 The scattering effect of grain boundaries is only important at low temperatures where the phonon mean free path is comparable to the dimension of the sample.71,72
 | ||
| Fig. 6 Temperature dependent thermal conductivity of LLZO:Ta and LLZO:Al (both porosity corrected) determined by laser flash analysis in Ar/H2 atmosphere. The shown data are the mean of five measurements with standard deviation shown as error bars. κmin is the amorphous limit of the thermal conductivity estimated with eqn (8). | ||
In a perfect crystal lattice, the thermal resistance would occur due to phonon–phonon interactions, known as Umklapp processes (U-processes).73 At temperatures above the Debye temperature (Θ), the number of U-processes is approximately proportional to the number of phonons, which is then again proportional to the temperature.74 At these temperatures, the thermal conductivity is controlled by U-processes and shows a T−1 dependency.74 In a real crystal, on the other hand, the thermal conductivity is further reduced by phonon scattering at imperfections (such as impurities, vacancies, dislocations, etc.) in the crystal lattice. This contribution becomes temperature independent for T > Θ. Overall, the total thermal resistivity can be described as the sum of several thermal resistivities caused by different scattering mechanisms, such as U-processes, scattering at grain boundaries and imperfections. Depending on the considered temperature range, each scattering mechanism contributes differently to the total thermal resistivity.74
The LFA measurements in the present study show a relatively constant thermal conductivity of both LLZO for rising temperatures. A possible explanation could be that the phonon mean free path is already in the size range of the interatomic distance in the LLZO crystal lattice, which represents a physically lower limit for the phonon mean free path.71,75 The temperature-dependent mean free path of phonons l(T) can be calculated with the following equation:75
 | (7) |
 | (8) |
 | (9) |
The conducted LFA measurements on LLZO show a slight increase in thermal conductivity up to 1.60 W m−1 K−1 for T > 900 K. This is possibly related to further contributions to the thermal conductivity at high temperatures, such as electronic thermal conduction or radiative heat transfer. Yet, a contribution due to an electronic thermal conduction can be considered negligible for ceramic materials due to their poor electronic conductivity.75 However, conductivity by ions could in principle contribute to the overall thermal conductivity such as in electron conductors. The Wiedemann–Franz law81 is taken into consideration to estimate their potential contribution:
| κ(T) = LσI(T)T | (10) |
Another contribution to the thermal conductivity could be related to a radiative heat transfer, which means that a certain amount of energy is transmitted by radiation through the material.75 The comparison of the detector signals from the LFA measurements, which represent the time-dependent temperature profile at the sample rear surface, reveals first a steplike signal increase followed by the typical time-dependent temperature evolution in LFA measurements (see Fig. S3 in ESI†). The height of this initial step in the detector signal increases for rising temperatures and is more pronounced for LLZO:Al. The steplike signal increase can be interpreted as a radiative heat transport through the sample, which causes an immediate temperature increase at the rear sample surface, and can be fitted with the transparent (radiation) model provided by the LFA manufacturer (NETZSCH LFA Analysis version 7.1.0) (see Fig. S3 in ESI†).35 However, it is thought that the used transparent model cannot fully compensate for the radiative heat contribution. This would lead to an overestimation of the thermal diffusivity, which is the directly derived measurand of the laser flash analysis, and consequently as well of the calculated thermal conductivity. Since the contribution of radiative heat transport increases for rising temperatures, as evident from the larger step height in the detector signal, the derived thermal diffusivity increases as well for temperatures T > 900 K (see Fig. S4 in ESI†). Furthermore, an increasing standard deviation for each material at every measured temperature is apparent in this temperature range. It is thought that the initial signal step also leads to a reduced LFA-signal quality, as the evaluable signal range between step height and the maximum of the signal is shortened, which decreases the goodness of fit of the applied transparent model. The thermal conductivity and diffusivity of LLZO:Al is slightly larger than that of LLZO:Ta (Fig. 6 and S4†), which is consistent with a larger steplike increase for the measurement signals of LLZO:Al (see Fig. S3 in ESI†). The higher radiative heat contribution for LLZO:Al might be related to a larger transmission of the laser flash through the sample, due to the significantly reduced number of grain boundaries in the LLZO:Al sample compared to LLZO:Ta.
A reference measurement was conducted to verify the idea that the used transparent fitting model cannot fully compensate for the radiative heat contribution. Therefore, an Al2O3 reference sample was measured in Ar- and Ar/H2-atmosphere. The measurements in Ar-atmosphere show a rising step height in the detector signal for T > 973 K, which is interpreted as an increasing transmission through the sample by an incremental burning of the carbon coating due to the remaining oxygen in the measurement system (see Fig. S5 in ESI†). No measurements could be evaluated for T > 1073 K because the sample was fully transparent for the laser flash as the carbon coating was completely burned. The burning of the carbon coating could be prevented with the reductive Ar/H2-atmosphere and only a minor step can be seen in the detector signals which remains constant for the whole temperature range (see Fig. S5 in ESI†). The derived thermal diffusivity of Al2O3 is comparable within the accuracy of measurement in both atmospheres for temperatures up to 1025 K (see Fig. S6 in ESI†). As the step height increases, larger thermal diffusivity values tend to be calculated by the applied transparent model (see inset Fig. S6 in ESI†). Especially for large steps in the detector signal, as apparent for the measurement at 1073 K, the calculated thermal diffusivity is significantly higher (+5.7%) compared to the measurement signal with a small step.
The increase of the thermal diffusivity for LLZO:Ta and LLZO:Al after its minimum at 773–873 K is found to be 3.3% and 5.5%, respectively, which is in the same range as detected for Al2O3 (see Fig. S4 in ESI†).
4 Conclusion
Temperature-dependent measurements of the thermal conductivity are discussed for tantalum (Ta)- and aluminum (Al)-substituted LLZO, with both materials showing the highly ion-conductive cubic crystal phase. The effect of the grain size on the thermal conductivity is also considered, as the Al-substitution leads to clearly larger grain sizes when compared to LLZO:Ta. The decomposition of the cubic LLZO phase to pyrochlore La2Zr2O7 was found by DSC measurements to happen between 1500 K and 1750 K and was confirmed by Raman and SEM analysis. The temperature-dependent specific heat capacity (Cp) was experimentally determined by the DSC method for LLZO:Ta and can be expressed with the formula Cp = 0.81–2.27 × 10⁻⁶ × T – 2.24 × 10⁴ × T−2, where T is the absolute temperature. The thermal conductivity (κ) shows a similar progression for LLZO:Ta and LLZO:Al and it remains relatively constant between room temperature and 900 K at κ = 1.45–1.55 W m−1 K−1. This behavior indicates, that neither the substitution-ions (Al or Ta) nor the grain size affects the thermal conductivity. The phonon mean free path was estimated theoretically in this temperature range to be 3.393–2.586 Å, which is several orders of magnitude smaller than the grain size. It can therefore be concluded, that the phonon scattering at grain boundaries is negligible for the present material. The estimated phonon mean free path is in the range of the interatomic distance in the LLZO crystal, which represents a physical lower limit for the phonon mean free path. The determined thermal conductivity for LLZO is only slightly larger than the estimated amorphous limit. Both estimates lead to the conclusion that the phonon contribution to the thermal conductivity becomes temperature independent for high temperatures and the main scattering occurs at inhomogeneities in the crystal lattice, such as occupied and unoccupied Li+-sites or the substitution ions.Author contributions
Julian Neises: conceptualization, investigation, validation, writing – original draft, visualization. Walter Sebastian Scheld: conceptualization, investigation, resources, validation, writing – review and editing. Ah-Ram Seok: investigation, resources, validation. Sandra Lobe: conceptualization, resources. Martin Finsterbusch: conceptualization, resources, supervision, funding acquisition. Sven Uhlenbruck: conceptualization, resources, validation, writing – review and editing, supervision. Roland Schmechel: resources. Niels Benson: conceptualization, writing – review and editing, resources, supervision, funding acquisition.Conflicts of interest
There are no conflicts to declare.Acknowledgements
This work was funded by the German Federal Ministry for Economic Affairs and Energy (BMWi) as part of the OptiKeraLyt project (FKZ: 03ETE016I) and is gratefully acknowledged here. The authors thank Marie-Theres Gerhards for her help with the DSC measurements and Grit Häuschen for the synthesis and preparation of the LLZO samples.References
- R. Murugan, V. Thangadurai and W. Weppner, Angew. Chem., Int. Ed., 2007, 46, 7778–7781 CrossRef CAS PubMed.
- V. Thangadurai and W. Weppner, Adv. Funct. Mater., 2005, 15, 107–112 CrossRef CAS.
- V. Thangadurai and W. Weppner, J. Am. Ceram. Soc., 2005, 88, 411–418 CrossRef CAS.
- E. J. Cussen, J. Mater. Chem., 2010, 20, 5167 RSC.
- C. A. Geiger, E. Alekseev, B. Lazic, M. Fisch, T. Armbruster, R. Langner, M. Fechtelkord, N. Kim, T. Pettke and W. Weppner, Inorg. Chem., 2011, 50, 1089–1097 CrossRef CAS PubMed.
- J. Awaka, N. Kijima, H. Hayakawa and J. Akimoto, J. Solid State Chem., 2009, 182, 2046–2052 CrossRef CAS.
- S. Adams and R. P. Rao, J. Mater. Chem., 2012, 22, 1426–1434 RSC.
- J. D. Percival, PhD thesis, University of Surrey, 2009.
- J. L. Allen, J. Wolfenstine, E. Rangasamy and J. Sakamoto, J. Power Sources, 2012, 206, 315–319 CrossRef CAS.
- N. Janani, C. Deviannapoorani, L. Dhivya and R. Murugan, RSC Adv., 2014, 4, 51228–51238 RSC.
- J. Wolfenstine, J. Ratchford, E. Rangasamy, J. Sakamoto and J. L. Allen, Mater. Chem. Phys., 2012, 134, 571–575 CrossRef CAS.
- Y. Wang and W. Lai, Electrochem. Solid-State Lett., 2012, 15, A68 CrossRef CAS.
- Y. Li, J. T. Han, C. A. Wang, H. Xie and J. B. Goodenough, J. Mater. Chem., 2012, 22, 15357–15361 RSC.
- L. Dhivya and R. Murugan, ACS Appl. Mater. Interfaces, 2014, 6, 17606–17615 CrossRef CAS PubMed.
- S. Ohta, T. Kobayashi and T. Asaoka, J. Power Sources, 2011, 196, 3342–3345 CrossRef CAS.
- T. Thompson, J. Wolfenstine, J. L. Allen, M. Johannes, A. Huq, I. N. David and J. Sakamoto, J. Mater. Chem. A, 2014, 2, 13431–13436 RSC.
- Z. Wang, Q. Su, H. Deng and Y. Fu, ChemElectroChem, 2015, 2, 1292–1297 CrossRef CAS.
- X. Huang, T. Xiu, M. E. Badding and Z. Wen, Ceram. Int., 2018, 44, 5660–5667 CrossRef CAS.
- M. Kotobuki, K. Kanamura, Y. Sato and T. Yoshida, J. Power Sources, 2011, 196, 7750–7754 CrossRef CAS.
- C. Deviannapoorani, S. Ramakumar, N. Janani and R. Murugan, Solid State Ionics, 2015, 283, 123–130 CrossRef CAS.
- K. Tadanaga, R. Takano, T. Ichinose, S. Mori, A. Hayashi and M. Tatsumisago, Electrochem. Commun., 2013, 33, 51–54 CrossRef CAS.
- Y. Cao, Y.-Q. Li and X.-X. Guo, Chin. Phys. B, 2013, 22, 078201 CrossRef CAS.
- H. Geng, K. Chen, D. Yi, A. Mei, M. Huang, Y. Lin and C. Nan, Rare Met. Mater. Eng., 2016, 45, 612–616 CrossRef CAS.
- A. Paolella, W. Zhu, G. Bertoni, S. Savoie, Z. Feng, H. Demers, V. Gariepy, G. Girard, E. Rivard, N. Delaporte, A. Guerfi, H. Lorrmann, C. George and K. Zaghib, ACS Appl. Energy Mater., 2020, 3, 3415–3424 CrossRef CAS.
- C. Shuai, P. Feng, C. Gao, Y. Zhou and S. Peng, Math. Comput. Model. Dyn. Syst., 2013, 19, 1–11 CrossRef.
- R. Bock, M. Onsrud, H. Karoliussen, B. Pollet, F. Seland and O. Burheim, Energies, 2020, 13, 253 CrossRef CAS.
- C. L. Tsai, Q. Ma, C. Dellen, S. Lobe, F. Vondahlen, A. Windmüller, D. Grüner, H. Zheng, S. Uhlenbruck, M. Finsterbusch, F. Tietz, D. Fattakhova-Rohlfing, H. P. Buchkremer and O. Guillon, Sustain. Energy Fuels, 2019, 3, 280–291 RSC.
- C. L. Tsai, E. Dashjav, E. M. Hammer, M. Finsterbusch, F. Tietz, S. Uhlenbruck and H. P. Buchkremer, J. Electroceramics, 2015, 35, 25–32 CrossRef CAS.
- W. W. Mullins, J. Appl. Phys., 1957, 28, 333–339 CrossRef CAS.
- R. E. Chinn, Ceramography: Preparation and Analysis of Ceramic Microstructures, ASM International, 2002 Search PubMed.
- L. Lutterotti and P. Scardi, J. Appl. Crystallogr., 1990, 23, 246–252 CrossRef CAS.
- L. Lutterotti, R. Vasin and H.-R. Wenk, Powder Diffr., 2014, 29, 76–84 CrossRef CAS.
- M. J. O'Neill, Anal. Chem., 1966, 38, 1331–1336 CrossRef.
- W. J. Parker, R. J. Jenkins, C. P. Butler and G. L. Abbott, J. Appl. Phys., 1961, 32, 1679–1684 CrossRef CAS.
- H. Mehling, G. Hautzinger, O. Nilsson, J. Fricke, R. Hofmann and O. Hahn, Int. J. Thermophys., 1998, 19, 941–949 CrossRef CAS.
- Y. Matsuda, A. Sakaida, K. Sugimoto, D. Mori, Y. Takeda, O. Yamamoto and N. Imanishi, Solid State Ionics, 2017, 311, 69–74 CrossRef CAS.
- J. Awaka, A. Takashima, K. Kataoka, N. Kijima, Y. Idemoto and J. Akimoto, Chem. Lett., 2011, 40, 60–62 CrossRef CAS.
- S. Yu, R. D. Schmidt, R. Garcia-Mendez, E. Herbert, N. J. Dudney, J. B. Wolfenstine, J. Sakamoto and D. J. Siegel, Chem. Mater., 2016, 28, 197–206 CrossRef CAS.
- Y. Chen, E. Rangasamy, C. R. Dela Cruz, C. Liang and K. An, J. Mater. Chem. A, 2015, 3, 22868–22876 RSC.
- N. Janani, S. Ramakumar, S. Kannan and R. Murugan, J. Am. Ceram. Soc., 2015, 98, 2039–2046 CrossRef CAS.
- R. D. Shannon, Acta Crystallogr. Sect. A, 1976, 32, 751–767 CrossRef.
- C. L. Tsai, V. Roddatis, C. V. Chandran, Q. Ma, S. Uhlenbruck, M. Bram, P. Heitjans and O. Guillon, ACS Appl. Mater. Interfaces, 2016, 8, 10617–10626 CrossRef CAS PubMed.
- W. Xia, B. Xu, H. Duan, Y. Guo, H. Kang, H. Li and H. Liu, ACS Appl. Mater. Interfaces, 2016, 8, 5335–5342 CrossRef CAS PubMed.
- G. Larraz, A. Orera and M. L. Sanjuán, J. Mater. Chem. A, 2013, 1, 11419–11428 RSC.
- Y. Noda and N. Koga, J. Phys. Chem. C, 2014, 118, 5424–5436 CrossRef CAS.
- Y. Ren, H. Deng, R. Chen, Y. Shen, Y. Lin and C. W. Nan, J. Eur. Ceram. Soc., 2015, 35, 561–572 CrossRef CAS.
- A. Lundblad and B. Bergman, Solid State Ionics, 1997, 96, 173–181 CrossRef CAS.
- R. Ye, C.-L. Tsai, M. Ihrig, S. Sevinc, M. Rosen, E. Dashjav, Y. J. Sohn, E. Figgemeier and M. Finsterbusch, Green Chem., 2020, 22, 4952–4961 RSC.
- W. Xia, B. Xu, H. Duan, X. Tang, Y. Guo, H. Kang, H. Li and H. Liu, J. Am. Ceram. Soc., 2017, 100, 2832–2839 CrossRef CAS.
- S. Uhlenbruck, C. Dellen, S. Möller, S. Lobe, C. L. Tsai, M. Finsterbusch, M. Bram and O. Guillon, Solid State Ionics, 2018, 320, 259–265 CrossRef CAS.
- S.-M. Hwang, J.-P. Wang and D.-W. Lee, Metals, 2019, 9, 205 CrossRef CAS.
- C. H. P. Lupis, Chemical Thermodynamics of Materials, Elsevier Science Publishing Co., Inc, Amsterdam, 1983, pp. 4–6 Search PubMed.
- H. Kopp, Philos. Trans. R. Soc. London, 1865, 155, 71–202 CrossRef.
- L. Qiu and M. A. White, J. Chem. Educ., 2001, 78, 1076 CrossRef CAS.
- J. Leitner, P. Chuchvalec, D. Sedmidubský, A. Strejc and P. Abrman, Thermochim. Acta, 2002, 395, 27–46 CrossRef.
- J. Leitner, P. Voňka, D. Sedmidubský and P. Svoboda, Thermochim. Acta, 2010, 497, 7–13 CrossRef CAS.
- E. A. Il’ina, A. A. Raskovalov and O. G. Reznitskikh, J. Chem. Thermodyn., 2019, 128, 68–73 CrossRef.
- NIST Chemistry WebBook, SRD 69, https://webbook.nist.gov/chemistry/form-ser/, accessed Dezember 2021 Search PubMed.
- N. W. Ashcroft and N. D. Mermin, Solid State Physics, Saunders College Publishing, New York, 1976, pp. 427–492 Search PubMed.
- F. Tietz, T. Wegener, M. T. Gerhards, M. Giarola and G. Mariotto, Solid State Ionics, 2013, 230, 77–82 CrossRef CAS.
- C. Julien, Ionics, 2000, 6, 30–46 CrossRef CAS.
- C. M. Julien and M. Massot, Mater. Sci. Eng. B, 2003, 100, 69–78 CrossRef.
- Y. Li, X. Chen, A. Dolocan, Z. Cui, S. Xin, L. Xue, H. Xu, K. Park and J. B. Goodenough, J. Am. Chem. Soc., 2018, 140, 6448–6455 CrossRef CAS PubMed.
- W. M. Robertson, J. Am. Ceram. Soc., 1981, 64, 9–13 CrossRef CAS.
- L. Kong, I. Karatchevtseva, D. J. Gregg, M. G. Blackford, R. Holmes and G. Triani, J. Am. Ceram. Soc., 2013, 96, 935–941 CrossRef CAS.
- Y. Tong, Y. Wang, Z. Yu, X. Wang, X. Yang and L. Lu, Mater. Lett., 2008, 62, 889–891 CrossRef CAS.
- M. A. Subramanian, G. Aravamudan and G. V. Subba Rao, Prog. Solid State Chem., 1983, 15, 55–143 CrossRef CAS.
- M. Huang, T. Liu, Y. Deng, H. Geng, Y. Shen, Y. Lin and C.-W. Nan, Solid State Ionics, 2011, 204–205, 41–45 CrossRef CAS.
- L. Miara, A. Windmüller, C. L. Tsai, W. D. Richards, Q. Ma, S. Uhlenbruck, O. Guillon and G. Ceder, ACS Appl. Mater. Interfaces, 2016, 8, 26842–26850 CrossRef CAS PubMed.
- J. Francl and W. D. Kingery, J. Am. Ceram. Soc., 1954, 37, 99–107 CrossRef CAS.
- F. R. Charvat and W. D. Kingery, J. Am. Ceram. Soc., 1957, 40, 306–315 CrossRef CAS.
- R. Berman, Contemp. Phys., 1973, 14, 101–117 CrossRef CAS.
- R. Peierls, Ann. Phys., 1929, 395, 1055–1101 CrossRef.
- D. R. Flynn, in Mechanical and Thermal Properties of Ceramics, ed. J. B. J. Wachtman, 1968, pp. 63–113 Search PubMed.
- W. D. Kingery, J. Am. Ceram. Soc., 1955, 38, 251–255 CrossRef CAS.
- J. E. Ni, E. D. Case, J. S. Sakamoto, E. Rangasamy and J. B. Wolfenstine, J. Mater. Sci., 2012, 47, 7978–7985 CrossRef CAS.
- G. J. Redhammer, G. Tippelt, A. Portenkirchner and D. Rettenwander, Crystals, 2021, 11, 721 CrossRef CAS.
- D. G. Cahill and R. O. Pohl, Solid State Commun., 1989, 70, 927–930 CrossRef.
- D. G. Cahill, S. K. Watson and R. O. Pohl, Phys. Rev. B: Condens. Matter Mater. Phys., 1992, 46, 6131–6140 CrossRef CAS PubMed.
- C. Wan, W. Zhang, Y. Wang, Z. Qu, A. Du, R. Wu and W. Pan, Acta Mater., 2010, 58, 6166–6172 CrossRef CAS.
- R. Franz and G. Wiedemann, Ann. der Phys. und Chemie, 1853, 165, 497–531 CrossRef.
- K. K. Lee, A. S. Alexandrov and W. Y. Liang, Eur. Phys. J. B, 2004, 39, 459–468 CrossRef CAS.
- K. Nakata, P. Simon and D. Loss, Phys. Rev. B, 2015, 92, 134425 CrossRef.
- S. Uhlenbruck, B. Büchner, R. Gross, A. Freimuth, A. Maria de Leon Guevara and A. Revcolevschi, Phys. Rev. B: Condens. Matter Mater. Phys., 1998, 57, R5571–R5574 CrossRef CAS.
Footnote |
| † Electronic supplementary information (ESI) available. See https://doi.org/10.1039/d2ta00323f |
| This journal is © The Royal Society of Chemistry 2022 |