
 Open Access Article
 This Open Access Article is licensed under a
 Creative Commons Attribution 3.0 Unported Licence
Hierarchical soot nanoparticle self-assemblies for enhanced performance as sodium-ion battery anodes†
Yuxiao
Cui‡
 a,
Chandrasekar M
Subramaniyam‡
a,
Lengwan
Li
ac,
Tong
Han
b,
Min-A.
Kang
a,
Jian
Li
a,
Luyao
Zhao
a,
Xinfeng
Wei
a,
Anna J.
Svagan
*a and
Mahiar M.
Hamedi
*ac
a,
Chandrasekar M
Subramaniyam‡
a,
Lengwan
Li
ac,
Tong
Han
b,
Min-A.
Kang
a,
Jian
Li
a,
Luyao
Zhao
a,
Xinfeng
Wei
a,
Anna J.
Svagan
*a and
Mahiar M.
Hamedi
*ac
aRoyal Institute of Technology (KTH), Dept. of Fibre and Polymer Technology, Stockholm, SE-100 44, Sweden. E-mail: svagan@kth.se; mahiar@kth.se
bRoyal Institute of Technology (KTH), Dept. of Materials Science and Engineering, Stockholm, SE-114 28, Sweden
cWallenberg Wood Science Center (KTH), Stockholm, SE-114 28, Sweden
First published on 14th March 2022
Abstract
The drawbacks of amorphous hard carbon are its low conductivity and structural instability, due to its large volume change and the occurrence of side reactions with the electrolyte during cycling. Here, we propose a simple and rapid method to address these disadvantages; we used an emulsion solvent–evaporation method to create hierarchically structured microparticles of hard carbon nanoparticles, derived from soot, and multi-walled-carbon-nanotubes at a very low threshold of 2.8 wt%. These shrub-ball like microparticles have well-defined void spaces between different nanostructures of carbon, leading to an increased surface area, lower charge-resistance and side reactions, and higher electronic conductivity for Na+ insertion and de-insertion. They can be slurry cast to assemble Na+ anodes, exhibiting an initial discharge capacity of 713.3 mA h g−1 and showing long-term stability with 120.8 mA h g−1 at 500 mA g−1 after 500 cycles, thus outperforming neat hard carbon nanoparticles by an order of magnitude. Our work shows that hierarchical self-assembly is attractive for increasing the performance of microparticles used for battery production.
Introduction
Carbon materials are promising for battery electrodes because they are cost-effective and electrochemically stable. Soft carbons, containing abundant graphitic regions with a high electronic conductivity, have been largely investigated for anodes; mesophase carbon microbeads are currently used as high-rate anode materials with a reversible capacity of ≈330 mA h g−1 in lithium-ion batteries (LIBs),1 which is close to the theoretical gravimetric specific capacity of graphite (372 mA h g−1).2 Soft carbon, however, delivers a low reversible capacity (typically 100 mA h g−1) as an anode material for sodium-ion batteries (SIBs).3–7 This is mainly because (1) the reversible graphitic intercalating compound NaC6 phase is thermodynamically unstable unlike the stable LiC6 compound in LIBs;8 (2) sodium plating rather forms an irreversible NaC64 compound9 as there is no occurrence of solvent co-intercalation between the graphitic layers (∼0.34 nm) as it is too small to accommodate sodium-ions.10 Consequently, lattice defects and larger interlayer spaces are needed for efficient de/insertion of sodium ions.11–13 Amorphous hard carbons, also known as non-graphitizable carbon, contain plenty of disordered regions with defects and voids, which contribute to high reversible capacities, but have a large initial irreversible capacity loss in SIBs; e.g. commercially available hard carbon has achieved the highest reversible capacity of 240 mA h g−1 at 25 mA g−1.14 However, both reversible capacity and the first cycle efficiency for such amorphous hard carbons are poor, since the disordered structures in hard carbon usually cause low electronic conductivity15–18 and large volume changes.18–21 Particle fracture and loss of electrical contact are also identified reasons for the capacitive fading of amorphous hard carbon based anodes.22The economy of carbon production is another factor that needs to be addressed before a competitive product can be developed.23,24 This entails finding cheaper and better sources of carbon along with synthesis routes, to allow large scale production of the desired morphologies. In this regard, commercially produced carbon, including refined graphite or amorphous carbon, are expensive owing to the high grade of purity and processing required.23 Carbon nanoparticles generated during the burning of candle wax, known as soot nanoparticles (SN), are considered a pollutant.25,26 However, recently Mao et al.27 showed that candle soot nanoparticles might be useful in battery applications, because they comprise amorphous hard carbons28,29 and their fabrication is straightforward and economical. Indeed, flame synthesis is considered as one of the most inexpensive techniques to yield soot derived carbon nanoparticles.30 For these reasons, soot derived from a simple flame synthesis of candle wax, has been used for energy storage.23,28 The average size of soot nanoparticles is in the range of 30–50 nm,30 and they possess some degree of crystallinity. To the best of our knowledge, only Kanakaraj et al. explored the use of soot nanoparticles for SIB applications.29,31 This study, however, lacked the analysis of the Coulombic efficiency for long cycle and rate tests; hence the potential of these soot nanoparticles in SIBs is still not fully characterized, or optimized.
In the present work we used self-assembly, based on a simple and rapid emulsion solvent–evaporation method, to fabricate hierarchical microstructured spheres from hydrophobic candle soot nanoparticles (CSNs) and multi-walled-carbon-nanotubes (MWCNTs) at very low fraction, 2.8 wt%. The amount of MWCNTs is just above the electrical percolation threshold. We then slurry cast the microparticles to assemble SIB anodes. The microspheres exhibited well-defined void spaces between the two types of carbons, leading to an increased surface area, lower charge-resistance, and higher electronic conductivity for sodium-ion insertion and de-insertion. As a result, our anodes exhibit a high rate performance of 120.8 mA h g−1 at 500 mA g−1 for 500 cycles, outperforming neat soot nanoparticles, and are highly suitable for Na+ storage.
Results and discussion
Preparation of hierarchically arranged microstructures, based on primarily nanomaterials, must be rapid, simple and applicable for large-scale production.32–34 In this respect, the self-assembly route is very attractive.35 During self-assembly, molecules seek the lowest energy levels, which in turn depends on the interplay of multiple molecular interactions and energetic and entropic factors.36 The attained hierarchical microstructures, composed of primary nanoparticles, combine favorable characteristics of both nanostructured and microstructured materials.37 We and others have therefore explored self-assembly as an attractive route for optimizing the materials and structures of batteries.38–40Here we make further advances in this direction by using a simple and scalable self-assembly method based on the emulsion solvent–evaporation technique to prepare carbon microparticles for anode production. The different steps of this process are schematically summarized in Fig. 1a. In the first step, the soot and MWCNTs were dispersed in an oil-phase (chloroform). Subsequently, an aqueous phase, containing the surfactant sodium dodecyl sulfate (SDS), was added to the oil phase. By applying shear, the two phases mixed, and the oil was broken into smaller droplets that were surrounded and stabilized by the surfactant SDS. Finally, we evaporated the chloroform to form the microparticles. Non-covalent bonds (e.g. van der Waals) aid in stabilizing the microparticle structures.
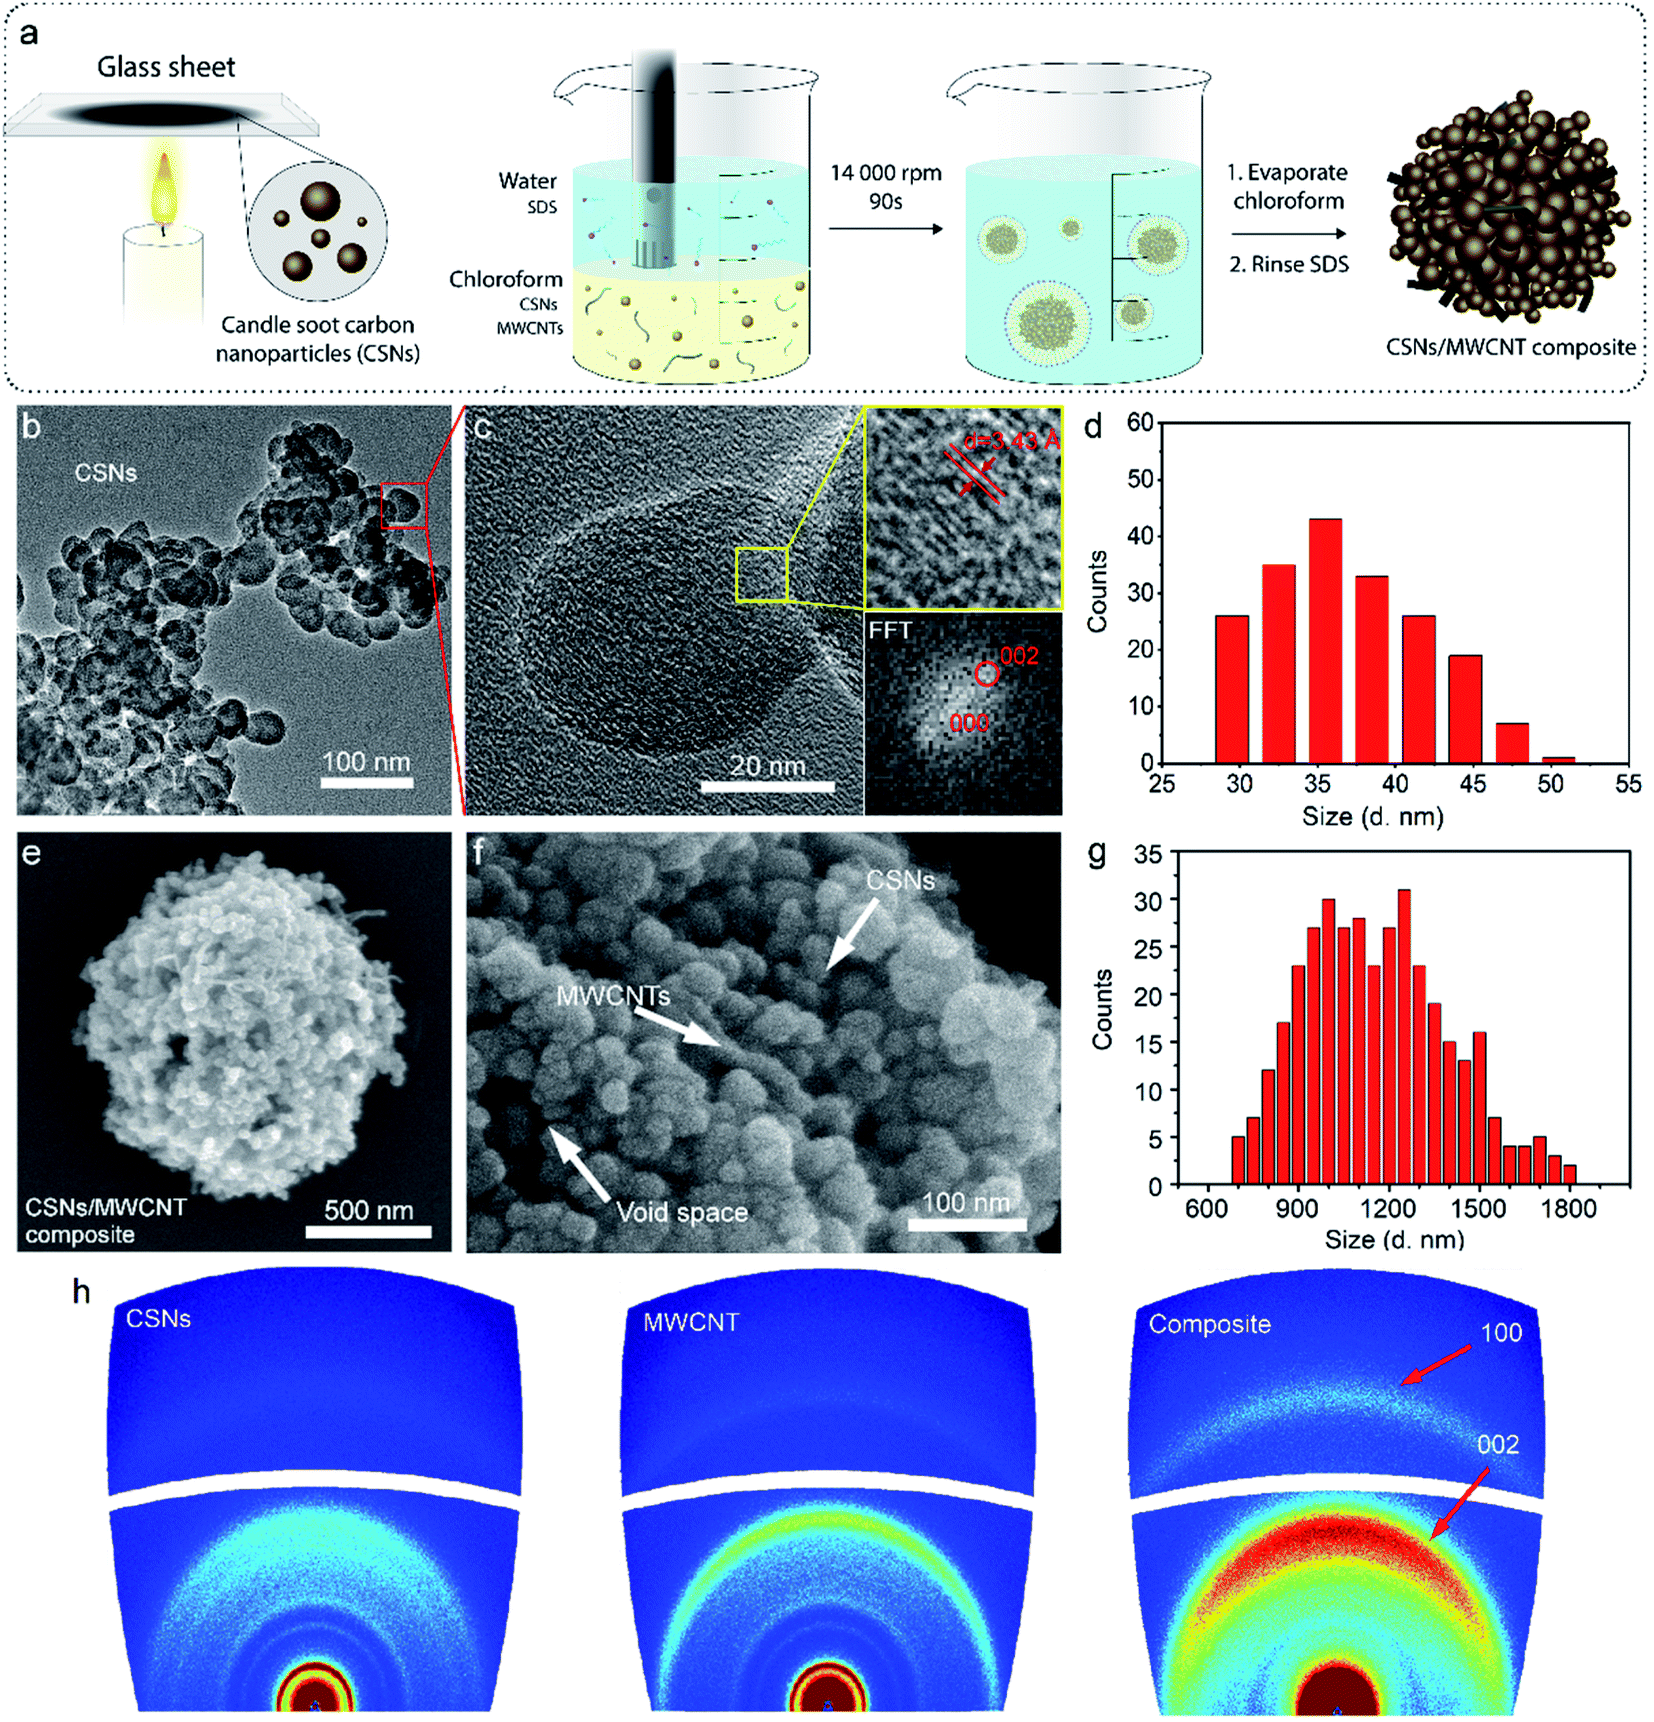 | ||
| Fig. 1 (a) Schematic illustration of the processing step of CSNs/MWCNT composites. (b and c) HR-TEM image of the CSNs at different magnifications; (d) histogram showing the size distribution of CSN nanoparticles (diameter 37.0 ± 5.0 nm), obtained from TEM (n = 190). (e and f) SEM images of a CSNs/MWCNT composite showing the morphology at two different magnifications. In (f) the amorphous hard carbon nanospheres (CSNs) and the conductive carbon nanotubes (MWCNTs) with well-defined interlayer distances and void space can be observed; (g) histogram showing the size distribution of CSNs/MWCNT microparticles (diameter 1.16 ± 0.24 μm), obtained from SEM (n = 368). (h) 2D-WAXD patterns of CSNs, MWCNTs, and the CSNs/MWCNT composite. | ||
We used multi-walled-carbon-nanotubes here to enhance the electrical conductivity of the composite microspheres.41–43 The percolation threshold for electrical conductivity in a nanotube composite strongly depends on the quality of the dispersion of the MWCNTs. We had a very high degree of dispersion and mixing between the particle and therefore achieved a very low percolation threshold with only 2.8 wt% MWCNT loading. A loading of around 2 wt% MWCNT is sufficient for electronic percolations in most carbon nanotube/polymer systems.44–46 The percolation threshold is indicated experimentally by a sudden rise in the conductivity of the composites. Therefore, in the present work, we characterized the morphology of pure soot nanoparticles using high-resolution-transmission-electron-microscopy (HR-TEM), shown in Fig. 1b. The soot nanoparticles had an average diameter of 37.0 ± 5.0 nm (histogram in Fig. 1d, obtained from TEM, n = 190). The carbon nanoparticles were interconnected, forming a branch-like structure, probably due to strong diffusive bonding and/or diffusive adhesion between the nanoparticles, as previously described by Rajkumar et al.29 At higher magnification (Fig. 1c) with HR-TEM, we observed an ordered structure in the short-range but a disordered structure in the long-range, indicative of the amorphous nature of the particle.47 We also observed graphitic fragments with a typical d-spacing of 0.34 nm (inset Fig. 1c), coinciding with powder X-ray diffraction (XRD) results (Fig. S1†).
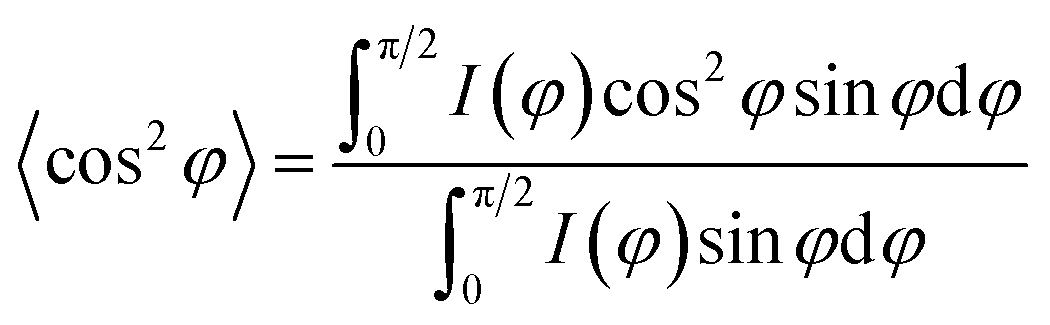
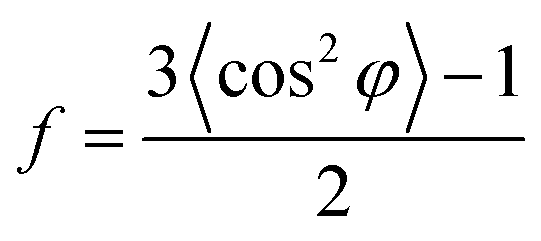
The morphological characteristics of the hierarchical microparticles are found in the SEM micrographs in Fig. 1e and f (also see Fig. S2 and S7 in the ESI†), which clearly show their spherical shape with an average diameter of 1.16 ± 0.24 μm (histogram in Fig. 1g, obtained from SEM, n = 368). The close-up of one microparticle in Fig. 1e and f revealed both CSNs and MWCNTs and the void spaces between them (Fig. 1f), which is desirable for sodium/lithium-ions de-/insertion. The high-resolution transmission-electron-microscopy (HR-TEM) image in Fig. S2† is in good agreement with the SEM image in Fig. 1e, revealing that the carbon nanoparticles are densely packed with voluminous inner spaces. Selected-area-electron-diffraction (SAED) patterns with electron diffraction rings, Fig. S3,† displayed a highly disordered composite and showed no diffraction spots in the dispersed diffraction rings, further proving that the microparticles had the characteristics of amorphous hard carbon. The orientation of the MWCNT inside the microparticles was further investigated with 2D-WAXD, and Fig. 1h shows the 2D-WAXD patterns of CSNs, MWCNTs, and CSNs/MWCNT composites. All three samples showed two diffraction arcs corresponding to the (002) and (100) patterns with a weak orientation. We calculated the Herman's orientation factor f using the following equations,48
 | (1) |
 | (2) |
The Raman spectra in Fig. 2a show that both CSNs and the composite samples exhibit two standard peaks at ∼1340 and 1576 cm−1, corresponding to the D peak (disordered sp3 C atoms or defective graphitic structures) and G peak (sp2 C atoms or crystalline graphite).49,50 The 2D band seen at around 2690 cm−1 in Fig. 2a can be used to evaluate order and is indicative of the presence of a number of graphene layers;51 the CSNs show only the D and G band characteristic peaks and no 2D band peak. The composite, however, shows a clearly distinguishable 2D peak and the additional G peak at around 1582 cm−1, seen by the deconvolution spectrum of the G band in the inset of Fig. 2a. These features reveal that MWCNTs are well-distributed in the composite structure. The XRD and XPS spectra of the CSNs and CSNs/MWCNT composite are included in the ESI (Fig. S1, S4 and S5†), and are also in concordance with the Raman spectra in Fig. 2a. Fig. 2b shows the N2 adsorption/desorption isotherms of the CSN particles and the composite, and Fig. 2c shows the calculated pore size distributions. In a relative pressure range of 0.2–1.0, the adsorption curve for both samples displays an obvious vertical linear region and a clear hysteresis loop in middle and high regions, which belongs to the Type IV isotherm. For the microspheres, the hysteresis loop exhibits a trend of horizontal parallel structures.52 The specific BET surface area and the total pore volume of the CSNs are 88 m2 g−1 and 0.009 cm3 g−1 respectively. For the composite, however these values increased to 195 m2 g−1 and 0.054 cm3 g−1, emanating from the micro/nano hierarchical structures from the carbon nanoparticle (CSN) rearrangement,53–55 which is consistent with the microscopy observations in Fig. 1e and f. In Fig. 2b, both the CSNs and the composites show a pore distribution ranging from 1 to 45 nm; the composite microspheres, however, exhibited more pores in the size range from 2 to 12 nm.
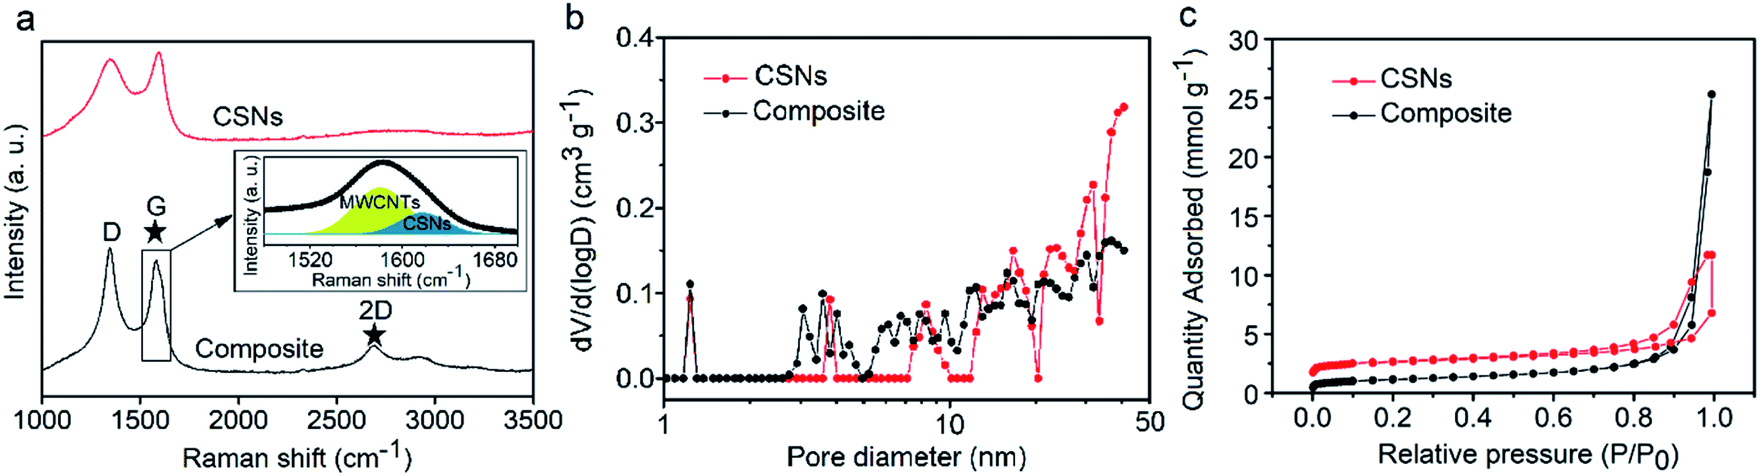 | ||
| Fig. 2 (a) Raman spectra of the CSNs and CSNs/MWCNT composite. Inset in (a): the deconvolution spectrum of the G band in the CSNs/MWCNT composite, showing that the MWCNTs are well-distributed in the composite structure. (b) The pore size distribution plots for the CSNs and CSNs/MWCNT composite and (c) nitrogen adsorption and desorption isotherms. | ||
We hypothesize that the presence of the conductive phase along with a high surface area amorphous phase in the microparticles could potentially accommodate a large volume change upon sodium storage. To test this, we compared the performance of pure soot nanoparticles to that of the composite in half-cell configurations as negative electrodes against sodium metal in a CR2032 type coin cell using 1 M NaPF6 in 1![[thin space (1/6-em)]](https://www.rsc.org/images/entities/char_2009.gif) :1 (v/v) EC/DEC, in the voltage range between 0.002–2 V and at constant current densities. The open circuit voltages (OCVs) of pure CSNs and the composite were 2.48 V and 2.55 V, respectively.
:1 (v/v) EC/DEC, in the voltage range between 0.002–2 V and at constant current densities. The open circuit voltages (OCVs) of pure CSNs and the composite were 2.48 V and 2.55 V, respectively.
Fig. 3a and b shows the charge–discharge and long cycle stability plots obtained at current densities of 50–500 mA g−1 for 500 cycles. We cycled the cells at a low current density of 50 mA g−1 to activate the electrochemical redox sites and facilitate the formation of a stable solid-electrolyte-interface (SEI) essential for long cycle stability. The charge–discharge profiles of both samples differ in their specific capacities in the long run. The soot and microparticle electrodes delivered initial discharge capacities of 710.3 and 720 mA h g−1 with initial Coulombic efficiencies (CEs) of 17.8% and 31.6%, respectively. The first cycle irreversible loss is mainly due to the irreversible formation of Na2O and the solid-electrolyte-interface (SEI) which retains the sodium ions and decomposition of electrolyte at lower voltages as ascertained by cyclic voltammetry (CV) in Fig. 3e. The Coulombic efficiency, CE, improved however in the second cycle to 80.5% and 90.5%, respectively and both cells exhibited 98–99% CEs in the long run of 500 cycles. The microparticles delivered specific capacities of 162, 139.3 and 120.8 mA h g−1 when cycled at 50, 100 and 500 mA g−1 respectively, while the pure soot nanoparticles could manage only 72.1 mA h g−1 after 500 cycles (Fig. 3a). The enhanced specific capacity is attributed to the hierarchical and porous structure of the microparticles, because in both cases the intercalation of Na+ in the interplanar spaces of conducting disordered and ordered graphene structures occurs while the amorphous carbon phase helps accommodating the huge volume change during the intercalation/de-intercalation process.
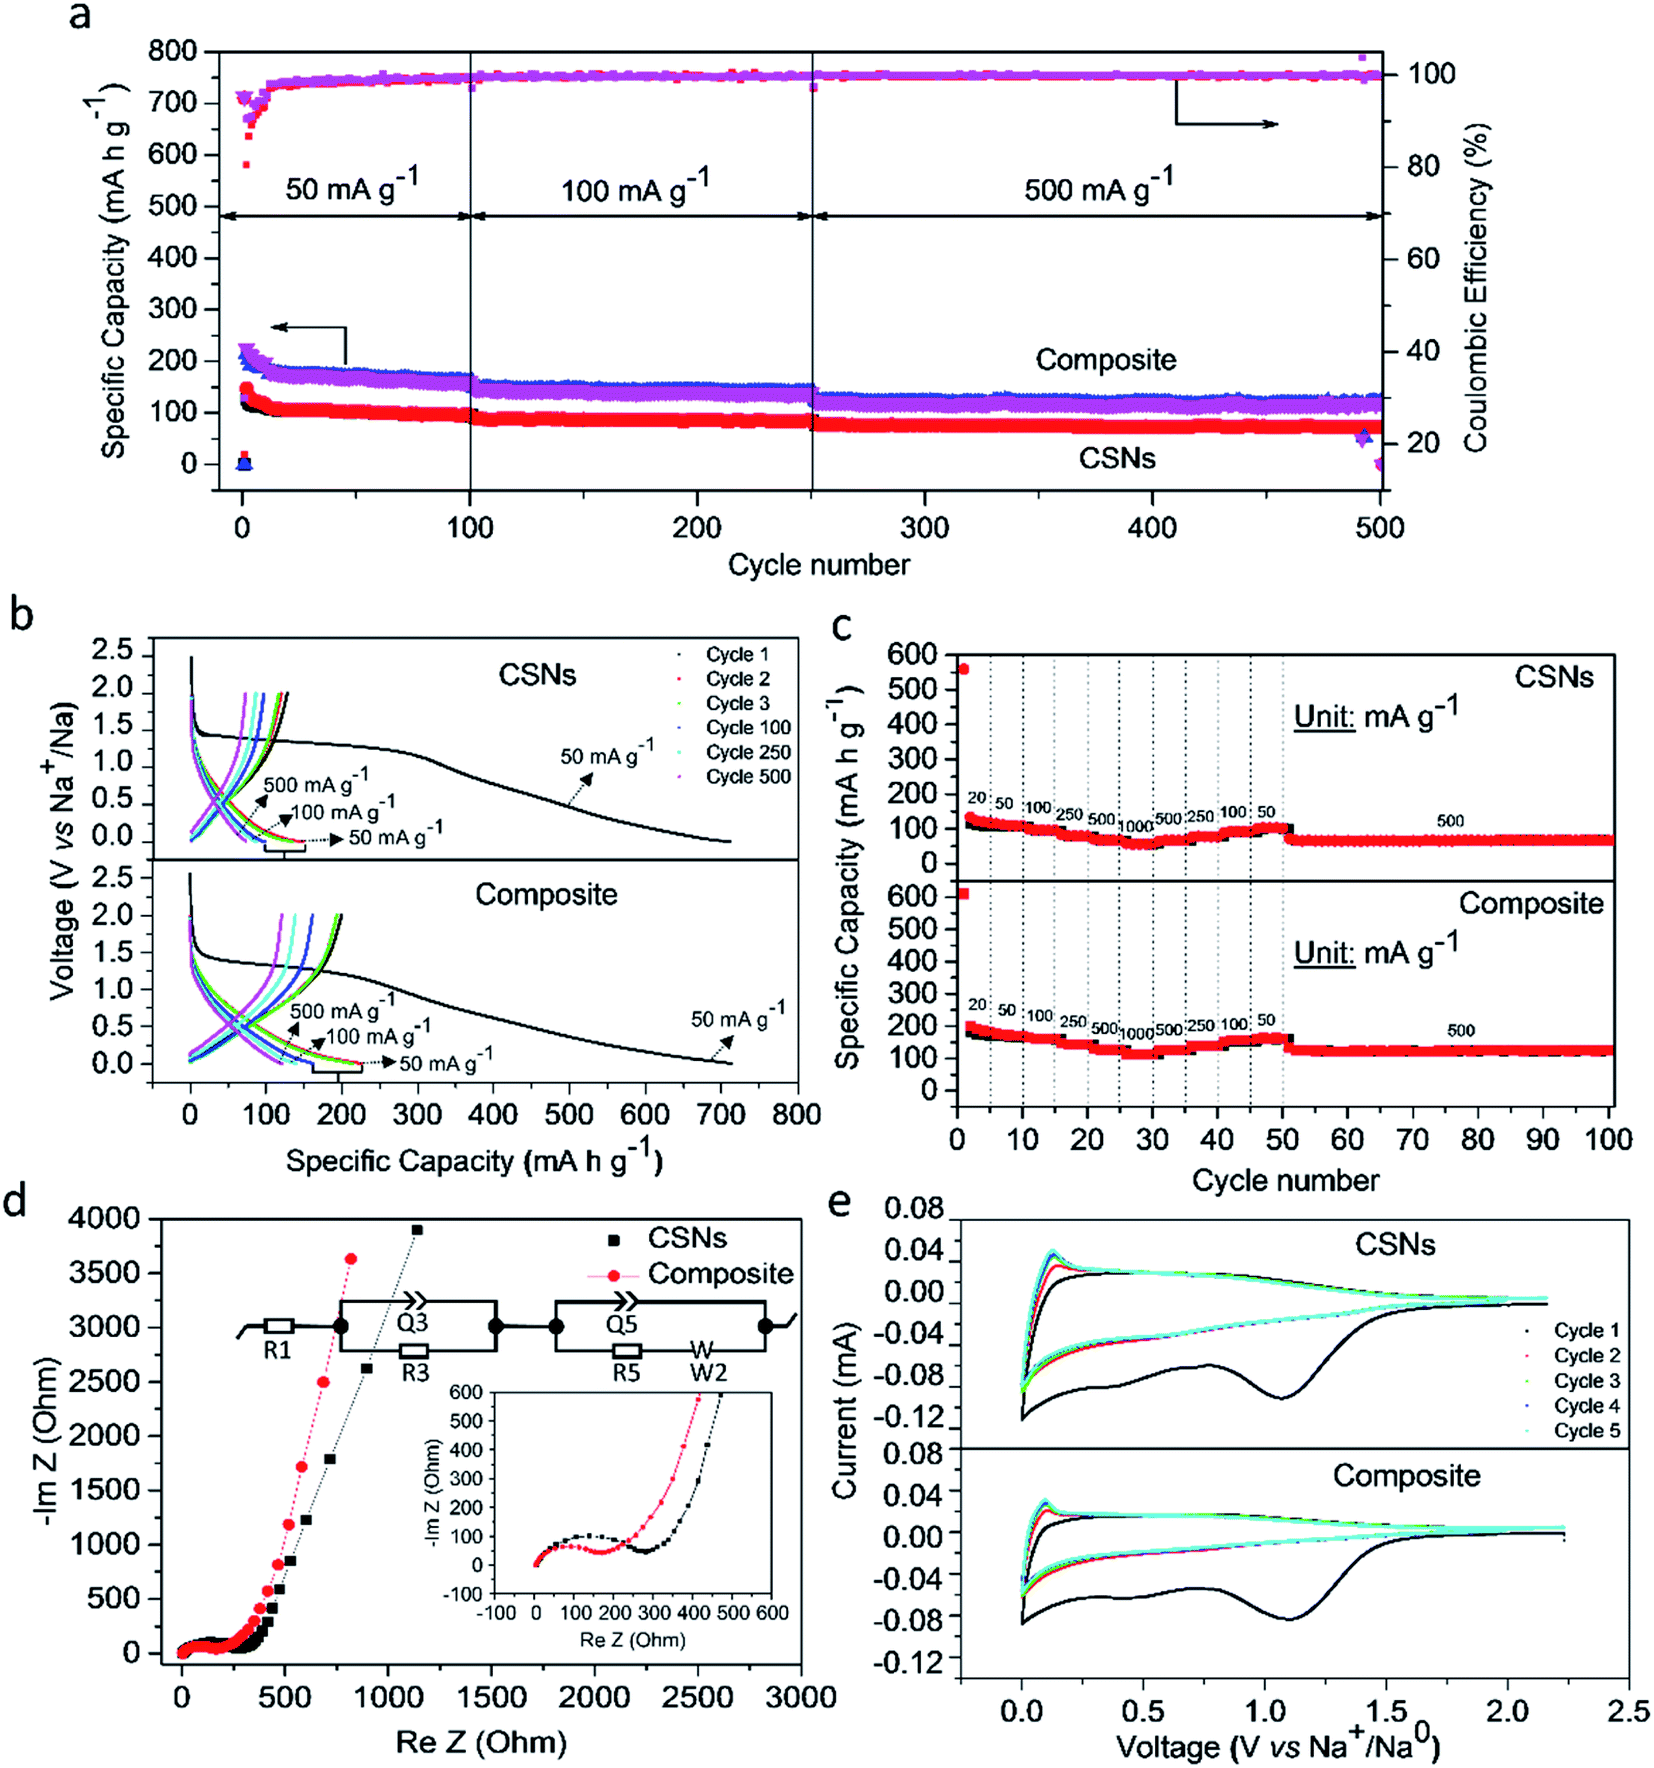 | ||
| Fig. 3 Na-storage performance. (a) Cycling performance of soot nanoparticles and microparticles based on soot nanoparticles/MWCNTs (97.2 wt% soot nanoparticles and 2.8 wt% MWCNTs) at a current density of 50–500 mA g−1; (b) galvanostatic charge/discharge profiles for the 1st, 2nd, 3rd, 100th, 250th and 500th cycles; (c) Rate test at various current densities (mA g−1); (d) impedance Nyquist plots (inset: equivalent circuit); (e) corresponding cyclic voltammetry at 0.1 mV s−1. | ||
We elucidated the kinetics of the electrochemical process using electrochemical-impedance-spectroscopy (EIS) to study the resistance-to-charge-transfer (R5) and calculated the diffusivity of Na+ in the carbon matrix (Fig. 3d). The Nyquist's plots consisted of a semi-circle and an angled line at high and lower frequencies, respectively, which is represented in terms of an equivalent circuit (insert). The latter contains components representing the electrolyte or surface resistance (R1) coupled with its constant phase angle element (Q1), the charge-transfer-resistance (R5), and the Warburg diffusion component (W). For fresh cells, the SEI resistance is not included in the equivalent circuit, as no SEI is formed before cycling. Moreover, the R1 values of soot and microparticles are similar, (4.6 Ω and 4.0 Ω). However, the resistance-to-charge-resistance (R2) of the microparticles were significantly lower (168 Ω) than that of soot particles (277 Ω) indicative of high conductivity as well as a compact connection between the current collector and the active materials.
The inclined line in the low frequency of the Nyquist plot represents the Warburg region used to determine the diffusion coefficient of ions inside the electrode, according to the following equation.56
We elucidated the reason behind long stable cycling by studying the ex situ morphological changes of the composite's electrode after 500 cycles (Fig. 4a–c). Mesoporous carbon nanoparticles undergo huge volume changes upon insertion and de-insertion of sodium ions into their interlayers. The SEM micrographs in Fig. S8,† showed that the composite structures were still present after the large volume change. The size distribution histogram plot of the corresponding microparticles as shown in Fig. 4d represents an apparent 180% size increase from an average diameter of 1.16 μm to 3.26 μm (standard deviation of 0.73, obtained from SEM micrographs, n = 378).
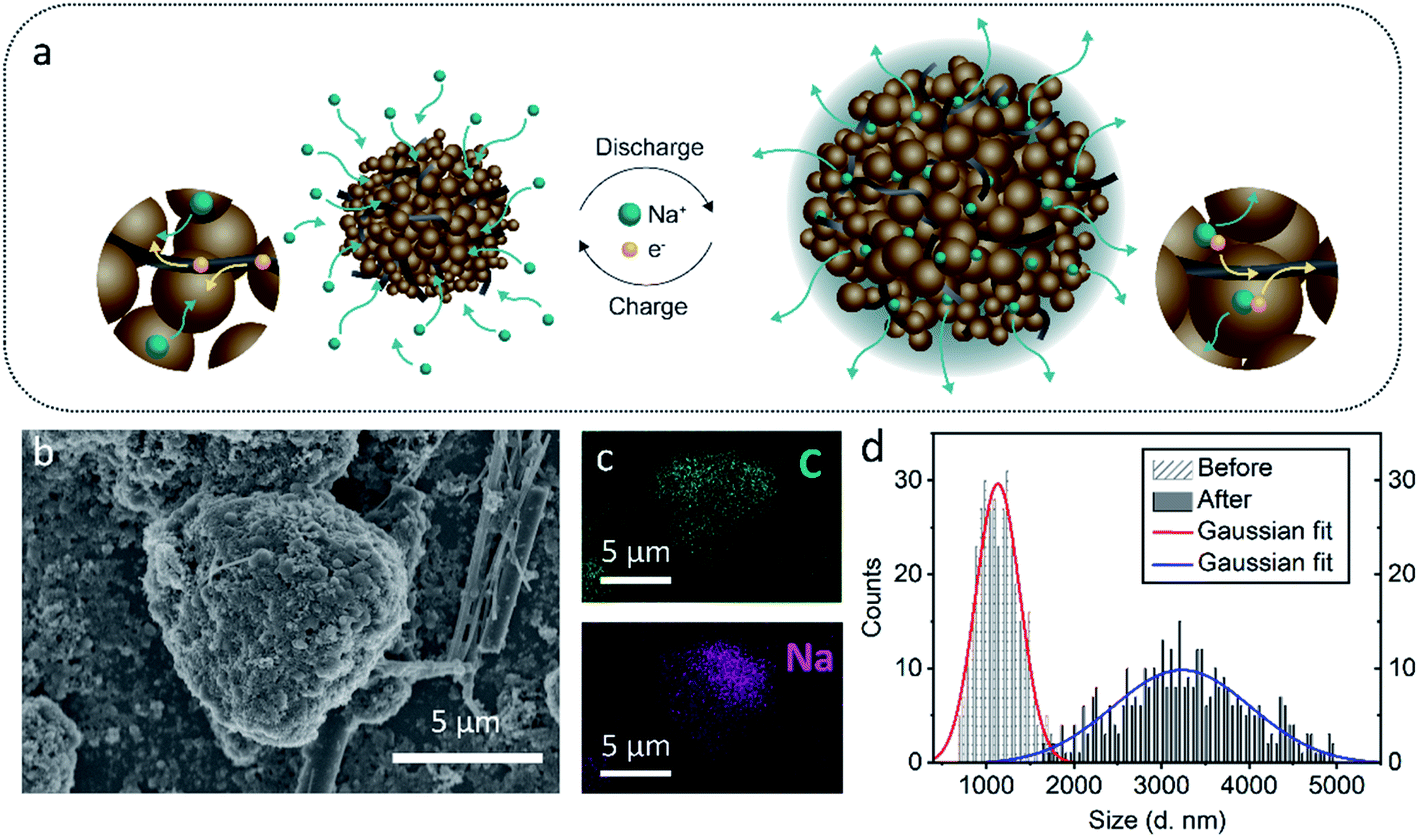 | ||
| Fig. 4 (a) Schematic of one CSNs/MWCNT composite before and after electrochemical cycling; (b) SEM image of the single CSNs/MWCNT composite after cycling showing the size expansion and the EDS analysis in (c) showing presence of carbon and sodium after cycling; (d) histogram showing the particle size (diameter) distribution for the CSNs/MWCNTs before and after cycling. Gaussian distributions are fitted to the histograms (red and blue lines). | ||
The morphological characteristics of the hierarchical microparticle after cycling are shown in the SEM micrographs in Fig. 4b. These were observed after 500 cycles and the nanoparticles were well interconnected with the current-collector. The MWCNTs in the composite reinforce its morphology and may also explain its long stability. The insertion of sodium ions into the composite is confirmed by EDS results for sodium in Fig. 4c. The well-defined void spaces between two kinds of carbons accommodate the volumetric expansion of the CSNs, and potentially also lead to an effective blocking of the electrolyte and limits the majority of SEI formation to the outer surface of the microparticle. Indeed, the apparent size increase (Fig. 4d) might be due to an outer SEI layer.
The electrochemical performances of our CSNs/MWCNT SIB composite anodes are superior to many literature reports (Table S1† and Fig. 5). The plot Fig. 5 shows the comparative electrochemical performance of reported literature values wherein we extracted the representative data for either similar spherical morphology or for amorphous hard carbon.18,57–65 We concluded that our composite design outperformed in terms of the first discharge cycle, rate test and long cycle stability/retention of 500 cycles even at a high current density of 500 mA g−1 as a benchmark against other state-of-art-electrodes for SIB anodes. More elaborate comparison is listed in the ESI (Table S1†). Also, when tested as a lithium anode, the composite electrode showed an excellent cyclability of 491.4 mA h g−1 at 100 mA g−1 after 80 cycles (Fig. S9†).
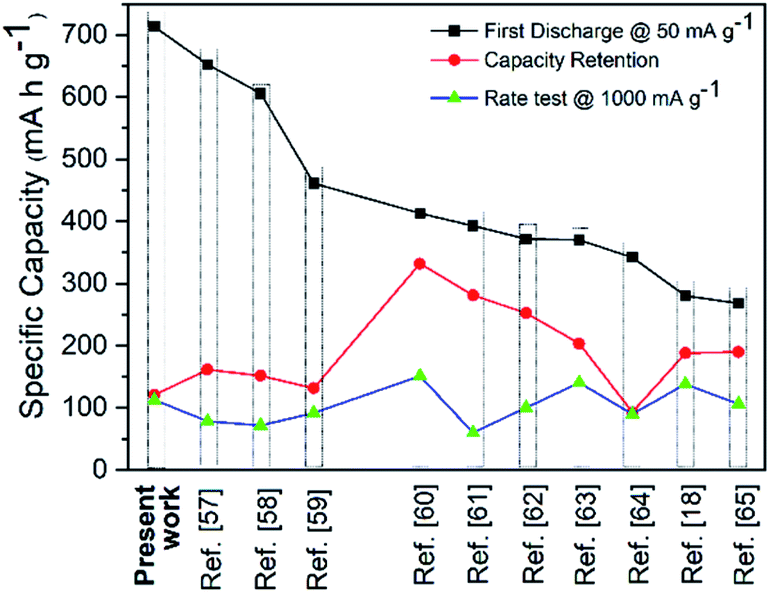 | ||
| Fig. 5 A comparison of CSNs/MWCNT microsphere Na-ion battery performance with literature reports extracted from Table S1.† | ||
Conclusions
We presented a simple and rapid emulsion solvent–evaporation method to fabricate hierarchical microparticles from candle soot nanoparticles (CSNs) and multi-walled carbon nanotubes (MWCNTs). These mesoporous carbon microparticles were used as sodium-ion battery anodes and showed three distinct advantages: (1) the multi-walled-carbon-nanotubes functioned both as an electrical highway and backbone providing mechanical integrity, (2) the nanosized primary particle size prevented fracture upon the large volume change caused by sodium insertion and de-insertion, (3) the secondary structure of the microparticles potentially limited the formation of a solid-electrolyte-interface on their surface instead of on individual nanoparticles, retaining the internal void space for nanoparticle expansion. These features combined resulted in improved electrochemical performance with a capacity retention of 120.8 even after 500 cycles at 500 mA g−1 and a high-rate capability of 112.5 mA h g−1 at 1000 mA g−1, making the material comparable with previously described carbon-based SIB anodes. Our materials showed good rates and long cycle stability at 500 mA g−1. However, the initial Coulombic Efficiency (CE) is still low (31.6%). This is because the candle soot may contain some impurities from the initial collection, as discussed in recent reports,28,29 and consequent work should increase the quality of these particles.More importantly, future work should draw inspiration from this study in using self-assembly as a strategy to mass-produce microparticles for battery slurries, with hierarchical nanostructures engineered for optimum performance.
Author contributions
Y. C. and C. M. S. refined the microparticle synthesis and the battery experiments, respectively, based on the idea by A. J. S. and Y. C. A. J. S. supervised and designed the microparticle synthesis and M. M. H supervised the batteries' experimental outline. Y. C. and C. M. S. together analyzed the data and wrote the manuscript and critical revision was performed by A. J. S. and M. M. H; L. L. collected 2D-WAXD patterns/XRD patterns; T. H. performed surface area BET analysis; M. K. performed Raman experiments; J. L. collected the HR-TEM/SAED patterns; L. Z. and X. W. performed some experiments and helped Y. C. to analyze the data.Conflicts of interest
There are no conflicts to declare.Acknowledgements
Y. C. and A. J. S. thank Åforsk (grant: 18-371), and M. K. thanks Åforsk (grant: 18-461) and M. M. H. thank Energimyndigheten (grant: 48489-1) for financial support. Eric Tam at the Chalmers University of Technology is acknowledged for performing and helping with interpretation of XPS. M. M. H. and C. M. S. acknowledge the Wallenberg foundation for funding. L. L. acknowledged the Treesearch Research Infrastructure and financial support of the WAXD analysis at the Research Institutes of Sweden (RISE).References
- F. M. Courtel, S. Niketic, D. Duguay, Y. Abu-Lebdeh and I. J. Davidson, J. Power Sources, 2011, 196, 2128–2134 CrossRef CAS.
- R. S. Treptow, J. Chem. Educ., 2003, 80, 1015 CrossRef CAS.
- S. Wenzel, T. Hara, J. Janek and P. Adelhelm, Sci, 2011, 4, 3342–3345 CAS.
- V. G. Pol, E. Lee, D. Zhou, F. Dogan, J. M. Calderon-Moreno and C. S. Johnson, Electrochim. Acta, 2014, 127, 61–67 CrossRef CAS.
- Z. Zhang, Y. Du, Q.-C. Wang, J. Xu, Y.-N. Zhou, J. Bao, J. Shen and X. Zhou, Angew. Chem., Int. Ed., 2020, 59, 17504–17510 CrossRef CAS PubMed.
- X. Xu, L. Si, X. Zhou, F. Tu, X. Zhu and J. Bao, J. Power Sources, 2017, 349, 37–44 CrossRef CAS.
- E. Gu, S. Liu, Z. Zhang, Y. Fang, X. Zhou and J. Bao, J. Alloys Compd., 2018, 767, 131–140 CrossRef CAS.
- Z. Wang, S. M. Selbach and T. Grande, RSC Adv., 2014, 4, 4069–4079 CAS.
- W. Luo, F. Shen, C. Bommier, H. Zhu, X. Ji and L. Hu, Acc. Chem. Res., 2016, 49, 231–240 CrossRef CAS PubMed.
- J. Liu, Y. Zhang, L. Zhang, F. Xie, A. Vasileff and S. Z. Qiao, Adv. Mater., 2019, 31, 1901261 CrossRef PubMed.
- Q. Wang, X. Zhu, Y. Liu, Y. Fang, X. Zhou and J. Bao, Carbon, 2018, 127, 658–666 CrossRef CAS.
- Q. Wang, X. Ge, J. Xu, Y. Du, X. Zhao, L. Si and X. Zhou, ACS Appl. Energy Mater., 2018, 1, 6638–6645 CrossRef.
- X. L. Bin Cao, Acta Phys.-Chim. Sin., 2020, 36, 1905003 Search PubMed.
- S. Komaba, W. Murata, T. Ishikawa, N. Yabuuchi, T. Ozeki, T. Nakayama, A. Ogata, K. Gotoh and K. Fujiwara, Adv. Funct. Mater., 2011, 21, 3859–3867 CrossRef CAS.
- Z.-L. Yu, S. Xin, Y. You, L. Yu, Y. Lin, D.-W. Xu, C. Qiao, Z.-H. Huang, N. Yang, S.-H. Yu and J. B. Goodenough, J. Am. Chem. Soc., 2016, 138, 14915–14922 CrossRef CAS PubMed.
- S. Xin, Y.-G. Guo and L.-J. Wan, Acc. Chem. Res., 2012, 45, 1759–1769 CrossRef CAS PubMed.
- F. Xie, Z. Xu, Z. Guo and M. M. Titirici, Progress in Energy, 2020, 2, 042002 CrossRef.
- P. Lu, Y. Sun, H. Xiang, X. Liang and Y. Yu, Adv. Energy Mater., 2018, 8, 1702434 CrossRef.
- N. Sun, Q. Zhu, B. Anasori, P. Zhang, H. Liu, Y. Gogotsi and B. Xu, Adv. Funct. Mater., 2019, 29, 1906282 CrossRef CAS.
- K. Wang, Y. Xu, Y. Li, V. Dravid, J. Wu and Y. Huang, J. Mater. Chem. A, 2019, 7, 3327–3335 RSC.
- A. Agrawal, K. Biswas, S. K. Srivastava and S. Ghosh, J. Solid State Electrochem., 2018, 22, 3443–3455 CrossRef CAS.
- Y. Zhao, L. P. Wang, M. T. Sougrati, Z. Feng, Y. Leconte, A. Fisher, M. Srinivasan and Z. Xu, Adv. Energy Mater., 2017, 7, 1601424 CrossRef.
- M. R. Mulay, A. Chauhan, S. Patel, V. Balakrishnan, A. Halder and R. Vaish, Carbon, 2019, 144, 684–712 CrossRef CAS.
- J. F. Peters, A. Peña Cruz and M. Weil, Batteries, 2019, 5, 10 CrossRef CAS.
- C. Huynh, H. Savolainen, T. Vu-Duc, M. Guillemin and F. Iselin, Sci. Total Environ., 1991, 102, 241–251 CrossRef CAS.
- R. Bentley and I. Bergman, Ann. Occup. Hyg., 1970, 13, 109–113 CAS.
- H. Liu, T. Ye and C. Mao, Angew. Chem., 2007, 119, 6593–6595 CrossRef.
- M. Kakunuri and C. S. Sharma, Electrochim. Acta, 2015, 180, 353–359 CrossRef CAS.
- R. Kanakaraj and C. Sudakar, J. Power Sources, 2020, 458, 228064 CrossRef CAS.
- A. Gangadharan, S. Mamidi, C. S. Sharma and T. N. Rao, Mater. Today Commun., 2020, 23, 100926 CrossRef CAS.
- X. Wang, L. Qi and H. Wang, Ionics, 2020, 26, 4533–4542 CrossRef CAS.
- K. Ming, X. Bi and J. Wang, Int. J. Plast., 2019, 113, 255–268 CrossRef CAS.
- D. Ebert and B. Bhushan, J. Colloid Interface Sci., 2012, 368, 584–591 CrossRef CAS PubMed.
- G. Zhang, Q. Xu, Y. Liu, Q. Qin, J. Zhang, K. Qi, J. Chen, Z. Wang, K. Zheng and K. Świerczek, Electrochim. Acta, 2020, 332, 135500 CrossRef CAS.
- O. Jurček, E. Kalenius, P. Jurček, J. M. Linnanto, R. Puttreddy, H. Valkenier, N. Houbenov, M. Babiak, M. Peterek and A. P. Davis, Cell Rep. Phys. Sci., 2021, 2, 100303 CrossRef.
- J.-P. Sauvage, Transition metals in supramolecular chemistry, John Wiley & Sons, 2008 Search PubMed.
- Y. Luo, D. Huang, C. Liang, P. Wang, K. Han, B. Wu, F. Cao, L. Mai and H. Chen, Small, 2019, 15, 1804706 CrossRef PubMed.
- M. Hamedi, R. Forchheimer and O. Inganäs, Nat. Mater., 2007, 6, 357–362 CrossRef CAS PubMed.
- Z. Wang, A. VahidMohammadi, L. Ouyang, J. Erlandsson, C. W. Tai, L. Wågberg and M. M. Hamedi, Small, 2021, 17, 2006434 CrossRef CAS PubMed.
- E. Pomerantseva, F. Bonaccorso, X. Feng, Y. Cui and Y. Gogotsi, Science, 2019, 366, 969 CrossRef PubMed.
- J. Li, P. C. Ma, W. S. Chow, C. K. To, B. Z. Tang and J. K. Kim, Adv. Funct. Mater., 2007, 17, 3207–3215 CrossRef CAS.
- J. Sandler, J. Kirk, I. Kinloch, M. Shaffer and A. Windle, Polymer, 2003, 44, 5893–5899 CrossRef CAS.
- B. Vigolo, C. Coulon, M. Maugey, C. Zakri and P. Poulin, Science, 2005, 309, 920–923 CrossRef CAS PubMed.
- S. Maiti, S. Suin, N. K. Shrivastava and B. Khatua, J. Appl. Polym. Sci., 2013, 130, 543–553 CrossRef CAS.
- X. Fu, A. M. Al-Jumaily, M. Ramos and C. Yi-Feng, J. Mater. Res., 2018, 33, 3398–3407 CrossRef CAS.
- S. Kobayashi and K. Müllen, Encyclopedia of Polymeric Nanomaterials-With 2021 Figures and 146 Tables, Springer, 2015 Search PubMed.
- J. Chen, B. Yang, H. Li, P. Ma, J. Lang and X. Yan, J. Mater. Chem. A, 2019, 7, 9247–9252 RSC.
- P. H. Hermans and P. Platzek, Kolloid-Z., 1939, 88, 68–72 CrossRef CAS.
- R. Hao, Y. Yang, H. Wang, B. Jia, G. Ma, D. Yu, L. Guo and S. Yang, Nano Energy, 2018, 45, 220–228 CrossRef CAS.
- L. Malard, M. A. Pimenta, G. Dresselhaus and M. Dresselhaus, Phys. Rep., 2009, 473, 51–87 CrossRef CAS.
- J. Ding, H. Wang, Z. Li, A. Kohandehghan, K. Cui, Z. Xu, B. Zahiri, X. Tan, E. M. Lotfabad and B. C. Olsen, ACS Nano, 2013, 7, 11004–11015 CrossRef CAS PubMed.
- C. Wang, D. Li, T. Zhai, H. Wang, Q. Sun and H. Li, Energy Storage Mater., 2019, 23, 499–507 CrossRef.
- Z. Guo, X. Zheng, D. Tian, Y. Song, J. Zhai, X. Zhang, W. Li, X. Wang, S. Dou and L. Jiang, Nanoscale, 2014, 6, 12822–12827 RSC.
- J. Zai, X. Qian, K. Wang, C. Yu, L. Tao, Y. Xiao and J. Chen, CrystEngComm, 2012, 14, 1364–1375 RSC.
- P.-S. Tsai, Y.-M. Yang and Y.-L. Lee, Nanotechnology, 2007, 18, 465604 CrossRef PubMed.
- C. M. Subramaniyam, N. Srinivasan, Z. Tai, H. K. Liu, J. B. Goodenough and S. X. Dou, J. Mater. Chem. A, 2017, 5, 7345–7354 RSC.
- F. Wu, M. Zhang, Y. Bai, X. Wang, R. Dong and C. Wu, ACS Appl. Mater. Interfaces, 2019, 11, 12554–12561 CrossRef CAS PubMed.
- L. Suo, J. Zhu, X. Shen, Y. Wang, X. Han, Z. Chen, Y. Li, Y. Liu, D. Wang and Y. Ma, Carbon, 2019, 151, 1–9 CrossRef CAS.
- Z. Zhu, F. Liang, Z. Zhou, X. Zeng, D. Wang, P. Dong, J. Zhao, S. Sun, Y. Zhang and X. Li, J. Mater. Chem. A, 2018, 6, 1513–1522 RSC.
- T. K. Kumaresan, S. A. Masilamani, K. Raman, S. Z. Karazhanov and R. Subashchandrabose, Electrochim. Acta, 2021, 368, 137574 CrossRef CAS.
- Q. Zhang, X. Deng, M. Ji, Y. Li and Z. Shi, Ionics, 2020, 26, 4523–4532 CrossRef CAS.
- J. Wang, L. Yan, Q. Ren, L. Fan, F. Zhang and Z. Shi, Electrochim. Acta, 2018, 291, 188–196 CrossRef CAS.
- Y. Zhang, X. Li, P. Dong, G. Wu, J. Xiao, X. Zeng, Y. Zhang and X. Sun, ACS Appl. Mater. Interfaces, 2018, 10, 42796–42803 CrossRef CAS PubMed.
- Z. Zhuang, Y. Cui, H. Zhu, Y. Shi and Q. Zhuang, J. Electrochem. Soc., 2018, 165, A2225 CrossRef CAS.
- Y. Sun, P. Lu, X. Liang, C. Chen and H. Xiang, J. Alloys Compd., 2019, 786, 468–474 CrossRef CAS.
Footnotes |
| † Electronic supplementary information (ESI) available. See DOI: 10.1039/d1ta10889a |
| ‡ Equally contributed to the work. |
| This journal is © The Royal Society of Chemistry 2022 |