 Open Access Article
Creative Commons Attribution 3.0 Unported Licence
Structural dynamics of Schottky and Frenkel defects in ThO2: a density-functional theory study†
Samuel
Moxon
 a,
Jonathan
Skelton
 *b,
Joshua S.
Tse
 a,
Joseph
Flitcroft
ab,
A.
Togo
d,
David J.
Cooke
a,
E.
Lora da Silva
c,
Robert M.
Harker
e,
Mark T.
Storr
e,
Stephen C.
Parker
a,
Joseph
Flitcroft
ab,
A.
Togo
d,
David J.
Cooke
a,
E.
Lora da Silva
c,
Robert M.
Harker
e,
Mark T.
Storr
e,
Stephen C.
Parker
 f and
Marco
Molinari
 *a
*a
aDepartment of Chemical Sciences, University of Huddersfield, Queensgate, Huddersfield, HD1 3DH, UK. E-mail: m.molinari@hud.ac.uk
bDepartment of Chemistry, University of Manchester, Manchester M13 9PL, UK. E-mail: jonathan.skelton@manchester.ac.uk
cIFIMUP, Department of Physics and Astronomy, Faculty of Science, University of Porto, 4169-007, Porto, Portugal
dNational Institute for Materials Science (NIMS), 1-2-1 Sengen, Tsukuba, Ibaraki 305-0047, Japan
eAWE Aldermaston, Reading, RG7 4PR, UK
fDepartment of Chemistry, University of Bath, Claverton Down, Bath, BA2 7AY, UK
First published on 7th January 2022
Abstract
Thorium dioxide (ThO2) is a promising alternative to mixed-oxide nuclear fuels due to its longer fuel cycle and resistance to proliferation. Understanding the thermal properties, in particular the thermal conductivity, under reactor conditions is critical to the success of any candidate fuel material. ThO2 has a higher thermal conductivity and thus a lower operating temperature than other fuel systems. However, the presence of defects in real materials directly influences the structural dynamics and physical properties, and the impact of defects on the properties of ThO2 is largely unexplored. We have employed density-functional theory calculations to study the structure and energetics of the intrinsic Schottky and Frenkel defects in ThO2 and their impact on the thermophysical properties. We identify the anion Frenkel defect to be the most stable, and we identify characteristic spectral signatures of the defects in the phonon dispersions and infrared spectra. We further employ two approximate models to assess the impact of the defects on the thermal transport and find that both types of defect are predicted significantly to reduce the thermal conductivity. The methodology we present facilitates the prediction of the thermophysical and transport properties of defective materials at an atomistic level, and should be readily transferrable to existing and in-development nuclear fuel systems.
I. Introduction
As fossil fuels are phased out in favour of renewable energy to limit global warming,1 nuclear power plays an increasingly critical role in meeting worldwide energy demand. Thorium-based fuels are ideal candidates to address this challenge, due to the potential safety and economic benefits compared to more traditional actinide-dioxide fuels such as UO2. ThO2 can be used in mixed-oxide (MOX) fuels with uranium or plutonium to improve reactor safety, as its higher thermal conductivity results in a lower operating temperature and prevents overheating.2,3 ThO2 also reduces the risk of proliferation and the amount of highly radioactive spent fuel waste generated. Indeed, due to its large domestic supply of thorium (up to a third of global reserves),3 India has positioned itself to take full advantage of these benefits by aiming to use ThO2 in advanced heavy water reactors (AHWRs).4A complete understanding of the thermophysical properties of ThO2 is critical to controlling fuel performance at the high temperatures and pressures in nuclear reactors. An important consideration here is the defect chemistry. The energy release associated with nuclear events in reactors can generate large non-equilibrium concentrations of defects, and these can have a direct influence on the physical properties. Since experimental measurements on ThO2 are challenging, computational modelling using first-principles methods such as density-functional theory (DFT), in conjunction with modern high-performance computing (HPC), plays a key role in contemporary nuclear research, particularly when atomistic or nanoscale details are required.5
Under ambient conditions ThO2 is non-magnetic with a cubic structure in the Fm![[3 with combining macron]](https://www.rsc.org/images/entities/char_0033_0304.gif) m space group (no. 225).6–10 A phase transition to an orthorhombic Pnma structure (no. 62) begins at 20–30 GPa6–9 and completes at above 1000 K and 30 GPa.11 As Mott insulators, the thermal transport in ThO2 and other actinide oxides is controlled by heat transport through phonons.12,13 The thermal conductivity is however generally low for oxide materials due to the limited transport through the F2g mode, despite its large mode group velocity.12 There is also relatively little known about how defects might impact the thermal transport, although a recent study of Deskins et. al.14 predicts a decrease in the thermal conductivity of ThO2 from point defects including oxygen and thorium vacancies. This has also been observed in other work on ThO2 (ref. 15 and 16) and UO2.17–19 While a variety of point defects and defect clusters can be found in fluorite structures, Schottky and Frenkel defects are simple, charge-neutral defects. These will both be produced under reactor operating conditions, and are likely to have an impact on the thermal conductivity,15,19 but unravelling this at the nanoscale requires computational approaches since disentangling the effects of specific defects using experimental approaches is challenging and currently limited.
m space group (no. 225).6–10 A phase transition to an orthorhombic Pnma structure (no. 62) begins at 20–30 GPa6–9 and completes at above 1000 K and 30 GPa.11 As Mott insulators, the thermal transport in ThO2 and other actinide oxides is controlled by heat transport through phonons.12,13 The thermal conductivity is however generally low for oxide materials due to the limited transport through the F2g mode, despite its large mode group velocity.12 There is also relatively little known about how defects might impact the thermal transport, although a recent study of Deskins et. al.14 predicts a decrease in the thermal conductivity of ThO2 from point defects including oxygen and thorium vacancies. This has also been observed in other work on ThO2 (ref. 15 and 16) and UO2.17–19 While a variety of point defects and defect clusters can be found in fluorite structures, Schottky and Frenkel defects are simple, charge-neutral defects. These will both be produced under reactor operating conditions, and are likely to have an impact on the thermal conductivity,15,19 but unravelling this at the nanoscale requires computational approaches since disentangling the effects of specific defects using experimental approaches is challenging and currently limited.
In this work, we use DFT modelling to perform a comprehensive study of the intrinsic defects in ThO2 and to assess their impact on the structural dynamics. Whereas the structural dynamics of stoichiometric ThO2 are well documented,20–24 little is currently known of defective ThO2 due to the computational challenges inherent in studying defective systems. We model the phonon dispersion and density of states of stoichiometric ThO2 and compare these to models with intrinsic Schottky and Frenkel defects. This allows us to determine key spectral signatures for identifying these defects in material samples. We also quantify the impact of the lattice dynamics on the defect formation thermodynamics. Finally, we estimate the potential impact of the defects on thermal transport, which is an important material property both for reactor design and the storage of waste material.
II. Methods
DFT calculations were performed using the Vienna Ab initio Simulation Package (VASP) code.25A 96-atom 2 × 2 × 2 supercell expansion of the 12-atom ThO2 conventional unit cell was constructed and used to build models of three intrinsic defects, namely cation (Th) Frenkel, anion (O) Frenkel and Schottky defects, with different relationships between the vacancy/interstitial sites (Fig. 1). For comparison with the literature and to verify that our choice of cell size was appropriate we also modelled the defects in 3 × 3 × 3 supercells with 324 atoms.
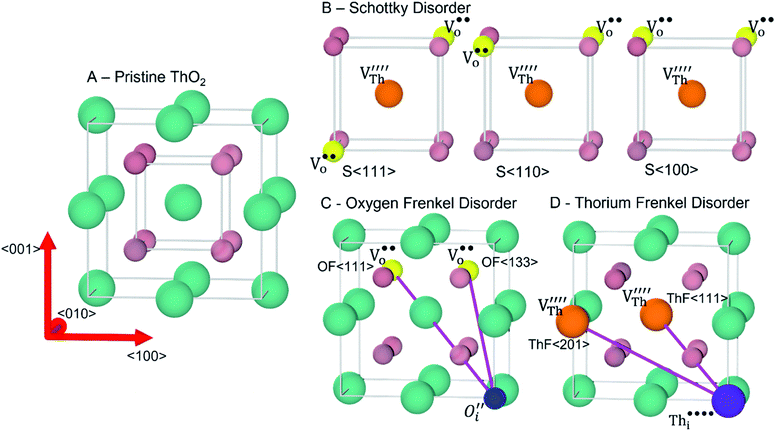 | ||
Fig. 1 Intrinsic ThO2 defects investigated in this work: (A) pristine ThO2 with the Th and O atoms in green and pale pink respectively; (B) three Schottky defect models  with the with the  shown in orange and yellow and arranged along the 〈111〉, 〈110〉 and 〈100〉 directions;42–45 (C) two O Frenkel defect models with the shown in orange and yellow and arranged along the 〈111〉, 〈110〉 and 〈100〉 directions;42–45 (C) two O Frenkel defect models with the  (blue/yellow) arranged along the 〈111〉 and 〈133〉 directions; and (D) two Th Frenkel defect models with the (blue/yellow) arranged along the 〈111〉 and 〈133〉 directions; and (D) two Th Frenkel defect models with the  (purple/orange) arranged along the 〈111〉 and 〈201〉 directions. (purple/orange) arranged along the 〈111〉 and 〈201〉 directions. | ||
The spin-polarised simulations used a plane-wave basis set with the electron-ion interactions described using projector augmented-wave (PAW) pseudopotentials26,27 with frozen [Xe] and [He] cores for Th and O respectively. The plane-wave cutoff was set to 500 eV. Exchange–correlation effects were treated using the revised Perdew–Burke–Ernzerhof generalised gradient approximation functional for solids (PBEsol),28 without the use of a Hubbard U correction, following previous studies on ThO2.22,29–31 Spin–orbit coupling was not included as this has been shown to have a comparatively small effect in ThO2.32 The Brillouin zone of the 12-atom ThO2 conventional cell was sampled using a Γ-centred Monkhorst–Pack k-point grid33 with 4 × 4 × 4 subdivisions, which was proportionally reduced to a 2 × 2 × 2 sampling for the 2 × 2 × 2 and 3 × 3 × 3 supercells.
Pristine ThO2 was geometry optimised at constant pressure to tolerances of 10−8 eV and 10−3 eV A−1 on the electronic energy and ionic forces respectively. The defective models were optimised with the cell shape and volume fixed to that of the equivalent supercell of the geometry optimized pristine ThO2.
To model the lattice dynamics, the 2nd-order harmonic interatomic force constants (IFCs) were obtained using the finite-displacement approach implemented in the Phonopy code34 with VASP as the force calculator. The displacements were generated in the 96-atom cells used for the stoichiometric and defective models. The atom-projected phonon density of states (PDOS) curves for the models were evaluated on Γ-centred grids of 10 × 10 × 10 phonon wavevectors (q-points). For the stoichiometric model, a transformation matrix was used to convert to the three-atom primitive cell to evaluate the phonon dispersion. For the defective models, we made use of the band unfolding methodology35,36 implemented in the Phonopy code to project the dispersions onto the ThO2 primitive cell for comparison to the stoichiometric structure. A non-analytical correction was applied using Born effective charges and high-frequency dielectric constants computed with the density-functional perturbation theory (DFPT) routines in VASP.37 To evaluate the IR and Raman activities of the Γ-point phonon modes, we used the Phonopy-spectroscopy project,38 which is documented in ref. 39. Brief details of the methodology used for simulating the IR and Raman spectra are given in the ESI.†
The Phono3py code40 was used to compute the thermal conductivity of stoichiometric ThO2 within the single-mode relaxation-time approximation by calculating the 3rd-order IFCs using the 96-atom supercell. The phonon group velocities, lifetimes and thermal conductivity were deemed to be converged with a 48 × 48 × 48 sampling mesh for the ThO2 primitive cell. As described in the text, we then estimated the thermal conductivity of the 96-atom defect models using one of two approximate models.41 In principle, a q-point mesh with 15 × 15 × 15 subdivisions should be adequate for sampling the 32× smaller Brillouin of the supercells. However, we were only able to use a smaller mesh with 10 × 10 × 10 subdivisions due to memory constraints. As discussed in the text below, we estimate that this leads to an error in the calculated properties on the order of 20%. Finally, we also generated for the supercell models two-phonon weighted joint density of states (w-JDOS) functions, using the same 10 × 10 × 10 mesh.
We note that our chosen supercell size may have an impact on the structural dynamics calculations, i.e. the calculated frequencies, simulated phonon spectra, and predicted thermal transport. However, the substantial workload means that it is computability infeasible to perform these calculations on the larger 3 × 3 × 3 defect supercell models, so we are unable to quantify the impact as we do for the defect-formation energies.
III. Results and discussion
A. Structures of the stoichiometric and defective systems
Our calculated lattice constant for stoichiometric ThO2 (Fig. 1A) is 5.5605 Å, compared to the experimental range of 5.5921–5.604 Å.6,46–50 Standard (athermal) DFT does not take into account the effect of temperature. An experimental lattice parameter of 5.5828 Å at 0 K can be extrapolated from the empirical function of Tyagi and Mathews,51 which is still higher than our calculated value. This indicates that the underestimation of the lattice parameter may be due to the DFT functional used.The Schottky defect involves the removal of a complete ThO2 formula unit to create two oxygen vacancies and a Th vacancy  according to:
 | (1) |
Following Govers et al.45 we considered only the first nearest-neighbour positions for the vacancies. We investigated three potential arrangements where the two  are arranged along the 〈111〉, 〈110〉 and 〈100〉 directions with respect to the central
  , which we denote S〈111〉, S〈110〉 and S〈100〉 respectively (Fig. 1B).
The cation and anion Frenkel defects are a type of intrinsic disorder and involve the formation of pairs of vacancies and interstitials according to:
 | (2) |
 | (3) |
To prevent spontaneous recombination during the geometry optimisation, the interstitial and vacancy must not be adjacent. As shown in Fig. 1C, we therefore created O Frenkel defects with the  arranged as 2nd-nearest neighbours along the 〈111〉 and 〈133〉 directions. These configurations, which we refer to as OF〈111〉 and OF〈133〉, are equivalent to those examined in other literature.42,43,45 In our Th Frenkel models (Fig. 1D), the
  are arranged along the 〈111〉 and 〈201〉 directions, which we denote ThF〈111〉 and ThF〈201〉 respectively. The ThF〈201〉 has previously been studied,42,43,45 but as discussed below our calculations predict the ThF〈111〉 configuration to be energetically more stable.
B. Defect formation energies
The calculated defect formation energies are presented and compared to other computational studies in Table 1.| Supercell | 2 × 2 × 2 | 3 × 3 × 3 | 4 × 4 × 4 | 5 × 5 × 5 | ||||||||||
|---|---|---|---|---|---|---|---|---|---|---|---|---|---|---|
| Defective structure | This study (PBEsol, 1000 K) | This study (PBEsol) | DFT43 (PBE, 1000 K) | DFT22 (PBE) | DFT59 (GGA + U) | PM44 | This study (PBEsol) | DFT43 (PBE, 1000 K) | PM44 | PM55 | PM56 | PM42 | PM44 | PM44 |
| S∞ | — | — | — | 8.23 | 20.6 | — | — | 8.05 | — | 10.39 | 13.79 | 12.16–20.66 | — | 12.89 |
| S〈100〉 | 5.49 | 5.73 | 5.08 | — | — | 7.65 | 5.93 | 5.04 | 7.53 | — | 7.39 | 7.07–12.49 | 7.52 | 7.51 |
| S〈110〉 | 4.90 | 5.16 | 4.47 | — | — | 6.49 | 5.43 | 4.51 | 6.60 | 5.40 | 6.35 | 6.24–11.14 | 6.62 | 6.62 |
| S〈111〉 | 5.01 | 5.29 | 4.66 | — | — | 6.45 | 5.37 | 4.51 | 6.41 | 5.41 | 6.05 | 6.09–10.85 | 6.41 | 6.39 |
| ThF∞ | — | — | — | 16.72 | — | — | — | 13.72 | — | 19.39 | 20.56 | 21.78–25.35 | — | 18.23 |
| ThF〈111〉 | 12.53 | 12.57 | — | — | — | — | — | — | — | — | — | — | — | — |
| ThF〈201〉 | — | 12.90 | — | — | — | — | — | — | — | — | 15.56 | 16.47–21.23 | — | 13.65 |
| OF∞ | — | — | — | 6.83 | 9.8 | — | — | 4.98 | — | 6.60 | 7.64 | 6.47–7.93 | — | 5.89 |
| OF〈111〉 | — | 5.13 | — | — | — | — | — | — | — | — | 6.83 | 5.37–6.58 | — | 5.38 |
| OF〈133〉 | 4.03 | 4.42 | — | — | — | — | — | — | — | — | 6.32 | 5.23–6.24 | — | 5.03 |
Experimental studies of the O Frenkel disorder indicate defect formation enthalpies in the range of 2.28–4.68 eV from diffusion measurements using the isotope-exchange method,52 and a value of 4.2 eV from fitting high-temperature heat capacity data.53 These are a good match to our calculated formation energy of 4.42 eV for the most stable OF〈133〉 defect. The higher stability of the OF〈133〉 defect compared to the OF〈111〉 also agrees with potential-model (PM) calculations using larger 4 × 4 × 4![[thin space (1/6-em)]](https://www.rsc.org/images/entities/char_2009.gif) 42 and 5 × 5 × 5 supercells.44 Ando et al. concluded that O Frenkel and Schottky defects would need to have energies of 2.82 eV and 4.2 eV, respectively in order to explain the self-diffusion behaviour measured in a ThO2 single crystal, which indicates that the O transport is primarily via Frenkel defects.54 This is the only experimental value we could find for the Schottky defect, but it is reassuring that it has been calculated to be higher in energy than the O Frenkel defect, thus supporting our DFT values (Table 1).
42 and 5 × 5 × 5 supercells.44 Ando et al. concluded that O Frenkel and Schottky defects would need to have energies of 2.82 eV and 4.2 eV, respectively in order to explain the self-diffusion behaviour measured in a ThO2 single crystal, which indicates that the O transport is primarily via Frenkel defects.54 This is the only experimental value we could find for the Schottky defect, but it is reassuring that it has been calculated to be higher in energy than the O Frenkel defect, thus supporting our DFT values (Table 1).
The Schottky defect has been studied computationally using DFT43 and PMs using the shell,55 rigid ion42,56,57 and embedded atom44 formalisms. Using a 2 × 2 × 2 supercell, we predict defect formation energies between 5.16–5.73 eV, in the order S〈110〉 < S〈111〉 < S〈100〉, in agreement with free-energy calculations on ThO2 at 1000 K and 0.2 atm43 and similar calculations on UO2.58 Although the energy differences between the configurations are marginal, the relative stabilities are changed when using larger supercells such that our 3 × 3 × 3 supercell models predict a stability order of S〈111〉 < S〈110〉 < S〈100〉. PM calculations using larger supercells predict the same stability trends and small energy differences as our DFT calculations on larger cells. We attribute the differences between cell sizes to better screening of the coulombic repulsion between positively charged oxygen vacancies in the larger models.
For the Th Frenkel disorder, we find that the ThF〈111〉 configuration is more stable than the ThF〈201〉 defect examined in other literature,45 although the formation energy of 12.57 eV makes this defect considerably less favourable than the Schottky and O Frenkel defects.
The trend in stability of the different Frenkel pair configurations appears to be related to the distance between the vacancy and interstitial: the more stable ThF〈111〉 and OF〈133〉 configurations have interstitial-vacancy distances of 4.48 and 5.87 Å, respectively, whereas the less stable ThF〈201〉 and OF〈111〉 configurations have larger separations of 5.96 and 6.88 Å. We therefore conclude that the closer the interstitial and vacancy sites are, the more stable the defect pair is, likely because shorter distances optimise the attractive coulombic interactions between the oppositely-charged point defects.
It is also of note that small supercells imply relatively high defect concentrations, and interactions between defects in neighbouring cells can lead to higher stabilities than when the formation energies are corrected to the infinite-dilution limit.22,42–44,55,56,59 The potential model studies in ref. 42 and 44 predict a qualitative stability ordering of OF < S < ThF, in agreement with our results. While the trend is unchanged when the formation energies are corrected to the infinite-dilution limit, the correction predicts a greater stabilisation of the Schottky defect relative to the O Frenkel. We infer from this that at the high defect concentrations associated with small supercell models the interactions between defects may have a stabilising effect.
To account for thermal effects, we also calculated defect-formation free energies ΔAf from 0 K up to the melting temperature of ThO2 (3630 K).60
The Helmholtz free energies of formation, ΔAf, of the Schottky and Frenkel defects are calculated as:
| ΔAf,Schottky = AStoich − (ASchottky + AThO2) | (4) |
| ΔAf,Frenkel = AStoich − AFrenkel | (5) |
The Helmholtz energies in eqn (4)/(5) are calculated based on the phonon contributions to the free energy Avib(T), computed as:
 | (6) |
 | (7) |
 | (8) |
The total Helmholtz energy of the system, A(T), can then be computed by adding the lattice internal energy U0, which we equate to the DFT total energy:
| A(T) = U0 + Avib(T) = U0 + Uvib(T) − TSvib(T) | (9) |
Under the assumption of zero pressure, the Gibbs free energy G(T) and the Helmholtz energy A(T) can be equated.
However, as our calculation are performed at constant volume there may be a residual cell pressure in the defect models, and so we strictly work with A(T). To determine the Avib(T) we use one of two methods. In method 1, we consider frequencies ωqj sampled at wavevectors q across the Brillouin zone. In Method 2, we consider only the ωj at the zone centre q = Γ. While an approximation, this simplified model is widely used for treating large unit cells where further supercell expansions to calculate frequencies at q ≠ Γ without interpolation are not practical.
Fig. 2 shows the defect-formation free energies of the S〈100〉, S〈110〉, S〈111〉, ThF〈111〉 and OF〈133〉 defects as a function of temperature calculated using method 1. The formation energies decrease with temperature, which implies that it is easier to generate defects at elevated T. This is in line with experimental observations,52 which show that the generation of O Frenkel defects at higher temperatures leads to enhanced oxygen diffusion.21 Comparing the formation energies at T = 0 and 3630 K predicts decreases of 0.85–1.02 eV for the Schottky defects, 1.33 eV for the OF〈133〉 defect, and 0.30 eV for ThF〈111〉 defect. We therefore conclude that temperature effects are significant, but do not affect the overall stability trend. Method 2, using three different models for the contributions from the acoustic modes, predicts a small ∼0.25–0.5 eV difference in the formation energies at T = 3630 K (see ESI†). For both methods the trend in stability ordering remains the same, with the defect formation energies in the order of OF < S < ThF.
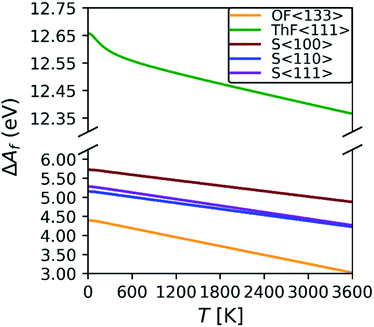 | ||
| Fig. 2 Defect-formation free energies for the OF〈133〉, ThF〈111〉, S〈100〉, S〈110〉 and S〈111〉 defects as a function of temperature calculated using method 1. | ||
To understand how the changes in the defect formation energies impact the defect concentrations ND, we estimated the concentrations using the Boltzmann distribution:
| ND = N × exp(−ΔAf/kBT) | (10) |
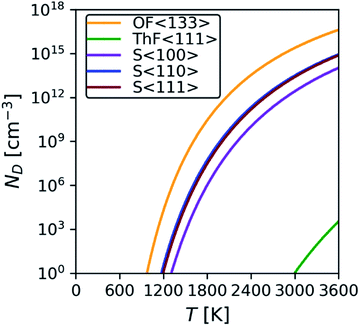 | ||
| Fig. 3 Predicted defect concentrations as a function of temperature for the S〈100〉, S〈110〉, S〈111〉, ThF〈111〉 and OF〈133〉 defects using the calculated defect formation free energies. | ||
C. Phonon dispersion and phonon density of states
Since the majority of the thermal transport in ThO2 is through the phonons, an accurate description of the structural dynamics is crucial. The calculated phonon dispersion and atom-projected density of states are shown in Fig. 4 and compared to data from inelastic neutron-scattering (INS) measurements.21 The ThO2 primitive cell contains three atoms and the dispersion thus has three acoustic and six optic branches at each wavevector q. The three lower-frequency acoustic modes split into longitudinal (LA) and transverse (TA) modes and are mainly attributed to motions of the heavier Th sublattice. The six higher-frequency optic modes again divide into longitudinal and transverse (LO/TO) modes and are predominantly associated with motion of the lighter O sublattice. The general features of the spectrum are common to UO2 and PuO2 and have been demonstrated in calculations using DFT61 and potential models,62 and in experimental time-of-flight INS measurements.61,63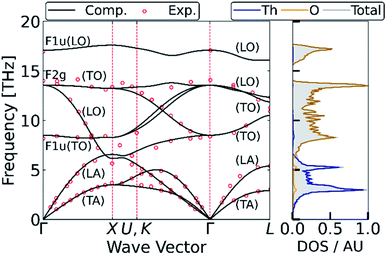 | ||
| Fig. 4 Calculated phonon dispersion and atom-projected density of states of stoichiometric ThO2. Inelastic neutron-scattering (INS) measurements from ref. 21 are overlaid as red dots. | ||
A list of modes and frequencies at each of the high-symmetry q in the Fm![[3 with combining macron]](https://www.rsc.org/images/entities/char_0033_0304.gif) m Brillouin zone point is provided in Table 2 and compared to INS,21,64 Raman9,64–67 and IR68,69 measurements. At the Γ point, stoichiometric ThO2 has a doubly-degenerate TO mode at 8.5 THz (alternate motion of Th and O atoms), a triply-degenerate Raman-active mode at 13.6 THz (alternate motion of O), and a singly-degenerate LO mode at 17.1 THz (alternate motion of Th and O). These assignments are supported by previous work.70 The predicted frequencies are also in excellent agreement with INS measurements collected at 273 K, with an average 6% and maximum 13% difference. The discrepancies may in part be attributed to the neglect of temperature effects (i.e. thermal expansion and higher-order anharmonicity) in our calculations.24
m Brillouin zone point is provided in Table 2 and compared to INS,21,64 Raman9,64–67 and IR68,69 measurements. At the Γ point, stoichiometric ThO2 has a doubly-degenerate TO mode at 8.5 THz (alternate motion of Th and O atoms), a triply-degenerate Raman-active mode at 13.6 THz (alternate motion of O), and a singly-degenerate LO mode at 17.1 THz (alternate motion of Th and O). These assignments are supported by previous work.70 The predicted frequencies are also in excellent agreement with INS measurements collected at 273 K, with an average 6% and maximum 13% difference. The discrepancies may in part be attributed to the neglect of temperature effects (i.e. thermal expansion and higher-order anharmonicity) in our calculations.24
| α o [Å] | Computational | Experimental | |||||||||
|---|---|---|---|---|---|---|---|---|---|---|---|
| 5.5605 | 5.618 | 5.619 | 5.60 | 5.30 | 5.5862 | 5.6202 | |||||
| Mode | PBEsol (this study) | PBE71 | PBE22 | LDA + U20 | LDA20 | HSE06 (ref. 71) | SCAN16 | INS21 | INS64 | Raman9,64–67 | IR68,69 |
| Γ: F1u(LO) | 17.1 | 16.6 | 16.6 | 16.3 | 16.5 | 16.8 | 17.4 | 16.9 | 17.2 | 16.7–17.2 | |
| Γ: F2g | 13.6 | 13.1 | 13.1 | 14.2 | 13.8 | 12.1 | 13.7 | 14.1 | 13.9 | 13.9–14.0 | |
| Γ: F1u(TO) | 8.5 | 7.9 | 7.8 | 9.0 | 8.9 | 8.2 | 8.7 | 8.3 | 8.4 | 8.3–8.5 | |
| X | 17.6 | 17.9 | 17.2 | 17.7 | 17.8 | 18.2 | 17.8 | — | 17.4 | ||
| 13.2 | 12.2 | 12.8 | 13.6 | 13.4 | 13.4 | 13.5 | 13.3 | 12.9 | |||
| 8.3 | 6.7 | 7.5 | 9.4 | 8.6 | 8.1 | 8.4 | — | 8.6 | |||
| 6.6 | 6.7 | 6.4 | 9.3 | 6.7 | 6.7 | 6.6 | 5.7 | 6.0 | |||
| 6.2 | 5.6 | 5.2 | 6.6 | 6.6 | 5.5 | 6.2 | — | 5.8 | |||
| 3.5 | 3.1 | 3.2 | 3.6 | 3.6 | 3.4 | 3.6 | 3.6 | 3.4 | |||
| L | 16.1 | 16.2 | 15.5 | 16.4 | 16.4 | 16.5 | 16.3 | — | 17.4 | ||
| 12.4 | 11.8 | 11.9 | 12.8 | 12.8 | 12.6 | 12.7 | 12.2 | 11.7 | |||
| 11.9 | 11.5 | 11.3 | 12.7 | 12.1 | 12.0 | 12.1 | 11.2 | 11.3 | |||
| 10.5 | 9.7 | 9.9 | 11.0 | 10.7 | 10.5 | 10.8 | 10.7 | 9.8 | |||
| 5.4 | 5.2 | 5.0 | 5.6 | 5.7 | 5.3 | 5.5 | 5.3 | 5.3 | |||
| 2.9 | 2.6 | 2.7 | 2.9 | 3.0 | 2.9 | 2.9 | 2.9 | 3.0 | |||
The overlap between the LA and TO branches around q = X between ∼6.2–6.6 THz was predicted for ThO2 previously using LDA calculations,23 and has also been predicted to occur in UO2 and PuO2 using LDA with dynamical mean-field theory (DMFT).12 This feature is noteworthy because the acoustic modes tend to be the majority heat carriers, and the overlap with low-lying optic modes may facilitate enhanced phonon scattering and a reduced thermal conductivity in these materials.23 For UO2, the Debye approximation suggests that the F2g (LO) mode only contributes 0.11 W m−1 K−1 along the LO branch from Γ to X, compared to 1.68 W m−1 K−1 along the LA branch.12 Park et al. also found that the balance of the thermal transport shifts towards higher-frequency modes with shorter wavelengths at elevated temperature, resulting in reduced thermal transport.73
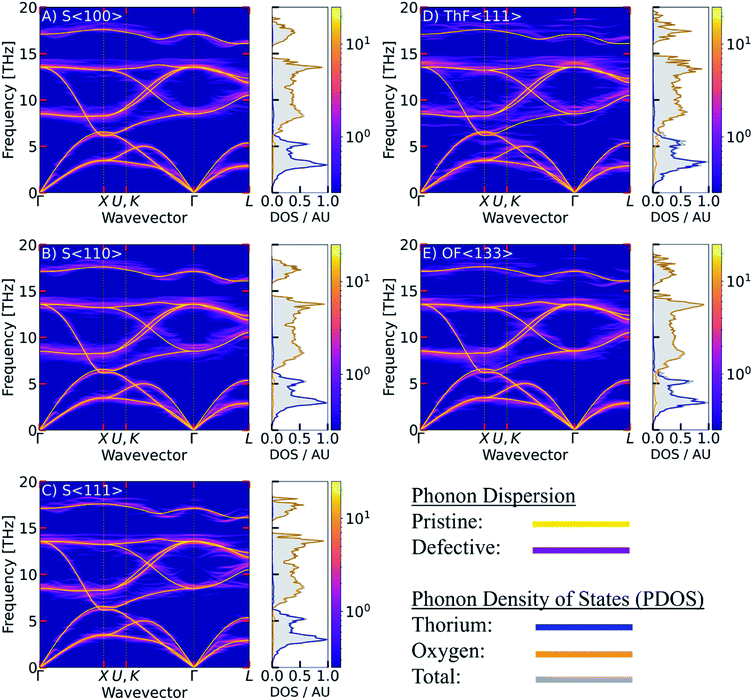
While the phonon spectrum of stoichiometric ThO2 is well documented in the literature,20–24,70 this is the first study to explore the impact of defects. The phonon dispersions of the defective structures, obtained in terms of the ThO2 primitive cell using band unfolding,35,36 are shown together with the calculated PDOS in Fig. 5. In Table 3, we present estimates of the range of frequencies spanned by modes at the high-symmetry q for comparison with Table 2.
| Mode | S〈100〉 | S〈110〉 | S〈111〉 | OF〈133〉 | ThF〈111〉 |
|---|---|---|---|---|---|
| Γ | 16.32–17.3 | 16.28–17.37 | 16.32–17.17 | 17.04–17.20 | 16.48–18.55 |
| 13.39–14.32 | 13.15–14.35 | 13.32–14.23 | 13.00–14.45 | 13.1–14.65 | |
| 7.72–9.25 | 6.90–9.31 | 7.04–8.94 | 7.70–8.86 | 7.27–7.31, 8.17–9.84 | |
| X | 17.2–18.63 | 17.43–18.22 | 17.39–18.09 | 17.24–18.48 | 17.27–19.59 |
| 12.58–14.32 | 12.33–14.35 | 13.19–14.28 | 13.09–14.49 | 12.77–14.65 | |
| 7.56–9.26 | 6.90–9.09 | 6.90–9.46 | 6.98–9.16 | 7.06–10.01 | |
| 6.31–6.40 | 6.43–6.65 | 6.43–6.48 | 6.33–6.46 | 6.50–6.65 | |
| 6.04–6.15 | 6.19–6.29 | 6.17–6.24 | 5.24–5.51, 6.15–6.26 | 5.19–5.62, 6.19–6.41 | |
| 3.09–4.29 | 3.08–4.25 | 3.11–4.23 | 3.12–3.49 | 3.24–4.46 | |
| L | 16.19–16.49 | 16.28–17.42 | 16.23–16.95 | 16.06–17.08 | 16.56–16.80 |
| 12.13–13.41 | 12.09–13.46 | 12.32–13.37 | 12.20–14.45 | 12.19–14.48 | |
| 11.56–12.01 | 11.14–11.97 | 11.56–12.07 | 11.41–1206 | 11.28–12.05 | |
| 8.27–9.42, 10.13–10.94 | 8.1–9.31, 10.04–10.97 | 8.13–8.94, 10.16–11.39 | 9.68–11.14 | 9.86–11.13 | |
| 4.98–5.37 | 5.04–5.38 | 4.74–5.24 | 5.13–5.42 | 5.27–5.62 | |
| 2.28–3.12 | 2.29–3.13 | 2.23–3.11 | 2.40–2.97 | 2.33–3.26 |
The defective structures all show some degree of broadening across the phonon dispersion, including notable changes to the acoustic modes that are most pronounced along Γ–X direction around 2 THz. For the Frenkel defects (Fig. 5 D and E) the dispersions show notable mode softening at X around 6.6 THz. This suggests that the defects affect the vibrations of the O sublattice and have similar effects to the temperature-induced softening that occurs to this mode.24 Ghosh et al.71 have linked reductions in the frequencies of the X-point phonon modes at 3.5 and 6.2 THz in ThO2 to an increase in lattice strain, and have suggested that large strains lead to the phonon mode at 6.2 THz becoming imaginary. This effect has also been observed in CeO2,74 where the appearance of an imaginary mode under thermal expansion at high temperature predicates a superionic transition to a disordered oxygen sublattice. Taken together with our results, this provides a potential mechanism for how O Frenkel defects could enhance oxygen diffusion. We note however that while a mode softening is visible in Fig. 5E we do not observe an imaginary mode, which may be because we do not take into account temperature effects.
A handful of recent studies have investigated the effect of point defects on the phonon scattering in ThO2, UO2 and PuO2.17,18,75 For ThO2, non-equilibrium molecular dynamics simulations75 found that Th and O vacancies affected the lower-frequency modes with the largest contributions to the thermal transport. Th vacancies were predicted to have a larger impact, with 0.1% Th and O vacancies predicted to induce 62 and 20% reductions in the thermal conductivity respectively. Comparing the PDOS curves of the defective models in Fig. 5 with the PDOS curve of pristine ThO2 reveals an enhanced contribution from O at lower frequencies, suggesting that the defects may facilitate enhanced coupling between the O and Th sublattices. There are also some subtle changes to the DOS of the acoustic modes below ∼2.5 THz, which may indicate changes in the number of phonon scattering pathways.
D. Infrared spectra
The Γ-point optic modes can be investigated using infrared (IR) and Raman spectroscopy. For stoichiometric ThO2 there is a triply-degenerate Raman-active F2g mode at 13.6 THz, a doubly-degenerate IR-active F1u TO mode at 8.5 THz, and a singly-degenerate IR-active F1u LO mode at 17.1 THz. Fig. 6 compares simulated IR spectra of pristine ThO2 to the predicted spectra of the defective models. To allow for comparison between the spectra, and for compatibility with existing literature, we applied the nominal linewidth of 0.75 THz (including instrumental broadening) estimated from room-temperature IR reflectivity measurements.69 We note however that our calculated intrinsic linewidths at T = 300 K are considerably sharper, at 0.034 and 0.098 THz for the F1u and F2g modes respectively. We attribute this in part to the difficulties inherent in extracting accurate linewidths from experimental spectra. However, we also note that the linewidths we calculate are the intrinsic linewidths due to three-phonon scattering. This approximation neglects higher-order scattering and additional linewidth contributions from phenomena such as phonon-defect scattering that may be present in experimental samples. We also consider the structure at 0 K, and thermal expansion at finite temperature would usually narrow the phonon density of states and enhance the phonon scattering and linewidths.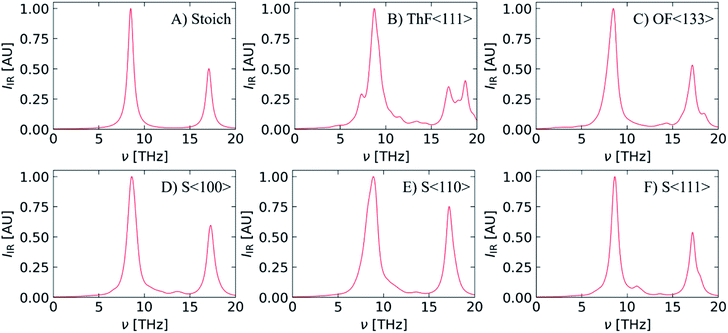 | ||
| Fig. 6 Simulated IR spectra of stoichiometric ThO2 (A) and models with Th (B) and O (C) Frenkel defects and one of three Schottky defect configurations (D–F). Each spectrum is generated with the nominal linewidth of 0.75 THz derived by Axe et al.69 | ||
The calculated frequencies of the F1u TO and LO modes at 8.5 and 17.1 THz compare well to single-crystal measurements performed by Knight et al.68 (8.4/17.6 THz) and Axe and Petit69 (8.3/17.0 THz).
The defects break the symmetry of stoichiometric ThO2 and result in some of the zone-boundary modes being “folded” to the Γ-point. This in turn leads to additional IR- and Raman-active modes in the defective systems, which are often associated with localised vibrations of atoms around the defect sites. As can be seen in Fig. 6B–F this results in more featured IR spectra. Inspection of the eigenvectors of the IR-active modes indicates that the vibrations are somewhat complex with contributions from both the Th and O sublattices.
Due to the much higher computational cost of calculating Raman activities, we were unable to predict Raman spectra for the defective models, but for completeness we show a simulated Raman spectrum of stoichiometric ThO2 in Fig. S2.† The spectrum features a single peak at 13.6 THz from the F2g mode, in line with other computational studies,16,20,22,71 but underestimated compared to the experimental literature.9,64–67
E. Thermal conductivity
Using the single-mode relaxation time approximation (RTA) model, the macroscopic thermal conductivity κlatt(T) is obtained as a sum of contributions from individual phonon modes λ according to:40 | (11) |
 | (12) |
 | (13) |
 | (14) |
The Γλ are obtained as the imaginary part of the phonon self-energy using third-order perturbation theory, and the method is documented in detail in ref. 40. Computing the linewidths requires the third-order force constants, and obtaining these represents a substantial computational workload.
Since the κlatt are tensor quantities, we discuss the scalar average of the diagonal elements, which we denote κlatt in the following, i.e.
 | (15) |
We have omitted the explicit temperature dependence for brevity. The κlatt are representative of what would be measured for a pressed pellet or polycrystal.
The thermal conductivity of ThO2 is well studied in the literature using DFT23,24,70 and other theoretical methods,22,42,70,76–79 and also in experiments.22,70,80–85Fig. 7 compares the thermal conductivity of ThO2 obtained using eqn (11) to a selection of experimental and theoretical works.
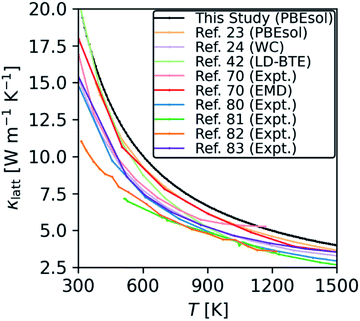 | ||
| Fig. 7 Comparison of the κlatt calculated for stoichiometric ThO2 using the RTA model in eqn (11) with selected experimental and theoretical studies from the literature. | ||
We predict a room-temperature (300 K) κlatt of 20.8 W m−1 K−1, which compares reasonably well to the experimental measurements in ref. 70 (16.9 W m−1 K−1), ref. 80 (16.0 W m−1 K−1), and ref. 83 (15.7 W m−1 K−1). Given the scatter in the experiments, we suspect our prediction overestimates the measurements because it is difficult to prepare high-quality bulk samples that are free from defects such as grain boundaries – these defects limit the transport through modes with long mean free paths and thus reduce the overall κlatt. In keeping with this, Mann et. al.86 obtained a room-temperature κlatt between 18–20 W m−1 K−1 for single crystal ThO2, which is higher than previous experimental results and closer to our prediction.
Our results are also consistent with other studies using DFT23,24 and potential models.42,70 At 300 K, the values of 20.6 and 17.9 W m−1 K−1 calculated using lattice dynamics coupled with the Boltzmann transport equation (LD-BTE)42 and equilibrium molecular dynamics (EMD)70 respectively compare well with our value of 20.8 W m−1 K−1. The DFT study in ref. 23 used a similar technical setup to the present work and reported a value of 9.3 W m−1 K−1 at 600 K, which compares well to our prediction of 10 W m−1 K−1. However, we note that the choice of functional appears to have a significant impact, as the calculations in ref. 24 using the WC functional predicted a somewhat lower 7.7 W m−1 K−1.
To investigate the effect of crystal grain size on the thermal conductivity we employed a simple boundary-scattering model to limit the phonon mean free paths. As shown in Fig. 8, we find that beyond a grain size of 5 μm the thermal conductivity plateaus, in agreement with the findings of Nakamura and Machida.23 At elevated temperature, the phonon mean free paths decrease and grain-boundary effects become less prominent. Although most experimental studies do not report a grain size, those that do indicate grain sizes in the range of 1–6 μm,5,8,75 in which case we would not expect the grain size to have a significant impact on the κlatt.
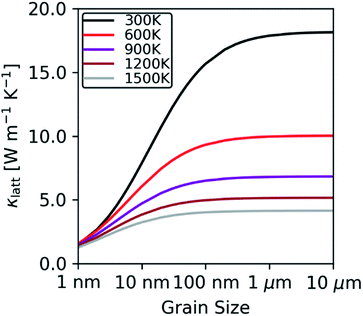 | ||
| Fig. 8 Thermal conductivity of stoichiometric ThO2 at T = 300, 600, 900, 1200 and 1500 K as a function of the crystal-grain size, predicted using a boundary-scattering model. | ||
Computing the third-order force constants to calculate the phonon lifetimes of the defective structures would be prohibitively expensive and is therefore not feasible, so we explored instead the approximate models developed in ref. 41. We first consider the constant relaxation-time approximation (CRTA) model,41,87 where the τλ are replaced with a constant relaxation time, τCRTA according to:
 | (16) |
We omit the temperature dependence of the terms for brevity but note that both the τCRTA and the summand are temperature dependent, the latter by virtue of the Cλ term (c.f.eqn (11)/(12)).
Since the terms in the summand are calculable from the harmonic force constants, this model allows for quantitative assessment of the impact of the defects on the κlatt due to changes in the harmonic phonon frequencies and group velocities. Remarkably, we find that the defects reduce the harmonic term in eqn (16) by between 83.2 and 90.4% compared to stoichiometric ThO2 at 600 K (Fig. 9). The S〈111〉 defect is predicted by this model to have the smallest impact, whereas the two Frenkel defects have the largest impact. Given that the κλ in eqn (11) are proportional to the square of the group velocities, and eqn (12) is a shallow function of temperature, we can attribute these changes to disruption of the bonding network reducing the group velocities.
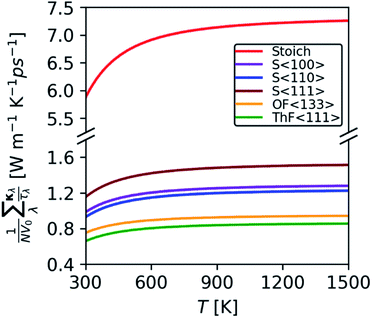 | ||
| Fig. 9 Comparison of the harmonic function in eqn (16) calculated for the 96-atom stoichiometric ThO2 supercell, three configurations of Schottky defects, and the lowest-energy O and Th Frenkel defects. | ||
We next consider the approximate model for the phonon linewidths Γλ outlined in ref. 40. In the perturbative treatment the Γλ are obtained as a sum of three-phonon scattering processes between phonon triplets consisting of a reference mode λ and two interacting modes λ′ and λ′′:
 | (17) |
In this equation the  are the three-phonon interaction strengths, the nλ are the occupation numbers given by,
 | (18) |
![[capital Gamma, Greek, tilde]](https://www.rsc.org/images/entities/char_e1eb.gif) λ can be written:40
λ can be written:40 | (19) |
In this expression Pλ is the averaged phonon–phonon interaction strengths for the mode λ given by:
 | (20) |
| N2(q,ω) = N(1)2(q,ω)+N(2)2(q,ω) | (21) |
The two components N(1)2(q,ω) and N(2)2(q,ω) represent collision and decay (Class 1/Class 2) processes, respectively, and are defined as:
 | (22) |
 | (23) |
This model serves two purposes. Firstly, the wJDOS functions can be calculated using the harmonic frequencies and enable a partial assessment of how changes in the phonon spectrum are likely to impact on the phonon linewidths and lifetimes. This is most easily done by averaging over q to obtain a function of frequency only:
 | (24) |
Secondly, if assume the Pλ in eqn (20) can be replaced with a constant value ![[P with combining tilde]](https://www.rsc.org/images/entities/i_char_0050_0303.gif) , e.g. fitted for stoichiometric ThO2, we can also predict an approximate κlatt.41
, e.g. fitted for stoichiometric ThO2, we can also predict an approximate κlatt.41
The averaged wJDOS functions computed for ThO2 and the defective systems are compared in Fig. 10. To allow for comparison between systems, we have normalized the functions by (3na)2, which is folded into the Pλ term in eqn (19). Peaks in the ![[N with combining macron]](https://www.rsc.org/images/entities/i_char_004e_0304.gif) 2(ω) at low frequencies are likely to indicate an enhanced broadening of the acoustic modes, which as noted above typically contribute the most to the thermal conductivity, leading to shorter lifetimes and suppressing the heat transport. Fig. 10 shows that the defects generally produce small increases in the
2(ω) at low frequencies are likely to indicate an enhanced broadening of the acoustic modes, which as noted above typically contribute the most to the thermal conductivity, leading to shorter lifetimes and suppressing the heat transport. Fig. 10 shows that the defects generally produce small increases in the ![[N with combining macron]](https://www.rsc.org/images/entities/i_char_004e_0304.gif) 2(ω) at low frequencies, and thus suggests that changes to the phonon frequency spectrum may play a role in reducing the thermal conductivity.
2(ω) at low frequencies, and thus suggests that changes to the phonon frequency spectrum may play a role in reducing the thermal conductivity.
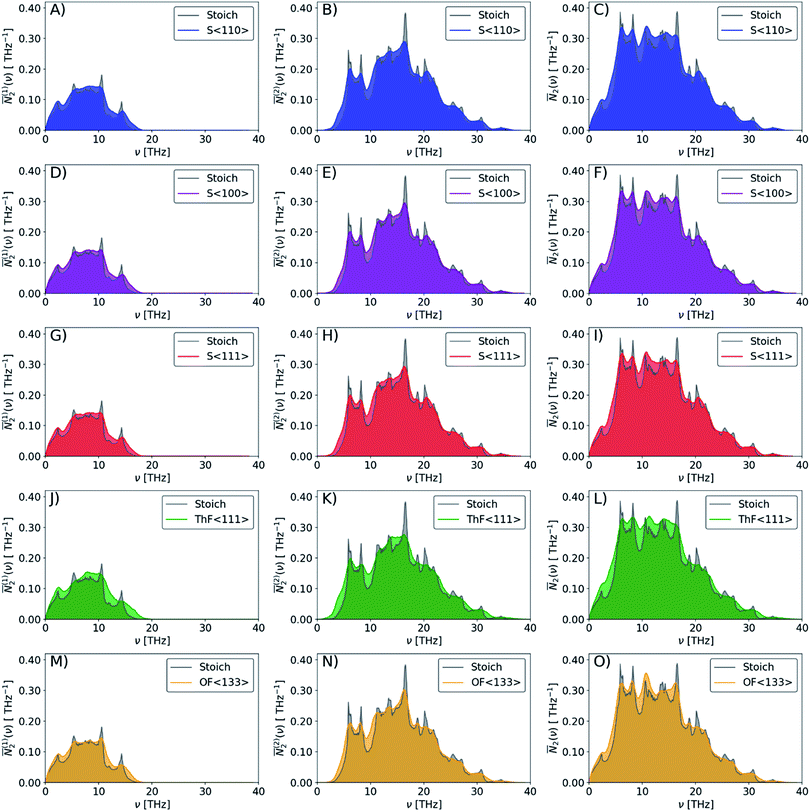 | ||
Fig. 10 Comparison of the weighted joint density of states (wJDOS) functions defined in eqn (21) for stoichiometric ThO2 (grey) and the S〈110〉 (blue), S〈100〉 (purple), S〈111〉 (red), ThF〈111〉 (green) and OF〈133〉 (orange) defect models. The first column (A/D/G/J/M) compares the ![[N with combining macron]](https://www.rsc.org/images/entities/i_char_004e_0304.gif) (1)2 for collision processes, the second column (B/E/H/K/N) compares the (1)2 for collision processes, the second column (B/E/H/K/N) compares the ![[N with combining macron]](https://www.rsc.org/images/entities/i_char_004e_0304.gif) (2)2for decay processes, and the third column (C/F/I/L/O) compares the sum (2)2for decay processes, and the third column (C/F/I/L/O) compares the sum ![[N with combining macron]](https://www.rsc.org/images/entities/i_char_004e_0304.gif) 2. 2. | ||
To apply the approximate model in ref. 41 a value of ![[P with combining tilde]](https://www.rsc.org/images/entities/i_char_0050_0303.gif) = 9.722 × 10¹³ was determined such that for the 96-atom stoichiometric supercell and a 10 × 10 × 10 q-point sampling the κlatt for bulk ThO2 at T = 600 K is recovered. Although the Φλλ′λ′′ in eqn (17) are formally temperature independent, in practice the limitations of using a single value results in a weak temperature dependence, and so 600 K was chosen as a compromise. The κlatt of pristine ThO2 calculated using eqn (11), for the primitive cell, is compared to that obtained using the supercell model with the fitted
= 9.722 × 10¹³ was determined such that for the 96-atom stoichiometric supercell and a 10 × 10 × 10 q-point sampling the κlatt for bulk ThO2 at T = 600 K is recovered. Although the Φλλ′λ′′ in eqn (17) are formally temperature independent, in practice the limitations of using a single value results in a weak temperature dependence, and so 600 K was chosen as a compromise. The κlatt of pristine ThO2 calculated using eqn (11), for the primitive cell, is compared to that obtained using the supercell model with the fitted ![[P with combining tilde]](https://www.rsc.org/images/entities/i_char_0050_0303.gif) in Fig. S3.†
in Fig. S3.†
We note that the 10 × 10 × 10 sampling mesh produces a harmonic function in eqn (16) that is ∼20% smaller than for the primitive cell, indicating that the νλ are not fully converged with respect to the sampling mesh (Fig. S4†). We found that the harmonic function for the supercell was slow to converge with respect to the sampling mesh, and we were unable practically to increase it due to memory constraints. This is a technical limitation of the current implementation in Phonopy. However, we would expect a similar relative error for the defect supercells, and we also note that the fitted ![[P with combining tilde]](https://www.rsc.org/images/entities/i_char_0050_0303.gif) may partially compensate for this issue.
may partially compensate for this issue.
Fig. 11 shows the thermal conductivity of the defective models predicted using this approximate model. Interestingly, we find the same 83.2–90.4% reductions in the κlatt at 600 K as predicted by considering the harmonic function in eqn (16). This suggests that the small changes in the numbers of energy-conserving scattering channels suggested by the wJDOS functions in Fig. 10 do not have a material impact on the phonon lifetimes. While perhaps counter-intuitive, it is possible that the averaged functions in Fig. 10 will mask larger variation in the N2(q,ω) of individual wavevectors (i.e. increases and decreases in the modal κλ at different q may compensate one another). As noted above, our relatively small defect supercells represent a significantly higher defect concentration than is likely to be achieved under thermal equilibrium (Fig. 3), and so the reduction in the κlatt is unlikely to be as prominent in real materials. On the other hand, the significant energy release associated with nuclear decay events in working reactors is likely to produce regions with much larger non-equilibrium local concentrations of defects, and our predictions suggest these may form “hotspots” where heat cannot effectively be dissipated. This could have several important consequences, including cracking of the fuel rods as a result of accumulated thermal stresses and swelling due to accelerated release of fission gases.17
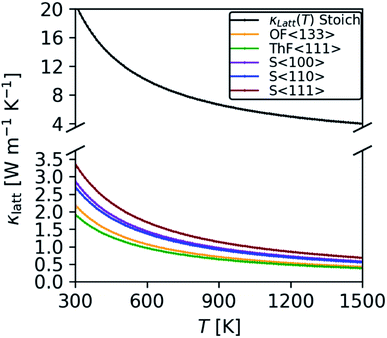 | ||
Fig. 11 Comparison of the κlatt of the five defective models considered in this work calculated using the constant Pλ model with the ![[P with combining tilde]](https://www.rsc.org/images/entities/i_char_0050_0303.gif) fitted for the stoichiometric ThO2 supercell at T = 600 K. fitted for the stoichiometric ThO2 supercell at T = 600 K. | ||
IV. Conclusions
In summary, we have performed a comprehensive study of the structure, energetics, lattice dynamics and thermal transport of stoichiometric ThO2 and models of the intrinsic Schottky and O/Th Frenkel defects.First-principles DFT calculations predict that the O Frenkel defect is the most energetically favourable. We have identified a more stable configuration of the Th Frenkel defect, not found in previous studies, with the interstitial and vacancy arranged along the 〈111〉 rather than 〈201〉 direction. We have also investigated the phonon contributions to the thermodynamic free energy and found that these terms may selectively stabilise the defects relative to pristine ThO2 and thereby reduce the defect formation energies at elevated temperature.
Our lattice-dynamics calculations demonstrate that the presence of defects leads to a significant broadening of the phonon dispersion and introduces additional IR-active modes that may serve as useful spectral signatures for identifying the defects in real materials using routine spectroscopy.
Finally, we also applied two approximate models to assess the impact of the defects on the thermal transport. We predict that the defects can reduce the (local) heat transport by as much as ∼90% by disrupting the regular bonding network of the stoichiometric material and reducing the phonon group velocities. Interestingly, we also find that, within the approximation of a constant phonon–phonon interaction strength, the changes in the phonon spectra due to the presence of defects do not lead to significant changes to the phonon lifetimes. While verifying the predicted reduction in κlatt would require explicit computation of the third-order force constants, it would be somewhat surprising if the defects led to so much weaker phonon–phonon interactions as to counteract the large reduction in the group velocities.
Overall, our modelling indicates that the presence of defects can have a significant impact on the thermal transport, and this is particularly significant in operating reactors where nuclear events are likely to lead to large non-equilibrium local defect concentrations. On the other hand, our results suggest that the impact on the thermal conductivity can be minimised if the defect concentrations can be controlled, which would improve the safety and performance profiles of the fuel. If the thermal performance of an alternative fuel material like ThO2 could be made tolerant to the changes in its structure, i.e. to the formation of defects, then it is reasonable to suggest that this may be beneficial from a safety perspective compared to UO2.88 Further research in this direction will require reliable means to identify and quantify defects in real materials and to assess their impact on the physical properties; modelling can play an important role in this, for example, as we have shown, by identifying spectral signatures that could be measured using routine spectroscopic techniques.
Data availability
Raw data from these calculations may be obtained from the authors on reasonable request.Author contributions
SM, JS, JST and MM performed the calculations and data analysis. JS and AT implemented and applied the band-unfolding procedure. JF, DJC, ES and SCP provided support and discussion. RMH and MTS provided comment on the comparison with experiments. MM and JS devised the research project. All authors contributed to drafting and editing the manuscript.Conflicts of interest
There are no conflicts of interest.Acknowledgements
SM and MM acknowledge the University of Huddersfield (UoH) EPSRC-DTP competition 2018–19 (EP/R513234/1) for funding. JMS is grateful to UK Research and Innovation (UKRI) for the award of a Future Leaders Fellowship (MR/T043121/1), and to the University of Manchester (UoM) for the previous support of a UoM Presidential Fellowship. ELdS acknowledges financial support from the NECL project under NORTE-01-0145-FEDER-022096. Analysis was performed on the Orion computing facility at the UoH and on the Computational Shared Facility at UoM. Calculations were run on the ARCHER and ARCHER2 UK National Supercomputing Services via our membership of the UK HEC Materials Chemistry Consortium (MCC; EPSRC EP/L000202, EP/R029431). We would also like to acknowledge computing time granted through the EU PRACE DECI-16 16DECI0044 SDAnOx project. To the extent that this paper relies on the contribution of RMH/MTS, then the copyright vests in the @British Crown Copyright 2020/AWE.References
- V. Masson-Delmotte, P. Zhai, A. Pirani, S. L. Connors, C. Péan, S. Berger, N. Caud, Y. Chen, L. Goldfarb, M. I. Gomis, M. Huang, K. Leitzell, E. Lonnoy, J. B. R. Matthews, T. K. Maycock, T. Waterfield, O. Yelekçi, R. Yu and B. Zhou, Climate Change 2021: the Physical Science Basis, Contribution of Working Group I to the Sixth Assessment Report of the Intergovernmental Panel on Climate Change, 2021 Search PubMed.
- J. S. Herring, P. E. MacDonald, K. D. Weaver and C. Kullberg, Nucl. Eng. Des., 2001, 203, 65–85 CrossRef CAS.
- M. Basu, R. Mishra, S. R. Bharadwaj and D. Das, J. Nucl. Mater., 2010, 403, 204–215 CrossRef CAS.
- R. K. Sinha and A. Kakodkar, Nucl. Eng. Des., 2006, 236, 683–700 CrossRef CAS.
- S. R. Spurgeon, M. Sassi, C. Ophus, J. E. Stubbs, E. S. Ilton and E. C. Buck, Proc. Natl. Acad. Sci. U. S. A., 2019, 116, 17181–17186 CrossRef CAS PubMed.
- M. Idiri, T. Le Bihan, S. Heathman and J. Rebizant, Phys. Rev. B: Condens. Matter Mater. Phys., 2004, 70, 014113 CrossRef.
- L. G. Liu, Earth Planet. Sci. Lett., 1980, 49, 166–172 CrossRef CAS.
- J. P. Dancausse, E. Gering, S. Heathman and U. Benedict, High Pressure Res., 1990, 2, 381–389 CrossRef.
- A. Jayaraman, G. A. Kourouklis and L. G. van Uitert, Pramana, 1988, 30, 225–231 CrossRef CAS.
- B. T. M. Willis, Proc. R. Soc. London, Ser. A, 1963, 274, 134–144 CAS.
- B. A. Chidester, O. S. Pardo, R. A. Fischer, E. C. Thompson, D. L. Heinz, C. Prescher, V. B. Prakapenka and A. J. Campbell, Am. Mineral., 2018, 103, 749–756 CrossRef.
- Q. Yin and S. Y. Savrasov, Phys. Rev. Lett., 2008, 100, 225504 CrossRef PubMed.
- J. W. L. Pang, W. J. L. Buyers, A. Chernatynskiy, M. D. Lumsden, B. C. Larson and S. R. Phillpot, Phys. Rev. Lett., 2013, 110, 157401 CrossRef PubMed.
- W. R. Deskins, A. Hamed, T. Kumagai, C. A. Dennett, J. Peng, M. Khafizov, D. Hurley and A. El-Azab, J. Appl. Phys., 2021, 129, 075102 CrossRef CAS.
- C. A. Dennett, Z. Hua, A. Khanolkar, T. Yao, P. K. Morgan, T. A. Prusnick, N. Poudel, A. French, K. Gofryk, L. He, L. Shao, M. Khafizov, D. B. Turner, J. M. Mann and D. H. Hurley, APL Mater., 2020, 8, 111103 CrossRef CAS.
- C. A. Dennett, W. R. Deskins, M. Khafizov, Z. Hua, A. Khanolkar, K. Bawane, L. Fu, J. M. Mann, C. A. Marianetti, L. He, D. H. Hurley and A. El-Azab, Acta Mater., 2021, 213, 116934 CrossRef CAS.
- K. Mitchell, J. Park, A. Resnick, H. Horner and E. B. Farfan, Appl. Sci., 2020, 10, 1860 CrossRef CAS.
- A. Resnick, K. Mitchell, J. Park, E. B. Farfán and T. Yee, Nucl. Eng. Technol., 2019, 51, 1398–1405 CrossRef CAS.
- M. Khafizov, M. F. Riyad, Y. Wang, J. Pakarinen, L. He, T. Yao, A. El-Azab and D. Hurley, Acta Mater., 2020, 193, 61–70 CrossRef CAS.
- C. Sevik and T. Çağın, Phys. Rev. B: Condens. Matter Mater. Phys., 2009, 80, 014108 CrossRef.
- K. Clausen, W. Hayes, J. E. Macdonald, R. Osborn, P. G. Schnabel, M. T. Hutchings and A. Magerl, J. Chem. Soc. Faraday Trans. 2, 1987, 83, 1109 RSC.
- Y. Lu, Y. Yang and P. Zhang, J. Phys. Condens. Mattera, 2012, 24, 225801 CrossRef CAS PubMed.
- H. Nakamura and M. Machida, J. Nucl. Mater., 2019, 519, 45–51 CrossRef CAS.
- B. Szpunar and J. A. Szpunar, Solid State Sci., 2014, 36, 35–40 CrossRef CAS.
- G. Kresse and J. Furthmüller, Phys. Rev. B: Condens. Matter Mater. Phys., 1996, 54, 11169–11186 CrossRef CAS PubMed.
- J. Heyd, G. E. Scuseria and M. Ernzerhof, J. Chem. Phys., 2003, 118, 8207–8215 CrossRef CAS.
- J. Heyd, G. E. Scuseria and M. Ernzerhof, J. Chem. Phys., 2006, 124, 219906 CrossRef.
- J. P. Perdew, A. Ruzsinszky, G. I. Csonka, O. A. Vydrov, G. E. Scuseria, L. A. Constantin, X. Zhou and K. Burke, Phys. Rev. Lett., 2008, 100, 136406 CrossRef PubMed.
- A. E. Shields, D. Santos-Carballal and N. H. de Leeuw, J. Nucl. Mater., 2016, 473, 99–111 CrossRef CAS.
- B. T. Wang, P. Zhang, H. Song, H. Shi, D. Li and W. D. Li, J. Nucl. Mater., 2010, 401, 124–129 CrossRef CAS.
- Y. Lu, D. F. Li, B. T. Wang, R. W. Li and P. Zhang, J. Nucl. Mater., 2011, 408, 136–141 CrossRef CAS.
- X. D. Wen, R. L. Martin, L. E. Roy, G. E. Scuseria, S. P. Rudin, E. R. Batista, T. M. McCleskey, B. L. Scott, E. Bauer, J. J. Joyce and T. Durakiewicz, J. Chem. Phys., 2012, 137, 154707 CrossRef PubMed.
- H. J. Monkhorst and J. D. Pack, Phys. Rev. B: Solid State, 1976, 13, 5188 CrossRef.
- A. Togo and I. Tanaka, Scr. Mater., 2015, 108, 1–5 CrossRef CAS.
- P. B. Allen, T. Berlijn, D. A. Casavant and J. M. Soler, Phys. Rev. B: Condens. Matter Mater. Phys., 2013, 87, 085322 CrossRef.
- P. B. Allen, T. Berlijn, D. A. Casavant and J. M. Soler, Phys. Rev. B: Condens. Matter Mater. Phys., 2013, 87, 239904 CrossRef.
- M. Gajdoš, K. Hummer, G. Kresse, J. Furthmüller and F. Bechstedt, Phys. Rev. B: Condens. Matter Mater. Phys., 2006, 73, 045112 CrossRef.
- J. Skelton, Phonopy-Spectroscopy, https://github.com/JMSkelton/Phonopy-Spectroscopy, (accessed 11 June 2020) Search PubMed.
- J. M. Skelton, L. A. Burton, A. J. Jackson, F. Oba, S. C. Parker and A. Walsh, Phys. Chem. Chem. Phys., 2017, 19, 12452–12465 RSC.
- A. Togo, L. Chaput and I. Tanaka, Phys. Rev. B: Condens. Matter Mater. Phys., 2015, 91, 094306 CrossRef.
- J. M. Skelton, J. Mater. Chem. C, 2021, 9, 11772–11787 RSC.
- R. K. Behera and C. S. Deo, J. Phys. Condens. Mattera, 2012, 24, 215405 CrossRef.
- S. T. Murphy, M. W. D. Cooper and R. W. Grimes, Solid State Ionics, 2014, 267, 80–87 CrossRef CAS.
- M. W. D. Cooper, M. J. D. Rushton and R. W. Grimes, J. Phys. Condens. Mattera, 2014, 26, 105401 CrossRef CAS PubMed.
- K. Govers, S. Lemehov, M. Hou and M. Verwerft, J. Nucl. Mater., 2007, 366, 161–177 CrossRef CAS.
- V. K. Tripathi and R. Nagarajan, Inorg. Chem., 2016, 55, 12798–12806 CrossRef CAS PubMed.
- F. Hund and W. Dürrwächter, J. Inorg. Gen. Chem., 1951, 265, 67–72 CAS.
- H. J. Whitfield, D. Roman and A. R. Palmer, J. Inorg. Nucl. Chem., 1966, 28, 2817–2825 CrossRef CAS.
- K. Clausen, W. Hayes, J. E. Macdonald, P. Schnabel, M. T. Hutchings and J. K. Kjems, High. Temp. - High. Press., 1983, 15, 383–390 CAS.
- W. A. Lambertson, M. H. Mueller and F. H. Gunzel, J. Am. Ceram. Soc., 1953, 36, 397–399 CrossRef CAS.
- A. K. Tyagi and M. D. Mathews, J. Nucl. Mater., 2000, 278, 123–125 CrossRef CAS.
- G. E. Murch and C. R. A. Catlow, J. Chem. Soc., Faraday Trans. 2, 1987, 83, 1157–1169 RSC.
- R. J. M. Konings and O. Beneš, J. Phys. Chem. Solids, 2013, 74, 653–655 CrossRef CAS.
- K. Ando, Y. Oishi and Y. Hidaka, J. Chem. Phys., 2008, 65, 2751 CrossRef.
- M. Nadeem, M. Akhtar, R. Shaheen, M. Haque and A. Y. Khan, J. Mater. Sci. Technol., 2001, 17, 638 CAS.
- M. Osaka, J. Adachi, K. Kurosaki, M. Uno and S. Yamanaka, J. Nucl. Sci. Technol., 2007, 44, 1543–1549 CrossRef CAS.
- P. Martin, D. J. Cooke and R. Cywinski, J. Appl. Phys., 2012, 112, 073507 CrossRef.
- J. P. Crocombette, F. Jollet, L. T. Nga and T. Petit, Phys. Rev. B: Condens. Matter Mater. Phys., 2001, 64, 104107 CrossRef.
- Y. Yun, P. M. Oppeneer, H. Kim and K. Park, Acta Mater., 2009, 57, 1655–1659 CrossRef CAS.
- E. Hashem, A. Seibert, J. F. Vigier, M. Naji, S. Mastromarino, A. Ciccioli and D. Manara, J. Nucl. Mater., 2019, 521, 99–108 CrossRef CAS.
- J. W. L. Pang, A. Chernatynskiy, B. C. Larson, W. J. L. Buyers, D. L. Abernathy, K. J. McClellan and S. R. Phillpot, Phys. Rev. B: Condens. Matter Mater. Phys., 2014, 89, 115132 CrossRef.
- A. S. Poplavnoi, T. P. Fedorova and I. A. Fedorov, Phys. Solid State, 2017, 59, 766–772 CrossRef CAS.
- G. Dolling, R. A. Cowley and A. D. B. Woods, Can. J. Phys., 1965, 43, 1397–1413 CrossRef CAS.
- M. S. Bryan, L. Fu, K. Rickert, D. Turner, T. A. Prusnick, J. M. Mann, D. L. Abernathy, C. A. Marianetti and M. E. Manley, Commun. Phys., 2020, 3, 1–7 CrossRef.
- S. Kern and C. Y. She, Chem. Phys. Lett., 1974, 25, 287–289 CrossRef CAS.
- V. G. Keramidas and W. B. White, J. Chem. Phys., 1973, 59, 1561–1562 CrossRef.
- K. Kamali, K. Ananthasivan, T. R. Ravindran and D. S. Kumar, J. Nucl. Mater., 2017, 493, 77–83 CrossRef CAS.
- S. Knight, R. Korlacki, C. Dugan, J. C. Petrosky, A. Mock, P. A. Dowben, J. Matthew Mann, M. M. Kimani and M. Schubert, J. Appl. Phys., 2020, 127, 125103 CrossRef CAS.
- J. D. Axe and G. D. Pettit, Phys. Rev., 1966, 151, 676–680 CrossRef CAS.
- L. Malakkal, A. Prasad, E. Jossou, J. Ranasinghe, B. Szpunar, L. Bichler and J. Szpunar, J. Alloys Compd., 2019, 798, 507–516 CrossRef CAS.
- P. S. Ghosh, A. Arya, G. K. Dey, N. Kuganathan and R. W. Grimes, Phys. Chem. Chem. Phys., 2016, 18, 31494–31504 RSC.
- J. M. Skelton, D. Tiana, S. C. Parker, A. Togo, I. Tanaka and A. Walsh, J. Chem. Phys., 2015, 143, 064710 CrossRef PubMed.
- J. Park, E. B. Farfán and C. Enriquez, Nucl. Eng. Technol., 2018, 50, 731–737 CrossRef CAS.
- J. Buckeridge, D. O. Scanlon, A. Walsh, C. R. A. Catlow and A. A. Sokol, Phys. Rev. B: Condens. Matter Mater. Phys., 2013, 87, 214304 CrossRef.
- J. Park, E. B. Farfán, K. Mitchell, A. Resnick, C. Enriquez and T. Yee, J. Nucl. Mater., 2018, 504, 198–205 CrossRef CAS.
- H. Y. Xiao, Y. Zhang and W. J. Weber, Acta Mater., 2013, 61, 467–476 CrossRef CAS.
- M. W. D. Cooper, S. C. Middleburgh and R. W. Grimes, J. Nucl. Mater., 2015, 466, 29–35 CrossRef CAS.
- M. J. Rahman, B. Szpunar and J. A. Szpunar, Mater. Res. Express, 2017, 4, 075512 CrossRef.
- J. Liu, Z. Dai, X. Yang, Y. Zhao and S. Meng, J. Nucl. Mater., 2018, 511, 11–17 CrossRef CAS.
- K. Bakker, E. H. P. Cordfunke, R. J. M. Konings and R. P. C. Schram, J. Nucl. Mater., 1997, 250, 1–12 CrossRef CAS.
- C. Cozzo, D. Staicu, J. Somers, A. Fernandez and R. J. M. Konings, J. Nucl. Mater., 2011, 416, 135–141 CrossRef CAS.
- C. G. S. Pillai and P. Raj, J. Nucl. Mater., 2000, 277, 116–119 CrossRef CAS.
- M. Saoudi, D. Staicu, J. Mouris, A. Bergeron, H. Hamilton, M. Naji, D. Freis and M. Cologna, J. Nucl. Mater., 2018, 500, 381–388 CrossRef CAS.
- T. R. G. Kutty, R. V. Kulkarni, P. Sengupta, K. B. Khan, K. Bhanumurthy, A. K. Sengupta, J. P. Panakkal, A. Kumar and H. S. Kamath, J. Nucl. Mater., 2008, 373, 309–318 CrossRef CAS.
- M. Murabayashi, Y. Takahashi and T. Mukaibo, J. Nucl. Sci. Technol., 1969, 6, 657–662 CrossRef CAS.
- M. Mann, D. Thompson, K. Serivalsatit, T. M. Tritt, J. Ballato and J. Kolis, Cryst. Growth Des., 2010, 10, 2146–2151 CrossRef CAS.
- J. Tang and J. M. Skelton, J. Phys. Condens. Mattera, 2020, 33, 164002 CrossRef PubMed.
- D. H. Hurley, A. El-Azab, M. S. Bryan, M. W. D. Cooper, C. A. Dennett, K. Gofryk, L. He, M. Khafizov, G. H. Lander, M. E. Manley, J. M. Mann, C. A. Marianetti, K. Rickert, F. A. Selim, M. R. Tonks and J. P. Wharry, Chem. Rev., 2021 DOI:10.1021/acs.chemrev.1c00262.
Footnote |
| † Electronic supplementary information (ESI) available: Comparison of the ΔAf computed using methods 1 and 2; simulated Raman spectrum of stoichiometric ThO2; convergence of the harmonic CRTA functions of the pristine and defective supercells as a function of the q-point sampling mesh; comparison of CRTA calculations on the primitive cell and supercell of stoichiometric ThO2 with our selected q-point sampling; convergence of the wJDOS functions with respect to q-point sampling; comparison of the PDOS curves of stoichiometric ThO2 and the defective models; and effect of grain size on the thermal conductivity of the defect models for comparison to pristine ThO2. See DOI: 10.1039/d1ta10072f |
| This journal is © The Royal Society of Chemistry 2022 |

