Promotion of the oxygen evolution reaction via the reconstructed active phase of perovskite oxide

Hyoi Jo a, Yejin Yang a, Arim Seong a, Donghwi Jeong a, Jeongwon Kim a, Se Hun Joo a, Yu Jin Kim a, Linjuan Zhang b, Ze Liu b, Jian-Qiang Wang b, Sang Kyu Kwak *a and Guntae Kim *a
aDepartment of Energy Engineering, Ulsan National Institute of Science and Technology (UNIST), Ulsan 44919, Republic of Korea. E-mail: skkwak@unist.ac.kr; gtkim@unist.ac.kr
bKey Laboratory of Interfacial Physics and Technology, Shanghai Institute of Applied Physics, Chinese Academy of Sciences, Shanghai 201800, People's Republic of China

Received 29th September 2021 , Accepted 5th December 2021

First published on 6th December 2021


Abstract

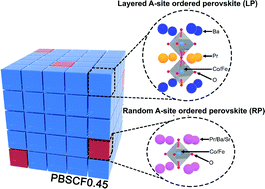
Developing a stable and highly efficient electrocatalyst for the oxygen evolution reaction (OER) is critical for renewable, safe, and emission-free energy technologies. Perovskite oxides with flexible and tunable electronic structures as functional electrocatalysts towards the OER have been investigated for decades. Various strategies for highly efficient perovskite catalysts have been proposed; however, precise insights are still lacking due to the diverse metal compositions and tunable structures. Among them, controlling the composition of the transition metals at the B-site of the double perovskite was considered as a dominant parameter to improve the electrocatalytic activity. It is known that several Co-based perovskites exhibit extraordinary OER activities and stabilities when the B-site is partially occupied by Fe. To elucidate the function of B-site tuning of perovskite oxides, PrBa0.5Sr0.5Co2−xFexO5+δ (PBSCF) catalysts with various x values were prepared. Interestingly, via X-ray diffraction (XRD) and transmission electron microscope (TEM) analysis we found that the PBSCF catalysts coexist with layered perovskite (LP) structures and randomly ordered perovskite (RP) structures. In parallel, density functional theory computational calculations were conducted to provide theoretical insights into our research results. Our findings show that doping Fe into Co-based perovskite oxides alters the intrinsic properties, yielding efficient OER activity and prolonged stability (@ 100 mA cm−2 over 2000 hours).


Introduction

With the rapid growth of energy demand, research on electrochemical conversion to valuable hydrogen energy has received much attention. Among multiple methods, water-splitting is considered an effective strategy for converting electricity from renewable sources into chemical energy.1–5 Water-splitting involves two important reactions, the hydrogen evolution reaction (HER) and oxygen evolution reaction (OER). In typical water-splitting, the overall electrical-to-chemical power conversion efficiency is largely dependent on the anodic OER process, which causes intrinsic sluggish kinetics due to four-electron transfer steps.6–8

To date, the benchmark OER electrocatalysts (i.e., IrO2 and RuO2) suffer from scarcity and poor stability in alkaline electrolytes which make them unsuitable for practical use. These concerns have encouraged elaborate research activities to find cost-effective and durable alternatives using nonprecious transition metal oxides. Indeed, the reported perovskites exhibited considerable electrocatalytic activity in alkaline electrolytes and in some cases much higher electrocatalytic activity than those of benchmark catalysts.9–14

It is well known that the OER activity of perovskites can be boosted through tailoring the lattice, surface defect, or electronic structure.8,15–17 Those factors are mainly influenced by the B-site cation catalytically active sites forming the BO6 octahedron, which are generally 3d-transition metal elements, such as Fe, Co, and Ni with various valence and spin states. In this regard, the synergistic effect of B-site rearrangement may provide the opportunity to construct optimal active sites catalyzing oxygen evolution.18–23 However, a detailed analysis of the explicit role of B-site dopants is still needed.

In this present work, we investigate the functional role of Fe dopant in enhancing the OER activities and stabilities of PBSCF by adjusting the amount precisely. All materials were prepared with a focus on tuning the electronic and lattice structures of perovskite oxides to enhance electrocatalytic activity.

Moreover, we reported for the first time PrBa0.5Sr0.5Co1.55Fe0.45O5+δ (PBSCF0.45), which shows the best OER performance through carefully modifying the B–O sharing without changing other physical properties. In parallel, we related our findings to DFT (density functional theory) computations to provide a theoretical perspective on its electronic states and performance. Both points of view indicate simultaneous manipulation of the lattice volume and electronic structure due to the fine-tuned B-site of PBSCF catalysts. Especially, the oxygen vacancy (δ) and oxidation states of the transition metals were demonstrated precisely, and they may be dominant factors for efficient electrocatalytic activity. The optimized PBSCF0.45 catalyst exhibited an outstanding Tafel slope for the OER (69 mV dec−1) compared to the commercial IrO2 catalyst (99 mV dec−1). For practical application, it showed exceptional stability for 2000 hours under 100 mA cm−2.

Results and discussion

Structural characterization

PrBa0.5Sr0.5Co2−xFexO5+δ (x = 0, 0.45, 0.5, 1.0, 1.5, and 2.0, all abbreviations of the prepared catalyst are summarized in Table S1) were synthesized via the Pechini method, followed by a super-mill (SM) process for a large surface area (Fig. S1). The structural properties of PBSCF catalysts were characterized through X-ray diffraction (XRD). As shown in Fig. S2, the peaks represent a typical perovskite structure and shift to a lower angle as Fe is doped at the B-site.18,24,25 For more insight, we carried out a Rietveld refinement analysis using the XRD pattern (Fig. S3 and Table S2). Fig. S4 shows that as the Fe content increased, the major phase was converted from LP (P4/mmm) to RP (Pm[3 with combining macron]m). The heterogeneous phase was found with increasing Fe component, with the LP phase being replaced by the RP phase (Fig. 1a). The Fe amount was optimized as 0.45 according to the OER performance, which resulted from the weight fractions of the two phases. The heterogeneous phase was further verified using a high-resolution transmission electron microscope (HR-TEM). As shown in Fig. 1b, the HR-TEM image of PBSCF0.45 reveals two different kinds of fast Fourier transform (FFT) pattern. Fig. 1b(1) was identified as the crystal structure of LP oxide corresponding to the (002) and (010) planes along the [100] zone axis. The existence of a dual-phase can be supported by superlattice reflection dots along the c-axis, indexed to (001).11,25–27 The bottom side FFT image clearly reflects the cubically arranged diffraction spots of the [100] zone axis. In addition, a lattice fringe with a lattice spacing of 0.27 nm was observed in the HR-TEM image, corresponding to the (0[1 with combining macron]1) plane (inset in Fig. 1b). Identically, we confirmed that PBSC and PBSF have a single FFT pattern representing LP and RP, respectively (Fig. S6 and S7).26 The above results indicate that the formation of the heterogeneous phase could be attributed to Fe doping. To gain more insight into the structural and electronic properties, we constructed computational PBSCF models for various Fe contents (Fig. S8 and S9). Based on the experimental observation, we modeled both the single perovskite structure (Pm[3 with combining macron]m) with the random ordering of A-site cations and the double perovskite structure (P4/mmm) with a layered ordering of A-site cations (Fig. 1c). Fig. 1d shows that the calculated lattice volume increases as the Fe ratio at B-sites increases, which is consistent with the experimental trends obtained from Rietveld refinement. To further investigate the atomic structure, the volume of the TMO6 octahedron and TM–O bond length were analyzed (TM = transition metal, Co/Fe). When comparing PBSC with PBSF, the volume of the FeO6 octahedron is larger than that of the CoO6 octahedron (Fig. S11). Accordingly, the Fe–O bond length indicates that the lattice expansion is attributed to the replacement of the smaller Co ions by the larger Fe ions. It is also worth noting that unlike the Fe–O bonds, there are two distinct Co–O bond lengths, which imply that the Jahn–Teller distortion is larger for the CoO6 octahedron compared to the FeO6 octahedron.
image file: d1ta08445c-f1.tif
Fig. 1 (a) Rietveld refined XRD pattern of PBSCF0.45. (b) Bright-field HR-TEM image (scale bar: 10 nm) of PBSCF0.45. FFT pattern corresponding to (1) and (2), respectively. (c) The crystal structure models of PBSCF perovskites. (d) Comparison of lattice volume change with increasing Fe ratio at the B-site obtained from XRD refinement and DFT calculation.

Furthermore, we investigated the formation of oxygen vacancies in PBSCF. The formation energy of oxygen vacancies was calculated for the major phase at different Fe contents: LP structure at low Fe contents (x < 1) and RP structure at high Fe contents (x > 1). The result suggests that the formation of oxygen vacancies is energetically more favorable in the LP structure at x < 1 than in the RP structure at x > 1 (Fig. S12). Based on a previous study, in the LP structure, the formation of oxygen vacancies is most preferred in the PrO plane.28 Especially, an oxygen vacancy is preferentially created in the vicinity of Co than Fe.25 However, in the RP structure, the PrO plane disappears due to the random arrangement of Pr cations at the A-site. Moreover, high Fe content increases the Fe–O–Co and Fe–O–Fe bonding configurations, where oxygen is relatively stabilized by Fe. Therefore, it is expected that the formation of oxygen vacancies is suppressed as the Fe content increases.

Scanning electron microscopy (SEM) images were recorded to examine the microstructures with a relatively similar surface morphology (Fig. S14) regardless of Fe doping. The prepared PBSCF samples also exhibited negligible differences in surface area (Fig. S15 and Table S3). These results indicated that the PBSCF series was well controlled while confirming that Fe doping did not significantly alter other physical properties.

Electronic configuration

We demonstrate the electronic configuration caused as well as the related structural identification by Fe doping. The valence state of Co can be investigated with the help of the X-ray absorption near-edge structure (XANES) spectra shown in Fig. 2a. The Co K-edge peak positions and overall shape of PBSCF catalysts are similar. As the Fe content increases, the oxidation state of Co tends to gradually increase in the LP major region, 0.45 < x ≤ 1 (inset in Fig. 2a). In addition, we have confirmed that PBSCF0.45 has the lowest oxidation state of the Co element among the samples, which means increased electron density of Co.29 The increased electron density of Co in PBSCF0.45 leads to the rise of the d-band center, causing the smallest gap (ΔEd–p) between Co d-orbitals and O p-orbitals. The increased overlap between Co d-orbitals and O p-orbitals could account for the enhanced OER activity of the catalyst. Meanwhile, the decrease in the oxidation state of PBSCF1.50 appears to be due to the heterogeneous phase caused by the rapid increase of secondary phase formation (Fig. S4). It can be said that the electronic structure is associated with the structural feature. A similar phenomenon is also observed at the Fe K-edge, indicating that PBSCF1.50 is an inflection point of the oxidation state change (Fig. S16a). To further probe the local structure of Co/Fe, we conducted the Fourier transform (FT) of a k3-weighted extended X-ray absorption fine structure (EXAFS). The overall peaks are related to the interatomic properties within the perovskite structure. In Fig. 2b, the first major peak was ascribable to the backscattering contributions from the closest ligands and was best fitted with O atoms. The second peak is the contribution from the Co–A-site cation coordination shell.30,31 Particularly, the peak at about 2.6–3.2 Å is gradually split into two peaks with Fe doping. This phenomenon is attributable to the formation of the heterogeneous phase that occurs prominently from PBSCF1.50, which is consistent with the above analyses. The peak adjacent to 3.6 Å can be ascribed to Co-metals in the corner-sharing octahedra (Co–B) of the perovskite. In this regard, the Co–B bond distance increases proportionally to the amount of Fe, which might be the result of the lattice expansion. Interestingly, a similar tendency of the Fe–B peak location was observed with the increase of Fe content (Fig. S16b).
image file: d1ta08445c-f2.tif
Fig. 2 (a) Normalized Co K-edge XANES spectra of the PBSCF catalysts. The inset shows the photon energy at an intensity of 0.8. (b) Fourier transforms of Co K-edge k3-weighted EXAFS spectra for the PBSCF catalysts. The O p- and the TM d-band centers of (c) PrBa0.5Sr0.5Co2−xFexO5.5 and (d) PrBa0.5Sr0.5Co2−xFexO6. The ΔEd–p between the O p- and TM d-band centers of (e) PrBa0.5Sr0.5Co2−xFexO5.5 and (f) PrBa0.5Sr0.5Co2−xFexO6.

To further understand the effect of the Fe dopant on the electronic structure of Co, which is considered as the major active site in PBSCF, DFT calculations were performed to analyze the change in the d-band center of Co and the gap (ΔEd–p) between the d-band center of Co and p-band center of O bonded to Co. Given that the major phase of PBSCF is the LP structure with oxygen vacancy at low Fe content (x < 1, blue region in Fig. 2c and e) and the RP structure without oxygen vacancy at high Fe content (x > 1, brown region in Fig. 2d and f), the d-band center of Co is the highest at x = 0.5. Consequently, in the LP structure with oxygen vacancy, the ΔEd–p between the d-band center of Co and the p-band center of O is the smallest at x = 0.5. These results are indicative of high hybridization and covalency between Co d-orbitals and O p-orbitals as well as enhanced charge transfer between active redox sites and adsorbed intermediates.32,33 The smallest ΔEd–p at x = 0.5 is attributed to the oxygen vacancy as well as the shrinkage of the CoO6 octahedron due to Fe doping. The presence of oxygen vacancy in x < 1 PBSCF reduced the gap between the d- and p-band centers compared to PBSCF without oxygen vacancy (Fig. 2e and f), which was consistent with the literature.33,34 In addition, the replacement of the smaller Co ions by the larger Fe ions results in compressive strains in the neighboring CoO6 octahedron and shorter Co–O bonds (blue region in Fig. S11), which shifts the d-band center of Co to higher energy and reduces the gap between the d- and p-band centers. Based on the study of correlated XAS and DFT calculations for OER catalysts, we concluded that the optimized d-band center of Co through fine control of Fe doping promotes the electrocatalytic performance in the OER process.

Half-cell configured electrochemical analysis

The electrocatalytic activity of the prepared catalysts for the OER was evaluated in a standard three-electrode configuration using a rotating ring-disk electrode (RRDE) measurement. Fig. 3a presents the OER polarization curves of the PBSCF catalysts with fine-tuned B-sites. IrO2, known as the benchmark catalyst for the OER, was applied as a reference catalyst. The onset potential of PBSC, PBSCF1.00, PBSCF1.50, and PBSF samples had similar values close to 1.50 V (vs. RHE), while PBSCF0.45 and PBSCF0.50 exhibited onset potential at 1.48 V (vs. RHE). The difference in the onset potential indicates that the conductivity was influenced by the formation of secondary phases identified by structural analysis. As an inherent parameter to assess the OER kinetics of catalysts, the Tafel slope is derived from polarization curves. As expected, the Tafel slope for PBSCF0.45 is calculated in detail to be 69 mV dec−1, clearly lower than those of other species (70–124 mV dec−1), further evidencing the fast OER kinetics (Fig. 3b). ECSA values were investigated from the double-layer capacitance (Cdl) as shown in Fig. 3c. The recorded cyclic voltammetry (CV) curves at different scan rates are shown in Fig. S20. PBSCF0.45 gives the largest Cdl value (42.23 mF cm−2) while PBSF has the lowest value (15.95 mF cm−2), suggesting the active area difference. Moreover, electrochemical impedance spectroscopy (EIS) analysis was performed to understand the effect of electrical conductivity on the OER performance. The circuit consisting of electrolyte resistance (Rs), charge transfer resistance (Rct), and constant phase element (CPE) is shown in the Fig. 3d inset. The order of the charge transfer resistance for the PBSCF catalysts is PBSF (29.26 Ω cm2), PBSC (26.73 Ω cm2), PBSCF1.50 (15.87 Ω cm2), PBSCF1.00 (13.04 Ω cm2), PBSCF0.50 (4.6 Ω cm2), and PBSCF0.45 (4.53 Ω cm2), which coincides with the order of the OER activity. PBSCF0.45 exhibits the smallest charge transfer resistance during the OER, thereby achieving faster and more efficient charge transfer for OER electrocatalysis.
image file: d1ta08445c-f3.tif
Fig. 3 Electrochemical performance of the PBSCF catalysts for the OER. (a) The polarization curves, (b) Tafel slopes, (c) capacitive currents (at 1.15 V vs. RHE) at different scan rates, and (d) EIS curves (at 1.5 V vs. RHE) measured in N2-saturated 1 M KOH. The double layer capacitances of each catalyst are shown in Table S4. (e) Overpotential at a current density of 10 mA cm−2 (top) and mass activity at an overpotential of 0.3 V (bottom) for the PBSCF catalysts and IrO2. (f) Specific activity normalized by ECSA and catalyst surface area at 1.53 V (vs. RHE). (g) Overpotential of the OER for PBSCF0.45 (@ 10 mA cm−2) compared with those of various perovskite-based catalysts.

In Fig. 3e and f, the noticeable OER activity of PBSCF0.45 is shown. At a current density of 10 mA cm−2, the overpotential of the PBSCF0.45 catalyst is 0.29 V, which is 0.10 V less than that of the benchmark IrO2 with an overpotential of 0.39 V as shown in the top of Fig. 3e. The bottom of Fig. 3e compares the mass activity of electrocatalysts at an overpotential of 0.3 V. The prepared PBSCF catalysts had higher mass activity than that of the IrO2 benchmark catalyst. Additionally, the mass activity of PBSCF0.45 (134.91 A gcatalyst−1) reaches about 6 times higher than that of IrO2 (22.62 A gcatalyst−1). It is necessary to evaluate the intrinsic activity of the catalyst by excluding parameters such as the actual catalyst surface area or ECSA. Fig. 3f compares the intrinsic OER activities normalized to ECSA and the surface area. PBSCF0.45 has about 8 times higher specific activity for BET surface area and about 3 times higher specific activity for ECSA than the IrO2 benchmark catalyst. In view of the outstanding OER catalytic performance of PBSCF0.45, various state-of-the-art perovskite-based catalysts tested under similar conditions (in 1.0 M KOH solution) in the literature were introduced for comparison (Table S5). As can be seen in Fig. 3g, the OER activity of PBSCF0.45 ranks the highest among perovskite oxide-based catalysts ever reported.

Evaluation of electrochemical activities in practical applications

To evaluate the electrochemical performance and stability in practical application, the prepared PBSCF0.45 catalyst was investigated in a water-splitting system. The water-splitting system was operated in a three-electrode configuration (vs. Hg/HgO). The iridium oxide (IrO2) is used for the anode catalyst, which is generally used as a reference OER electrode. Fig. 4a is an illustration of a water-splitting system that shows that hydrogen (H2) gas and oxygen (O2) gas are actively generated at the cathode and anode, respectively. The linear sweep voltammetry (LSV) polarization curve shows the electrochemical performance of water-splitting at various current densities from 0 to 250 mA cm−2 (Fig. 4b). To differentiate the detailed electrochemical analysis, the polarization curve was separated into the obtained cell potential (Ecell = EanodeEcathode), Eanode (OER), and Ecathode (HER). Although the open-circuit voltage (OCV) using the PBSCF0.45 electrode was almost the same as that using the IrO2 electrode, there was a sharp increase in current density with increasing overpotential. Thus, to achieve a current density of 250 mA cm−2, the PBSCF0.45 electrode requires a lower potential of 1.03 V vs. Hg/HgO in Eanode, which has a significantly lower value than that of the benchmark IrO2 electrode (1.34 V vs. Hg/HgO). To investigate the electrochemical stability and durability of the PBSCF0.45 catalyst, we measured its chronopotentiometry (CP) profiles at a current density of 100 mA cm−2, as shown in Fig. 4d. The onset potential values before and after the CP test for the PBSCF0.45 and IrO2 electrodes can be seen in Fig. 4c. The benchmark IrO2 electrode showed gradual degradation for the anodic reaction rather than PBSCF0.45 during the continuously harsh test. In contrast, PBSCF0.45 exhibited a remarkably stable operation over 2000 h without an observable change in electrochemical performance demonstrating its exceptional durability in the OER, even at a high current density of 100 mA cm−2.
image file: d1ta08445c-f4.tif
Fig. 4 (a) Illustration of the water-splitting system. (b) Comparison of IV profiles of the PBSCF0.45 catalyst and the IrO2 benchmark catalyst in the water-splitting system. (c) Durability test of PBSCF0.45 and IrO2. The polarization curve was recorded before and after the CP test. (d) CP stability profiles of the PBSCF0.45 and IrO2 catalysts at a constant current density of 100 mA cm−2 for 2000 hours.

The results of the practical application indicate that the electrocatalytic activity and stability of PBSCF0.45 correspond well with the RRDE measurements. Consequently, these electrochemical results imply that the well-developed perovskite oxide electrocatalyst exhibited overwhelming water electrolysis stability compared to that achieved in other studies.

Conclusion

In summary, we have demonstrated in detail the correlation between B-site doping and OER performance for PrBa0.5Sr0.5Co2−xFexO5+δ. Upon replacing Co with Fe, the LP structure is converted to the RP structure. The formation of the secondary phase affects the conductivity associated with electrocatalyst activity. However, the appropriate amount of Fe yields favorable OER activity by not only generating high hybridization and covalency of Co–O but also enhancing charge transfer between active redox sites and adsorbed intermediates. We reported for the first time PrBa0.5Sr0.5Co1.55Fe0.45O5+δ (PBSCF0.45) in the composition of PBSCF. PBSCF0.45 showed remarkable oxygen-generating activity in alkaline medium with lower overpotential (0.29 V) and higher specific activity than benchmark IrO2. Evaluation for practical application using a water-splitting system confirmed that PBSCF0.45 had exceptional stability for 2000 hours (@ 100 mA cm−2). We present a method to design OER-optimized perovskite oxide electrocatalysts by identifying structural and electronic state changes following B-site doping.

Experimental section

Synthesis of PrBa0.5Sr0.5Co2−xFexO5+δ

PrBa0.5Sr0.5Co2−xFexO5+δ (PBSCF) (x = 0, 0.45, 0.5, 1.0, 1.5, and 2.0) were synthesized using the Pechini method. Stoichiometric amounts of Pr(NO3)3·6H2O (Aldrich, 99.9%, metal basis), Ba(NO3)2 (Aldrich, 99+%), Sr(NO3)2 (Aldrich, 99+%), Co(NO3)2·6H2O (Aldrich, 98+%), Fe(NO3)3·9H2O (Aldrich, 98%), citric acid, and ethylene glycol were dissolved in distilled water under continuous stirring. This solution was thoroughly mixed with a magnetic stirrer and combusted through the gelation process. The remaining powder was collected, followed by calcination at 600 °C for 4 hours and ball-milled in acetone for 24 hours. Then, the resultant powders were sintered in air at 1100 °C for 4 hours. The sintered PBSCF underwent a high-energy milling process (Super-mill PM 100, Retsch, Fig. S1) resulting in increased surface area, which influenced the enhancement of OER activity (Fig. S18). The chemical composition of the samples and their abbreviations are given in Table S1.

Structural characterization

For evaluation of the structural properties, the powder was calcined at 1100 °C for 12 hours to form the phase. The crystalline structures of the PBSCF catalysts were confirmed using X-ray powder diffraction (XRD, Rigaku-diffractometer, Cu Kα radiation) at a scan rate of 0.5° min−1 in the 2θ range of 15 to 105°. The Rietveld refinement method via the GSAS II program was used to analyze the crystal structure and lattice parameters of the sample. The morphology of the PBSCF catalysts was observed using a field emission scanning electron microscope (Nova Nano SEM, FEI). The detailed crystal structure was performed using high-resolution transmission electron microscopy (HR-TEM, JEOL, JEM-2100F). The surface area of the sample was calculated by measuring N2 adsorption–desorption isotherms using a BELSORP-mini and the Brunauer–Emmett–Teller (BET) method. Analysis of the K-edge X-ray absorption spectroscopy (XAS) of Co and Fe was conducted at beamline 14W1 of the Shanghai Synchrotron Radiation Facility (SSRF) and beamline 1W1B of the Beijing Synchrotron Radiation Facility (BSRF) in China.

Electrochemical measurements

The electrochemical test was performed using a BioLogic VMP3 with the RRDE-3A (ALS Co.) rotating disk electrode system. A graphite rod and Hg/HgO electrode (saturated KOH filled) were used as the counter electrode and the reference electrode, respectively. As the working electrode, a glassy carbon (GC) electrode with an area of 0.13 cm2 was used. Ink solutions for each catalyst were manufactured by adding 10 mg of catalyst to the mixed solution of EtOH/isopropyl alcohol (IPA) with a 1[thin space (1/6-em)]:[thin space (1/6-em)]1 volumetric ratio and adding 5 mg Nafion (Sigma-Aldrich). Then, the mixture was ultrasonicated for 1 h to form homogeneous catalyst inks. Electrochemical measurement was carried out by drop-coating 5 μL of the prepared ink on the working electrode. Calibration of the reversible hydrogen electrode (RHE) for the Hg/HgO reference electrode was determined at a scan rate of 1 mV s−1 in H2-saturated 1 M KOH using platinum wire as the working and the counter electrode (Fig. S17). All half-cell profiles were iR compensated by resistance from the measured solution. The OER profile was then investigated in an aqueous N2-saturated 1 M KOH solution with a scan rate of 10 mV s−1. All CV profiles were iR compensated by measuring the resistance of the solution. Transforming the potential to the RHE scale (ERHE) was performed using the following equation:
E (V vs. RHE) = E0Hg/HgO + EHg/HgO + 0.0591 × pH
where E0Hg/HgO and EHg/HgO are 0.098 V and the measured potential for Hg/HgO, respectively.

The water-splitting test was conducted using a BioLogic VMP3 with a three-electrode configuration using Hg/HgO as a reference electrode. The cathode and anode were prepared by electro-spraying the prepared catalyst ink on Ni mesh as a current collector with a catalyst loading density of 1 mg cm−2. The measurement was carried out in a 1 M KOH aqueous solution. The current density was normalized with the geometric area of the catalyst.

Computational details

To investigate the effect of Fe dopant on the structural and electronic properties of PBSCF, we constructed PBSCF models for various Fe contents (x = 0, 0.5, 1.0, 1.5, and 2.0). Based on the experimental observation of the coexistence of RP and LP, we modeled both the single perovskite structure (Pm[3 with combining macron]m) with the random ordering of A-site cations and the double perovskite structure (P4/mmm) with a layered ordering of A-site cations. The unit cells of Pm[3 with combining macron]m and P4/mmm perovskite structures were obtained from the Materials Project databases (mp-20427 and mp-22751). Depending on the perovskite structure and chemical composition, different supercell models were constructed: 2 × 2 × 2 supercell of the Pm[3 with combining macron]m perovskite structure and √2 × √2 × 1 supercell of the P4/mmm perovskite structure for PBSC (x = 0) and PBSF (x = 2), and 2√2 × 2√2 × 2 supercell of the Pm[3 with combining macron]m perovskite structure and 2 × 2 × 1 of the P4/mmm perovskite structure for other compositions (x = 0.5, 1.0, and 1.5) (Fig. S8). In all chemical compositions, Pr, Ba, and Sr atoms were randomly distributed in the A-site in the RP models, while Pr and Ba/Sr atoms were ordered in alternating layers along the c axis in the LP models. For PBSCF with x = 0.5, 1.0, and 1.5, Fe dopants were distributed homogeneously in the B-site. Furthermore, we also constructed models for PrBa0.5Sr0.5Co2−xFexO5.5 by introducing oxygen vacancies next to Co atoms to study the effect of oxygen vacancy (Fig. S9). In the RP models, oxygen vacancies were homogeneously distributed, while oxygen vacancies were distributed in the PrO layer in the LP models.

All spin-polarized DFT calculations were performed using the Vienna Ab initio Simulation Package (VASP)35,36 with the projector-augmented-wave (PAW) method.37 The generalized gradient approximation (GGA) with the Perdew–Burke–Ernzerhof (PBE) functional was used to describe the exchange–correlation potential of electrons.38 The wave functions were expanded using a kinetic energy cutoff of 550 eV. The Brillouin zone was integrated with the gamma-centered Monkhorst–Pack k-point grids: 3 × 3 × 3 k-point grid for the PBSC (x = 0) and PBSF (x = 2), and 2 × 2 × 3 k-point grid for the other compositions (x = 0.5, 1.0, and 1.5).39 The convergence criterion for the self-consistent field calculation was set to 1 × 10⁻⁶ eV. The atomic positions and lattice parameters were fully relaxed until the Hellmann–Feynman forces were less than 0.01 eV Å−1. To compensate for the self-interaction error of GGA, Hubbard U correction (GGA + U) was introduced for Co (U = 3.3) and Fe (U = 5.3).40 Through fixed spin multiplet calculation for PBSC and PBSF, the intermediate spin state of Co and the high spin state of Fe were found to be the most energetically stable. Therefore, in all calculations, initial spin states of Co and Fe were specified as intermediate and high spin states. In the optimized structure, the resulting magnetic moment of the transition metal indicates that Co is in the intermediate spin state and Fe is in the high spin state, respectively (Fig. S13).

The oxygen vacancy formation energy (EVo) at the O-rich limit was calculated as follows.

image file: d1ta08445c-t1.tif
where Ebulk and Edefect are the calculated energies of PrBa0.5Sr0.5Co2−xFexO6 and PrBa0.5Sr0.5Co2−xFexO5.5, which are normalized to a formula with O12 and O11, respectively, and EO2 is the energy of a gas-phase oxygen molecule.

The projected density of states (PDOS) of oxygen p-orbitals and transition metal d-orbitals was calculated to obtain the d–p band center gap (ΔEd–p). The p-band center of oxygen (εp) and the d-band center of the transition metals (εd) were calculated as follows.

image file: d1ta08445c-t2.tif
where ρp or d is the density of states projected onto p- or d-orbitals and Ef is the Fermi energy.

Author contributions

H. J. and Y. Y. conceived the designed research. H. J. and Y. Y. performed the overall electrochemical analysis. A. S. and J. K. discussed the structural analysis. S. H. J., Y. J. K., and S. K. K. performed computational calculations and discussed the results. L. Z., Z. L., and J.-Q. W. conducted the XAFS measurements. The work was conceived, planned, and supervised by G. K. All authors contributed to writing the manuscript.

Conflicts of interest

The authors declare no competing financial interests.

Acknowledgements

This work was supported by National Research Foundation of Korea (NRF) grants (2020M1A2A2080877 and 2021R1A5A6002853). This work was supported by the Global PhD Fellowship Program through an NRF grant funded by the Korean government (NRF-2018H1A2A1060644) and partially supported by “The Transformational Technologies for Clean Energy and Demonstration” (XDA21000000) through the Strategic Priority Research Program of the Chinese Academy of Sciences. This research was also supported by the K. C. Wong Education Foundation (GJTD-2018-10). The computational resources were supported by KISTI (KSC-2021-CRE-0205).

References

  1. W. Yuan, S. Wang, Y. Ma, Y. Qiu, Y. An and L. Cheng, ACS Energy Lett., 2020, 5, 692–700 CrossRef CAS .
  2. N. Oh, C. Kim, J. Lee, O. Kwon, Y. Choi, G. Jung, H. Lim, S. Kwak, G. Kim and H. Park, Nat. Commun., 2019, 10, 1723 CrossRef PubMed .
  3. Y. Yang, J. Kim, C. Kim, A. Seong, O. Kwon, J. H. Lee, I. Kristanto, L. Zhang, J. Zhou, J. Q. Wang, J. B. Baek, S. K. Kwak and G. Kim, Nano Energy, 2020, 76, 105114 CrossRef CAS .
  4. C. Kim, J. Kim, S. Joo, Y. Yang, J. Shin, M. Liu, J. Cho and G. Kim, Angew. Chem., Int. Ed., 2019, 58, 9506–9511 CrossRef CAS PubMed .
  5. N. K. Dang, J. N. Tiwari, S. Sultan, A. Meena and K. S. Kim, Chem. Eng. J., 2021, 404, 126513 CrossRef CAS .
  6. C. Hu, L. Zhang and J. Gong, Energy Environ. Sci., 2019, 12, 2620–2645 RSC .
  7. Y. Yang, J. Kim, C. Kim, A. Seong, O. Kwon, J. Lee, I. Kristanto, L. Zhang, J. Zhou, J.-Q. Wang, J. B. Baek, S. K. Kwak and G. Kim, Nano Energy, 2020, 76, 105114 CrossRef CAS .
  8. N. I. Kim, Y. J. Sa, T. S. Yoo, S. R. Choi, R. A. Afzal, T. Choi, Y. S. Seo, K. S. Lee, J. Y. Hwang, W. S. Choi, S. H. Joo and J. Y. Park, Sci. Adv., 2018, 4, eaap9360 CrossRef PubMed .
  9. G. Chen, Z. Hu, Y. Zhu, Z. G. Chen, Y. Zhong, H. J. Lin, C. Te Chen, L. H. Tjeng, W. Zhou and Z. Shao, J. Mater. Chem. A, 2018, 6, 9854–9859 RSC .
  10. J. Kim, O. Gwon, O. Kwon, J. Mahmood, C. Kim, Y. Yang, H. Lee, J. Lee, H. Jeong, J. Baek and G. Kim, ACS Nano, 2019, 13, 5502–5512 CrossRef CAS PubMed .
  11. Q. Lin, Y. Zhu, Z. Hu, Y. Yin, H. J. Lin, C. Te Chen, X. Zhang, Z. Shao and H. Wang, J. Mater. Chem. A, 2020, 8, 6480–6486 RSC .
  12. Y. Yi, Q. Wu, J. Li, W. Yao and C. Cui, ACS Appl. Mater. Interfaces, 2021, 13, 17439–17449 CrossRef CAS PubMed .
  13. H. Zhang, D. Guan, X. Gao, J. Yu, G. Chen, W. Zhou and Z. Shao, J. Mater. Chem. A, 2019, 7, 19228–19233 RSC .
  14. Y. Pan, X. Xu, Y. Zhong, L. Ge, Y. Chen, J.-P. M. Veder, D. Guan, R. O'Hayre, M. Li, G. Wang, H. Wang, W. Zhou and Z. Shao, Nat. Commun., 2020, 11, 2002 CrossRef CAS PubMed .
  15. D. Chen, M. Qiao, Y. R. Lu, L. Hao, D. Liu, C. L. Dong, Y. Li and S. Wang, Angew. Chem., Int. Ed., 2018, 57, 8691–8696 CrossRef CAS PubMed .
  16. W. T. Hong, M. Risch, K. A. Stoerzinger, A. Grimaud, J. Suntivich and Y. S. Horn, Energy Environ. Sci., 2015, 8, 1404–1427 RSC .
  17. Y. L. Lee, J. Kleis, J. Rossmeisl, S. H. Yang and D. Morgan, Energy Environ. Sci., 2011, 4, 3966–3970 RSC .
  18. B. Zhao, L. Zhang, D. Zhen, S. Yoo, Y. Ding, D. Chen, Y. Chen, Q. Zhang, B. Doyle, X. Xiong and M. Liu, Nat. Commun., 2017, 8, 14586 CrossRef CAS PubMed .
  19. H. Sun, X. Xu, Z. Hu, L. H. Tjeng, J. Zhao, Q. Zhang, H. J. Lin, C. T. Chen, T. S. Chan, W. Zhou and Z. Shao, J. Mater. Chem. A, 2019, 7, 9924–9932 RSC .
  20. F. Dong, L. Li, Z. Kong, X. Xu, Y. Zhang, Z. Gao, B. Dongyang, M. Ni, Q. Liu and Z. Lin, Small, 2021, 17, 2006638 CrossRef CAS PubMed .
  21. M. Seo, H. Park, D. Lee, M. Park and Z. Chen, ACS Catal., 2015, 5, 4337–4344 CrossRef CAS .
  22. H. Wang, J. Wang, Y. Pi, Q. Shao, Y. Tan and X. Huang, Angew. Chem., 2019, 131, 2338–2342 CrossRef .
  23. X. Xu, C. Su, W. Zhou, Y. Zhu, Y. Chen and Z. Shao, Adv. Sci., 2016, 3, 1500187 CrossRef PubMed .
  24. Y. Bu, O. Gwon, G. Nam, H. Jang, S. Kim, Q. Zhong, J. Cho and G. Kim, ACS Nano, 2017, 11, 11594–11601 CrossRef CAS PubMed .
  25. S. Choi, S. Yoo, J. Kim, S. Park, A. Jun, S. Sengodan, J. Kim, J. Shin, H. Jeong, Y. Choi, G. Kim and M. Liu, Sci. Rep., 2013, 3, 2426 CrossRef PubMed .
  26. S. Sengodan, S. Choi, A. Jun, T. H. Shin, Y. W. Ju, H. Y. Jeong, J. Shin, J. T. S. Irvine and G. Kim, Nat. Mater., 2015, 14, 205–209 CrossRef CAS PubMed .
  27. Y. Zhu, W. Zhou, J. Sunarso, Y. Zhong and Z. Shao, Adv. Funct. Mater., 2016, 26, 5862–5872 CrossRef CAS .
  28. U. Anjum, T. S. Khan, M. Agarwal and M. A. Haider, ACS Appl. Mater. Interfaces, 2019, 11, 25243–25253 CrossRef CAS PubMed .
  29. B. J. Kim, E. Fabbri, D. F. Abbott, X. Cheng, A. H. Clark, M. Nachtegaal, M. Borlaf, I. E. Castelli, T. Graule and T. J. Schmidt, J. Am. Chem. Soc., 2019, 141, 5231–5240 CrossRef CAS PubMed .
  30. S. K. Pandey, S. Khalid, N. P. Lalla and A. V. Pimpale, J. Phys.: Condens. Matter, 2006, 18, 10617–10630 CrossRef CAS .
  31. E. Fabbri, M. Nachtegaal, T. Binninger, X. Cheng, B. J. Kim, J. Durst, F. Bozza, T. Graule, R. Schäublin, L. Wiles, M. Pertoso, N. Danilovic, K. E. Ayers and T. J. Schmidt, Nat. Mater., 2017, 16, 925–931 CrossRef CAS PubMed .
  32. A. Grimaud, O. D. Morales, B. Han, W. T. Hong, Y. L. Lee, L. Giordano, K. A. Stoerzinger, M. T. M. Koper and Y. S. Horn, Nat. Chem., 2017, 9, 457–465 CrossRef CAS PubMed .
  33. J. Wang, Y. Gao, D. Chen, J. Liu, Z. Zhang, Z. Shao and F. Ciucci, ACS Catal., 2018, 8, 364–371 CrossRef CAS .
  34. J. T. Mefford, X. Rong, A. M. Abakumov, W. G. Hardin, S. Dai, A. M. Kolpak, K. P. Johnston and K. J. Stevenson, Nat. Commun., 2016, 7, 11053 CrossRef CAS PubMed .
  35. G. Kresse and J. Furthmüller, Phys. Rev. B: Condens. Matter Mater. Phys., 1996, 54, 11169–11186 CrossRef CAS PubMed .
  36. G. Kresse and J. Furthmüller, Comput. Mater. Sci., 1996, 6, 15–50 CrossRef CAS .
  37. G. Kresse and D. Joubert, Phys. Rev. B: Condens. Matter Mater. Phys., 1999, 59, 1758–1775 CrossRef CAS .
  38. J. P. Perdew, K. Burke and M. Ernzerhof, Phys. Rev. Lett., 1996, 77, 3865–3868 CrossRef CAS PubMed .
  39. H. J. Monkhorst and J. D. Pack, Phys. Rev. B: Solid State, 1976, 13, 5188–5192 CrossRef .
  40. A. Jain, S. P. Ong, G. Hautier, W. Chen, W. D. Richards, S. Dacek, S. Cholia, D. Gunter, D. Skinner, G. Ceder and K. A. Persson, APL Mater., 2013, 1, 011002 CrossRef .

Footnotes

Electronic supplementary information (ESI) available: Tables S1–S5 and Fig. S1–S20. See DOI: 10.1039/d1ta08445c
These authors contributed equally to this work.

This journal is © The Royal Society of Chemistry 2022