
 Open Access Article
 This Open Access Article is licensed under a
 Creative Commons Attribution 3.0 Unported Licence
Halogenation of Li7La3Zr2O12 solid electrolytes: a combined solid-state NMR, computational and electrochemical study†
Bo
Dong
 *a,
Abby R.
Haworth
b,
Stephen R.
Yeandel
cd,
Mark P.
Stockham
a,
Matthew S.
James
a,
Jingwei
Xiu
a,
Dawei
Wang
de,
Pooja
Goddard
c,
Karen E.
Johnston
b and
Peter R.
Slater
*a
*a,
Abby R.
Haworth
b,
Stephen R.
Yeandel
cd,
Mark P.
Stockham
a,
Matthew S.
James
a,
Jingwei
Xiu
a,
Dawei
Wang
de,
Pooja
Goddard
c,
Karen E.
Johnston
b and
Peter R.
Slater
*a
aSchool of Chemistry, University of Birmingham, B15 2TT, UK. E-mail: b.dong@bham.ac.uk; p.r.slater@bham.ac.uk
bDepartment of Chemistry, Durham University, DH1 3LE, UK
cDepartment of Chemistry, Loughborough University, Loughborough, LE11 3TU, UK
dDepartment of Materials Science and Engineering, The University of Sheffield, S1 3JD, UK
eShenzhen Institute of Advanced Electronic Materials, Shenzhen Institute of Advanced Academy of Sciences, Shenzhen, 518055, China
First published on 4th May 2022
Abstract
Garnet-based solid electrolytes have been proposed as promising candidates for next generation all-solid-state batteries. Whilst multiple cation substitution studies of these garnets have been undertaken to try and improve their overall performance, anion doping of garnets has rarely been attempted, owing to the synthetic challenges associated with this particular doping strategy. In this work, we present the halogenation (F, Cl) of the solid state electrolyte Li7La3Zr2O12 (LLZO) via a low temperature solid state synthetic route using PTFE and PVC polymers. A reduction in tetragonal distortion (F incorporation) and a tetragonal to cubic phase transition (Cl incorporation) is observed in halogenated LLZO, suggesting the replacement of O2− with F− or Cl− is associated with the creation of lithium vacancies. Combined solid-state NMR and computational studies support the presence of F− or Cl− in halogenated LLZO. The effects of surface fluorination were also investigated for Al-doped LLZO (Li6.4Al0.2La3Zr2O12, LLAZO) with the results suggesting that this strategy has the ability to prevent full dendrite penetration at high current densities (up to 10 mA cm−2).
Introduction
State-of-the-art lithium-ion batteries (LIBs) have dominated the portable electronics industry for almost three decades, owing to their outstanding cycling stability and high energy densities.1 In recent years, the development of electric vehicles (EVs) and large-scale off-grid harvesting facilities have called for energy storage systems with higher energy densities and improved safety.2 However, the flammable electrolytes used in conventional LIBs, typically LiPF6 in an organic solvent, raises significant safety concerns in the event of thermal runaway of the cell. Consequently, current technology relies heavily upon the efficient heat management of battery packs, especially in EVs. All-solid-state batteries (ASSBs), which replace the organic liquid electrolyte with a non-flammable inorganic solid electrolyte, overcome these safety issues, whilst also being chemically stable with Li metal anodes and high voltage cathode materials. Consequently, ASSBs are being considered as potential candidates to improve both the performance and safety of LIBs.3,4Amongst the plethora of ceramic electrolytes investigated, lithium-rich garnets combine relatively good electrochemical stability to Li metal with chemical stability in air and high room temperature ionic conductivities. Hence, these materials are promising potential solid electrolytes for practical applications.5–10 The ideal garnet framework has the general formula A3B2C3O12, where A, B and C are eight, six and four oxygen coordinated sites, respectively, with space group Ia![[3 with combining macron]](https://www.rsc.org/images/entities/char_0033_0304.gif) d. Stoichiometric lithium-containing garnets such as Y3Te2Li3O12 typically exhibit poor ionic conductivity, as lithium fully occupies the tetrahedral C-site, meaning there are no sites available to accommodate any mobile Li. However, in 2003, fast Li+ ion conduction was reported by Thangadurai et al.11 in the lithium-rich garnet Li5La3M2O12 (M = Nb, Ta). In these systems, in addition to Li being in the tetrahedral 24d sites, it also partially occupies the distorted octahedral 96h and 48g sites. Since this initial work by Thangadurai et al., higher Li contents, of up to a maximum of 7 per formula unit have been reported, e.g., Li7La3Zr2O12 (LLZO). Such an increase in Li content typically results in an increase in ionic conductivity. However, at the maximal (7) Li content, the conductivity decreases due to lithium ordering (to reduce short Li–Li distances), which reduces the symmetry from a cubic to tetragonal cell (I41/acd). This results in a structure where all of the lithium sites (tetrahedral 8a and octahedral 16f and 32g) are fully occupied.12,13
d. Stoichiometric lithium-containing garnets such as Y3Te2Li3O12 typically exhibit poor ionic conductivity, as lithium fully occupies the tetrahedral C-site, meaning there are no sites available to accommodate any mobile Li. However, in 2003, fast Li+ ion conduction was reported by Thangadurai et al.11 in the lithium-rich garnet Li5La3M2O12 (M = Nb, Ta). In these systems, in addition to Li being in the tetrahedral 24d sites, it also partially occupies the distorted octahedral 96h and 48g sites. Since this initial work by Thangadurai et al., higher Li contents, of up to a maximum of 7 per formula unit have been reported, e.g., Li7La3Zr2O12 (LLZO). Such an increase in Li content typically results in an increase in ionic conductivity. However, at the maximal (7) Li content, the conductivity decreases due to lithium ordering (to reduce short Li–Li distances), which reduces the symmetry from a cubic to tetragonal cell (I41/acd). This results in a structure where all of the lithium sites (tetrahedral 8a and octahedral 16f and 32g) are fully occupied.12,13
Tetragonal Li7-based systems have a temperature dependant tetragonal to cubic phase transition, e.g., Li7La3Zr2O12 transforms to a cubic phase at 725 °C.14 This cubic phase, which is highly conductive, can be stabilised at lower temperature by the introduction of lithium vacancies via numerous doping strategies, including Nb, Ta on the Zr site or Al, Ga on the Li site.15–21 The tetragonal to cubic transition in these garnets can also be facilitated by the well-known, yet highly undesirable, proton/lithium exchange that occurs in a humid atmosphere.22–27 Structural studies have demonstrated that both the lithium content and lithium distribution within the garnet framework impact both the ion migration pathway and the ionic conductivity, with the optimum conductivity typically observed for lithium contents of 6.4–6.6 per garnet formula.5,7,9,28,29 In addition to optimising the Li-ion conductivity of lithium-rich garnets via cationic doping, considerable attention has been focused on overcoming the high interfacial resistance between the electrolyte and electrodes, as well as trying to eliminate dendrite infiltration through the electrolyte.30–38 It has been reported that the application of coatings to the garnet pellets (and consequently lithium alloying with the coating at the interface) and hybrid polymer-garnet electrolyte composite systems can mitigate these problems to a degree.39–49 Short circuiting behaviour in the garnet system was also recently reported to be reversible, which can be healed by a low current density electrochemical process.50,51
Whilst there have been numerous cation doping studies of garnet-based materials, the investigation of anion doping strategies is limited, despite prior computational studies suggesting that F-doping in La3Zr2Li7O12 may be beneficial.52–54 This omission is likely linked to the challenges associated with the preparation of such F-containing mixed metal oxides, owing to the high thermodynamic stability of the fluoride starting materials, e.g., LaOF, which is a thermodynamically favoured F-containing product at the usual synthesis temperatures.55 Additionally, F may be lost at elevated temperatures through the reaction with moisture, thereby liberating HF. To overcome this, low temperatures (typically <400 °C) and precursors with a similar structure are commonly used. To successfully achieve fluorination, a wide range of reagents have been employed, including F2, NH4F, and XeF2, with the use of F-containing polymers attracting the greatest interest.56–58 Polymers such as polyvinylidene fluoride (PVDF) and polytetrafluoroethylene (PTFE) have been widely used for the low temperature fluorination of perovskite and related mixed metal oxide systems, leading to a wide range of new oxide fluorides exhibiting interesting magnetic properties, as well as materials of interest for use in F-ion batteries.59
Here, we have applied polymer fluorination methods to solid electrolyte materials for the first time, aiming to fluorinate the Li-stuffed garnet Li7La3Zr2O12 (LLZO) and create lithium vacancies (i.e., to form the system Li7−xLa3Zr2O12−xFx), which our previous computational studies suggest should exhibit a change from tetragonal to cubic symmetry.52 In addition, we investigate whether chlorination can be achieved using a similar synthetic route to produce Li7−xLa3Zr2O12−xClx. A comprehensive study, combining powder X-ray diffraction (XRD), solid-state nuclear magnetic resonance (NMR) spectroscopy, computational modelling and electrochemical testing is reported to investigate the effects of both F- and Cl-doping on the structure and the associated physical properties of halogenated LLZO. We also investigate the effects of surface fluorination on the performance of Al-doped LLZO (Li6.4Al0.2La3Zr2O12, LLAZO).
Experimental
Synthesis of F(Cl)-doped Li7La3Zr2O12
Two routes were investigated for the halogenation of Li7La3Zr2O12. The first method utilised a standard high temperature synthesis route, in which stoichiometric amounts of lithium fluoride (99%, Alfa Aesar) or lithium chloride (99%, Sigma Aldrich), lithium carbonate (99%, Alfa Aesar), zirconium oxide (99%, Alfa Aesar) and lanthanide oxide (99.9%, Alfa Aesar) were mixed and ground using an agate mortar and pestle before being heated to 650 °C for 12 h. The mixture was subsequently ball milled for 30 min with 20% excess lithium carbonate, which was added to compensate for the loss of Li during the high temperature synthesis. The resulting powders were then pressed into pellets (13 mm diameter) using 0.2 tons pressure and heated to 1050 °C for 12 h.For the second method, a sample of tetragonal Li7La3Zr2O12 was prepared via the route described above (omitting the addition of LiF or LiCl). The Li7La3Zr2O12 sample was then mixed with PTFE or PVC (polyvinyl chloride) powder in different molecular mass ratios (0.1PTFE equals 0.1CF2CF2; 0.1PVC equals 0.1CH2CHCl). It is noted that, as a control, the reaction was also performed using the non-F(Cl)-containing polymer polyethylene (PE, 0.1PE equals 0.1CH2CH2) to confirm the effect of F or Cl in the synthesis. Each mixture was transferred to an alumina boat and placed into a tube furnace for heat treatment under N2. Dry N2 gas was passed through the tube for 30 min before heating at 80 °C h−1 to 400–450 °C for 12 h with N2 still flowing. The powders were reground and reheated at 80 °C h−1 to 400 °C for 12 h in air in a dry room with a dewpoint between −45 to −65 °C (Munters Ltd.) to try to remove any carbon byproduct. A dry room was used to prevent H/Li exchange, which is known to be an issue for garnet-based systems.
Surface fluorination of Li6.4Al0.2La3Zr2O12
Li6.4Al0.2La3Zr2O12 was prepared at 1000–1050 °C using the same method as for Li7La3Zr2O12 with the addition of Al2O3 (99%, Alfa Aesar). The Li6.4Al0.2La3Zr2O12 powder was then pressed into a pellet (10 mm diameter) using 0.2 tons pressure, and heated at 1100 °C for 12 hours in a dry room, with parent powders on each side of the pellet. The pellet was polished using 400, 800, 1200, 2500, 4000 grinding papers, covered with PTFE powder on each side, and heated to 400 °C for 12 hours in the dry room to facilitate the surface fluorination process.Characterisation of materials
![[thin space (1/6-em)]](https://www.rsc.org/images/entities/char_2009.gif) :50 v/v) to −76.54 ppm. The 35Cl MAS NMR spectra were referenced to 0.1 M NaCl (aq).
:50 v/v) to −76.54 ppm. The 35Cl MAS NMR spectra were referenced to 0.1 M NaCl (aq).
Conventional 6Li and 7Li MAS NMR spectra were obtained using a single-pulse experiment with radiofrequency (rf) field strengths of 47.6–56 and 52.6–83 kHz, respectively. In order to suppress a large background signal, 19F MAS NMR spectra were acquired using the “depth” pulse sequence. 35Cl MAS NMR spectra were acquired using a Hahn-echo experiment utilising a rf field strength of 31.2 kHz. Specific experimental details are given in the corresponding figure captions.
All LLZO systems were energy minimized in the tetragonal 192 atom unit cell (ICSD collection code 191528) using a converged 2 × 2 × 2 k-point grid. The simulation cells used for the bulk oxides comprised the anti-fluorite structure for Li2O and the Baddeleyite structure for ZrO2. Both the α-M2O3 and Bixbyite-M2O3 structures were calculated for lanthanum oxide and the lower energy polymorph used for further calculations (the more stable structure was found to be α-La2O3). The lithium halides all used the rocksalt structure. The Monkhorst–Pack k-point grid for all the pure oxide and halides materials was found to be converged at 4 × 4 × 4 grid points.
Defect calculations were first performed by inserting a single dopant halogen into the LLZO lattice without a compensating Li vacancy whose position is unknown or may be dynamic. Instead, the number of electrons was adjusted to maintain charge neutrality of the system. This setup is broadly equivalent to including an infinitely far away Li vacancy and allows comparison of halogen dopants on the different oxygen sites without the complication of a secondary local defect. Substitution on the cation sites has been ruled out by a previous study.52 In the next stage Li vacancies are introduced as either a nearest neighbour or furthest neighbour to probe the tendency of the halogen and Li vacancy to cluster.
Results and discussion
Initial characterisation
A phase pure sample of tetragonal Li7La3Zr2O12 (I41/acd) was successfully prepared via conventional solid-state methods (Fig. 1), confirmed by Rietveld refinement using the PXRD data (Fig. S1†). However, attempts to produce F-doped samples, e.g., Li6.5La3Zr2O11.5F0.5, using similar high temperature methods led to a number of phases, including the desired tetragonal garnet phase, in addition to La2O3 and La2Zr2O7 impurities, as shown in Fig. 1(a). Hence, there is no evidence of O replacement by F using LiF as a starting reagent via the standard high temperature synthesis route.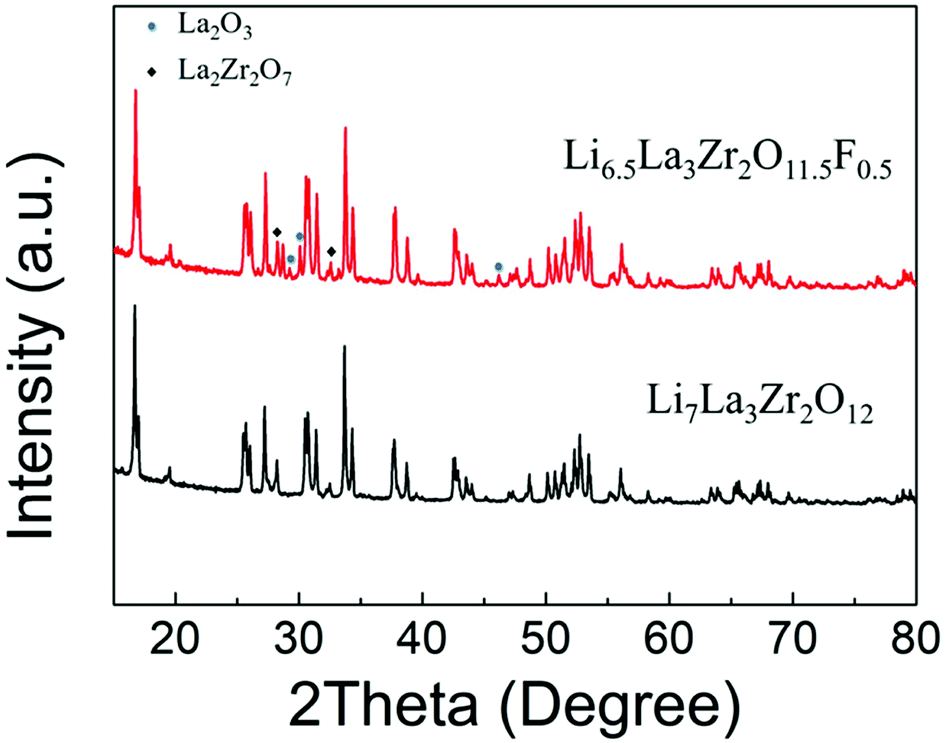 | ||
| Fig. 1 XRD patterns obtained for Li7−xLa3Zr2O12−xFx: x = 0 and 0.5 showing significant impurities for x = 0.5 and no change in the level of tetragonal distortion; LiF was used as the fluorine source. | ||
In contrast, when the ‘as prepared’ tetragonal Li7La3Zr2O12 was mixed with PTFE and heated under dry N2, a reduction in tetragonal distortion was observed as a function of PTFE content. Meanwhile, the parent Li7La3Zr2O12 sample (without addition of PTFE) showed no change upon heating under the same conditions (Fig. 2(a)). This suggests that the addition of PTFE was successful in causing a reduction in the tetragonal distortion, which is consistent with the incorporation of Li vacancies. This could be achieved either through the creation of O vacancies, Li7−2xLa3Zr2O12−x, or via the incorporation of F− in the place of O2−, Li7−xLa3Zr2O12−xFx.
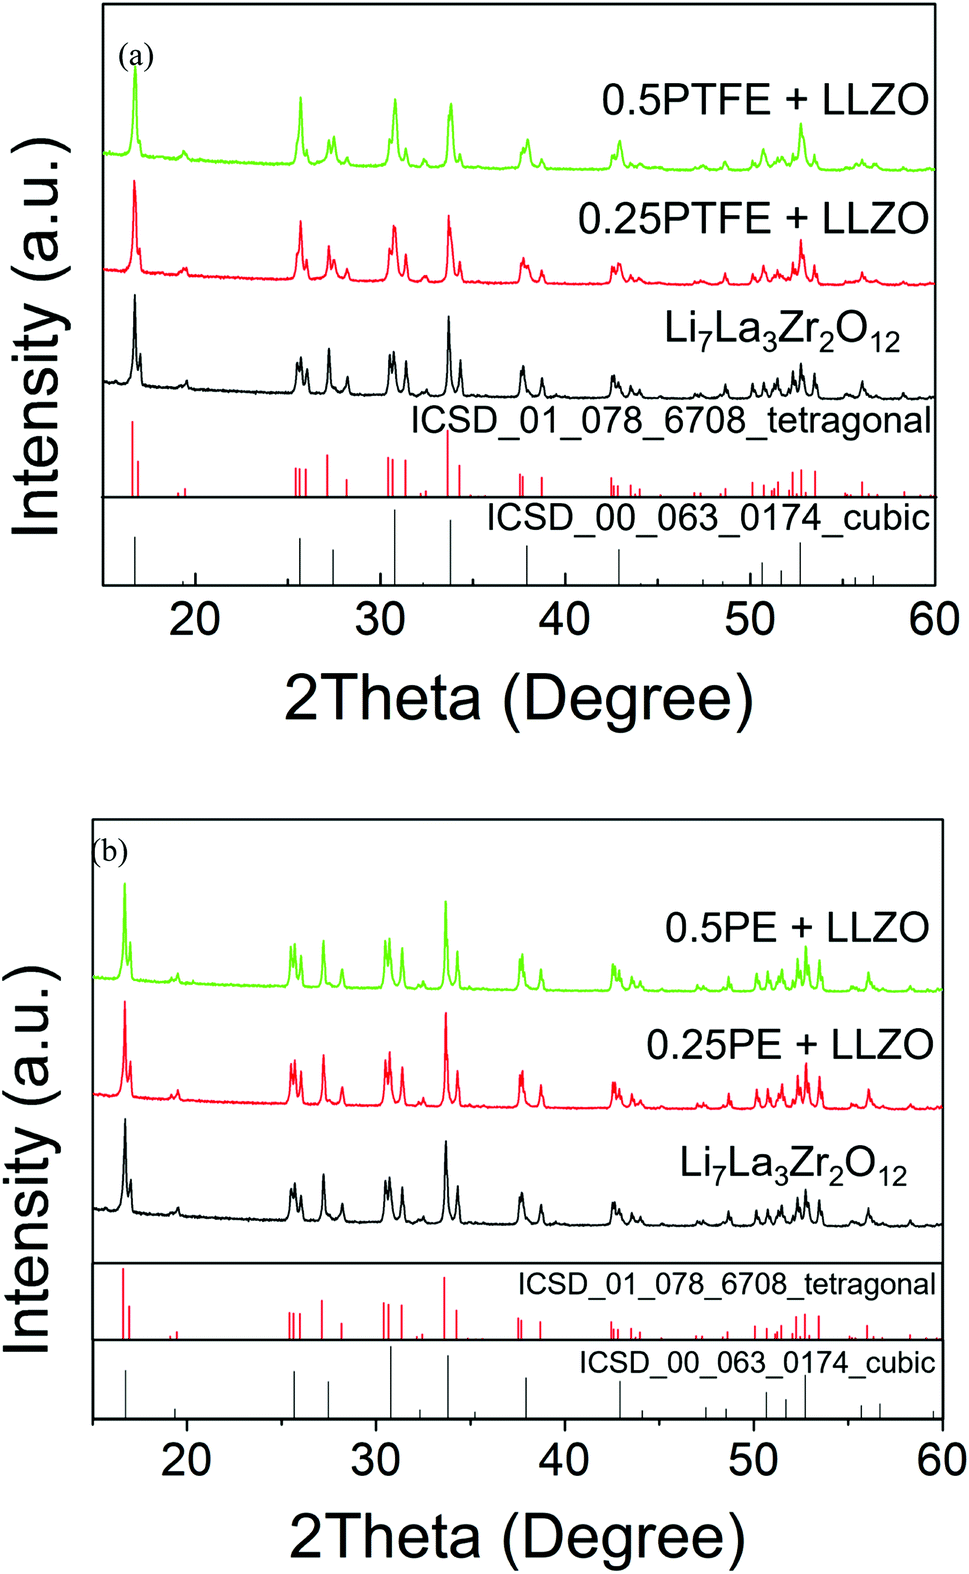 | ||
| Fig. 2 XRD patterns obtained for samples of Li7La3Zr2O12 mixed with (a) PTFE and (b) PE at 400 °C in dry N2, indicating a reduction in tetragonal distortion for the reaction with PTFE and no change upon reaction with PE. | ||
To determine if the observed phase transition is caused by the creation of oxide ion vacancies or F incorporation, a non-fluorine containing polymer, polyethylene (PE), was also investigated. The XRD patterns obtained for a sample prepared with PE are shown in Fig. 2(b), and the data clearly indicate unchanged tetragonal Li7La3Zr2O12 (Rietveld refinement of 1PE–LLZO is shown in Fig. S2†). This suggests that the changes observed are caused by the F in the PTFE polymer. Hence, this supports the hypothesis that F is incorporated into the garnet structure and its presence is required to deliver the observed reduction in tetragonal distortion.
0.2PTFE:LLZO was selected for further investigation, as the lithium content (∼6.6) is usually considered optimal for Li conductivity in garnet systems. 0.2PTFE:LLZO was reground and reheated several times at 400–425 °C in both dry N2 and air until no further change was detected by XRD. EDX mapping (Fig. 3(a)) indicated a homogeneous distribution of La, Zr, F and O throughout the 0.2PTFE:LLZO sample. The stability of the 0.2PTFE:LLZO sample was subsequently studied via variable-temperature XRD and is shown in Fig. 3(b). The XRD patterns obtained indicate that, above 500 °C, the cubic LLZOF phase undergoes partial decomposition. This begins with the formation of LaOF, followed by LaZrF7 and ZrO2 at higher temperature. This supports the inability to form the fluorinated phase via traditional high temperature solid state synthetic methods and corresponding studies of other mixed metal oxide fluorides (e.g., perovskites and other related materials). This, therefore, suggests the F-containing garnet phase is metastable, thus requiring lower temperature routes for preparation.56,64 This is also in agreement with the PXRD data collected for the sample synthesised using LiF as a starting reagent, where the fluorinated garnet phase could not be prepared via traditional high temperature solid state synthetic methods. Consequently, it was not possible to determine the conductivity of the fluorinated sample, as such an experiment would require high temperature sintering in order to obtain a dense pellet.
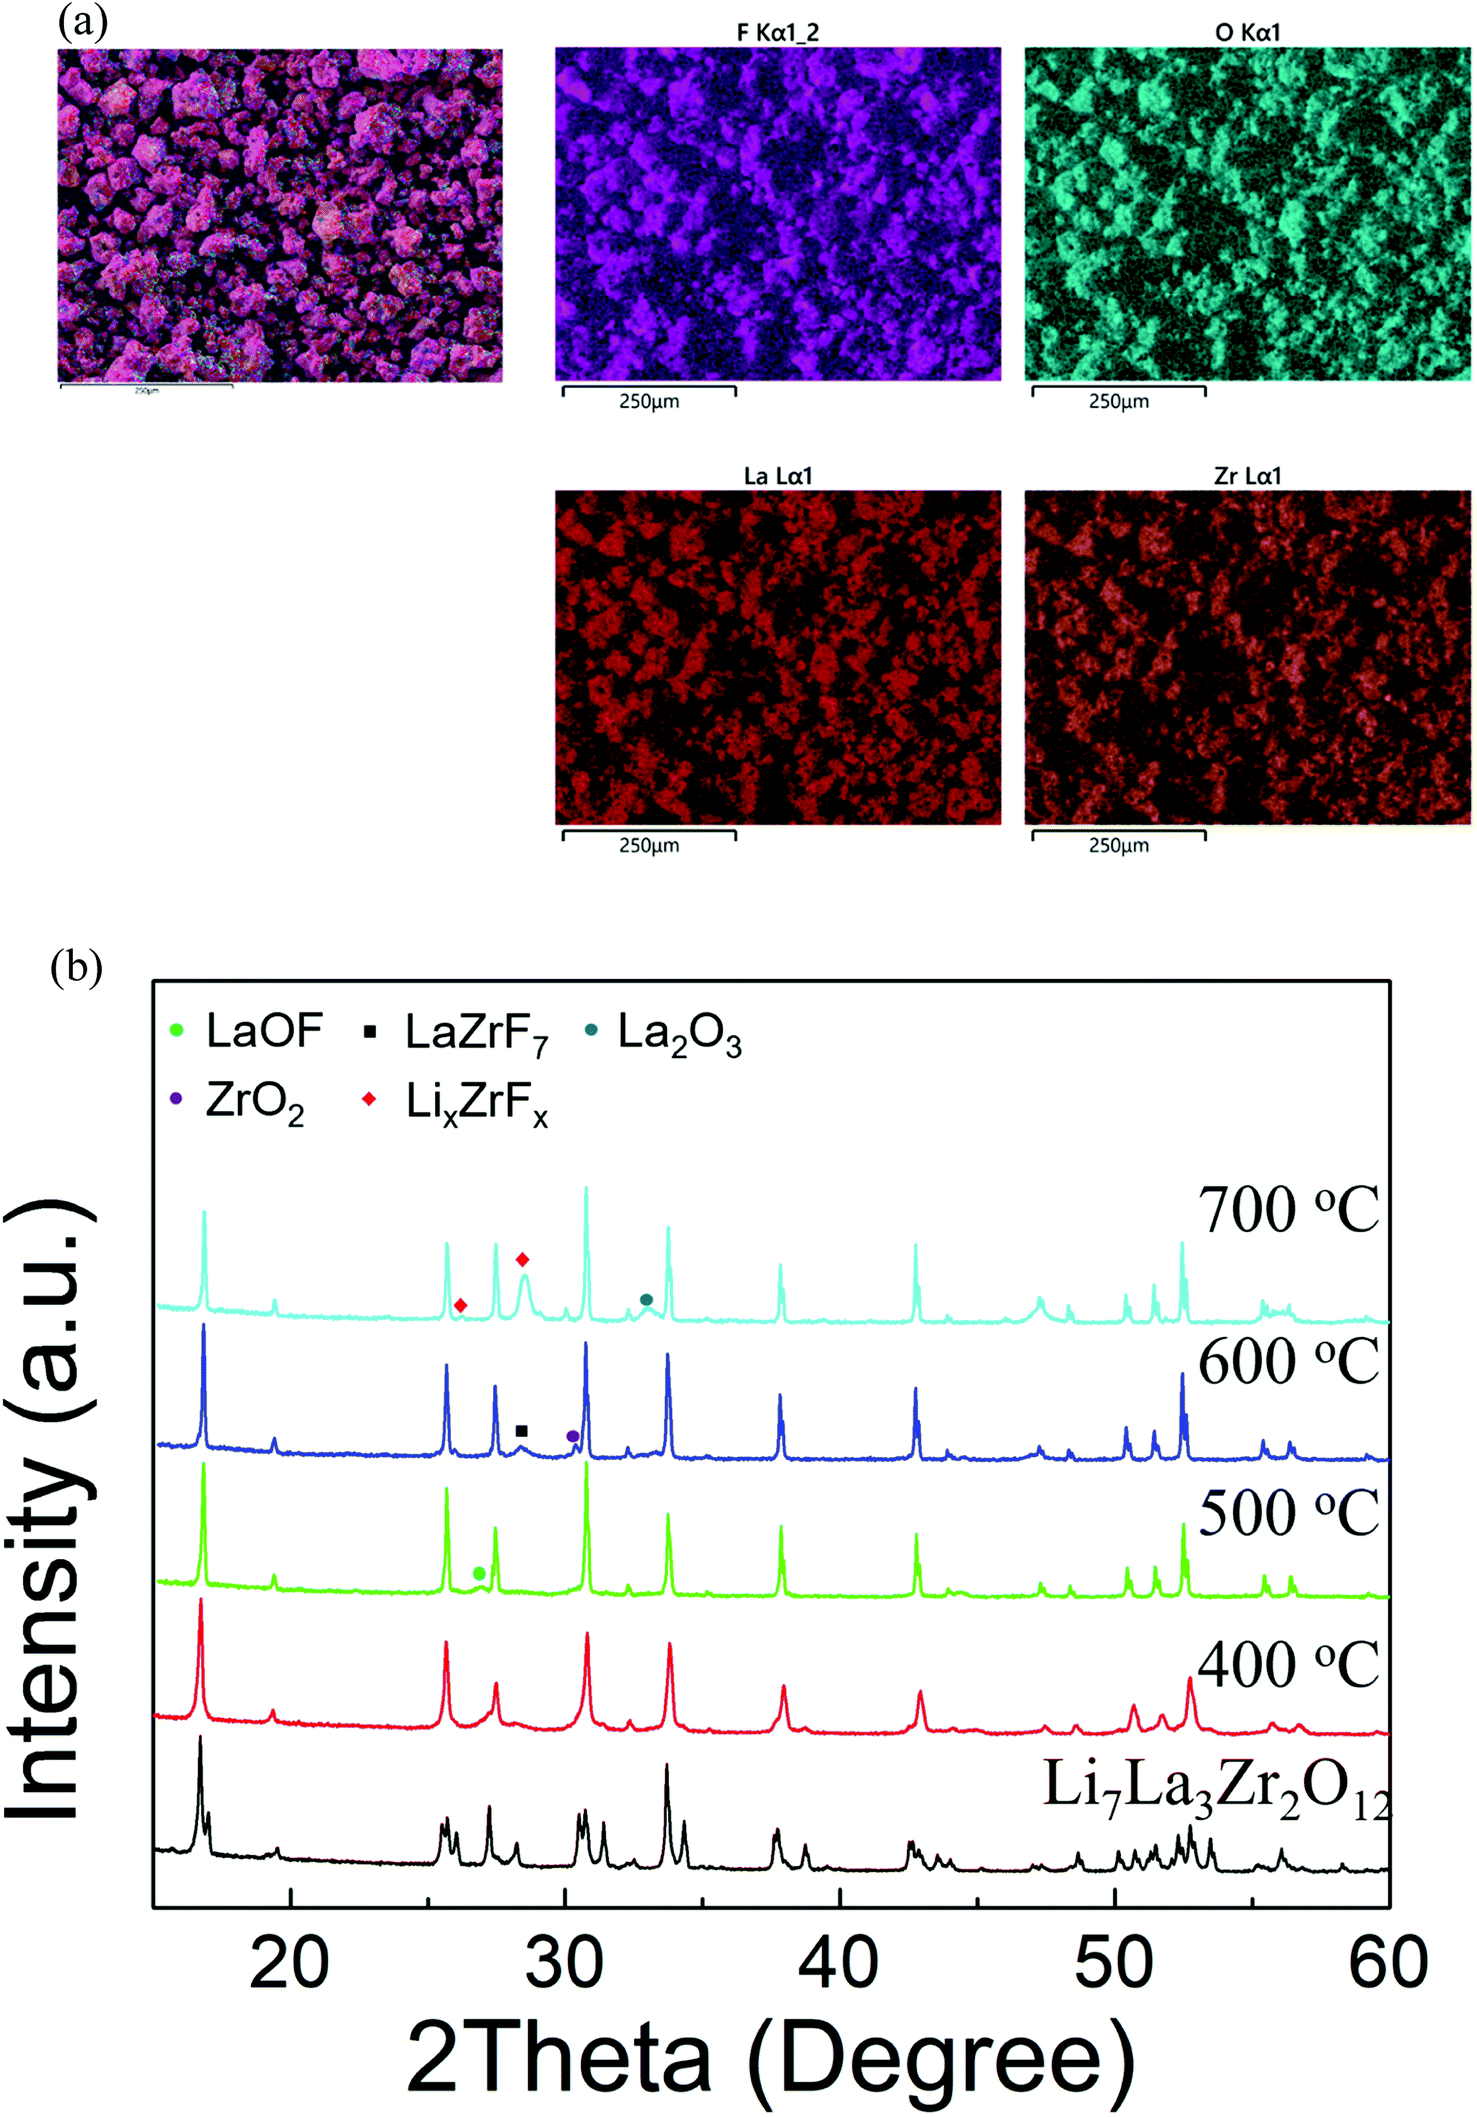 | ||
| Fig. 3 (a) EDX elemental mapping images and (b) variable-temperature XRD patterns obtained for 0.2PTFE–LLZO. In (b) the formation of impurities is observed at T > 500 °C. | ||
A similar issue was observed when LiCl was used as the Cl source for the synthesis of Cl-doped LLZO via traditional solid state synthetic methods (Fig. S3†). However, LLZOCl could successfully be synthesised via the polymer route. As shown in Fig. 4, a change from the tetragonal to cubic form was observed as the PVC content was increased. The observed and calculated patterns from refinement of 1PVC:LLZO are shown in Fig. S4,† and is in good agreement with the formation of the Iad cubic phase. The volume of 1PVC:LLZO increased from 2181.2 to 2206.7 Å3, further supporting the successful incorporation of Cl in the LLZO structure, given the larger size of Cl−, when compared to O2−. Similar to the fluorinated samples, it was not possible to determine the conductivity as the high temperature instability means that pellet sintering is not possible without phase decomposition.
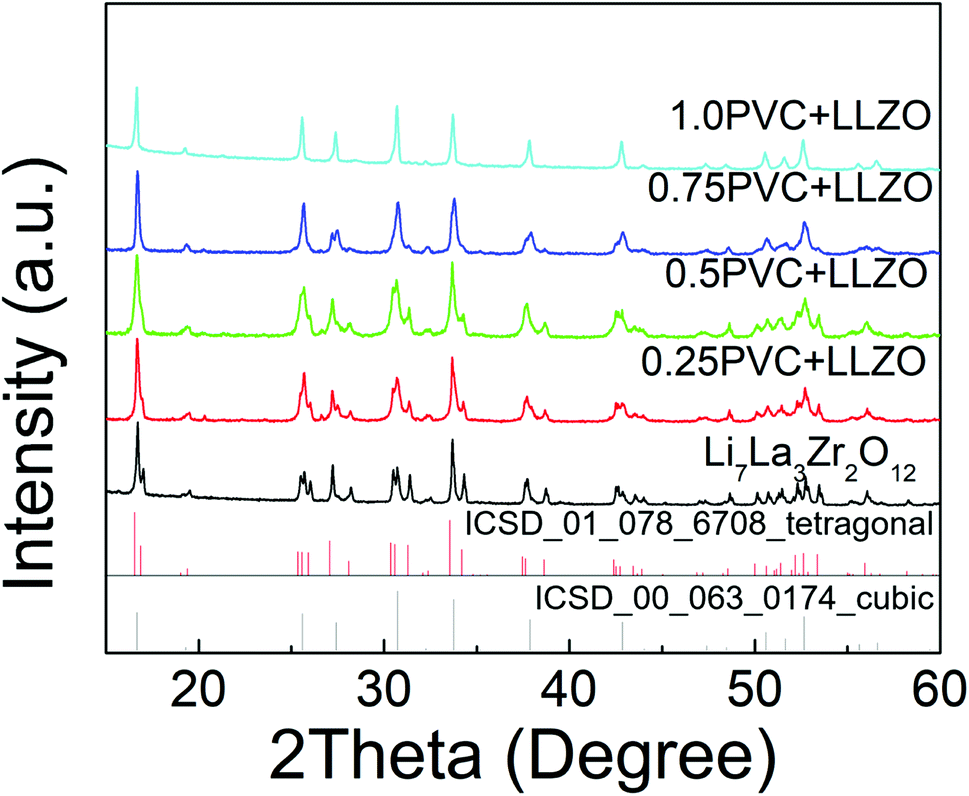 | ||
| Fig. 4 XRD patterns obtained for samples of Li7La3Zr2O12 mixed with PVC showing formation of a cubic cell for higher Cl levels. | ||
Computational modelling
In our previous work,52 potential-based simulations suggested that fluoride anions are stable on the oxygen sites within LLZO with a compensating lithium-ion vacancy defect, which is consistent with the experimental results discussed above. Here, we further examine the position of the halide dopant and associated lithium vacancies in the LLZO framework. For each halide (F, Cl and Br), doping onto each of the three distinct O sites in LLZO were trialed. The energies were first calculated without the complicating presence of a lithium vacancy. The charge imbalance is compensated for instead by adjusting the number of electrons in the system. This is equivalent to presuming the compensating lithium vacancy is infinitely far away and allows us to focus solely on the effect of the halide dopant.Our DFT results show that for all three halogens the O2 site is preferred, followed by the O3 site and then the O1 site (Table 1). Interestingly the relative energies of doping F on different O sites have a comparatively small spread of 0.24 eV, compared to 0.48 eV for Cl and 0.67 eV for Br. In particular, the energy difference for doping F onto the O2 and O3 sites is very small (0.09 eV). This suggests that F is more likely to occupy multiple different O sites when doped into the LLZO structure than either Cl or Br, suggesting an increased disorder. The fully relaxed DFT structures of F-doped LLZO without Li vacancies are shown in Fig. 5.
| F | Cl | Br | |
|---|---|---|---|
| O1 | 0.24 | 0.48 | 0.67 |
| O2 | 0.00 | 0.00 | 0.00 |
| O3 | 0.09 | 0.38 | 0.56 |
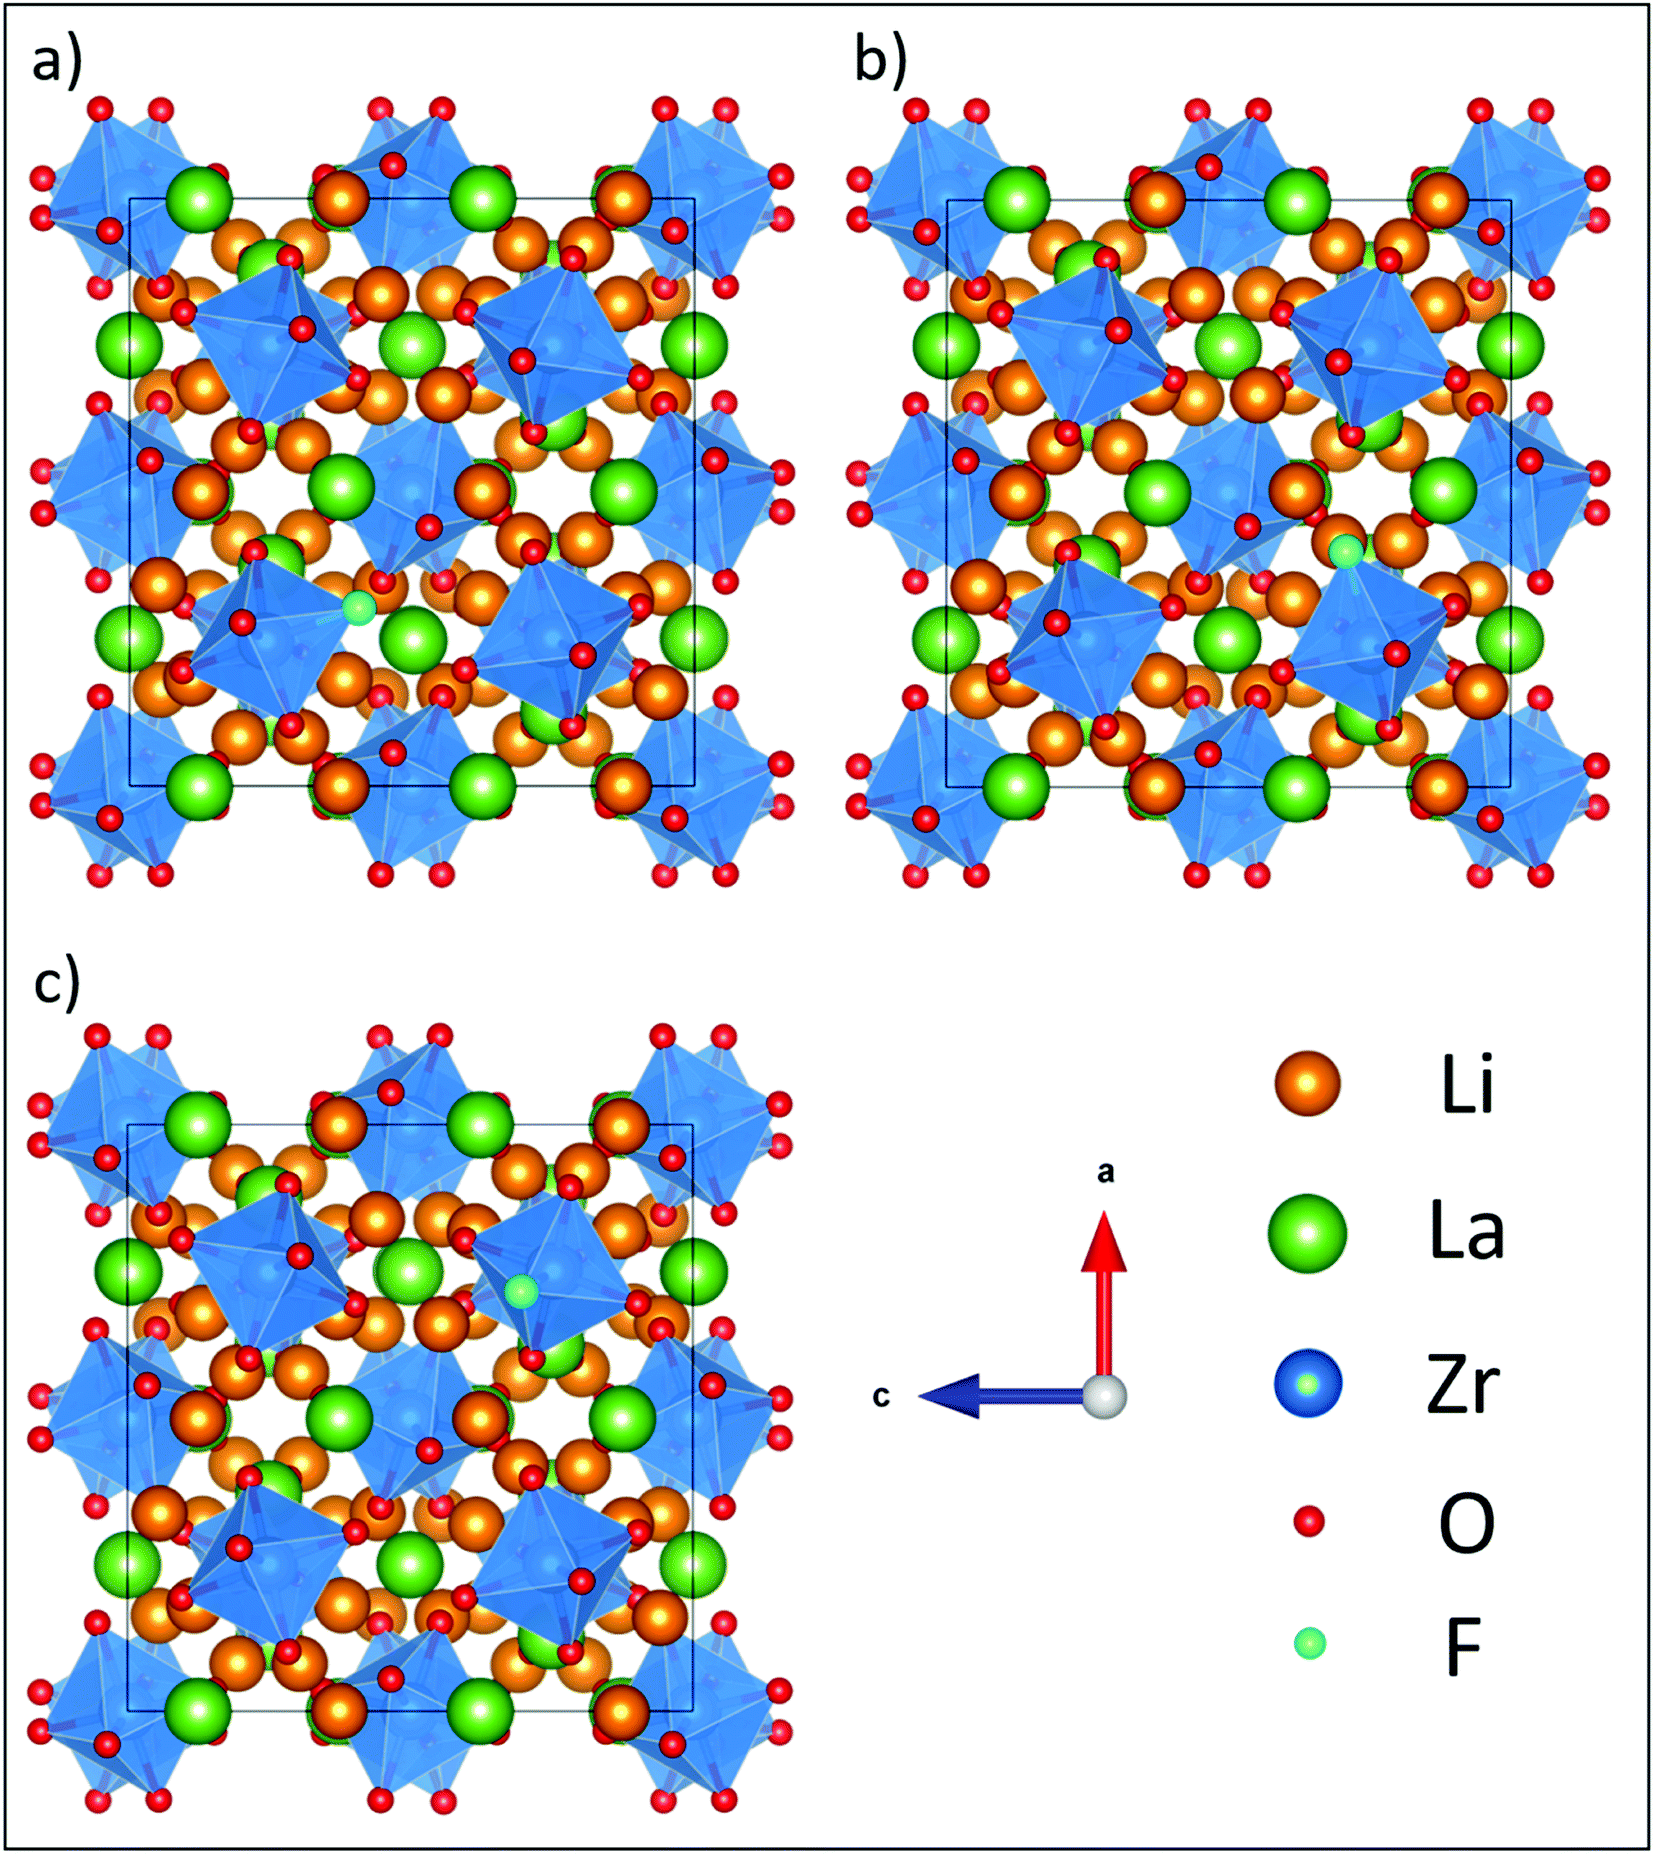 | ||
| Fig. 5 Fully relaxed LLZO structures from DFT with an F defect on the (a) O1, (b) O2 and (c) O3 sites showing minimal disruption to the LLZO lattice. For simplicity, Li vacancies were not included in this set of calculations. | ||
Incorporating the lithium vacancy into the above calculations allows full defect calculations to be performed using the following mechanisms,
| LLZO + LiF → LLZO–F + Li2O | (1) |
| LLZO + LiCl → LLZO–Cl + Li2O | (2) |
| LLZO + LiBr → LLZO–Br + Li2O | (3) |
Here, LiF, LiCl and LiBr are used to introduce the halides into the LLZO structure with the halogen on the oxygen site and a compensating Li vacancy. The compensating Li vacancies were introduced as either nearest or furthest neighbours to examine the tendency of the halogen and vacancy to cluster. The calculated defect energies are presented in Table 2.
| Li vacancy | Dopant | |||||
|---|---|---|---|---|---|---|
| F | Cl | Br | ||||
| Nearest neighbor | Furthest neighbor | Nearest neighbor | Furthest neighbor | Nearest neighbor | Furthest neighbor | |
| O1 | 1.30 | 1.42 | 2.16 | 2.56 | 2.85 | 3.42 |
| O2 | 1.11 | 1.22 | 1.78 | 2.07 | 2.25 | 2.72 |
| O3 | 1.08 | 1.30 | 1.72 | 2.48 | 2.34 | 3.33 |
Based on our findings, chlorine doping is ∼0.6 eV less favorable than F doping, while Br doping is ∼1.2 eV less favorable than F doping for any of the oxygen sites. Despite being less favourable, which can be attributed to the size of the halogen relative to the O site, the trends previously observed with only halogen doping still hold, with the O2 and O3 sites being the most favored sites for substitution. With F doping, the Li vacancy prefers to be located nearest to the F doped O site by 0.1–0.2 eV, irrespective of whether it is the O1, O2 or O3 site, suggesting a high degree of Li vacancy disorder which may favour transition of F-doped LLZO to the cubic phase (as observed in the PXRD data, vide supra). Fig. 6 shows the fully relaxed structure of LLZO with F doped on the most stable O3 site both with and without the nearest neighbour Li present.
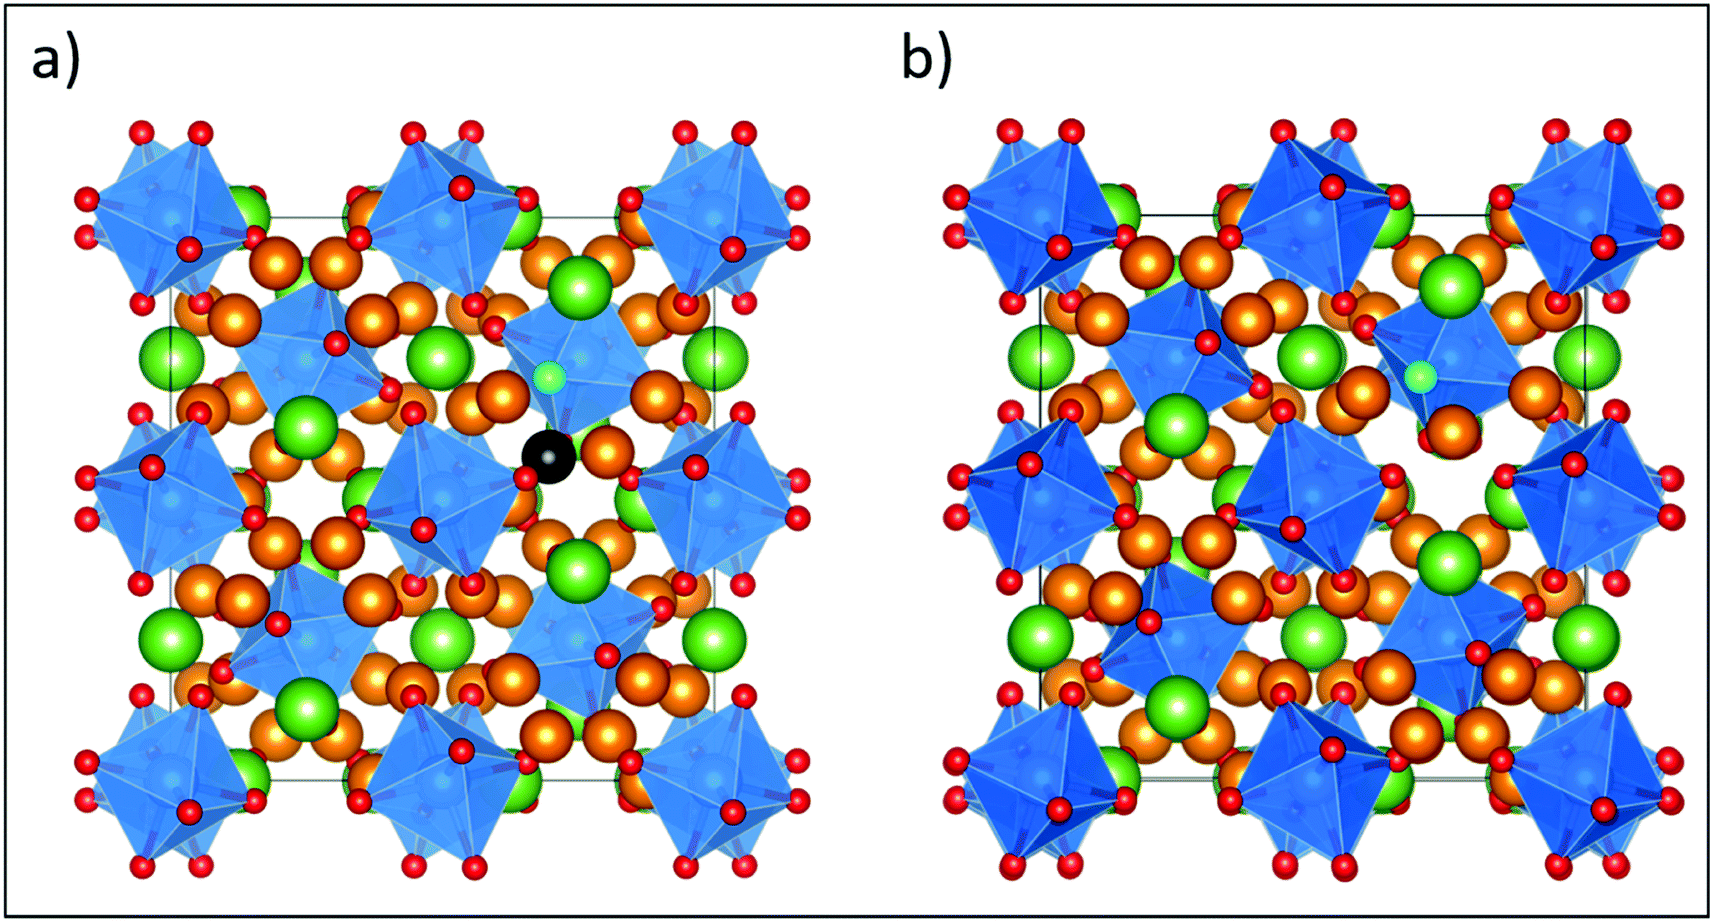 | ||
| Fig. 6 Fully relaxed structures from DFT of the most stable F-doped LLZO configurations, where F is located on the O3 site with the nearest neighbour Li (highlighted in black) either (a) present or (b) removed, showing relaxation of a remaining Li away from its original lattice site towards the vacancy. The defect formation energy for this configuration is 1.08 eV (Table 2). Element colouring and cell orientation are the same as in Fig. 11. | ||
For chlorine, the difference between the Li vacancy being a nearest and furthest neighbour from the dopant is more site dependent, with the O2 site showing the lowest difference in energies with the ‘furthest neighbour’ being ∼0.3 eV higher in energy than ‘nearest neighbour’. This difference increases to 0.8 eV for chlorine on the O3 site. For bromine, the Li vacancy binding to the dopant is even higher, with 0.5 eV for the O2 site and up to 1 eV for the O3 site, suggesting that both Cl and Br will trap Li vacancies even at higher temperatures. The preference to replace halogen with O2 sites (rather than O1 and O3) and/or the site dependence of lithium vacancies may be a further driving force for the experimentally observed decomposition of these phases at elevated temperatures.
Solid-state NMR studies
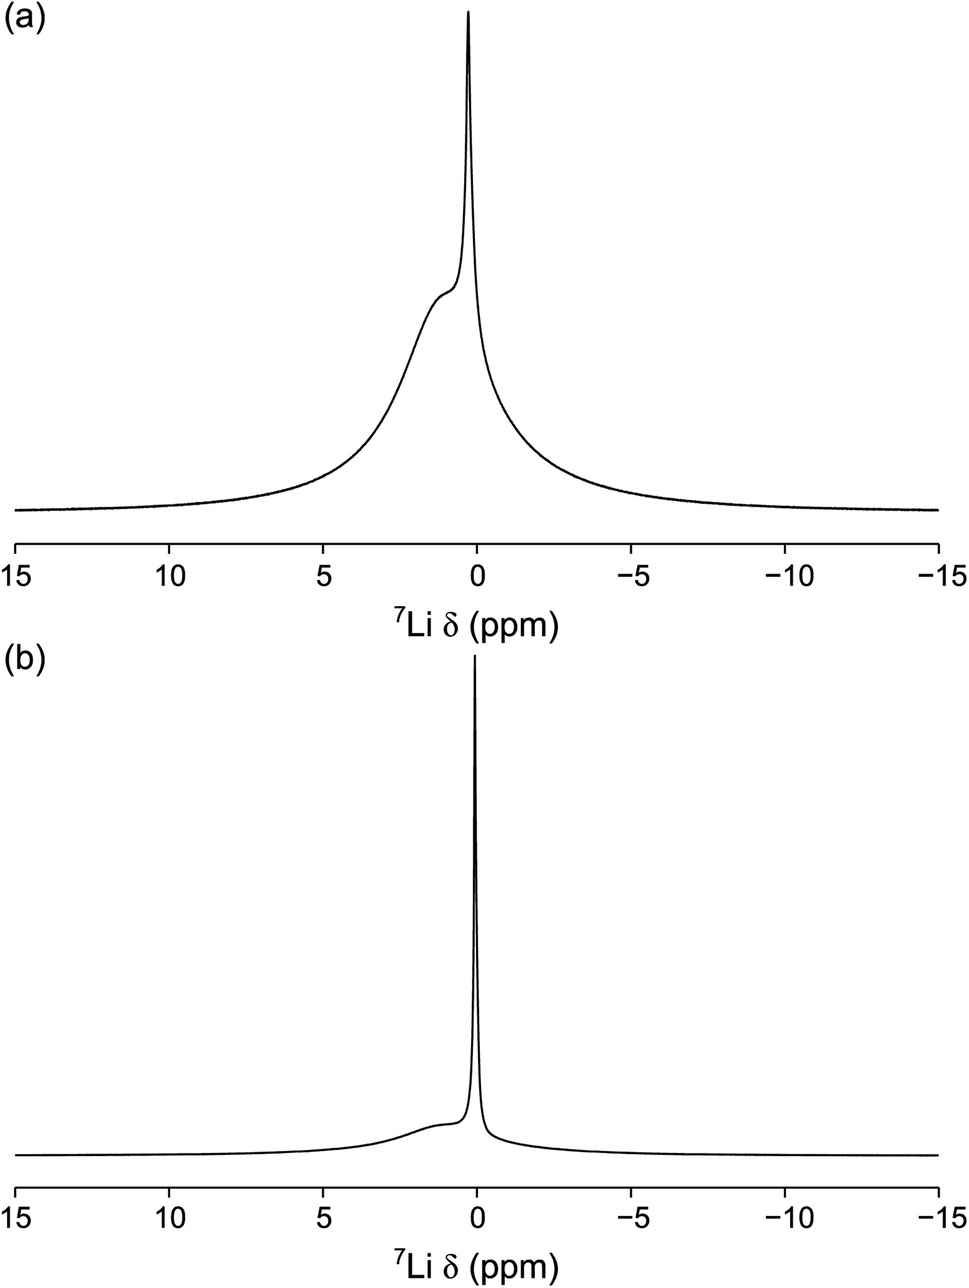
d), where multiple lithium sites are observed.13 The lack of resolved Li sites suggests that the local environments of the Li sites are very similar. This is quite typical of 6,7Li NMR studies, owing to the very narrow chemical shift range. The presence of a single broad resonance could also suggest the presence of disorder within the system. Both isotopes of lithium can be studied using NMR spectroscopy. Typically, 7Li is preferred due to its high natural abundance (92.5%). However, its larger quadrupole moment (−4.01 fm2) can give rise to broad resonances, in particular for Li sites in low symmetry environments. Hence, 6Li is often used to try and resolve overlapped resonances, as its lower quadrupole moment (−0.08 fm2) results in narrower lineshapes.65 The 6Li MAS NMR spectra obtained for LLZOF and LZZO are shown in Fig. 7(b). Again, a single broad resonance is observed in both cases, further highlighting that the Li sites cannot be resolved. This is consistent with previous solid-state NMR studies of related Li-rich garnets, where sites have been shown to be overlapped, and so the data provide limited information about local structural changes caused by F incorporation.66–68
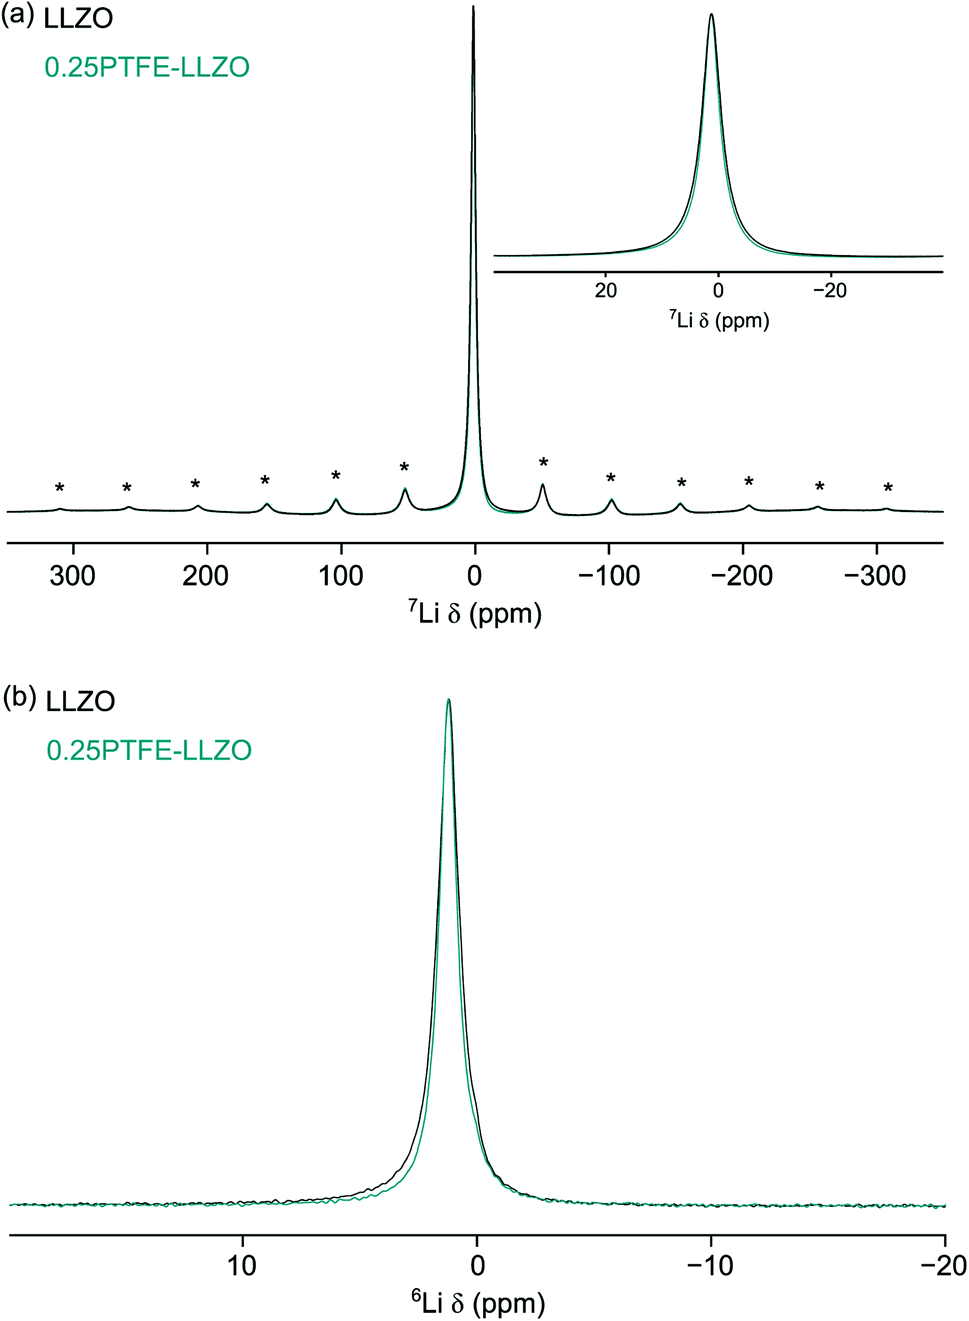 | ||
| Fig. 7 (a) 7Li and (b) 6Li MAS NMR spectra obtained for LLZOF and LLZO. Spectra are the result of (a) 16, 32 and (b) 200 transients with a recycle interval of 90 s. A MAS rate of 10 kHz was used and spinning sidebands are denoted by *. In (a) an expansion of the central transition is also shown. | ||
Consequently, the NMR studies were extended to include 19F MAS NMR studies. DFT calculations (vide supra) suggest that the F anions are likely to disorder across the three O sites. In particular, doping onto O2 and O3 are only 0.09 eV different in energy. The 19F MAS NMR spectrum of LLZOF is shown in Fig. 8(a). Here, a single resonance is observed at δiso = −123 ppm with a manifold of spinning sidebands. As the sample was prepared using PTFE, it was important to determine the contribution of the PTFE to the 19F MAS NMR spectrum relative to the F-doped LLZO. The 19F MAS NMR spectrum of PTFE is shown in Fig. 8(b), where it is compared to the spectrum obtained for LLZOF. When compared, it is evident there is a considerable amount of PTFE still present within the sample. This suggests that the air heat treatment wasn't sufficient to burn off any remaining PTFE, and so it indicates that either a higher temperature or longer times are needed. The PXRD data suggests that some of the F is successfully incorporated into the structure, reducing the tetragonal distortion (vide supra), and using solid-state 19F MAS NMR spectroscopy it is possible to confirm the presence of F within the structure. However, it is unfortunately not possible to accurately determine the precise location of the incorporated F, as the spectrum is dominated by the PTFE signal.
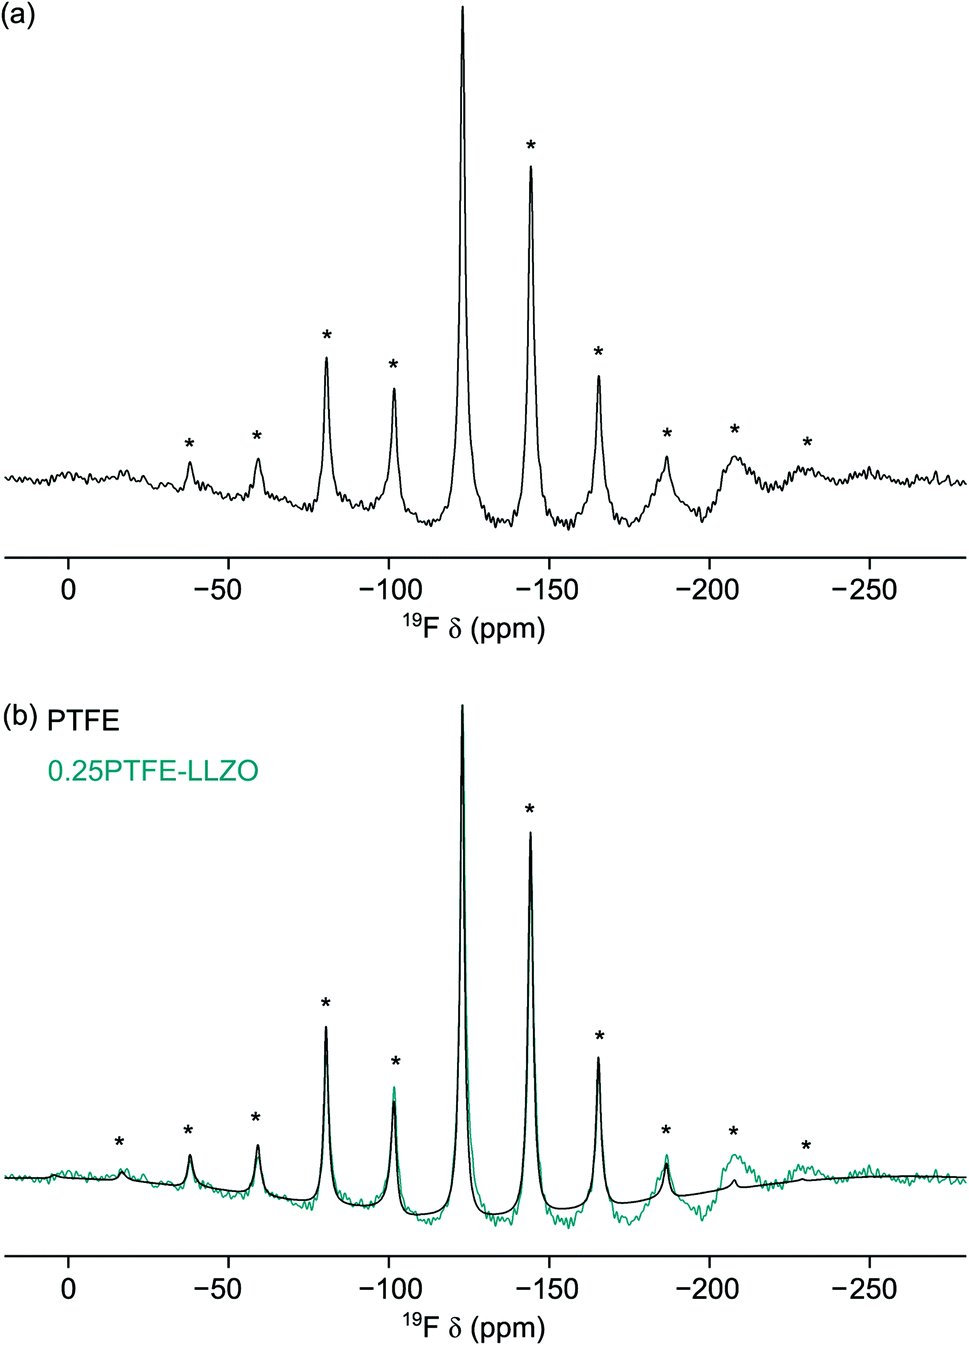 | ||
| Fig. 8 19F MAS NMR spectra obtained for (a) LLZOF and (b) PTFE. In (b), the spectrum for LLZOF is also shown for comparison. Spectra are the result of (a) 320 and (b) 16 transients with a recycle interval of 10 s. A MAS rate of 10 kHz was used and spinning sidebands are denoted by *. | ||
 | ||
| Fig. 9 7Li MAS NMR spectra of (a) 0.75PVC:LLZO and (b) 1.0PVC:LLZO. Each spectrum is the result of averaging 64 transients with a recycle interval of 6 s. A MAS rate of 10 kHz was used. | ||
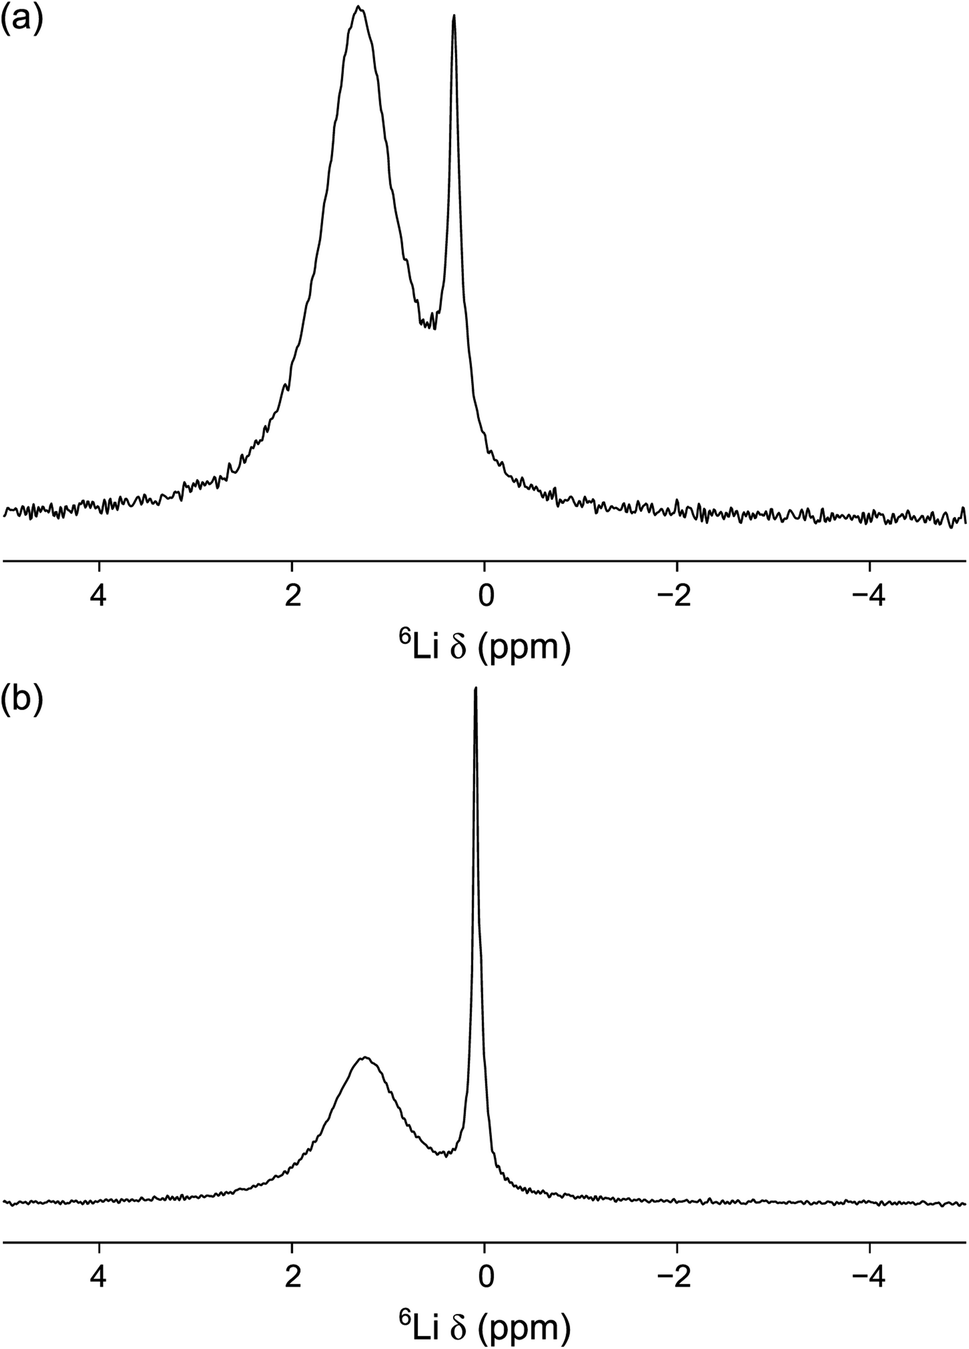 | ||
| Fig. 10 6Li MAS NMR spectra of (a) 0.75PVC:LLZO and (b) 1.0PVC:LLZO. Each spectrum is the result of averaging 200 transients with a recycle interval of 8 s. A MAS rate of 10 kHz was used. | ||
The Cl environment within the Li-rich garnet structure can be studied directly using 35Cl MAS NMR. The 35Cl MAS NMR spectra obtained for 0.75PVC:LLZO and 1.0PVC:LLZO are shown in Fig. 11, where, in each case, a single resonance is observed. As the PVC content is increased, the resonance is shifted from δ = −0.27 to 2.13 ppm and the peak narrows considerably. This indicates that, as more Cl is added to the system, the local Cl environment changes substantially, specifically, the Cl environment is becoming more symmetrical upon increased doping. It is currently unclear why increasing the PVC content effects the Cl local environment in such a dramatic way. Computational studies (vide supra) suggest that clustering of lithium vacancies near the dopant is favourable for Cl anions. This clustering has the potential to significantly influence the local structure of the doped system. However, further complementary studies, which are outside the remit of this study would be required to fully understand this local distortion. Overall, the NMR data provide evidence to support the successful incorporation of Cl, but further work is required to clarify the detailed structural features. For example, as previously suggested, total scattering studies would be useful in clarifying the changes to the local structure on halogen incorporation. Such studies would assist both the assignment and interpretation of the NMR data and DFT findings.
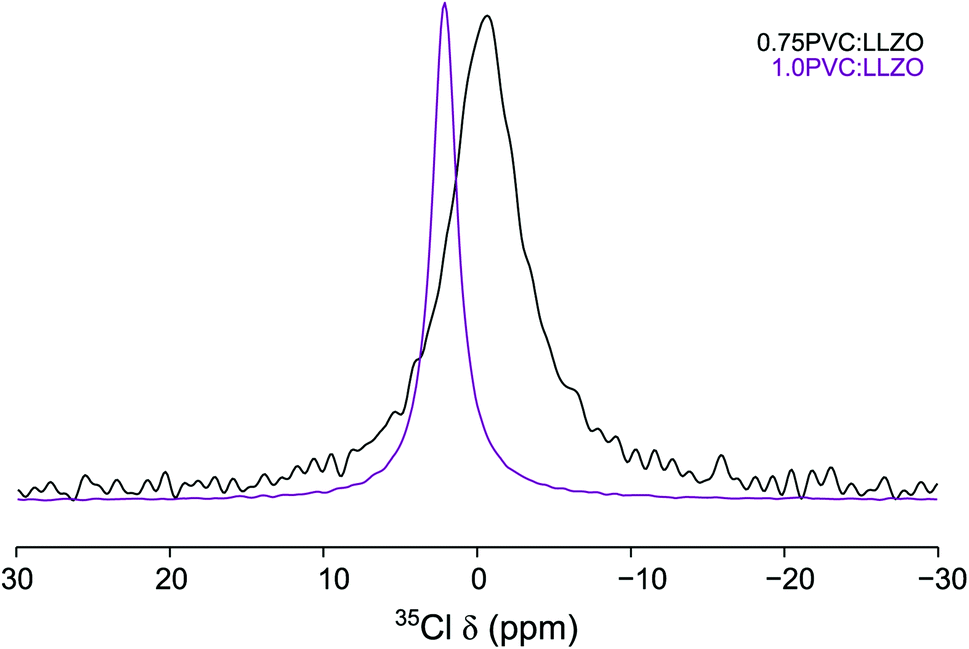 | ||
| Fig. 11 35Cl MAS NMR spectra of 0.75PVC:LLZO and 1.0PVC:LLZO. Each spectrum is the result of averaging 1600 transients with a recycle interval of 0.4 s. A MAS rate of 10 kHz was used. | ||
Effects of halogenation on electrochemical properties
As noted previously, it appears that the halogenation of Li7La3Zr2O12 is only successful at low temperatures, with heating to higher temperatures leading to partial phase decomposition. As a result, it was not possible to evaluate the effects of halogenation on the conductivity, as the thermal instability of halogenated Li7La3Zr2O12 meant that the samples could not be adequately sintered prior to conductivity measurements. Hence, instead, we investigated whether or not halogenation could be performed on a pre-sintered pellet of Al-doped LLZO (Li6.4Al0.2La3Zr2O12) to form a surface layer which could potentially enhance the interfacial interaction with Li metal in an all-solid-state battery. As a result, these coatings could potentially be of interest for the reduction of interfacial resistance or prevention of dendrite growth.The Li/LLAZO/Li cell was initially tested, where short circuiting was observed at a low current density of around 0.1 mA cm−2 (Fig. S6 and S7†), which is a similar critical current density observed for LLAZO in the literature.31 To evaluate the possible benefits of surface fluorination, the Li/LLAZO(PTFE)/Li symmetric cell was cycled with increasing current densities. The voltage of the cell slightly increased with increasing current densities (Fig. 12(a)). The voltage profile exhibits a slightly higher voltage on one side, which may be caused by uneven coating of the pellet. Two semicircles were observed in the EIS data (Fig. 12(b)). The first semicircle represents the total resistance of the garnet ceramic electrolyte (Rt), whilst the second (3171 Ω cm2) is linked with the fluorinated coating and garnet/Li metal interface (Ri). During the cycling with increasing current densities, both Rt and Ri decreased (Fig. 12(c)). A particularly large decrease was observed for Ri, which decreased from 3171 to 751 Ω cm2 at 0.1 mA cm−2 and 98 Ω cm2 at 1 mA cm−2 (Fig. 12(c)). The cell was rested for 12 hours and the EIS data indicates a recovered total resistance of the garnet framework, indicating that the cell did not short circuit. It is noted that a slightly higher resistance is observed for the second semicircle after being rested (Fig. 12(b)), corresponding to the impedance of the F-doped layer.
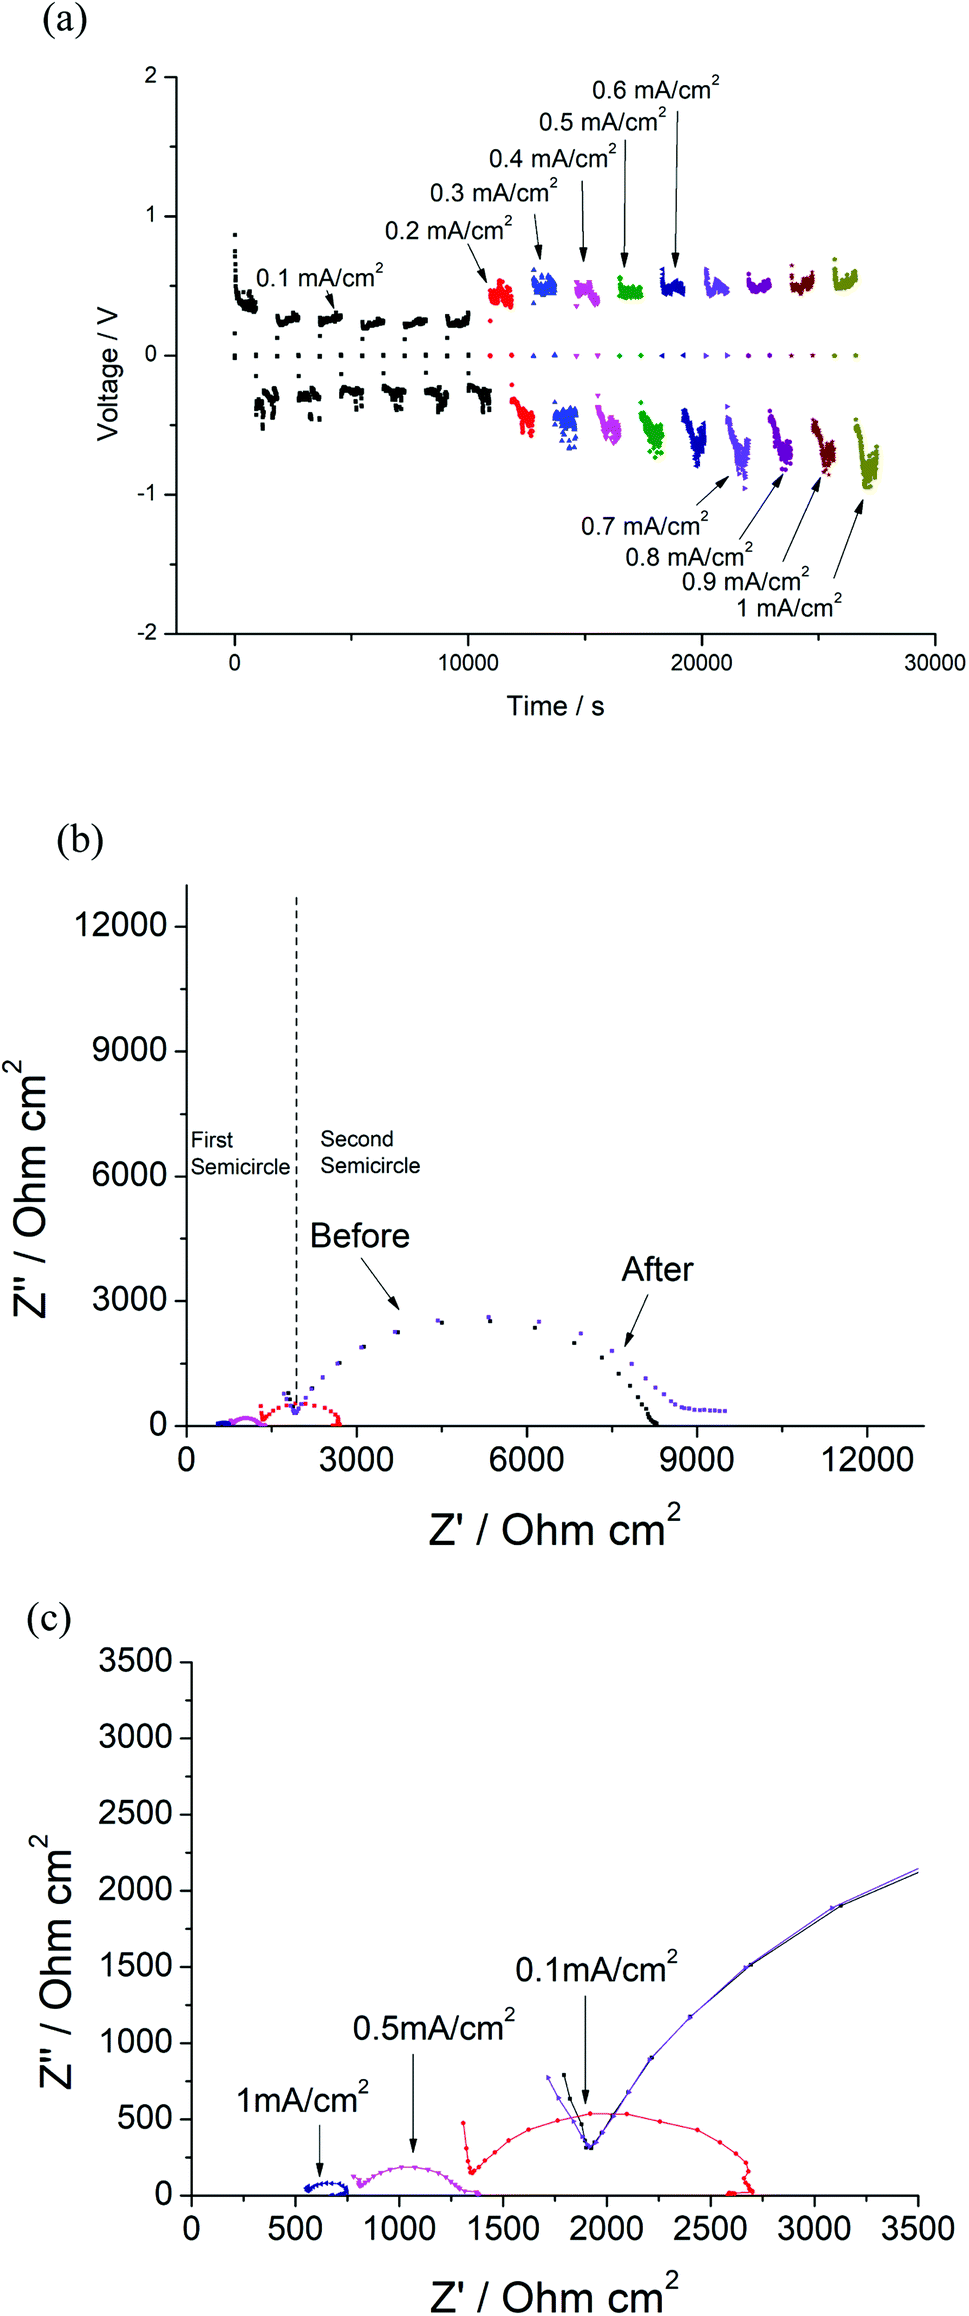 | ||
| Fig. 12 (a) Constant current cycling testing of Li/LLAZO(PTFE)/Li cell from 0.1 mA cm−2 to 1 mA cm−2 (b) EIS of the cell before and after cycling. (c) EIS of the cell after 0.1 mA cm−2, 0.5 mA cm−2 and 1 mA cm−2 cycling. | ||
In order to determine the critical current density of the cell, the current densities were increased from 1 mA cm−2 to 5 mA cm−2. Similar results were observed, where the voltage of the cell remained ∼0.59 V at 1 mA cm−2 and increased with increasing current densities (Fig. 13(a)), and the resistance of the Ri decreased to ∼30 Ω cm2 at 5 mA cm−2. However, the EIS data obtained for the cell rested for 12 hours indicates only a small variation of the total resistance of the garnet after testing (Fig. 13(b)). Typically, an irreversible reduction of R would be expected due to dendrite penetration at higher currents. However, the data presented indicate the prevention of full dendrite penetration even with the applied high current density of 5 mA cm−2 (50 times higher than the value that gives a clear short circuit due to full Li dendrite penetration in the Li/LLAZO/Li cell) (Fig. 13(b)).
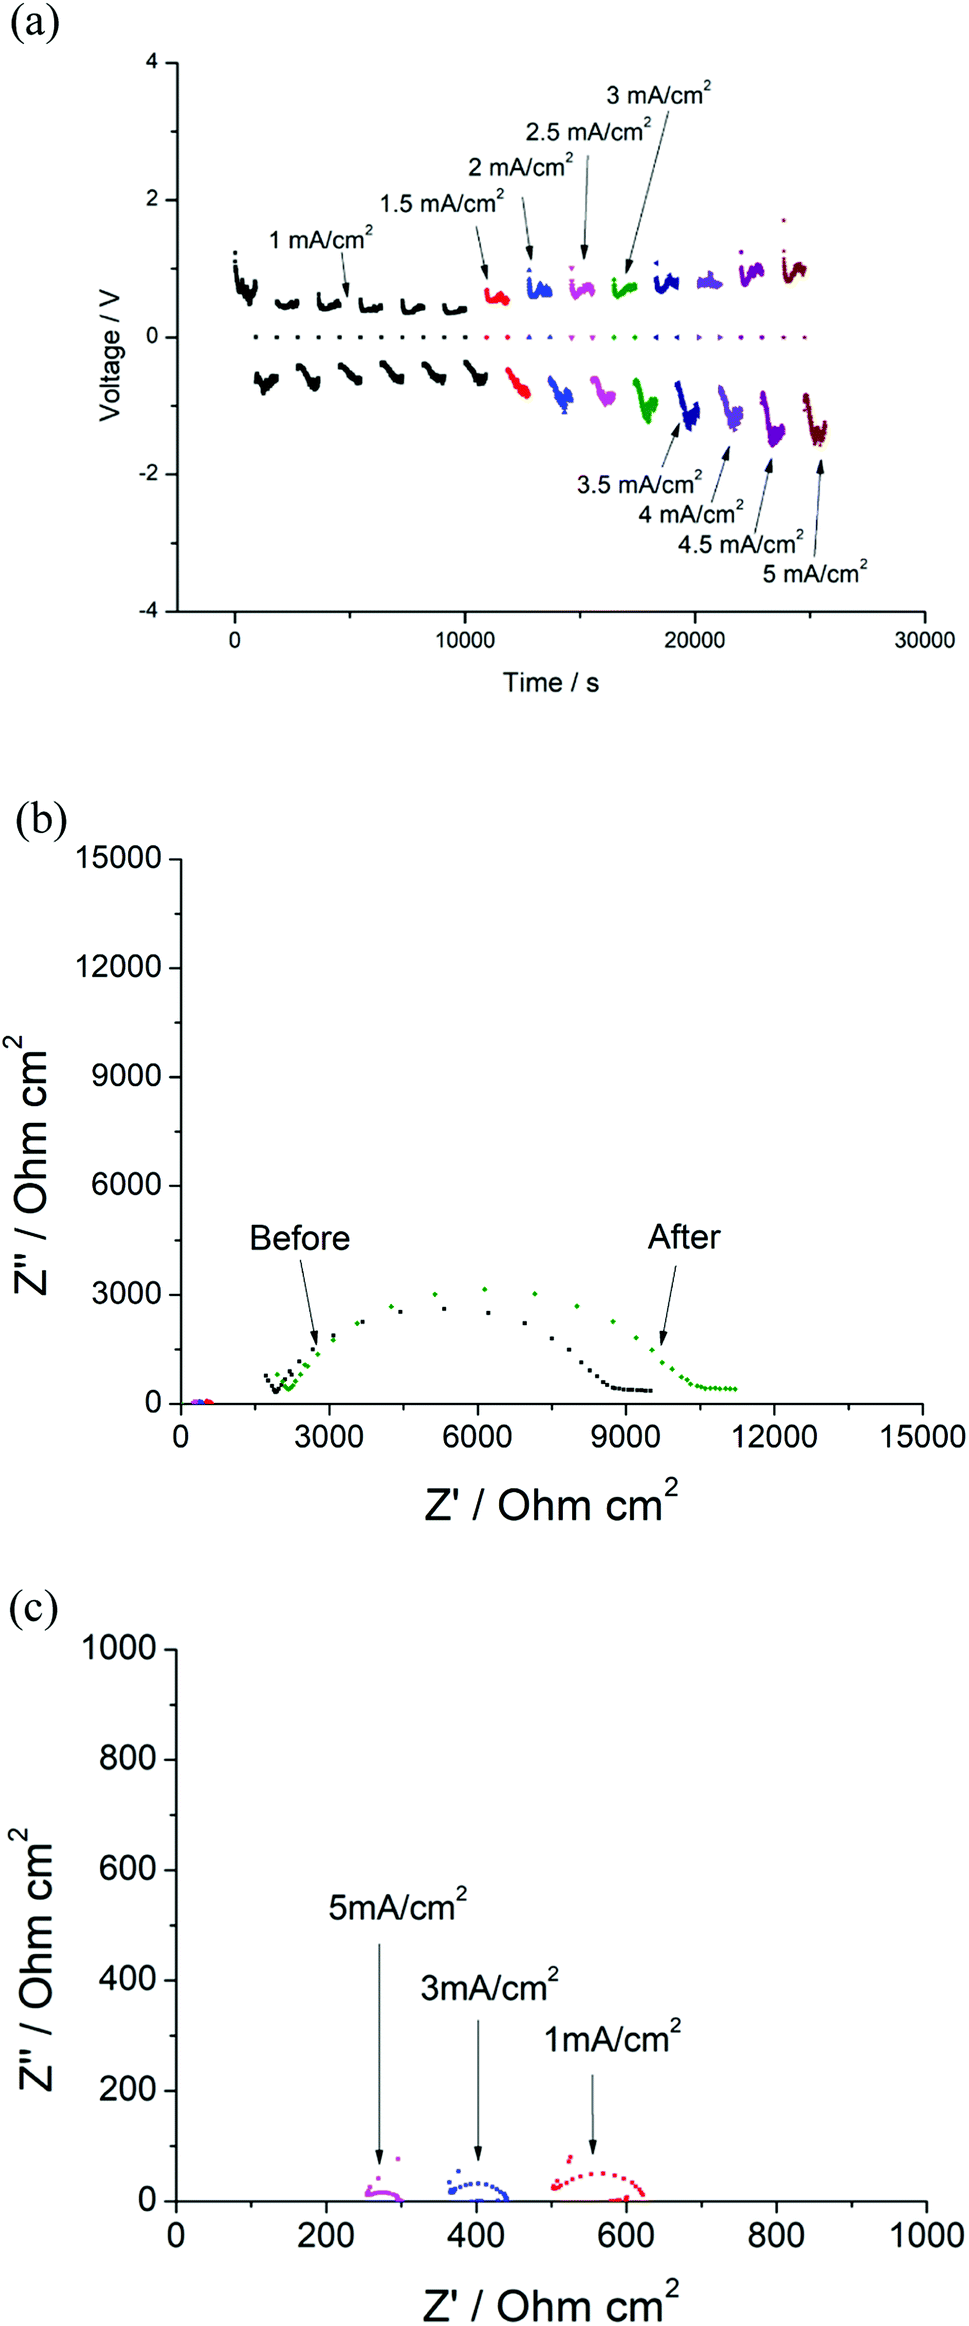 | ||
| Fig. 13 (a) Constant current cycling testing of Li/LLAZO(PTFE)/Li cell from 1 mA cm−2 to 5 mA cm−2 (b) EIS of the cell before and after cycling. (c) EIS of the cell after 1 mA cm−2, 3 mA cm−2 and 5 mA cm−2 cycling. | ||
In order to evaluate the protective nature of these coatings further, higher current densities from 1 mA cm−2 to 10 mA cm−2 were then applied to the cell, and the voltage increased to 5.8 V at 10 mA cm−2 (Fig. 14(a)). In contrast to previous EIS data, Ri (515 Ω cm2) increased at 10 mA cm−2 compared to those at 1 mA cm−2 (148 Ω cm2, Fig. 14(c)). The Ri doubled as before, which may be attributed to some irreversible reaction(s) of the coating layer at higher voltages (XRD data after cycling testing is shown in Fig. S8†), whilst the Rt remains virtually the same after cycling at 10 mA cm−2.
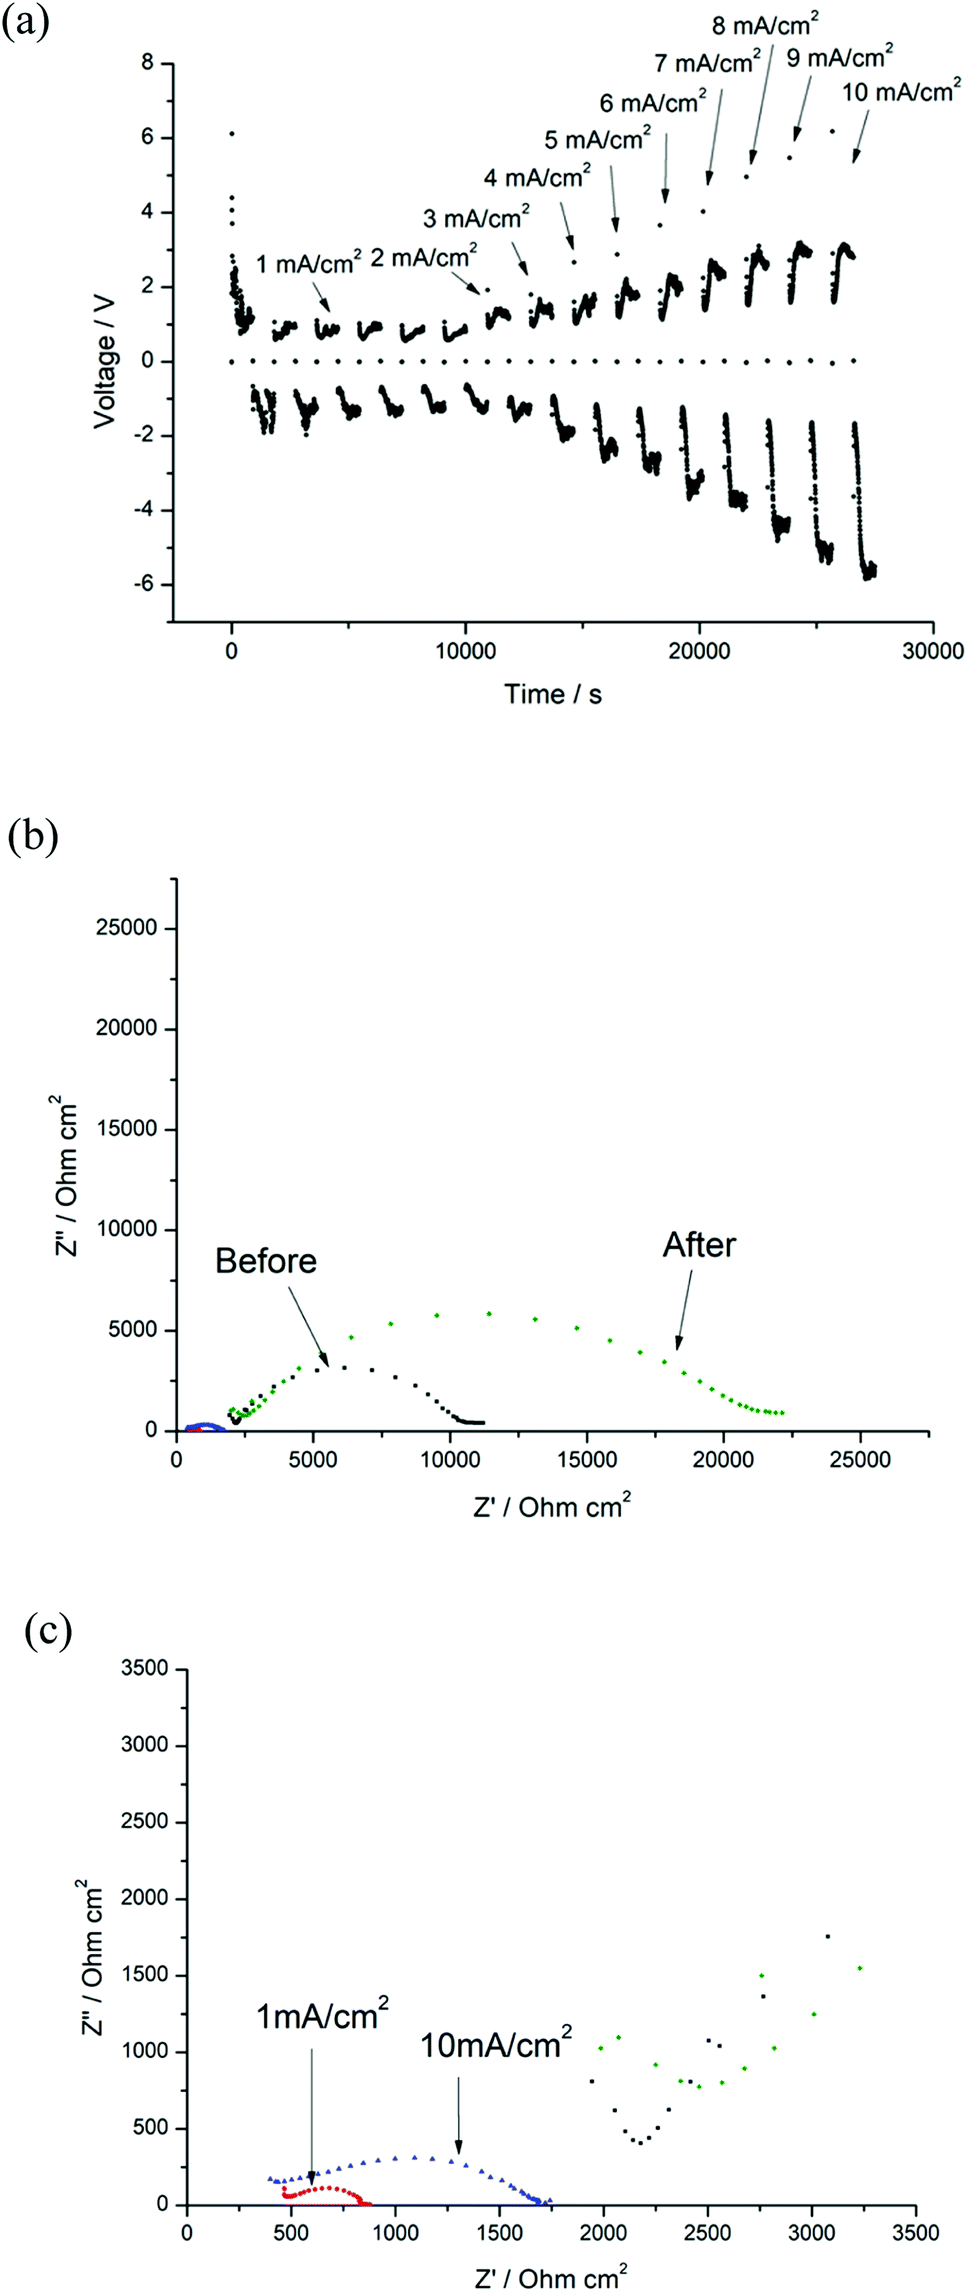 | ||
| Fig. 14 (a) Constant current cycling testing of Li/LLAZO(PTFE)/Li cell from 1 mA cm−2 to 10 mA cm−2 (b) EIS of the cell before and after cycling. (c) EIS of the cell after 1 mA cm−2 and 10 mA cm−2 cycling. | ||
It is reported that local defects, such as void formation at the SSE/Li interface during the stripping process associated with reduction of SSE/Li contact area can result in increased polarisation and local current density, which triggers the dendrite formation and propagation in the solid state electrolyte.69 In this work, EDX shows additional distribution of F over the LLAZO pellet after the PTFE treatment (shown in S9†), and we suggest that the surface fluorine incorporation (such as formation of fluorine containing phases, such as LiF38) may reduce the void formation in the LLAZO/Li interface, and consequently help to “smooth” the local current density and partially prevent the dendrite growth during the cycling. These preliminary results indicate that the fluorinated coating acts as a superior buffer layer that prevents full dendrite penetration at high current densities. It is noted that full optimisation of the fluorinated coating is currently ongoing and includes the examination of thinner electrolyte membranes, the determination of the optimal layer thickness and temperature for fluorination and alternative F containing polymers, e.g., PVDF, with a key future aim to attempt to reduce the interfacial resistance. Further surface characterisation, such as in-depth time-of-flight X-ray photoelectron spectroscopy (XPS), would be beneficial in gaining such information to support this hypothesis.
Conclusions
The present study is the first example of a low temperature polymer halogenation (F, Cl) of the solid electrolyte material Li7La3Zr2O12. Upon halogenation, a reduction in tetragonal distortion is observed for F doping while a phase transformation from tetragonal to cubic symmetry is observed for Cl doping, which agrees with the creation of lithium vacancies, owing to the replacement of O2− with F− or Cl−. Our computational studies suggest F-doping is more energetically favourable than Cl- and Br-doping (the latter not studied experimentally) and indicate that the O2 and O3 sites are the most favourable for substitution. Using solid-state NMR spectroscopy, the presence of F in F-doped LLZO was confirmed, in addition to residual PTFE from the synthesis process. Unfortunately, it was not possible to locate the precise position of each species within the structure using 6,7Li and 19F MAS NMR spectroscopy. 7Li and 6Li MAS NMR suggest two Li environments, one corresponding to lithium in a highly symmetrical environment. The 35Cl MAS NMR spectra exhibit narrowing of the lineshape, suggesting the Cl environment becomes more symmetrical upon increased doping. Despite successful halogenation of LLZO, the instability at high temperatures means that such anion doped garnets cannot be successfully sintered to evaluate the effect on the conductivity. Nevertheless, we have demonstrated the same approach can be used to produce a fluorinated coating layer on sintered Al-doped LLZO. Electrochemical evaluation indicates that this fluorinated coating layer acts as a superior buffer that prevents full dendrite penetration at high current densities, up to 10 mA cm−2.Conflicts of interest
There are no conflicts of interest to declare.Acknowledgements
PRS and BD acknowledge the support of the EPSRC grant EP/R024006/1: ICSF Wave 1: GENESIS: Garnet Electrolytes for New Energy Storage Integrated Solutions, and EPSRC grant EP/T02349X/1 Capitol Award for Core Equipment. We would like to thank the University of Birmingham for the studentship funding of MPS and MSJ. KEJ and ARH would like to thank Dr David Apperley for experimental assistance and the EPRSC for an EPSRC Doctoral Partnership award (EP/N509462/1). PG and SRY acknowledge the support of EPSRC SUPERGEN grant, EP/N001982/1. PG and SRY are grateful for the use of the ‘Hydra’ High Performance System at Loughborough University in addition to time on the ARCHER UK National Supercomputing Service (http://www.archer.ac.uk) supplied via our membership of the UK's HEC Materials Chemistry Consortium, which is funded by EPSRC (EP/L000202, EP/R029431). PG and SRY strongly acknowledge the use of Athena as part of the HPC Midlands+ consortium, funded by the EPSRC on grant EP/P020232/1. Raw experimental data can be found at: https://doi.org/10.25500/edata.bham.00000799.References
- J.-M. Tarascon and M. Armand, Nature, 2001, 414, 359–367 CrossRef CAS PubMed.
- P. G. Bruce, B. Scrosati and J. M. Tarascon, Angew. Chem., Int. Ed., 2008, 47, 2930–2946 CrossRef CAS PubMed.
- J. B. Goodenough and K. S. Park, J. Am. Chem. Soc., 2013, 135, 1167–1176 CrossRef CAS PubMed.
- Y. Wang, W. D. Richards, S. P. Ong, L. J. Miara, J. C. Kim, Y. Mo and G. Ceder, Nat. Mater., 2015, 14, 1026–1031 CrossRef CAS.
- V. Thangadurai, S. Narayanan and D. Pinzaru, Chem. Soc. Rev., 2014, 43, 4714–4727 RSC.
- B. Dong, R. Jarkaneh, S. Hull, N. Reeves-McLaren, J. J. Biendicho and A. R. West, J. Mater. Chem. A, 2016, 4, 1408–1413 RSC.
- S. Ramakumar, C. Deviannapoorani, L. Dhivya, L. S. Shankar and R. Murugan, Prog. Mater. Sci., 2017, 88, 325–411 CrossRef CAS.
- N. Zhao, W. Khokhar, Z. Bi, C. Shi, X. Guo, L.-Z. Fan and C.-W. Nan, Joule, 2019, 3, 1190–1199 CrossRef CAS.
- A. J. Samson, K. Hofstetter, S. Bag and V. Thangadurai, Energy Environ. Sci., 2019, 12, 2957–2975 RSC.
- B. Dong, M. P. Stockham, P. A. Chater and P. R. Slater, Dalton Trans., 2020, 49, 11727–11735 RSC.
- V. Thangadurai, H. Kaack and W. Weppner, J. Am. Ceram. Soc., 2003, 86, 437–440 CrossRef CAS.
- R. Murugan, V. Thangadurai and W. Weppner, Angew. Chem., Int. Ed., 2007, 46, 7778–7781 CrossRef CAS PubMed.
- J. Awaka, N. Kijima, H. Hayakawa and J. Akimoto, J. Solid State Chem., 2009, 182, 2046–2052 CrossRef CAS.
- G. Larraz, A. Orera and M. L. Sanjuán, J. Mater. Chem. A, 2013, 1, 11419–11428 RSC.
- V. Thangadurai and W. Weppner, Adv. Funct. Mater., 2005, 15, 107–112 CrossRef CAS.
- M. A. Howard, O. Clemens, E. Kendrick, K. S. Knight, D. C. Apperley, P. A. Anderson and P. R. Slater, Dalton Trans., 2012, 41, 12048–12053 RSC.
- M. A. Howard, O. Clemens, K. S. Knight, P. A. Anderson, S. Hafiz, P. M. Panchmatia and P. R. Slater, J. Mater. Chem. A, 2013, 1, 14013–14022 RSC.
- H. El Shinawi and J. Janek, J. Power Sources, 2013, 225, 13–19 CrossRef CAS.
- A. G. Squires, D. O. Scanlon and B. J. Morgan, Chem. Mater., 2019, 32, 1876–1886 CrossRef.
- B. Dong, L. L. Driscoll, M. P. Stockham, E. Kendrick and P. R. Slater, Solid State Ionics, 2020, 350, 115317 CrossRef CAS.
- M. P. Stockham, A. A. Griffiths, B. Dong and P. R. Slater, Chem.–Eur. J., 2021, 27, 1–10 CrossRef.
- C. Galven, J.-L. Fourquet, M.-P. Crosnier-Lopez and F. o. Le Berre, Chem. Mater., 2011, 23, 1892–1900 CrossRef CAS.
- L. Truong, M. Howard, O. Clemens, K. S. Knight, P. R. Slater and V. Thangadurai, J. Mater. Chem. A, 2013, 1, 13469–13475 RSC.
- R. H. Brugge, A. K. O. Hekselman, A. Cavallaro, F. M. Pesci, R. J. Chater, J. A. Kilner and A. Aguadero, Chem. Mater., 2018, 30, 3704–3713 CrossRef CAS.
- H. Huo, J. Luo, V. Thangadurai, X. Guo, C.-W. Nan and X. Sun, ACS Energy Lett., 2019, 5, 252–262 CrossRef.
- C. Wang, K. Fu, S. P. Kammampata, D. W. McOwen, A. J. Samson, L. Zhang, G. T. Hitz, A. M. Nolan, E. D. Wachsman, Y. Mo, V. Thangadurai and L. Hu, Chem. Rev., 2020, 120, 4257–4300 CrossRef CAS PubMed.
- S. Ohta, M. Kawakami, H. Nozaki, C. Yada, T. Saito and H. Iba, J. Mater. Chem. A, 2020, 8, 8989–8996 RSC.
- E. J. Cussen, J. Mater. Chem., 2010, 20, 5167–5173 RSC.
- M. P. Stockham, B. Dong, M. S. James, Y. Li, Y. Ding, E. Kendrick and P. R. Slater, Dalton Trans., 2021, 50, 13786–13800 RSC.
- K. Park, B.-C. Yu, J.-W. Jung, Y. Li, W. Zhou, H. Gao, S. Son and J. B. Goodenough, Chem. Mater., 2016, 28, 8051–8059 CrossRef CAS.
- F. M. Pesci, R. H. Brugge, A. K. O. Hekselman, A. Cavallaro, R. J. Chater and A. Aguadero, J. Mater. Chem. A, 2018, 6, 19817–19827 RSC.
- P. Canepa, J. A. Dawson, G. Sai Gautam, J. M. Statham, S. C. Parker and M. S. Islam, Chem. Mater., 2018, 30, 3019–3027 CrossRef CAS.
- R. H. Brugge, F. M. Pesci, A. Cavallaro, C. Sole, M. A. Isaacs, G. Kerherve, R. S. Weatherup and A. Aguadero, J. Mater. Chem. A, 2020, 8, 14265–14276 RSC.
- B. Tang, L. Gao, J. Liu, S.-H. Bo, Z. Xie, J. Wei and Z. Zhou, J. Mater. Chem. A, 2020, 8, 18087–18093 RSC.
- K. J. Kim and J. L. M. Rupp, Energy Environ. Sci., 2020, 13, 4930–4945 RSC.
- F. Flatscher, M. Philipp, S. Ganschow, H. M. R. Wilkening and D. Rettenwander, J. Mater. Chem. A, 2020, 8, 15782–15788 RSC.
- L. Yang, Z. Lu, Y. Qin, C. Wu, C. Fu, Y. Gao, J. Liu, L. Jiang, Z. Du, Z. Xie, Z. Li, F. Kong and G. Yin, J. Mater. Chem. A, 2021, 9, 5952–5979 RSC.
- S. Tang, G. Chen, F. Ren, H. Wang, W. Yang, C. Zheng, Z. Gong and Y. Yang, J. Mater. Chem. A, 2021, 9, 3576–3583 RSC.
- X. Han, Y. Gong, K. K. Fu, X. He, G. T. Hitz, J. Dai, A. Pearse, B. Liu, H. Wang, G. Rubloff, Y. Mo, V. Thangadurai, E. D. Wachsman and L. Hu, Nat. Mater., 2017, 16, 572–579 CrossRef CAS PubMed.
- Y. Li, X. Chen, A. Dolocan, Z. Cui, S. Xin, L. Xue, H. Xu, K. Park and J. B. Goodenough, J. Am. Chem. Soc., 2018, 140, 6448–6455 CrossRef CAS PubMed.
- J. Dai, C. Yang, C. Wang, G. Pastel and L. Hu, Adv. Mater., 2018, 30, 1802068 CrossRef PubMed.
- W. Zhou, Z. Wang, Y. Pu, Y. Li, S. Xin, X. Li, J. Chen and J. B. Goodenough, Adv. Mater., 2019, 31, 1805574 CrossRef PubMed.
- Y. Ruan, Y. Lu, X. Huang, J. Su, C. Sun, J. Jin and Z. Wen, J. Mater. Chem. A, 2019, 7, 14565–14574 RSC.
- B. Dong, S. R. Yeandel, P. Goddard and P. R. Slater, Chem. Mater., 2019, 32, 215–223 CrossRef.
- S.-S. Chi, Y. Liu, N. Zhao, X. Guo, C.-W. Nan and L.-Z. Fan, Energy Storage Mater., 2019, 17, 309–316 CrossRef.
- J. Fu, P. Yu, N. Zhang, G. Ren, S. Zheng, W. Huang, X. Long, H. Li and X. Liu, Energy Environ. Sci., 2019, 12, 1404–1412 RSC.
- H. Huo, Y. Chen, R. Li, N. Zhao, J. Luo, J. G. Pereira da Silva, R. Mücke, P. Kaghazchi, X. Guo and X. Sun, Energy Environ. Sci., 2020, 13, 127–134 RSC.
- M. P. Stockham, B. Dong, M. S. James, Y. Li, Y. Ding and P. R. Slater, Dalton Trans., 2021, 50, 2364–2374 RSC.
- A. I. Waidha, T. Ferber, M. Donzelli, N. Hosseinpourkahvaz, V. Vanita, K. Dirnberger, S. Ludwigs, R. Hausbrand, W. Jaegermann and O. Clemens, ACS Appl. Mater. Interfaces, 2021, 13, 31111–31128 CrossRef CAS PubMed.
- W. Ping, C. Wang, Z. Lin, E. Hitz, C. Yang, H. Wang and L. Hu, Adv. Energy Mater., 2020, 10, 2000702 CrossRef CAS.
- A. Parejiya, R. Amin, R. Essehli, D. L. Wood and I. Belharouak, ACS Energy Lett., 2020, 5, 3368–3373 CrossRef CAS.
- S. R. Yeandel, B. J. Chapman, P. R. Slater and P. Goddard, J. Phys. Chem. C, 2018, 122, 27811–27819 CrossRef CAS.
- Y. Lu, X. Meng, J. A. Alonso, M. T. Fernandez-Diaz and C. Sun, ACS Appl. Mater. Interfaces, 2019, 11, 2042–2049 CrossRef CAS PubMed.
- C. Liu, Z. Y. Wen and K. Rui, J. Inorg. Mater., 2015, 30, 995–1001 CrossRef CAS.
- B. Dong, J. Yan, B. Walkley, K. K. Inglis, F. Blanc, S. Hull and A. R. West, Solid State Ionics, 2018, 327, 64–70 CrossRef CAS.
- P. R. Slater and R. K. B. Gover, J. Mater. Chem., 2002, 12, 291–294 RSC.
- P. R. Slater, J. Fluorine Chem., 2002, 117, 43–45 CrossRef CAS.
- O. Clemens and P. R. Slater, Rev. Inorg. Chem., 2013, 33, 105–117 CAS.
- M. A. Nowroozi, K. Wissel, J. Rohrer, A. R. Munnangi and O. Clemens, Chem. Mater., 2017, 29, 3441–3453 CrossRef CAS.
- B. H. Toby, J. Appl. Crystallogr., 2001, 34, 210–213 CrossRef CAS.
- G. Kresse and J. Hafner, Phys. Rev. B: Condens. Matter Mater. Phys., 1994, 49, 14251–14269 CrossRef CAS PubMed.
- P. E. Blochl, Phys. Rev. B: Condens. Matter Mater. Phys., 1994, 50, 17953–17979 CrossRef PubMed.
- J. P. Perdew, A. Ruzsinszky, G. I. Csonka, O. A. Vydrov, G. E. Scuseria, L. A. Constantin, X. Zhou and K. Burke, Phys. Rev. Lett., 2008, 100, 136406 CrossRef PubMed.
- O. Clemens, R. Haberkorn, P. R. Slater and H. P. Beck, Solid State Sci., 2010, 12, 1455–1463 CrossRef CAS.
- K. J. D. Mackenzie and M. E. Smith, Multinuclear Solid-State NMR of Inorganic Materials, Pergamon: Oxford, 2002 Search PubMed.
- S. Narayanan, V. Epp, M. Wilkening and V. Thangadurai, RSC Adv., 2012, 2, 2553–2561 RSC.
- P. Bottke, D. Rettenwander, W. Schmidt, G. Amthauer and M. Wilkening, Chem. Mater., 2015, 27, 6571–6582 CrossRef CAS.
- J. Percival, D. Apperley and P. R. Slater, Solid State Ionics, 2008, 179, 1693–1696 CrossRef CAS.
- J. Kasemchainan, S. Zekoll, D. Spencer Jolly, Z. Ning, G. O. Hartley, J. Marrow and P. G. Bruce, Nat. Mater., 2019, 18, 1105–1111 CrossRef CAS PubMed.
Footnote |
| † Electronic supplementary information (ESI) available. See DOI: 10.1039/d1ta07309e |
| This journal is © The Royal Society of Chemistry 2022 |