Operando characterization of metallic and bimetallic electrocatalysts for SOFC fuel electrodes operating under internal methane reforming conditions
Daniel B.
Drasbæk†
b,
Märtha M.
Welander†
a,
Marie L.
Traulsen
b,
Bhaskar R.
Sudireddy
b,
Peter
Holtappels
 b and
Robert A.
Walker
 a
a
aDepartment of Chemistry and Biochemistry, Montana State University, Bozeman, Montana 59717, USA
bDepartment of Energy Conversion and Storage, Technical University of Denmark, Lyngby, Denmark. E-mail: peho@dtu.dk
First published on 15th February 2022
Abstract
Linear sweep voltammetry (LSV), electrochemical impedance spectroscopy (EIS) and operando Raman spectroscopy were used to study the electrochemical performance and carbon tolerance of SOFCs operating with niobium doped SrTiO3 (STN) anodes infiltrated with combinations of Ni, Co, and Ce0.8Gd0.2O2 (CGO) added to improve catalytic activity. Cell anodes were exposed to fuel feeds of humidified H2, pure CH4 and combinations of CO2 and CH4 at an operating temperature of 750 °C. Under pure CH4, Raman data show that carbon forms on all anodes containing Ni. In cells with CGO, deposited carbon results in a decreased polarization resistance. This behavior may be due to benefits conferred by CGO to the electrocatalytic activity of triple phase boundaries, presumably through improved oxide ion conductivity and/or due to carbon securing a better electrical connection in the electrodes. Raman spectra from Co-only containing anodes show no sign of carbon deposition. The absence of observable carbon together with low frequency processes observed in the EIS suggest that Co may play a role in oxidizing carbon before measurable amounts accumulate.
Introduction
Solid oxide fuel cells (SOFCs) are high-temperature electrochemical cells that convert chemically stored energy into electrical energy with very high efficiencies. Current state of the art (SoA) SOFCs use a nickel/yttria stabilized zirconia (Ni/YSZ) composite fuel electrode for H2/H2O and CO/CO2 reactions due to Ni's affordability, high electrical conductivity, and high catalytic activity.1 These Ni–YSZ cermet electrodes are composed of percolated Ni, pores and YSZ networks, and typically contain 30–50 vol% Ni. These composite electrodes, however, can experience degradation during unintended reduction and oxidation (redox) cycles destroying the Ni percolation and thus electronic conductivity, and they are prone to carbon accumulation and electrode poisoning by common fuel impurities including sulfur and chlorine.2–7 Consequently, materials-driven research has focused on developing more robust fuel electrodes.8 One way to overcome challenges associated with SoA electrodes is to decouple their multi-functional requirements by separating the electronically conducting network from the electrocatalytic materials. This strategy allows a porous backbone with higher redox tolerance to be infiltrated separately with the electrocatalytic material. One example of such a backbone is donor-doped SrTiO3 (ST). ST based materials modified at the A or B sites to promote acceptor or donor properties, respectively, have been shown to tolerate oxygen-, carbon-, and sulfur-containing atmospheres, have high electronic conductivity and high redox stability.9–14Previous studies have shown how infiltrating Sr0.94Ti0.9Nb0.1O3−δ (STN) electrodes with different metal nanoparticles, including Ni, Co and Fe increases an electrode's electrocatalytic activity.15 However, due to STN's poor ionic conductivity, only the electrocatalytic nanoparticles present at the interface between the electrode and the solid electrolyte were considered part of the triple phase boundary (TPB). The lack of ionic conductivity throughout the anode microstructure could be compensated for by co-infiltration of CGO, a mixed ionic and electronic conductor under conditions commonly required for SOFC operation.16 Adding CGO into the structural matrix has successfully decreased the polarization resistance of these STN electrodes in the symmetrical cell configuration.17
The studies described below investigated the electrochemical performance of infiltrated STN based fuel electrodes in fully functional SOFCs. The STN-based fuel electrodes were infiltrated with CGO and either nickel or cobalt as Ni–CGO, Co–CGO, or Ni–Co–CGO. Several reports have proposed that combinations of Ni, Co, and CGO would give rise to synergistic effects, achieved from the respective favorable properties of the base and secondary metals.18,19 Similar electrodes with only one co-infiltrated metal (Ni or Ru) have been investigated previously by T. Ramos et al.20 where promising performance and low area specific electrode resistances were observed under operation at 850 °C in 4% H2O/H2.
Ramos, et al.,20 however, do not report on the performance of these new SOFC fuel electrodes when operating with carbon-containing fuels. What makes SOFCs attractive for commercial development is their ability to operate with fuels including natural gas, syn-gas, biogas and higher molecular weight hydrocarbons.21,22 To leverage this fuel flexibility, SOFC fuel electrodes must be resistant to carbon accumulation, also known as coking, during operation. While small amounts of carbon can sometimes improve cell performance,21,23–25 more extensive carbon accumulation will result in electrode failure as active sites are blocked and the Ni-YSZ cermet anode begins to degrade.25–27 Coke-induced degradation in SOFC electrodes has been studied mostly using in situ electrochemical data and with subsequent ex situ measurements performed after the cell has cooled and disassembled. Ex situ studies provide valuable information concerning the conditions responsible for sustained and stable SOFC operation, but they leave many questions unanswered regarding coking mechanisms and coking's direct impact on electrochemical performance. These unresolved questions motivate the need for operando studies that directly correlate material changes observed during operation with a device's electrochemical performance.25,28–31
Findings presented in this work examine the explicit relationship between coking and electrochemical performance in SOFCs operating with novel infiltrated STN anodes. Experiments use galvanostatic electrochemical impedance spectroscopy (EIS) and linear sweep voltammetry (LSV) in combination with operando Raman spectroscopy to monitor cell performance and surface behavior of these anodes under humidified hydrogen, and different methane containing atmospheres at 750 °C. Results focus primarily on changes in electrochemical data under conditions where carbon is observed on the cell surfaces and compare changes in carbon accumulation with changes in electrochemical performance. One outcome of this work is the discovery that in the absence of co-dopants, carbon formation on Ni-infiltrated anodes leads to a measurable rise in the cell's polarization resistance, but co-dopants (i.e. CGO, Co, Co–CGO) partially suppress carbon accumulation and stabilize the cell's polarization resistance. No carbon is observed on the Co-only infiltrated STN electrodes, implying that Co may be highly effective at catalytically oxidizing carbon before it can accumulate.
Experimental
The SOFCs investigated in the present work were electrolyte-supported cells. The Sc2O3 stabilized ZrO2 (SSZ) electrolytes (Nippon Shokubai Co., Ltd, Japan) of ca. 150 μm thickness were laser cut into circular disks having a 26 mm diameter. Onto this electrolyte, a Sr0.94Ti0.9Nb0.1O3−δ (STN) porous backbone was deposited through spray deposition. The slurry for the deposition was prepared using STN powder, prepared through a solid state mixed oxide method with a PVP10![[thin space (1/6-em)]](https://www.rsc.org/images/entities/char_2009.gif) 000 dispersant/binder and ethanol solvent. After deposition, the backbone was sintered in air at 1200 °C for 8 hours. Subsequently, a composite cathode consisting of La0.6Sr0.4CoO3−δ (LSC) (Kusaka, Japan) – Ce0.9Gd0.1O1.95 (CGO) (Rhodia GmbH, Germany) was screen printed on the opposite side of the electrolyte and sintered in air at 930 °C for 24 hours. It should be noted that no additional barrier layer was introduced between the LSC cathode and the SSZ electrolyte. Anode electrocatalysts comprising of Ni, Ni–CGO, Co–CGO, or Ni–Co–CGO were added to the STN backbone by infiltration. The infiltration solution was prepared as follows: first, a 3 M CGO aqueous solution was prepared using corresponding metal nitrates. To this solution, nitrate precursors of the Ni or Co or Ni–Co metals were added in the ratio of 90
000 dispersant/binder and ethanol solvent. After deposition, the backbone was sintered in air at 1200 °C for 8 hours. Subsequently, a composite cathode consisting of La0.6Sr0.4CoO3−δ (LSC) (Kusaka, Japan) – Ce0.9Gd0.1O1.95 (CGO) (Rhodia GmbH, Germany) was screen printed on the opposite side of the electrolyte and sintered in air at 930 °C for 24 hours. It should be noted that no additional barrier layer was introduced between the LSC cathode and the SSZ electrolyte. Anode electrocatalysts comprising of Ni, Ni–CGO, Co–CGO, or Ni–Co–CGO were added to the STN backbone by infiltration. The infiltration solution was prepared as follows: first, a 3 M CGO aqueous solution was prepared using corresponding metal nitrates. To this solution, nitrate precursors of the Ni or Co or Ni–Co metals were added in the ratio of 90![[thin space (1/6-em)]](https://www.rsc.org/images/entities/char_2009.gif) :
:![[thin space (1/6-em)]](https://www.rsc.org/images/entities/char_2009.gif) 10 (CGO
10 (CGO![[thin space (1/6-em)]](https://www.rsc.org/images/entities/char_2009.gif) :
:![[thin space (1/6-em)]](https://www.rsc.org/images/entities/char_2009.gif) metal catalyst) by catalyst weight. Considering that also CGO is known to be electrocatalytically active, the total amount of infiltrate (CGO and metal) was kept as constant as possible, and the metal fraction in composite infiltrates specified to be 10 weight% of the total infiltration. The weight of the cells was measured prior to infiltration and after infiltration, in order to determine the mass gain (Table 1). The procedure for the infiltration is described elsewhere.15,32 A point to note is that this process was not precise in terms of the amount of catalyst infiltrate deposited on the anode, as evidenced by the uncertainties in infiltrate mass gain (Table 1). These differences were reflected in anode performance data reported in the Results section. Finally, an LSC cathode current collection layer was screen-printed on the LSC–CGO cathode. A schematic representation of the completed circular cells can be seen in Fig. 1.
metal catalyst) by catalyst weight. Considering that also CGO is known to be electrocatalytically active, the total amount of infiltrate (CGO and metal) was kept as constant as possible, and the metal fraction in composite infiltrates specified to be 10 weight% of the total infiltration. The weight of the cells was measured prior to infiltration and after infiltration, in order to determine the mass gain (Table 1). The procedure for the infiltration is described elsewhere.15,32 A point to note is that this process was not precise in terms of the amount of catalyst infiltrate deposited on the anode, as evidenced by the uncertainties in infiltrate mass gain (Table 1). These differences were reflected in anode performance data reported in the Results section. Finally, an LSC cathode current collection layer was screen-printed on the LSC–CGO cathode. A schematic representation of the completed circular cells can be seen in Fig. 1.
| Infiltrate | Catalyst | Fractional catalyst composition (weight% of infiltrate) | Mass gain (mg cm−2) |
|---|---|---|---|
| Ni | Ni | 100 | 0.63 ± 0.25 |
| Ni–CGO | Ni; CGO | 10; 90 | 0.99 ± 0.10 |
| Co–CGO | Co; CGO | 10; 90 | 0.80 ± 0.31 |
| Ni–Co–CGO | Ni; Co; CGO | 5; 5; 90 | 0.74 ± 0.42 |
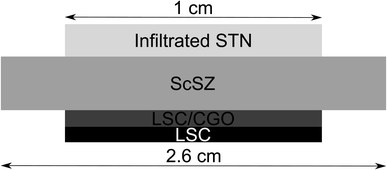 | ||
| Fig. 1 Schematic representation of the fuel cell assembly tested in these studies. Notably, the thickness of these layers is not to scale. | ||
Cell microstructure was investigated from a fractured cross-section using scanning electron microscopy (SEM) (ZEISS Merlin, Carl Zeiss, Germany). Prior to investigation the samples were coated with a thin layer of carbon, in order to avoid charging defects. Sample microstructure was investigated directly after infiltration as well as after full SOFC testing in order to investigate structural changes that occurred. To analyze the distribution of nanomaterials through the electrodes, microstructure in all electrodes was investigated in four to five randomly chosen spots between the top electrode surface and the electrode–electrolyte interface.
Current collectors consisting of gold mesh (Alfa Aesar) were attached to both electrodes with gold paste (Heraeus). The total area of the current collecting layer was kept at approximately 0.5 cm2. The cells were then attached to a 2.6 cm diameter YSZ tube using an alumina-based ceramic paste (Aremco Products Inc). The YSZ tube was enclosed in a quartz tube and sealed with a silicone stopper. Detailed descriptions of the experimental set up can be found in previous reports.33,34 The assembly was then placed into a tube furnace and brought to operating temperature. Raman spectra were acquired using a Renishaw InVia spectrometer coupled to a 30 mW, 488 nm Ar-ion laser with 30–60 second exposures. Backscattered light was directed through an edge filter with a 150 cm−1 low frequency cut off. All electrochemical measurements were performed using a Princeton Applied Research VersaStat MC.
All cells were heated to 750 °C ± 5 °C at a ramp rate of 1 °C min−1 under 20 sccm Ar on the anode and 20 sccm Air on the oxygen electrode. Once at temperature, gas flows were increased to 100 sccm Ar and 85 sccm air. Fuel electrodes were reduced under 100 sccm humidified H2 (3% H2O) and fuel electrodes were considered fully reduced once the open-circuit voltage stabilized at −1.10 V. Once the fuel electrode was reduced, benchmark linear sweep voltammetry (LSV) and open circuit voltage (OCV) electrochemical impedance spectroscopy (EIS) measurements (with humidified H2) were performed. OCV EIS measurements were collected with an AC voltage amplitude of 10 mV over a frequency range of 1 MHz to 0.1 Hz. LSV measurements were collected using a sweep rate of 0.1 V sec−1. Impedance data were analyzed by equivalent circuit fitting using the impedance transforms in the Python-based software RAVDAV developed at DTU Energy.35 The distribution of relaxations times (DRT) analysis was determined in order to identify dynamic processes and their evolutions with varying operation conditions.36,37
In order to pass through the maximum power on the power-curve and still avoid excessive overpotentials, the minimum cell voltage during the LSV was set to be 20% of the measured OCV value. Carbon exposure experiments were performed under four different fuel electrode atmospheres of varying CO2 and CH4 compositions totaling a flow rate of 100 sccm: 30% CH4/70% CO2, 50% CH4/50% CO2, 75% CH4/25% CO2, and 100% CH4. Experiments at each gas composition involved galvanostatic polarization and collection of 10 EIS measurements at three varying current conditions, including 85% of maximum current, 40% of maximum current, and 10% of maximum current as determined by the LSV. The maximum current is determined as the current at maximum power density. Galvanostatic impedance spectra were recorded between 0.1 Hz and 1 MHz with 10 points per decade applying a 1 mA amplitude to the incident AC wave. The frequency range was specifically chosen in order to obtain temporally resolved EIS data. To track the cell performance after exposure to the various fuel environments, benchmark LSV and OCV EIS data were collected in humidified H2 between each CH4/CO2 atmosphere combination.
The operando Raman kinetic measurements were collected independently during the galvanostatic polarization for each set of conditions with each spectrum requiring a 30 second acquisition. Carbon removal between each set of carbon deposition experiments was carried out using humidified Ar followed by reduction and benchmark measurements under humidified H2. This procedure has proven effective at rapidly removing carbon from SOFC anodes with minimal degradation to the anode's microstructure from repeated environmental redox cycling.2,38–40
Results and discussion
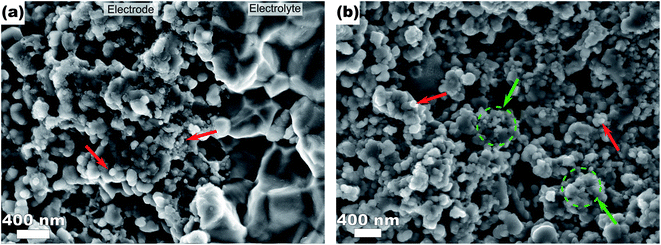
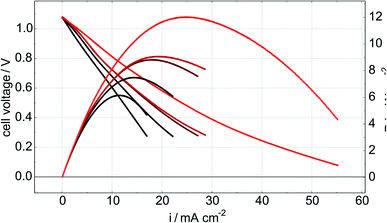
In order to monitor the stability of the electrode microstructure and inform interpretation of the electrochemical results, the electrodes were examined by SEM before and after testing in the SOFC assembly with particular attention focused on changes in electrode porosity and the structure and distribution of infiltrated materials. Representative images of a Ni–Co–CGO infiltrated electrode microstructure before and after testing are shown in Fig. 2. The data illustrate how the infiltrated nanoparticles tended to agglomerate into larger particles during SOFC operation, a result consistent with prior literature reports.15,17,32 This behavior was common to all infiltrates used in these studies and resulted in spherical nanoparticles of 100–200 nm diameters after operation. Some separation of the metal infiltrates from the CGO was also observed. Previous reports on similarly prepared electrodes have shown that infiltrated CGO evolves into sponge-like structures in SOFC electrodes10,41 and similar structures in Fig. 2b are assigned to this form of CGO. The images shown in Fig. 2 were acquired from the active electrode areas that have been covered by the current collector during the experiment and were therefore not left directly exposed to the anode's gas phase atmosphere.Electrochemical performance was evaluated with LSV to measure current and power densities. Fig. 3a shows the initial LSV characterization for all the tested cells after reduction in 3% H2O/H2 at 750 °C. The corresponding power density curves for the individual cells are shown in Fig. 3b with listed values for maximum measured currents and powers reported in Table 2. Compared to technically performing Ni infiltrated STN electrodes, the best performing samples are with a maximum power of 16.5 mW cm−2 a factor 20–30 lower than observed for similarly prepared electrodes with technical relevance. Similar differences in performances have been observed for similar STN infiltrated anodes tested in an operando cell in H2/H2O and are attributed to an area effect because of a 1![[thin space (1/6-em)]](https://www.rsc.org/images/entities/char_2009.gif) :
:![[thin space (1/6-em)]](https://www.rsc.org/images/entities/char_2009.gif) 1 relationship between the increase in both, serial resistance and the resistance related to the electrochemical reaction. The lower performance is attributed to a non-optimal current collector only partial covering of the electrode surface.15 Since similarly increased serial resistances of 2.5 Ω cm2 are observed is this work as in STN anodes infiltrated with Co only as in previous work,32 we tentatively attribute the lower electrochemical performance to an area effect arising from the need to leave parts of the electrode surface uncovered by the current collector to allow the Raman laser beam to approach the electrode surface. These results indicate a limitation of the operando setup, but electrode specific and relevant information from these model cells can still be extracted to highlight the impacts and differences of selected catalyst loadings on device electrochemical performance. Even though no distinct interfacial layer is visible in the SEM images Fig. 2, an additional performance loss could arise from a thin reaction layer between the LSC cathode and SSZ electrolyte.
1 relationship between the increase in both, serial resistance and the resistance related to the electrochemical reaction. The lower performance is attributed to a non-optimal current collector only partial covering of the electrode surface.15 Since similarly increased serial resistances of 2.5 Ω cm2 are observed is this work as in STN anodes infiltrated with Co only as in previous work,32 we tentatively attribute the lower electrochemical performance to an area effect arising from the need to leave parts of the electrode surface uncovered by the current collector to allow the Raman laser beam to approach the electrode surface. These results indicate a limitation of the operando setup, but electrode specific and relevant information from these model cells can still be extracted to highlight the impacts and differences of selected catalyst loadings on device electrochemical performance. Even though no distinct interfacial layer is visible in the SEM images Fig. 2, an additional performance loss could arise from a thin reaction layer between the LSC cathode and SSZ electrolyte.
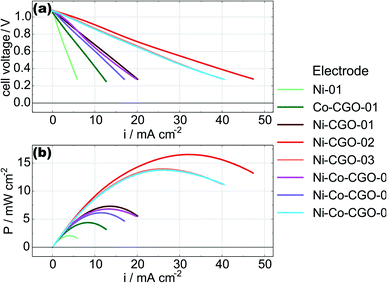 | ||
| Fig. 3 Initial LSV (a) and power density curves (b) of all the tested cells, measured in 3% H2O/H2 at 750 °C. | ||
| Sample | i/mA cm−2 | P max/mW cm−2 |
|---|---|---|
| Ni-01 | 4.0 | 2.1 |
| Co–CGO-02 | 8.6 | 4.4 |
| Ni–CGO-01 | 13.6 | 7.3 |
| Ni–CGO-02 | 31.8 | 16.5 |
| Ni–CGO-03 | 26.1 | 13.9 |
| Ni–CGO(avg. ± s day) | 23.9 ± 7 | 12.6 ± 3 |
| Ni–Co–CGO-01 | 13.3 | 6.8 |
| Ni–Co–CGO-02 | 11.3 | 6.2 |
| Ni–Co–CGO-03 | 26.1 | 13.8 |
| Ni–Co–CGO (avg. ± s day) | 16.9 ± 6 | 8.9 ± 3 |
The measurements for cells with nominally identical infiltrations in the present study show considerable and consistent variation in both the maximum current densities and the maximum power densities. We believe this variability reflects the large differences in catalyst loading evident in Table 1 and emphasizes the need to more carefully control infiltration procedures.
While the data show measurable performance differences between what should be equivalent cells, however, several general observations stand out. The Ni-only and the Co–CGO infiltrated electrodes underperformed the Ni–CGO and Ni–Co–CGO electrodes. The low performance of the nickel-only infiltrated electrodes is readily explained by the lack of ionic conductivity as no CGO infiltrate was present in this cell to facilitate oxide transport away from the electrolyte and into the anode volume. As a result, the only sites for electrochemical oxidation would have been at the electrolyte–nanoparticle interface without the STN scaffold playing any significant role. The low performance of the Co–CGO infiltrated electrodes, however, was in direct contrast to previous studies performed on symmetric cells under OCV conditions where results predicted near equivalent electrocatalytic performance of cobalt and nickel.32 Differences observed between functioning cells and model systems illustrate the importance of operando, full cell testing as results predicted by in situ symmetric cell testing at OCV may change significantly compared to when a full cell is polarized and oxygen ions are being transported to the triple phase boundary.
Following initial reduction and benchmark testing, cells were exposed to different methane–carbon dioxide mixtures at galvanostatic polarizations of 10, 40, and 85% of maximum current (where the maximum current refers to data measured initially with 3% H2O/H2) for 15 minutes each. Following polarization at each fuel composition, benchmark LSV measurements were acquired in 3% H2O/H2 in order to track changes in electrode performance. Discussion of the electrochemical data presented below focuses on the Ni–Co–CGO infiltrated systems as a representative example of how the different anodes performed under these varied conditions. Fig. 4 and Table 3 show how performance evolved after exposure to each of the fuel compositions for a Ni–Co–CGO infiltrated electrode. Maximum current density and maximum power density both increased over the course of the experiment. Note that a full experiment is defined as polarizing the cell at the three different currents under each of the CH4/CO2 fuel compositions (starting with 30% CH4/70% CO2 and ending with 100% CH4). For the Ni–Co–CGO cell shown in Fig. 4, the measured power and current densities increased by a factor of ∼2 between the initial measured LSV (with 3% H2O in H2) and the final measured LSV (post polarization in 100% CH4). Because the measured OCV remained constant, this increase must be explained by a decrease in overall cell resistance. This trend was observed for all cells containing both nickel and CGO. Ni only and Co–CGO infiltrated electrodes did not exhibit this same increase in performance but instead showed a stable performance throughout a full experiment.
| i/mA cm−2 | P max/mW cm−2 | |
|---|---|---|
| Initial | 11.3 | 6.2 |
| After 30% CH4/CO2 | 14.2 | 7.5 |
| After 50% CH4/CO2 | 18.2 | 8.8 |
| After 75% CH4/CO2 | 19.9 | 9.1 |
| After 100% CH4 | 24.7 | 12.0 |
| Overall increase (amount/%) | 13.4/118% | 5.8/94% |
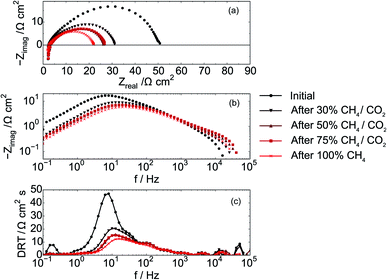
That the increased performance observed in the figures above is a result of lowered resistance within the cell is supported by complementary impedance data shown in Fig. 5. Fig. 5a shows that the serial resistance of the cell remains constant while the polarization resistance decreases during the experiment. The decreasing polarization resistance suggests that changes in cell performance are due to reactions at the electrodes and not from changes in electrolyte structure or composition. The Bode plot displayed in Fig. 5b as well as the DRT plot Fig. 5c further illustrates that the low-frequency contribution (1–10 Hz) is changing the most. This part of an impedance spectrum is generally assigned to electrochemical processes e.g. adsorption of reactive species to the STN fuel electrode15,42 and also for other fuel cell anodes e.g. in PEMFC.43
Electrode performance was also measured during exposure to the CH4/CO2 atmospheres (in addition to the post-exposure data recorded with H2O/H2 reported in Fig. 4 and 5). Initial LSV data obtained in each of the CH4/CO2 atmospheres for a Ni–Co–CGO cell are shown in Fig. 6. As methane content increases (lowering the effective pO2), so too does a cell's OCV and maximum current and power densities (Table 4). This increase in performance can be attributed several causes. First, increasing the CH4 to CO2 balance increases the amount of useable fuel within the fuel stream and changes the Nernst potential. Second, more CH4 increases the possibility of coking as dry reforming reactions become less important.44 Numerous studies have shown how small amounts of carbon that accumulates in infiltrated cells improves performance as these carbon deposits provides electronic connectivity between previously isolated parts of the anode.21,23–25,45 Finally, lowering pO2 can change the oxidation state of ceria from Ce4+ to Ce3+ thereby increasing CGO's electrocatalytic activity and electronic conductivity.8,46 A lower pO2 and an increase in the OCV can also positively affect STN's conductivity by further reducing the STN and enhancing electronic conductivity through the electrodes.12 The latter explanation – improved STN electrocatalytic activity – would be consistent with impedance results indicating a change in the frequency range attributed to surface–reactant interactions.
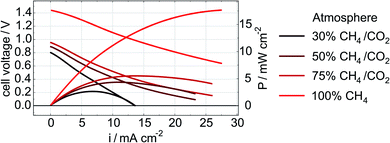 | ||
| Fig. 6 LSV and power density curves of a cell with a Ni–Co–CGO anode measured in 30% CH4/CO2, 50% CH4/CO2, 75% CH4/CO2, and 100% CH4 at 750 °C. | ||
| Atmosphere | i/mA cm−2 | P max/mW cm−2 |
|---|---|---|
| 30% CH4/CO2 | 6.8 | 2.6 |
| 50% CH4/CO2 | 11.2 | 4.3 |
| 75% CH4/CO2 | 13.7 | 5.5 |
| 100% CH4 | 27.4 | 17.6 |
| Overall increase (amount/%) | 20.6/303% | 15/577% |
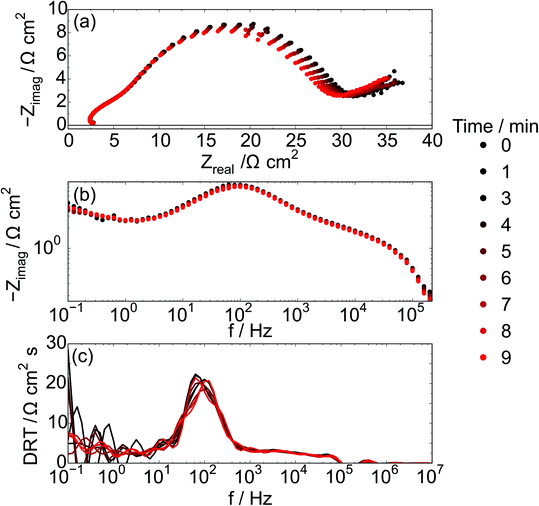
During galvanostatic polarization, electrochemical impedance spectroscopy experiments were performed continuously with each of the CH4/CO2 atmospheres (totaling a collection of 10 EIS measurements). Fig. 7 shows the impedance response of the cell with a Ni–Co–CGO infiltrated anode at 750 °C in 100% CH4 under the strongest polarization (85% Imax) conditions. Three dominant features are visible; a high frequency inductive loop, a process having a characteristic frequency at ∼100 Hz, and a low frequency contribution below 1 Hz. Due to the chosen frequency range, only part of this low frequency process is visible. The most noticeable changes to the overall impedance are associated with the electrochemical reactions ∼100 Hz (Fig. 7b and c). Interestingly, the summit frequency of this process is hardly affected by the change in gas atmosphere, while the real part of the impedance is systematically decreasing. This could be explained by an increased active area through enhanced electronic conductivity within the electrode. The loop observed at the highest frequencies is an artifact arising from the potentiostat.
The chosen impedance range (1 MHz and 0.1 Hz) was motivated by a need to acquire EIS data continuously and did not allow for low enough frequencies to obtain the DC resistance from all infiltrated electrodes. In particular, the frequency range was a tradeoff that did not allow for a full EIS characterization of electrodes infiltrated with Co (Ni–Co–CGO and Co–CGO) at 100% CH4 conditions, suggesting that when Co is present additional processes may occur with characteristic frequencies ≤0.1 Hz. Co containing STN electrodes have been found to be more coking tolerant16 and as Co is not as active as Ni in activating C–H bonds, a tentative explanation is that processes below 1 Hz are related to concentration changes resulting from dry reforming and/or carbon removal, in series with the electrochemical electrode processes at frequencies above 1 Hz.47,48
With regards to the higher frequency part (>1 Hz) of the impedance spectra, the data show clearly that high frequency regions of the impedance spectra remain unchanged with changing gas atmosphere with the dominant effects of gas atmosphere and applied polarization manifesting in the mid-frequency arc. These processes are likely associated with the electrochemical reaction such as charge transfer and adsorption, but testing this hypothesis requires carefully designed experiments with systematically controlled exposures to CH4 in order to ‘titrate’ in the amount of carbon deposited on the anode. In order to analyze the influence of the atmosphere on the electrochemical reaction the impedance range between 2 Hz and 1 MHz, data were fitted with a series of three RQ circuits L–R–(R1Q1)–(R2Q2)–(R3Q3), and the resulting resistance (R1 + R2 + R3) related to the electrochemical processes is named REC. Behavior of this ohmic resistance, REC, was then correlated with the anode's susceptibility to carbon accumulation, as evidenced by spectroscopy as explained below.
In order to provide materials specific information complementing electrochemical behavior, operando Raman spectroscopy was used to determine if carbon was accumulating on the infiltrated STN anodes. Raman spectra acquired simultaneously with the EIS data reported in Fig. 7 (with a functioning Ni–Co–CGO anode), are shown in Fig. 8. The appearance of carbon on the cell surface is evident by the vibrational mode at 1560 cm−1, referred to as the “G-band”.49,50Fig. 8 shows that carbon starts to accumulate on the anode surface within minutes of exposure to CH4. No observable carbon accumulates on the anode with incident fuel feeds that contain CO2 in addition to CH4.
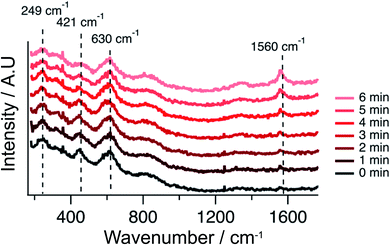 | ||
| Fig. 8 Raman spectra recorded during the strongest polarization (85% Imax) of the Ni–Co–CGO cell in 100% CH4 at 750 °C. Notably, the spectra are vertically shifted for clarity. | ||
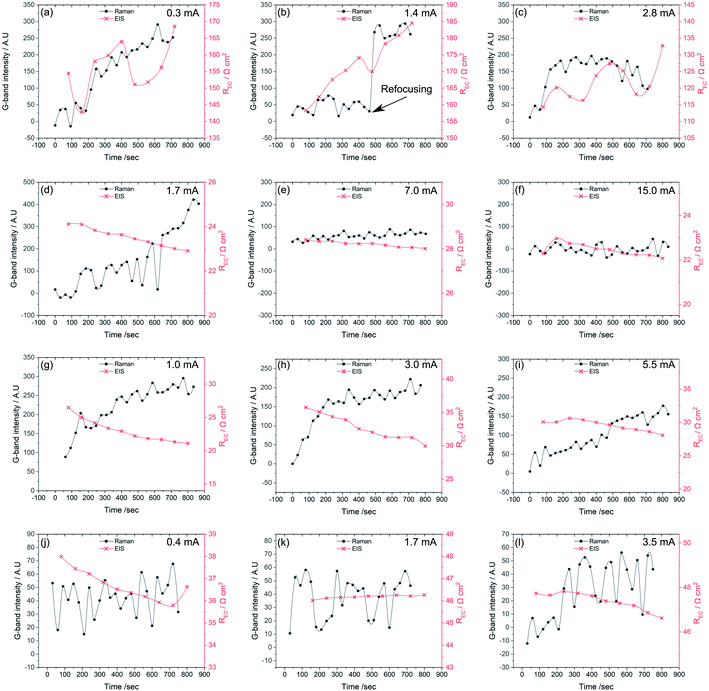
To see how changes in the electrochemistry correspond to changes in carbon accumulation, Fig. 9 plots G-band intensity alongside the REC reflecting the charge transfer and surface related electrode reactions determined from EIS data as a function of time for all types of cells at each of the three polarizations conditions. Fig. 9a–c corresponds to the Ni-only infiltrated cell. Here, REC increases with the increasing Raman G-band intensities by several Ω cm2, especially at lower polarizations. These data show that an increase in carbon accumulation, associated with polarization conditions closer to OCV, limits electrochemical activity in the Ni-only infiltrated cells.
Fig. 9d–f, shows the same data for a Ni–CGO infiltrated electrode. Under high polarization conditions no sign of carbon deposition is apparent, and the REC remains fairly constant, also supporting a lack of any coking. At the intermediate polarization, however, a minor increase in the G-band intensity is observed alongside a slight decrease in REC. This same trend is observed at the lowest polarization where the carbon deposition increases from 0 to 500 counts during the 15 minutes exposure and the REC simultaneously drops by ∼20%. These observations are in direct contrast to the Ni-only infiltrated electrodes where REC increases with coking. For the Ni–CGO infiltrated electrode the cell experiences a decrease in polarization resistance when carbon is present further strengthening the hypothesis that modest amounts of deposited carbon improve connectivity within the anode microstructure and lower REC.
A similar trend is observed for the bimetallic Ni–Co–CGO infiltrated electrode, shown in Fig. 9g–i. An increase in the G-band intensity is observed under all the polarization strengths, with absolute intensities falling between those of the pure Ni and the Ni–CGO sample. While absolute intensities cannot be correlated quantitatively with the absolute amount of accumulated carbon, previous studies have quantified general increases in G-band intensity with increasing amounts of electrochemically accessible carbon.51 The increase in G-band intensities observed in Fig. 9g–i is followed by a decrease in REC, similar to the Ni–CGO samples.
No carbon deposition was observed on the Co–CGO infiltrated electrodes under any polarizations (Fig. 9j–l). Minor changes in REC were observed under both the strongest and middle polarization strength, while REC showed quite a significant drop under low current conditions. A drop in the electrode resistance, in analogy with findings with Ni-containing anodes, thus cannot rule out that carbon is deposited at low applied polarizations but in amounts below the detection limit of the spectrometer or close to the electrode–electrolyte interface in a region that could not be probed by the Raman experiments.
In summary, Fig. 9 shows that for all samples, if carbon accumulation is evident, REC decreases with increasing current/polarization. This effect can be attributed to a higher oxygen content in the gas phase due to the water produced and/or a higher virtual p(O2) at the interface due to the electrode polarization. Carbon is formed on samples containing Ni, while no sign of carbon is visible in the Raman spectra for the solely Co-containing species. Cell resistance decreases as carbon accumulates on both the Ni–CGO and Ni–Co–CGO infiltrated electrodes, which is the opposite for the Ni-infiltrated STN without additional CGO.
While deactivation of Ni containing electrodes due to carbon accumulation is expected due the blocking of electrocatalytic active sites, the improvement in performance in metal–CGO infiltrated electrodes is interesting. One explanation could be correlated to the electronic conductivity of graphitic carbon. As carbon accumulates within the electrodes, the electrode's overall electronic conductivity increases. Thus, deposited carbon can activate previously isolated areas of the electrode, thereby increasing the triple phase boundary areas and improving conversion efficiency. Similar results showing the positive impact of small amounts of carbon on the electrode performance have been reported in other studies.21,24,25,45 Ni-only infiltrated electrodes accumulated carbon above this beneficial point, and therefore experienced an increase in REC. An increase in active area also supports the almost unaffected summit frequency for the dominant electrochemical process at mid frequencies during the performance increase. While electrochemical process such as charge transfer are usually expected to be the fastest processes (and thus observed at the highest frequencies), slower processes are attributed to other electrode processes such as adsorption and/or concentration changes. The fact that only the mid frequency process is affected by the change of the gas atmospheres (Fig. 5) may also indicate a change in the surface activity of the metal–CGO infiltrated STN electrodes. The presence of carbon in the electrodes implies a very low local oxygen partial pressure, that can reduce the oxide surfaces of both CGO and STN, thus increasing the concentration of oxygen vacancies, catalytic activity52 and mixed electronic – oxygen ion conductivity. In turn, these enhanced electrode properties have the potential to affect the oxygen exchange reaction at the electrode as observed for other perovskite oxides.53 For ceramic SOFC anodes, an increase in mixed conductivity has proven advantageous for the electrochemical performance54–56 and has been attributed to a faster oxygen exchange reaction. Unresolved is whether the observed increase in electronic conductivity and an enhancement of electrocatalytic activity occur simultaneously.
Taken together, these operando Raman-EIS studies illustrate that the effect of carbon accumulation on performance is largely dependent on the electrode microstructure/type of electrode infiltration and the amount of total accumulated carbon.
Conclusions
The studies presented in this work utilize operando Raman spectroscopy coupled with impedance spectroscopy and linear sweep voltammetry to monitor the performance and surface chemistry of alternative STN-based ceramic fuel electrodes in functioning SOFCs. The studies are the first of their kind to monitor infiltrated STN anodes operating with a hydrocarbon fuel. Raman spectra showed clearly that carbon accumulated on all nickel containing electrodes when exposed to 100% CH4. While carbon has a negative effect on Ni-only infiltrated STN electrodes, a positive effect was observed when Ni was co-infiltrated with CGO. We tentatively attribute this result to an expected increase in electrochemically active area due to better electrical connectivity in presence of carbon, and/or increased oxygen exchange activity due to the resulting low oxygen partial pressure. Further investigation into the role played by co-catalysts will be necessary in order to better quantify catalyst oxidation state, crystal plane orientation and CGO interactions with metal catalysts. Results also indicate that Co may be a promising electro co-catalyst that prevents coking while maintaining a stable performance, making this element an interesting candidate for designing carbon tolerant SOFC anodes.Conflicts of interest
There are no conflicts of interest to declareReferences
- A. B. Stambouli and E. Traversa, Solid Oxide Fuel Cells (SOFCs): A Review of an Environmentally Clean and Efficient Source of Energy, Renew. Sustain. Energy Rev., 2002, 6(5), 433–455, DOI:10.1016/S1364-0321(02)00014-X.
- J. Kirtley, A. Singh, D. Halat, T. Oswell, J. M. Hill and R. A. Walker, In Situ Raman Studies of Carbon Removal from High Temperature Ni–YSZ Cermet Anodes by Gas Phase Reforming Agents, J. Phys. Chem. C, 2013, 117(49), 25908–25916, DOI:10.1021/jp408192e.
- D. K. Niakolas, Sulfur Poisoning of Ni-Based Anodes for Solid Oxide Fuel Cells in H/C-Based Fuels, Appl. Catal., A, 2014, 486, 123–142, DOI:10.1016/j.apcata.2014.08.015.
- M. Li, B. Hua, J. Luo, S. P. Jiang, J. Pu, B. Chi and L. Jian, Carbon-Tolerant Ni-Based Cermet Anodes Modified by Proton Conducting Yttrium- and Ytterbium-Doped Barium Cerates for Direct Methane Solid Oxide Fuel Cells, J. Mater. Chem. A, 2015, 3(43), 21609–21617, 10.1039/C5TA06488K.
- S. Tao and J. T. S. Irvine, Discovery and Characterization of Novel Oxide Anodes for Solid Oxide Fuel Cells, Chem. Rec., 2004, 4(2), 83–95, DOI:10.1002/tcr.20003.
- K. Haga, S. Adachi, Y. Shiratori, K. Itoh and K. Sasaki, Poisoning of SOFC Anodes by Various Fuel Impurities, Solid State Ionics, 2008, 179(27), 1427–1431, DOI:10.1016/j.ssi.2008.02.062.
- K. W. Reeping and R. A. Walker, In Operando Vibrational Raman Studies of Chlorine Contamination in Solid Oxide Fuel Cells, J. Electrochem. Soc., 2015, 162(12), F1310–F1315 CrossRef CAS.
- P. Boldrin, E. Ruiz-Trejo, J. Mermelstein, J. M. Bermúdez Menéndez, T. Ramírez Reina and N. P. Brandon, Strategies for Carbon and Sulfur Tolerant Solid Oxide Fuel Cell Materials, Incorporating Lessons from Heterogeneous Catalysis, Chem. Rev., 2016, 116(22), 13633–13684, DOI:10.1021/acs.chemrev.6b00284.
- P. Blennow, K. K. Hansen, L. R. Wallenberg and M. Mogensen, Electrochemical Characterization and Redox Behavior of Nb-Doped SrTiO3, Solid State Ionics, 2009, 180(1), 63–70, DOI:10.1016/j.ssi.2008.10.011.
- T. Ramos, C. Bernuy-Lopez, B. R. Sudireddy, J. J. Bentzen, W. Zhang, P. S. Jorgensen and L. T. Kuhn, Performance-Microstructure Relations in Ni/CGO Infiltrated Nb-Doped SrTiO3 SOFC Anodes, ECS Trans., 2012, 45(1), 389–402, DOI:10.1149/1.3701330.
- A. M. Hussain, J. V. T. Høgh, W. Zhang and N. Bonanos, Efficient Ceramic Anodes Infiltrated with Binary and Ternary Electrocatalysts for SOFCs Operating at Low Temperatures, J. Power Sources, 2012, 216, 308–313, DOI:10.1016/j.jpowsour.2012.05.036.
- M. C. Verbraeken, T. Ramos, K. Agersted, Q. Ma, C. D. Savaniu, B. R. Sudireddy, J. T. S. Irvine, P. Holtappels and F. Tietz, Modified Strontium Titanates: From Defect Chemistry to SOFC Anodes, RSC Adv., 2015, 5(2), 1168–1180, 10.1039/C4RA09751C.
- Q. Ma, F. Tietz, A. Leonide and E. Ivers-Tiffée, Electrochemical Performances of Solid Oxide Fuel Cells Based on Y-Substituted SrTiO3 Ceramic Anode Materials, J. Power Sources, 2011, 196(17), 7308–7312, DOI:10.1016/j.jpowsour.2010.07.094.
- M. M. Welander, D. B. Drasbæk, M. L. Traulsen, B. R. Sudireddy, P. Holtappels and R. A. Walker, What Does Carbon Tolerant Really Mean? Operando Vibrational Studies of Carbon Accumulation on Novel Solid Oxide Fuel Cell Anodes Prepared by Infiltration, Phys. Chem. Chem. Phys., 2020, 22(17), 9815–9823, 10.1039/D0CP00195C.
- D. B. Drasbæk, M. L. Traulsen, B. R. Sudireddy and P. Holtappels, Understanding the Electrocatalytic Activity of Transition Metal Nanoparticles for Solid Oxide Cell Fuel Electrodes, Electrochim. Acta, 2019, 327, 135004, DOI:10.1016/j.electacta.2019.135004.
- E. Ramírez-Cabrera, A. Atkinson and D. Chadwick, Reactivity of Ceria, Gd- and Nb-Doped Ceria to Methane, Appl. Catal., B, 2002, 36(3), 193–206, DOI:10.1016/S0926-3373(01)00299-5.
- D. B. Drasbæk, M. L. Traulsen, B. R. Sudireddy and P. Holtappels, Combining Transition Metals – An Approach towards High-Performing Coking Tolerant Solid Oxide Fuel Cell Anodes, ECS Trans., 2019, 91(1), 1953–1961, DOI:10.1149/09101.1953ecst.
- T. Ishihara, J. Yan, M. Shinagawa and H. Matsumoto, Ni–Fe Bimetallic Anode as an Active Anode for Intermediate Temperature SOFC Using LaGaO3 Based Electrolyte Film, Electrochim. Acta, 2006, 52(4), 1645–1650, DOI:10.1016/j.electacta.2006.03.103.
- S. Kim, C. Kim, J. H. Lee, J. Shin, T.-H. Lim and G. Kim, Tailoring Ni-Based Catalyst by Alloying with Transition Metals (M=Ni, Co, Cu, and Fe) for Direct Hydrocarbon Utilization of Energy Conversion Devices, Electrochim. Acta, 2017, 225, 399–406, DOI:10.1016/j.electacta.2016.12.178.
- T. Ramos, S. Veltzé, B. R. Sudireddy, P. S. Jørgensen, L. T. Kuhn and P. Holtappels, Effect of Ru/CGO versus Ni/CGO Co-Infiltration on the Performance and Stability of STN-Based SOFCs, Fuel Cells, 2014, 14(6), 1062–1065, DOI:10.1002/fuce.201400013.
- S. McIntosh, J. M. Vohs and R. J. Gorte, Role of Hydrocarbon Deposits in the Enhanced Performance of Direct-Oxidation SOFCs, J. Electrochem. Soc., 2003, 150(4), A470, DOI:10.1149/1.1559064.
- R. J. Gorte, S. Park, J. M. Vohs and C. Wang, Anodes for Direct Oxidation of Dry Hydrocarbons in a Solid-Oxide Fuel Cell, Adv. Mater., 2000, 12(19), 1465–1469, DOI:10.1002/1521-4095(200010)12:19<1465::AID-ADMA1465>3.0.CO;2–9.
- S. McIntosh and R. J. Gorte, Direct Hydrocarbon Solid Oxide Fuel Cells, Chem. Rev., 2004, 104(10), 4845–4866, DOI:10.1021/cr020725g.
- M. D. McIntyre, J. D. Kirtley, D. M. Halat, K. W. Reeping and R. A. Walker, In Situ Spectroscopic Studies of Carbon Formation in SOFCs Operating with Syn-Gas, ECS Trans., 2013, 57(1), 1267–1275, DOI:10.1149/05701.1267ecst.
- J. D. Kirtley, D. A. Steinhurst, J. C. Owrutsky, M. B. Pomfret and R. A. Walker, In Situ Optical Studies of Methane and Simulated Biogas Oxidation on High Temperature Solid Oxide Fuel Cell Anodes, Phys. Chem. Chem. Phys., 2014, 16(1), 227–236, 10.1039/C3CP53278J.
- M. Toebes, Impact of the Structure and Reactivity of Nickel Particles on the Catalytic Growth of Carbon Nanofibers, Catal. Today, 2002, 76(1), 33–42, DOI:10.1016/S0920-5861(02)00209-2.
- M. Kogler, E.-M. Köck, M. Stöger-Pollach, S. Schwarz, T. Schachinger, B. Klötzer and S. Penner, Distinct Carbon Growth Mechanisms on the Components of Ni/YSZ Materials, Mater. Chem. Phys., 2016, 173, 508–515, DOI:10.1016/j.matchemphys.2016.02.046.
- X. Lu, P. W. Faguy and M. Liu, In Situ Potential-Dependent FTIR Emission Spectroscopy A Novel Probe for High Temperature Fuel Cell Interfaces, J. Electrochem. Soc., 2002, 149(10), A1293–A1298, DOI:10.1149/1.1506981.
- M. Liu, M. E. Lynch, K. Blinn, F. M. Alamgir and Y. Choi, Rational SOFC Material Design: New Advances and Tools, Mater. Today, 2011, 14(11), 534–546, DOI:10.1016/S1369-7021(11)70279-6.
- D. J. L. Brett, P. Aguiar, R. Clague, A. J. Marquis, S. Schöttl, R. Simpson and N. P. Brandon, Application of Infrared Thermal Imaging to the Study of Pellet Solid Oxide Fuel Cells, J. Power Sources, 2007, 166(1), 112–119, DOI:10.1016/j.jpowsour.2006.12.098.
- X. Li, J.-P. Lee, K. S. Blinn, D. Chen, S. Yoo, B. Kang, L. A. Bottomley, M. A. El-Sayed, S. Park and M. Liu, High-Temperature Surface Enhanced Raman Spectroscopy for in Situ Study of Solid Oxide Fuel Cell Materials, Energy Environ. Sci., 2013, 7(1), 306–310, 10.1039/C3EE42462F.
- D. B. Drasbæk, M. L. Traulsen, R. A. Walker and P. Holtappels, Testing Novel Nickel and Cobalt Infiltrated STN Anodes for Carbon Tolerance Using In Situ Raman Spectroscopy and Electrochemical Impedance Spectroscopy, Fuel Cells, 2019, 19(4), 484–493, DOI:10.1002/fuce.201800193.
- M. B. Pomfret, C. Stoltz, B. Varughese and R. A. Walker, Structural and Compositional Characterization of Yttria-Stabilized Zirconia: Evidence of Surface-Stabilized, Low-Valence Metal Species, Anal. Chem., 2005, 77(6), 1791–1795, DOI:10.1021/ac048600u.
- M. B. Pomfret, J. C. Owrutsky and R. A. Walker, In Situ Optical Studies of Solid-Oxide Fuel Cells, Annu. Rev. Anal. Chem., 2010, 3(1), 151–174, DOI:10.1146/annurev.anchem.111808.073641.
- C. Graves RAVDAV Data Analysis Software; DTU, 2015 Search PubMed.
- H. Schichlein, A. C. Müller, M. Voigts, A. Krügel and E. Ivers-Tiffée, Deconvolution of Electrochemical Impedance Spectra for the Identification of Electrode Reaction Mechanisms in Solid Oxide Fuel Cells, J. Appl. Electrochem., 2002, 32(8), 875–882, DOI:10.1023/A:1020599525160.
- J. A. Weese, Reliable and Fast Method for the Solution of Fredhol Integral Equations of the First Kind Based on Tikhonov Regularization, Comput. Phys. Commun., 1992, 69(1), 99–111, DOI:10.1016/0010-4655(92)90132-I.
- M. D. McIntyre, J. D. Kirtley, A. Singh, S. Islam, J. M. Hill and R. A. Walker, Comparing in Situ Carbon Tolerances of Sn-Infiltrated and BaO-Infiltrated Ni-YSZ Cermet Anodes in Solid Oxide Fuel Cells Exposed to Methane, J. Phys. Chem. C, 2015, 119(14), 7637–7647, DOI:10.1021/acs.jpcc.5b01345.
- M. M. Welander, M. S. Zachariasen, S. W. Sofie and R. A. Walker, Enhancing Ni-YSZ Anode Resilience to Environmental Redox Stress with Aluminum Titanate Secondary Phases, ACS Appl. Energy Mater., 2018, 1(11), 6295–6302, DOI:10.1021/acsaem.8b01288.
- M. M. Welander, M. S. Zachariasen, S. W. Sofie and R. A. Walker, Mitigating Carbon Formation with Al2TiO5-Enhanced Solid Oxide Fuel Cell Anodes, J. Phys. Chem. C, 2019, 8 Search PubMed.
- A. Mohammed Hussain, J. V. T. Høgh, T. Jacobsen and N. Bonanos, Nickel-Ceria Infiltrated Nb-Doped SrTiO3 for Low Temperature SOFC Anodes and Analysis on Gas Diffusion Impedance, Int. J. Hydrogen Energy, 2012, 37(5), 4309–4318, DOI:10.1016/j.ijhydene.2011.11.087.
- B. P. Setzler and T. F. Fuller, A Physics-Based Impedance Model of Proton Exchange Membrane Fuel Cells Exhibiting Low-Frequency Inductive Loops, J. Electrochem. Soc., 2015, 162(6), F519, DOI:10.1149/2.0361506jes.
- M. Heinzmann, A. Weber and E. Ivers-Tiffée, Advanced Impedance Study of Polymer Electrolyte Membrane Single Cells by Means of Distribution of Relaxation Times, J. Power Sources, 2018, 402, 24–33, DOI:10.1016/j.jpowsour.2018.09.004.
- J. D. Kirtley, M. B. Pomfret, D. A. Steinhurst, J. C. Owrutsky and R. A. Walker, Toward a Working Mechanism of Fuel Oxidation in SOFCs: In Situ Optical Studies of Simulated Biogas and Methane, J. Phys. Chem. C, 2015, 119(23), 12781–12791, DOI:10.1021/jp511304x.
- S. McIntosh, H. He, S.-I. Lee, O. Costa-Nunes, V. V. Krishnan, J. M. Vohs and R. J. Gorte, An Examination of Carbonaceous Deposits in Direct-Utilization SOFC Anodes, J. Electrochem. Soc., 2004, 151(4), A604–A608, DOI:10.1149/1.1650837.
- V. Papaefthimiou, M. Shishkin, D. K. Niakolas, M. Athanasiou, Y. T. Law, R. Arrigo, D. Teschner, M. Hävecker, A. Knop-Gericke, R. Schlögl, T. Ziegler, S. G. Neophytides and S. Zafeiratos, On the Active Surface State of Nickel-Ceria Solid Oxide Fuel Cell Anodes During Methane Electrooxidation, Adv. Energy Mater., 2013, 3(6), 762–769, DOI:10.1002/aenm.201200727.
- Y. Shiratori, T. Ijichi, T. Oshima and K. Sasaki, Internal Reforming SOFC Running on Biogas, Int. J. Hydrogen Energy, 2010, 35(15), 7905–7912, DOI:10.1016/j.ijhydene.2010.05.064.
- E. S. Hecht, G. K. Gupta, H. Zhu, A. M. Dean, R. J. Kee, L. Maier and O. Deutschmann, Methane Reforming Kinetics within a Ni–YSZ SOFC Anode Support, Appl. Catal., A, 2005, 295(1), 40–51, DOI:10.1016/j.apcata.2005.08.003.
- N. R. Raravikar, P. Keblinski, A. M. Rao, M. S. Dresselhaus, L. S. Schadler and P. M. Ajayan, Temperature Dependence of Radial Breathing Mode Raman Frequency of Single-Walled Carbon Nanotubes, Phys. Rev. B: Condens. Matter Mater. Phys., 2002, 66(23), 235424, DOI:10.1103/PhysRevB.66.235424.
- M. S. Dresselhaus, A. Jorio, M. Hofmann, G. Dresselhaus and R. Saito, Perspectives on Carbon Nanotubes and Graphene Raman Spectroscopy, Nano Lett., 2010, 10(3), 751–758, DOI:10.1021/nl904286r.
- J. D. Kirtley, D. M. Halat, M. D. McIntyre, B. C. Eigenbrodt and R. A. Walker, High-Temperature “Spectrochronopotentiometry”: Correlating Electrochemical Performance with In Situ Raman Spectroscopy in Solid Oxide Fuel Cells, Anal. Chem., 2012, 84(22), 9745–9753, DOI:10.1021/ac301504g.
- R. Doshi, C. B. Alcock, N. Gunasekaran and J. J. Carberry, Carbon Monoxide and Methane Oxidation Properties of Oxide Solid Solution Catalysts, J. Catal., 1993, 140(2), 557–563, DOI:10.1006/jcat.1993.1105.
- Z. Gao, L. V. Mogni, E. C. Miller, J. G. Railsback and S. A. Barnett, A Perspective on Low-Temperature Solid Oxide Fuel Cells, Energy Environ. Sci., 2016, 9(5), 1602–1644, 10.1039/C5EE03858H.
- P. Holtappels, J. Bradley, J. T. S. Irvine, A. Kaiser and M. Mogensen, Electrochemical Characterization of Ceramic SOFC Anodes, J. Electrochem. Soc., 2001, 148(8), A923, DOI:10.1149/1.1383774.
- J. Wang, S. R. Bishop, L. Sun, Q. Lu, G. Vardar, R. Bliem, N. Tsvetkov, E. J. Crumlin, J. J. Gallet, F. Bournel, I. Waluyo and B. Yildiz, Threshold catalytic onset of carbon formation on CeO2 during CO2 electrolysis: mechanism and inhibition, J. Mater. Chem. A, 2019, 7, 15233–15243, 10.1039/C9TA03265G.
- M. Konsolakis, Z. Ioakimidis, T. Kraia and G. E. Marnellos, Hydrogen Production by Ethanol Steam Reforming (ESR) over CeO2 Supported Transition Metal (Fe, Co, Ni, Cu) Catalysts: Insight into the Structure-Activity Relationship, Catalysts, 2016, 6(3), 39, DOI:10.3390/catal6030039.
Footnote |
| † Both authors contributed equally to this study. |
| This journal is © The Royal Society of Chemistry 2022 |

