
 Open Access Article
 This Open Access Article is licensed under a Creative Commons Attribution-Non Commercial 3.0 Unported Licence
Fabrication of multi-layered structures for proton conducting ceramic cells
Wendelin
Deibert
*a,
Mariya E.
Ivanova
 *a,
Yuanye
Huang
b,
Rotraut
Merkle
b,
Joachim
Maier
b and
Wilhelm A.
Meulenberg
ac
*a,
Yuanye
Huang
b,
Rotraut
Merkle
b,
Joachim
Maier
b and
Wilhelm A.
Meulenberg
ac
aForschungszentrum Jülich GmbH, Institute of Energy and Climate Research, Materials Synthesis and Processing (IEK-1), D-52425 Jülich, Germany. E-mail: w.deibert@fz-juelich.de; m.ivanova@fz-juelich.de
bMax Planck Institute for Solid State Research, Heisenbergstr. 1, 70569 Stuttgart, Germany
cUniversity of Twente, Faculty of Science and Technology, Inorganic Membranes, P.O. Box 217, 7500 AE Enschede, The Netherlands
First published on 29th September 2021
Abstract
Protonic ceramic fuel cells offer a high potential to produce electrical energy in a very efficient way. The performance of such a device among others is highly dependent on the electrolyte material and its thickness. Therefore, multilayer structures are used to reduce the electrolyte thickness down to 10–20 μm, supported by a much thicker porous anode. In this work sequential tape-casting is used to fabricate half-cells consisting of a BZCY electrolyte and a BZCY/NiO support which also serves as the anode layer. The starting powders are characterised as well as the thermal behaviour of the half-cells during heat treatment. Sintering experiments show that a temperature of T ≥ 1450 °C is needed to achieve the desired microstructure. After that a scale-up approach to a size of the half-cells of about 25 cm2 is shown. The influence of the processing temperature on the microstructure is shown by detailed XRD and SEM studies. The formation of a BaY2NiO5 transient liquid phase during the heat treatment of the cells is clearly demonstrated. Finally, the proton conductivity of the tape-cast cells shows competitive values of σ = 0.003 S cm−1 at 600 °C with the advantage of an industrially proven and up-scalable manufacturing technique.
1. Introduction
Protonic ceramic cells (PCCs) typically use acceptor-doped Ba(Zr,Ce)O3 as electrolytes, which allow for reducing the operation temperature to 400–600 °C owing to an increased ion conductivity at intermediate temperatures.1,2 In fuel cell mode (PCFC) these cells have the advantage of water formation at the cathode, hence no fuel dilution occurs and this leads to high fuel utilization and increased efficiency.3 Potential applications for PCCs can be found in either mobile or stationary fields, e.g. heating and power systems for houses, electric vehicles such as buses, or special cases as power supply for mobile electronic devices,4 or for H2 generation.5 Interestingly, with adjusted catalytic activity at the anode side, a wide range of fuels such as ammonia and different hydrocarbons and alcohols can be used instead of hydrogen.6 In recent years, PCFC performance has been impressively increased to more than 1.2 W cm−2 at 600 °C by improving the processing of the electrolyte layer, choice of cathode materials, interface contacts through development of interlayers.7–10This work reports the sequential tape-casting employed as a processing technology to develop large area protonic ceramic half-cells from a ceramic powder, specially designed via the solid state reactive sintering (SSRS), used for the electrolyte layer and a cermet composite powder for the anode layer. Two key results are shown: (i) the combination of tape casting and reactive sintering is able to produce large-area anode/electrolyte membrane assemblies for a comparably low Ce content of 20 mol%. Accounting the strong dependence of sintering behaviour, grain size and grain boundary electrical characteristics on Ce content, this is not trivial. (ii) The achieved total proton conductivity of the electrolyte is suitable for PCFCs, although was somewhat lower than that measured for respective bulk samples. The solid-state reactive sintering with NiO as a sintering aid was reported to lead to an improved electrolyte processing due to the formation of a transient liquid phase.11,12 However, anode-supported cells reported in these works were typically fabricated using uniaxial pressing or PLD deposition-technique for the electrolyte formation, which as processing routes are not really suitable for large-area ceramic cell manufacturing.10,13–15 This means that the manufacturing of these cells is limited to small areas which cannot be scaled-up easily, or are limited to a certain thickness, which specifically is the case of uniaxial pressing.
Tape-casting is an industrially proven manufacturing method for large area ceramic sheets. This method was employed to fabricate supporting anode layer NiO–BaZr0.1Ce0.8Y0.1O3 (BZCY), as reported in ref. 16, while the electrolyte layer was then applied either by screen printing on the pre-sintered substrate or on a raw substrate tape,17 or by suspension spraying.18 Applying different fabrication techniques for one component usually leads to increased complexity of the process and increased cost, which is detrimental for the potential commercial application in the future.
Tape-casting of asymmetric anode/electrolyte BaZr0.8Y0.2O3 (BZY) structures using SSRS for the electrolyte layer is reported in ref. 19. However, in this work very high NiO additions of 4 wt% had to be used to achieve full densification, and the sample diameter was only 2 cm. In ref. 20 a very high Ce content of 70 mol% was used (critical with respect to long-term stability, see below) many tape-cast layers were then laminated (unpractical for upscaling), and the cell size was only 3.3 cm2, which limits the applicability of such an approach. In ref. 5 SrZr0.5Ce0.4Y0.1O3−δ is used in the anode substrate, which promotes the densification of the BZCY electrolyte layer by its high sintering shrinkage. However, one has to keep in mind that adding another material into the anode–electrolyte assembly increases the complexity of the system (e.g. by an increased thermal expansion coefficient of strontium cerates21).
The cation composition is decisive for the performance of the components. Several groups have investigated partial Ce substitution in BZY, because increasing the Ce content facilitates the sintering and also leads to higher proton retention at elevated temperatures. However, while BaZrO3 is thermodynamically stable against decomposition to BaCO3, Ba(OH)2, (Zr,Y)O2−δ in H2O and CO2-containing atmospheres, BaCeO3 is less chamically stable (see e.g. discussion in ref. 1 and 2). In the present study the ceria content was limited to 20 mol% to ensure stability of the electrolyte layer against hydroxide or carbonate formation,1,22 in contrast to much higher ceria contents used e.g. in ref. 16 and 17. Since a compromise between processability, stability, and resulting conductivity needs to be achieved, we find it important to explore the selected combination of manufacturing routes (SSRS, tape casting and co-firing) also for the processing of a material with a relatively low Ce content of 20 mol% compared to what reported previously. A concentration of Y acceptor dopant fixed to 17.5 mol% was chosen for both the anode and the electrolyte layers, while the amount of NiO additive, used to enhance the sintering of the electrolyte layer, was 0.5 wt%.
2. Experimental
Y-doped Ba(Zr,Ce)O3 (BZCY) perovskite powders with a nominal composition Ba1.015Zr0.625Ce0.2Y0.175O3−δ (BZCY) used in the tape-casting processing were synthesized from stoichiometric mixtures of BaCO3, ZrO2, CeO2 and Y2O3. The solid-state reactive sintering process (SSRS)12 yields enhanced sintering behaviour, in which the intimately mixed and ground precursors are used to form the final functional material. In the present study, a combination of the SSRS and pre-calcination was applied for the electrolyte layer to decrease the otherwise huge volume shrinkage typical for the SSRS process. The powder for the electrolyte layer with 20 mol% Ce and 17.5 mol% Y (BZCY-EL) was prepared by 1 h dry ball milling (vibration zirconia ball mill with one 5 cm diameter zirconia ball, Friatec) of the precursor mixture BaCO3 (Alfa Aesar), ZrO2 (Tosoh TZ0), CeO2 (Sigma Aldrich), and Y2O3 (Alfa Aesar), calcination for 1 h at 1100 °C in air (heating/cooling rate 300 K min−1), and then wet milling of this powder together with 0.5 wt% NiO (Alfa Aesar, 325 mesh) for 24 h (in i-propanol, zirconia jar and balls, Fritsch Pulverisette 5). The BZCY perovskite for the substrate layer with 20 mol% Ce and 17.5 mol% Y (BZCY-SU) was prepared by solid state reaction from BaCO3 (Alfa Aesar), Zr0.83Y0.17O1.915 (Tosoh TZ10), CeO2 (Sigma Aldrich), and Y2O3 (Alfa Aesar) by 1 h dry ball milling, calcination for 8 h at 1200 °C in air, followed by twice repeated dry ball milling and calcination at 1300 °C. For both powders a nominal Ba excess of 1.5 mol% was added to compensate possible Ba evaporation during the thermal treatments (a larger excess of 3% decreases the mechanical stability of sintered pellets).The chemical composition of the powders was determined by ICP-OES using an iCAP 7600 measurement device from Thermo Fisher Scientific.
For the tape-casting a suspension consisting of the ceramic powder with several (organic) additives and solvent was prepared and spread over a polymeric foil. For the slurry preparation, as a solvent ethanol and methyl–ethyl–ketone mixture in 1![[thin space (1/6-em)]](https://www.rsc.org/images/entities/char_2009.gif) :2 ratio was used. The binder system consisted of PVB-98 as the binder and Solusolv S2075 combined with PEG 400 as plasticisers. A dispersing agent Nuosperse FX 9086 was added to better separate the single powder particles in the slurry. For the substrate layers a cermet consisting of NiO and BZCY was prepared by mixing the two powders in a weight ratio of 60:40. For sintering experiments, single electrolyte and substrate layers as well as electrolyte–substrate bi-layers were fabricated by tape-casting. The tape thickness was controlled by means of different parameters, especially the blade gap between the polymer foil and the so-called doctor blade. The tape-casting experiments were performed using a micro tape-casting machine “KAROcast 300-7” by KMS Automation GmbH, Dresden Germany. More details about the used equipment and the slurry preparation can be found in ref. 23.
:2 ratio was used. The binder system consisted of PVB-98 as the binder and Solusolv S2075 combined with PEG 400 as plasticisers. A dispersing agent Nuosperse FX 9086 was added to better separate the single powder particles in the slurry. For the substrate layers a cermet consisting of NiO and BZCY was prepared by mixing the two powders in a weight ratio of 60:40. For sintering experiments, single electrolyte and substrate layers as well as electrolyte–substrate bi-layers were fabricated by tape-casting. The tape thickness was controlled by means of different parameters, especially the blade gap between the polymer foil and the so-called doctor blade. The tape-casting experiments were performed using a micro tape-casting machine “KAROcast 300-7” by KMS Automation GmbH, Dresden Germany. More details about the used equipment and the slurry preparation can be found in ref. 23.
Aiming to increase the supporting layer thickness, the green electrolyte–substrate tape assembly was laminated with a single substrate tape using a warm press by P/O Weber. Lamination of tape layers was performed by applying pressure at 80 °C until sufficient connection between the individual layers was obtained. Cross sections of the co-fired laminated structures were microscopically controlled to ensure good lamination quality with sufficient adherence of the layers.
For estimation of the green tape's shrinkage an optical dilatometer “TOMMI plus” by Fraunhofer ISC Würzburg, Germany was used. The instrument consists of a furnace with quartz glass windows, a light source and a camera. Images of the sample silhouette were continuously recorded during the heat treatment. By means of smart selection of the sample geometry, the shrinkage was determined. More details can also be found in ref. 23.
The thermal expansion of the electrolyte and the substrate material was evaluated by means of dilatometry performed with a NETZSCH DIL 402C dilatometer on a fully sintered specimens with a heating rate of 5 K min−1 in air.
Thermogravimetry was carried out in air to characterize the burn out behaviour of organic additives from green tapes. For this purpose NETZSCH STA 449F3 instrument was used.
The sintering of green tapes was performed in a muffle furnace in static air. Samples were placed on a MgO base plate (anode layer downwards) without a cover. For comparison, some small sample pieces were also sintered under a MgO cover, or under a MgO cover with some BaZrO3/BaCO3 sacrificial powder placed nearby, to decrease potential BaO losses by evaporation.
Small pieces of the supported solid electrolyte assemblies (typically 5 × 5 mm2) were used for the electrical impedance measurements (Novocontrol Alpha A, AC amplitude 0.02 V, frequency 106–0.1 Hz). The samples were coated on both sides with Ag paste (Leitsilber) and contacted with Pt mesh current collectors in pseudo-four-point mode to cancel the Pt wire resistances. The conductivity was measured in heating as well as cooling in humid 3% H2 in Ar (20 mbar water). Owing to the open porosity in the reduced anode layer and the low thickness (ca. 10 μm) of the dense electrolyte layer, the equilibration of the hydration reaction was fast.
3. Results and discussion
3.1. Powder characterization and composition
The starting powder plays a key role in ceramic processing and strongly influences the manufacturing and sintering properties. A target composition of Ba1.015Zr0.625Ce0.2Y0.175O3−δ was chosen for both layers. For the electrolyte layer, SSRS of BZCY with addition of a small amount of NiO is applied.11,12 The original SSRS method directly sinters the ball-milled BaCO3–ZrO2–CeO2–Y2O3–NiO powder mixture. We have modified it by first calcining the powder mixture at 1100 °C, which leads to a partial decomposition of the BaCO3 (XRD in Fig. 1) before wet milling in order to decrease the volume reduction in the sintering step. This treatment still leaves a comparably high specific surface area of 3.7 m2 g−1 to have a sufficient driving force for the densification during the sintering process. The particle size and specific surface areas for all powders used in this work are summarised in Table 1. In this initial calcination step two perovskite phases are formed, a Ce-rich composition with larger lattice parameter, and a Zr-rich composition, as shown in Fig. 1.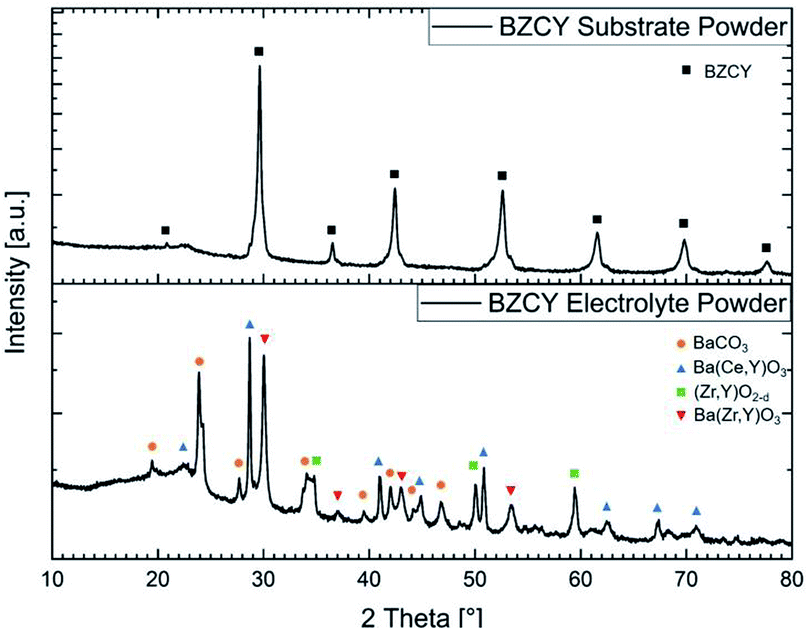 | ||
| Fig. 1 X-ray diffractograms of the BZCY substrate and electrolyte powders as prepared at 1300 °C and 1100 °C, respectively. | ||
| Notation | Remark | Calcination temperature [°C] | D 50 [μm] | A spec [m2 g−1] |
|---|---|---|---|---|
| BZCY-EL | Calcined | 1100 | 0.6 | 3.7 |
| BZCY-SU | Calcined | 1300 | 0.7 | 1.9 |
| NiO | — | — | 0.7 | 2.4 |
For the anode support layer, the final microstructure is intended to be porous (with most of the porosity arising from the reduction of NiO to Ni) and a preferable pore size in the micrometre range. Thus, for the anode layer, the perovskite structure of the BZCY was largely formed before the sintering step, by classical solid-state reaction with repeated calcination at 1300 °C and dry ball milling (Fig. 1). This procedure yields a specific surface area of 1.9 m2 g−1. The properties of the commercially available NiO (Vogler) fit very well to the BZCY-SU powder without any additional treatment (Table 1).
In the present study we use a Y concentration of 17.5 mol% for the anode, as well as for the electrolyte layer. In principle, apart from the small region in vicinity to the electrolyte, which is electrochemically active for hydrogen oxidation, most of the anode layer would not require proton conductivity. The use of Ba(Zr,Ce)O3 without acceptor dopant for the support layer on which thin Y-doped anode functional layer is formed, may be considered promising because it would diminish volume changes of the whole cell caused by hydration/dehydration. However, preliminary experiments showed that in order to form the transient liquid phase which facilitates the sintering process, certain amount of acceptor dopant is required in the pre-formed Ba(Zr,Ce)O3 perovskite used to manufacture the anode support layer. NiO plays also a very important role as a sintering additive in the electrolyte layer. It was found that higher concentrations of NiO up to 1 wt% are beneficial for the sintering properties and the grain growth but have a negative effect on the protonation and conductivity of the material, see e.g.24–27 Therefore, a comparably low NiO concentration of 0.5 wt% (corresponding to about 2 mol% relative to the sum of B-site cations) was chosen for the present work, which suffices for efficient sintering.
In literature there are reports on BZCY electrolyte layers which were screen-printed or drop-cast on NiO/BZCY substrates without deliberate NiO addition into the electrolyte layer. However, it is expected that during sintering some NiO from the support will diffuse into the electrolyte layer and activate the SSRS process there.7,9,25,28 In order to have well-defined initial conditions, we prefer to add a controlled amount of NiO directly into the powder used for the electrolyte layer processing. Then it is available for the formation of a transient liquid phase11,12,24 together with BaCO3, ZrO2, CeO2, Y2O3, which are still unreacted in the early stage of sintering.
An ICP-OES analysis was performed to verify the actual compositions of both perovskite BZCY-SU and BZCY-EL powders. The result is listed in Table 2.
Small deviations from the nominal composition can be attributed to weighting errors and also to the fact that ZrO2 always contains small amounts of HfO2, which is not attributed to Zr in the ICP-OES measurement.
3.2. Tape casting
Single electrolyte and substrate layers, as well as electrolyte–support bi-layer assemblies were prepared by tape-casting.Important casting parameters are listed in Table 3. For the single electrolyte layers, a higher blade gap was used compared to that used for casting the electrolyte layers in the bi-layer assemblies. This was necessary to ensure sufficient mechanical stability of the single layers in order to be subjected to further tests (further experiments are not manageable with 30 μm thin single layers).
| Notation | Casting speed [mm s−1] | Blade gap [μm] | Green thickness [μm] |
|---|---|---|---|
| BZCY-electrolyte single layer | 5 | 300 | 110 |
| BZCY-electrolyte in bi-layer | 5 | 80 | 30 |
| BZCY/NiO-substrate layer | 2.5 | 800 | 300 |
The electrolyte–substrate assemblies were fabricated by means of casting sequentially the electrolyte and after drying for 6 h, casting the substrate layer on top. After the complete tape dried, a uniform and defect free tape was obtained as shown in Fig. 2.
 | ||
| Fig. 2 Sequentially cast green tapes, consisting of a thin BZCY-solid electrolyte layer (bottom) and a thick NiO/BZCY-substrate layer (top). | ||
3.3. Lamination
Lamination technique was used to increase the substrate thicknesses. A schematic of the process is depicted in Fig. 3. The tapes were laminated at 80 °C with 8–12 MPa pressure applied for 60 s. Substrate assemblies with good adhesion of the layers and no delamination after sintering were obtained with 9 MPa lamination pressure. The microstructure in the connection zone of the substrate layers is not influenced significantly as shown in Section 3.5.2.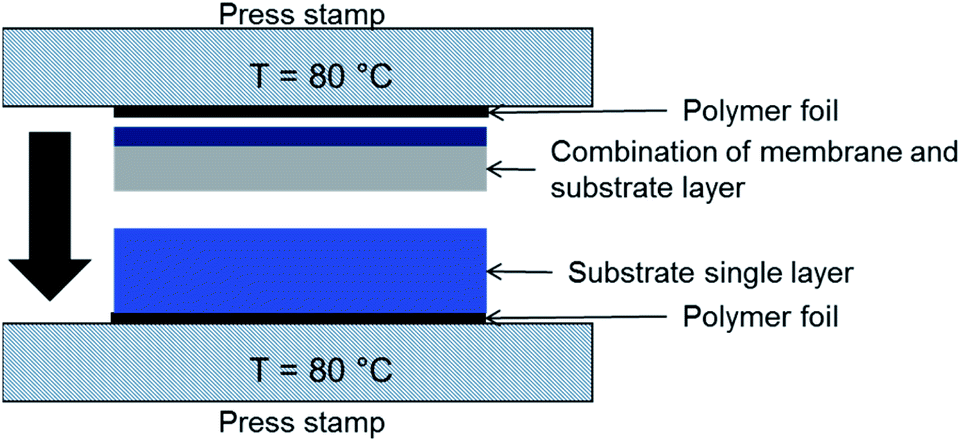 | ||
| Fig. 3 Schematic illustration of the tool used for lamination of green tapes, as shown here NiO/BZCY-SU substrate layer (bottom) and NiO/BZCY-BZCY-EL assembly layer (top). | ||
3.4. Thermal treatment
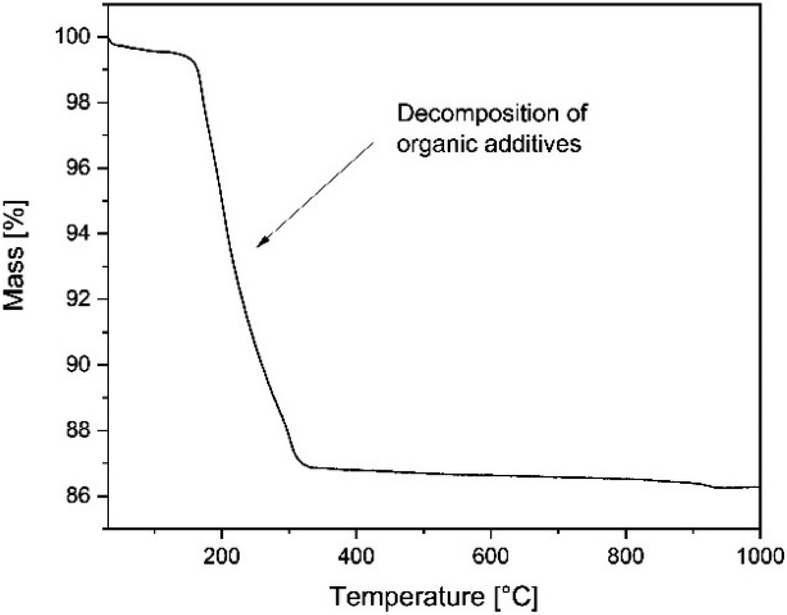 | ||
| Fig. 4 Thermogravimetric measurement of NiO/BZCY green tapes in air, heating rate of 5 K min−1. | ||
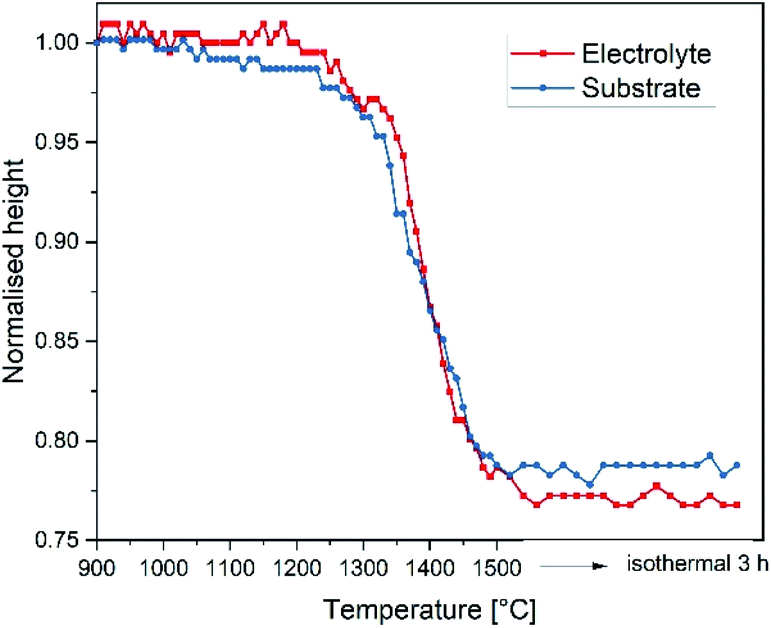 | ||
| Fig. 5 Shrinkage of electrolyte and substrate single tapes determined by optical dilatometry, heating rate of 2 K min−1. | ||
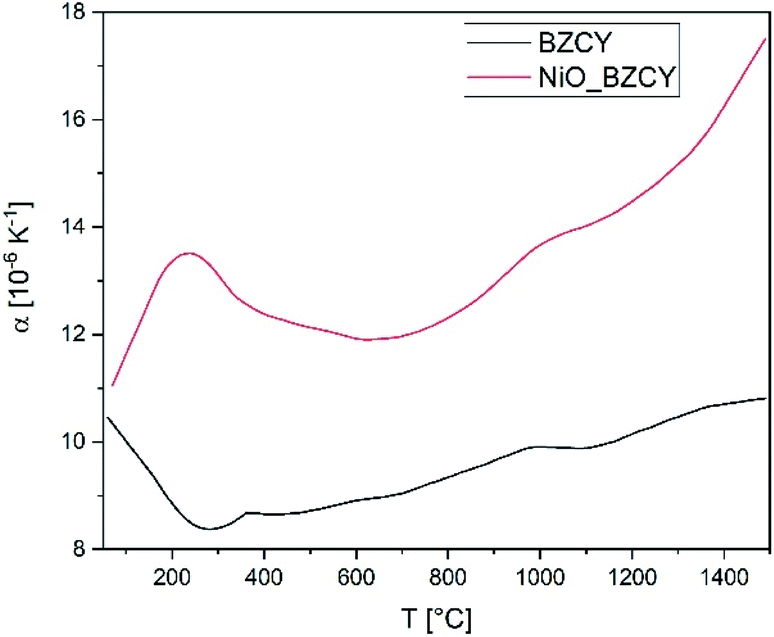 | ||
| Fig. 6 Coefficient of thermal expansion α of BZCY-EL and NiO/BZCY-SU in the temperature range from room temperature to 1500 °C. | ||
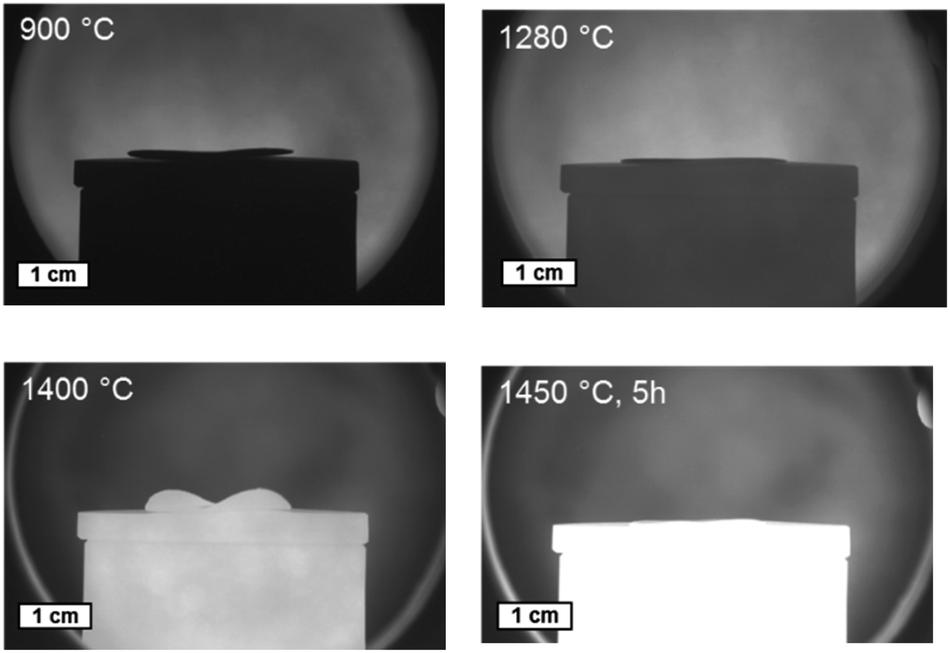 | ||
| Fig. 7 Sintering behaviour of a bi-layer assembly of BZCY-NiO/BZCY at different temperatures captured in an optical dilatometer. | ||
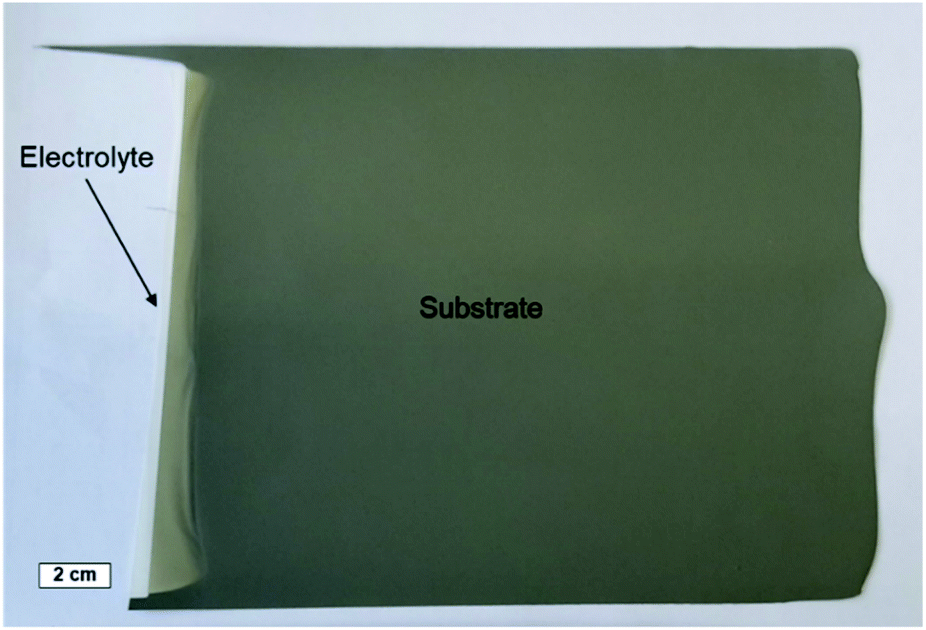
Combining the knowledge collected about the sample behaviour as a function of the heat treatment, half-cells were processed and co-fired to increased area of about 25 cm2. Fig. 8a depicts the thermal program applied in the cell scale-up and Fig. 8b shows an image of a sintered half-cell.
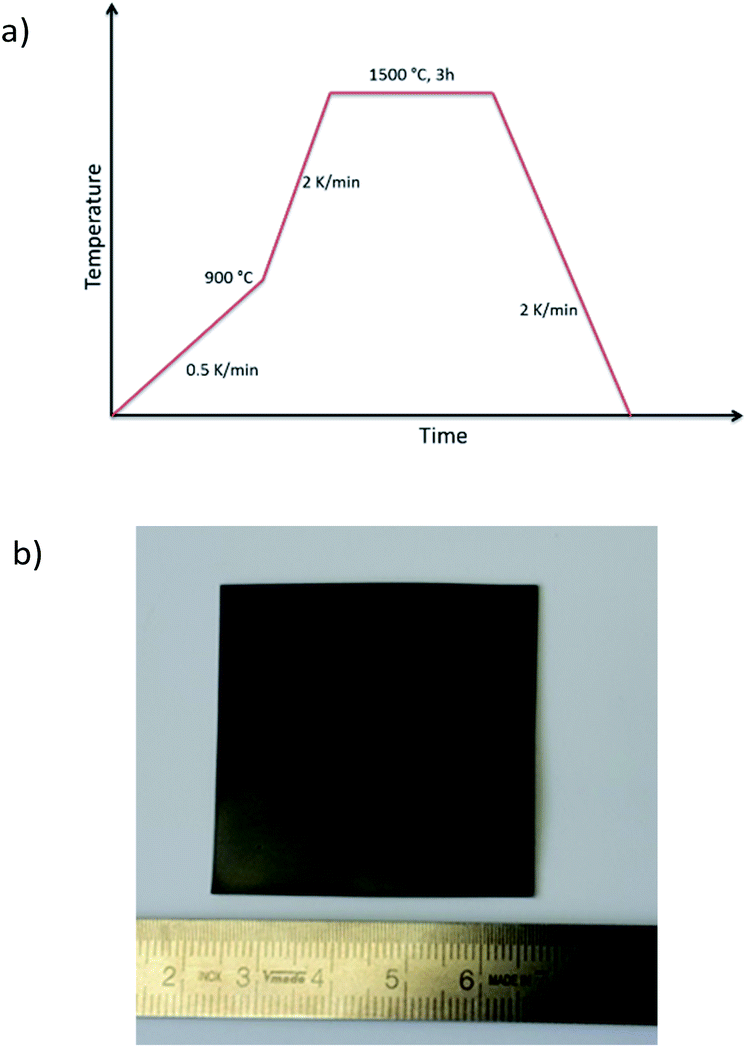 | ||
| Fig. 8 (a) Temperature program for the scale-up of a cell consisting of BZCY-NiO/BZCY and (b) half-cell in final sintered state. | ||
3.5. Characterisation of sintered half-cells
:40 ratio of these two phases, respectively. Analysis of the electrolyte layer shows a quite larger amount of NiO (around 2 wt%) compared to the nominally added 0.5 wt% to the starting raw powder mixture (Table 2). We assume that this higher content of Ni can be explained by the formation and dissociation of the BaY2NiO5 transient liquid phase. Since the X-ray penetration depth for this material is estimated to be around 5–10 μm, and the electrolyte thickness is larger than this, it is certain that the substrate layer composition does not affect this observation. The formation of Ni-rich areas in the electrolyte can potentially be the origin of cracks and electronic leakage.NiO to Ni reduction (during operation) is usually associated with a volume change and it could also lead to short circuits when Ni particles become interconnected throughout the electrolyte layer. However, in the present case there are no indications of crack formation or other undesired effects regarding to the integrity of the final electrolyte layer. Furthermore, based on the XRD analysis, a considerable amount (about 9 wt%) of a secondary phase with the space group Ia![[3 with combining macron]](https://www.rsc.org/images/entities/char_0033_0304.gif) and a lattice parameter of a = 10.65(2) Å was found. Pristine Y2O3 has a slightly lower lattice parameter of a = 10.60 Å, thus suggesting most probably formation of a Y rich phase with some additions of Zr and Ce. This assumption is supported by the EDX measurements in the following Section 3.5.2, where also the formation of the Y-containing phase will be discussed in more detail. BZCY phase in the electrolyte and in the substrate shows some variation considering the lattice parameter (Table 4). This observation can be associated with the difference in composition as listed in Table 2 but also with the slight Ni excess provided by the support layer.
and a lattice parameter of a = 10.65(2) Å was found. Pristine Y2O3 has a slightly lower lattice parameter of a = 10.60 Å, thus suggesting most probably formation of a Y rich phase with some additions of Zr and Ce. This assumption is supported by the EDX measurements in the following Section 3.5.2, where also the formation of the Y-containing phase will be discussed in more detail. BZCY phase in the electrolyte and in the substrate shows some variation considering the lattice parameter (Table 4). This observation can be associated with the difference in composition as listed in Table 2 but also with the slight Ni excess provided by the support layer.
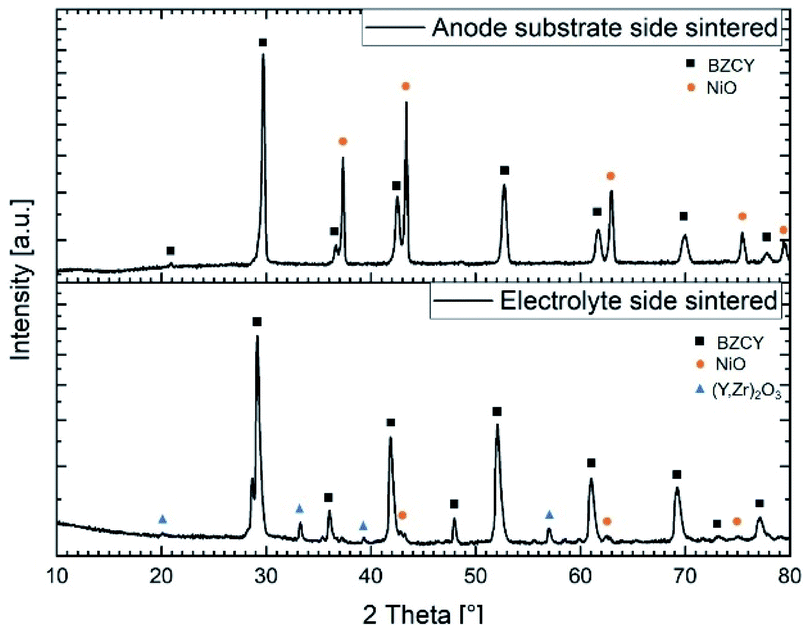 | ||
| Fig. 9 X-ray diffraction patterns recorded on both sides of a half-cell sintered at 1500 °C for 6 h. | ||
| Phase | Lattice parameter [Å] | Comment |
|---|---|---|
| BZCY-SU | a = 4.260(6) | Calcined at 1300 °C |
| BZCY-SU sintered | a = 4.256(3) | Sintering temperature 1500 °C for 6 h |
| BZCY-SU reduced | a = 4.256(4) | Reduced in Ar/H2 at 900 °C for 5 h |
| BZCY-EL sintered | a = 4.270(6) | Sintering temperature 1500 °C for 6 h |
| BZCY-EL reduced | a = 4.251(1) | Reduced in Ar/H2 at 900 °C for 5 h |
| YZrO-EL sintered | a = 10.65(2) | Sintering temperature 1500 °C for 6 h |
Fig. 10 depicts the X-ray diffraction patters recorded on both sides of a sintered half-cell after reduction in H2/Ar. Both in the substrate and in the electrolyte layer Ni metallic and Y rich oxide phase were detected besides the BZCY main perovskite phase.
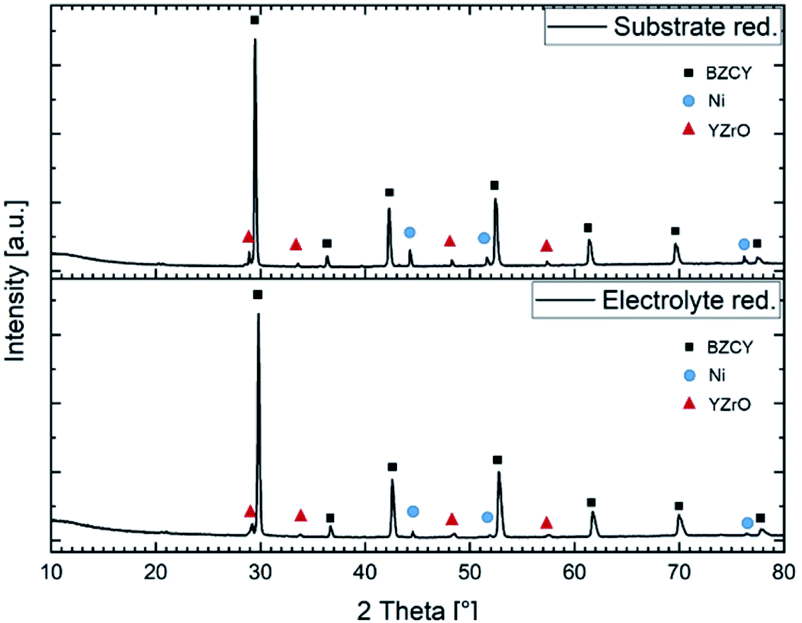 | ||
| Fig. 10 X-ray diffractograms of a reduced anode substrate and a reduced electrolyte layer sintered at 1500 °C for 6 h. | ||
Literature data for Ni-free BZC20Y17.5 sintered by SPS and annealed at 1500 °C shows a lattice parameter a = 4.280 Å.32 Ceramic BZC20Y17.5 with 0.5 wt% NiO and a = 4.263 Å is roughly comparable to the lattice parameter of BZCY-EL obtained in this work.32 It is typical for SSRS samples that they have a smaller lattice parameter than Ni-free samples, see discussion in ref. 24, the more Ni the lower the lattice parameter. This also fits to the BZCY-SU having a smaller lattice parameter than BZCY-EL because the anode has huge NiO-excess. It is typically observed that samples treated below about 1400 °C have a too small lattice parameter (BZCY-SU 4.26 instead of expected 4.28 Å), see e.g. also33 for BZY. It probably means that not all Y is properly incorporated as dopant on the B site (even if no secondary phase containing the remaining Y is visible).
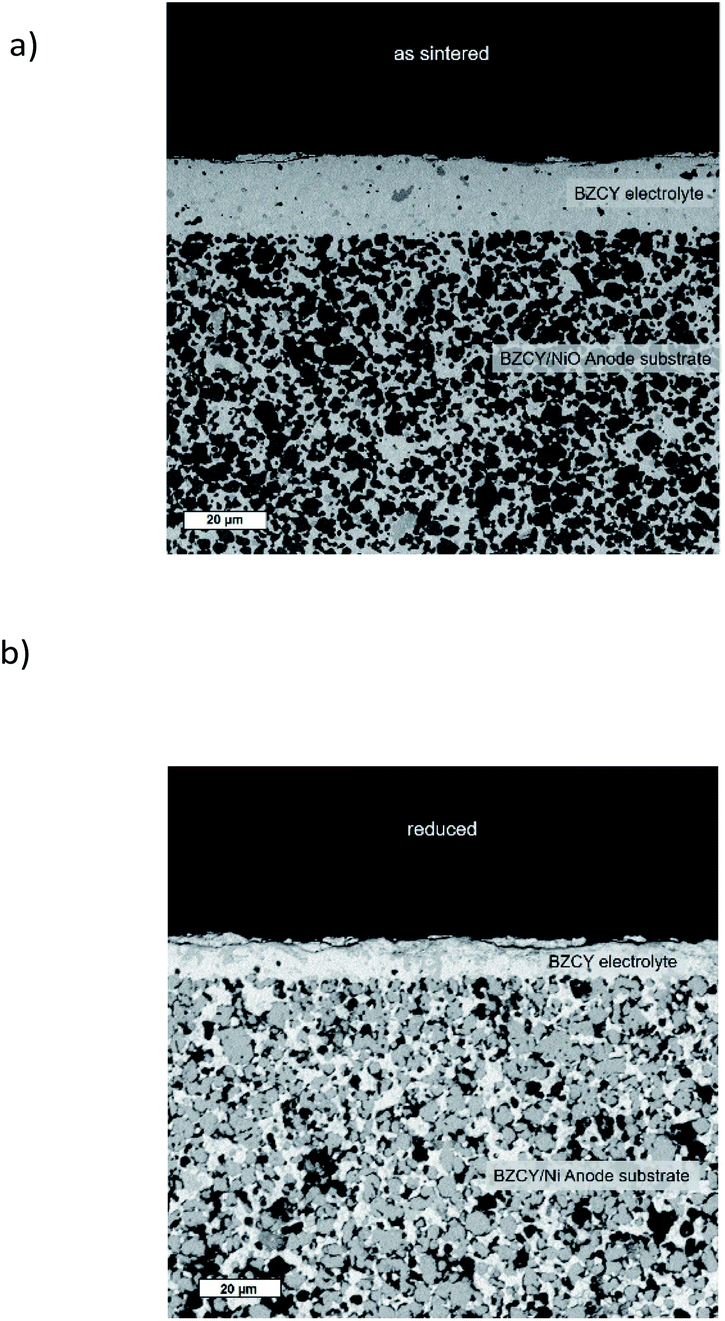 | ||
| Fig. 11 SEM cross sections of final sintered BZCY–NiO/BZCY bi-layer assemblies at 1500 °C for 6 h. (a) Unreduced, (b) reduced in Ar/H2 at 900 °C. | ||
Detailed microstructural analysis of the electrolyte layer, including elemental mapping, was performed for reduced sintered specimen (1500 °C/6h), as shown in Fig. 12. The electrolyte layer has a constant thickness of around 10 μm, also over an extended lateral range (Fig. 12a). The cross-section SEM images also show some residual closed porosity in this layer. Furthermore, a secondary phase was found (medium grey grains in Fig. 12b). EDX line scans in (Fig. 12c and d) were performed as indicated with the two red arrows in Fig. 12b. The EDX line scans in Fig. 12d clearly show that the secondary phase (gray feature in the middle of line scan 2) is Y rich, while Ba and Ce are depleted. Since the EDX signal also covers parts of the surrounding material, it is not completely clear if it is pure Y2O3 or a Y, Zr mixed oxide. As indicated by the XRD analysis in Fig. 10, there is an oxide secondary phase formed with slightly larger lattice parameter than Y2O3, which is in line with the observed by SEM Y-rich mixed oxide areas.
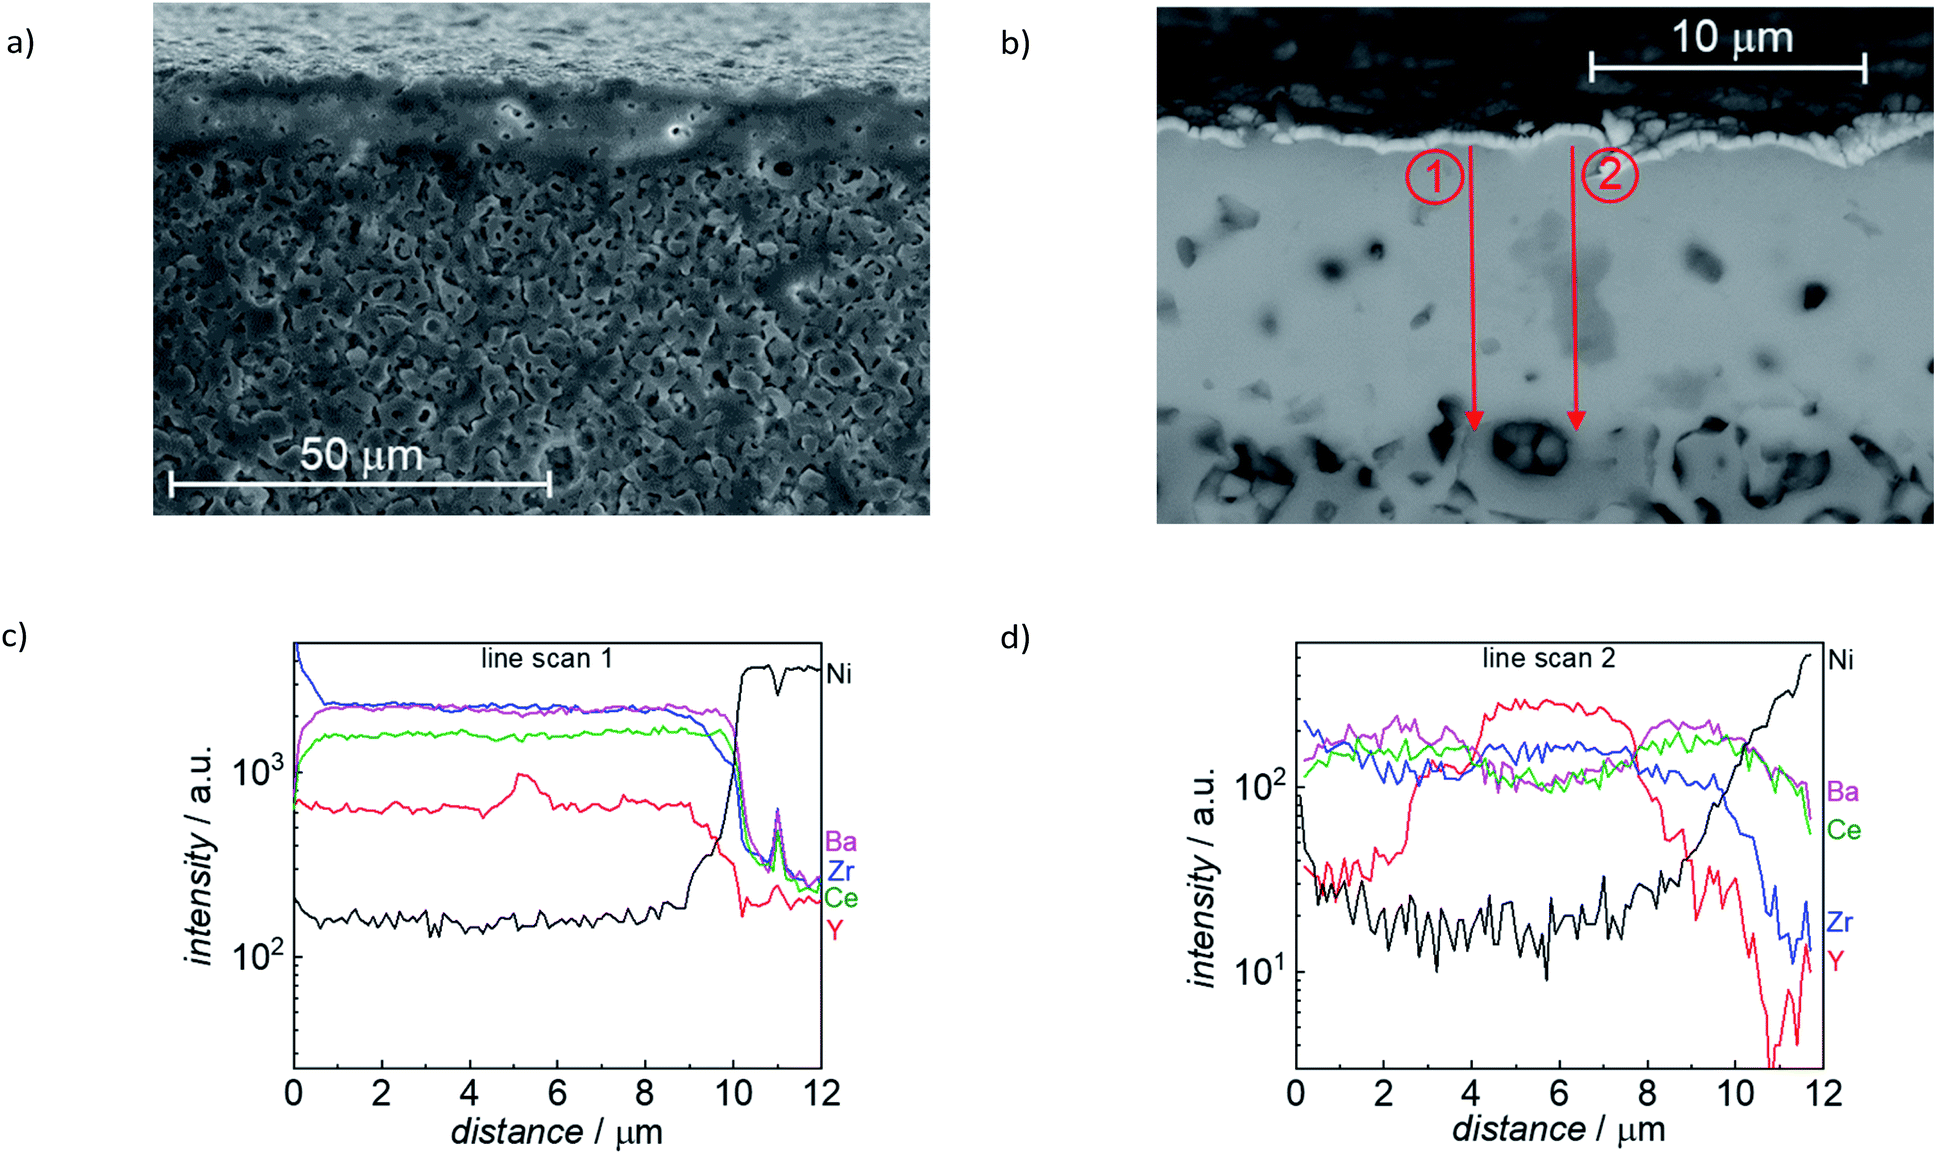 | ||
| Fig. 12 (a) and (b) SEM image of FIB cross section of a reduced sample (sintered 6 h at 1500 °C, reduced at 800 °C). (c) and (d) EDX line profiles measured along the red arrows. | ||
For specimens sintered at 1550 °C, SEM images of FIB cross sections show the absence of pores in the BZCY layer. The higher sintering temperature also promotes strongly increased amount of the Y2O3 secondary phase with grains that occasionally penetrate the whole electrolyte layer. This Y2O3 formation is detrimental as in humid conditions it may transform to Y(OH)3, and also because the amount of Y segregated into this secondary phase is missing in the BZCY, which will decrease the proton uptake. 1550 °C is a suitable sintering temperature for ceramic samples of identical cation composition,34 but apparently it is too high for a BZCY electrolyte layer (which is inevitably more susceptible to BaO loss), and in combination with an extremely Ni-rich anode layer as support (which might modify the transient liquid phase formation).
The top-view optical and SEM images of the electrolyte side are collected in Fig. 13. The optical images for samples sintered at ≤1500 °C show small dark features. They represent dips rather than extra particles on top of a smooth surface; their concentration decreases with increasing T but is hardly affected by the soaking time. At 1520 °C and above, large structures with irregular shape and rounded edge appear, with increasing concentration at higher T and/or longer soaking time. The SEM images confirm these trends. They show that the grain size increases from ≈1 μm at 1450 °C to ≈3 μm at 1550 °C, while an increase of soaking time from 1 h to 6 h has less influence. For selected samples, EDX measurements were performed, they indicate that the large particles appearing at high sintering temperatures are high in Y and O. For samples sintered for 1 h at T ≤ 1480 °C, occasionally particles with strongly increased Ni, Y content and some Ba are observed, which can tentatively be assigned to a BaY2NiO5-related phase.
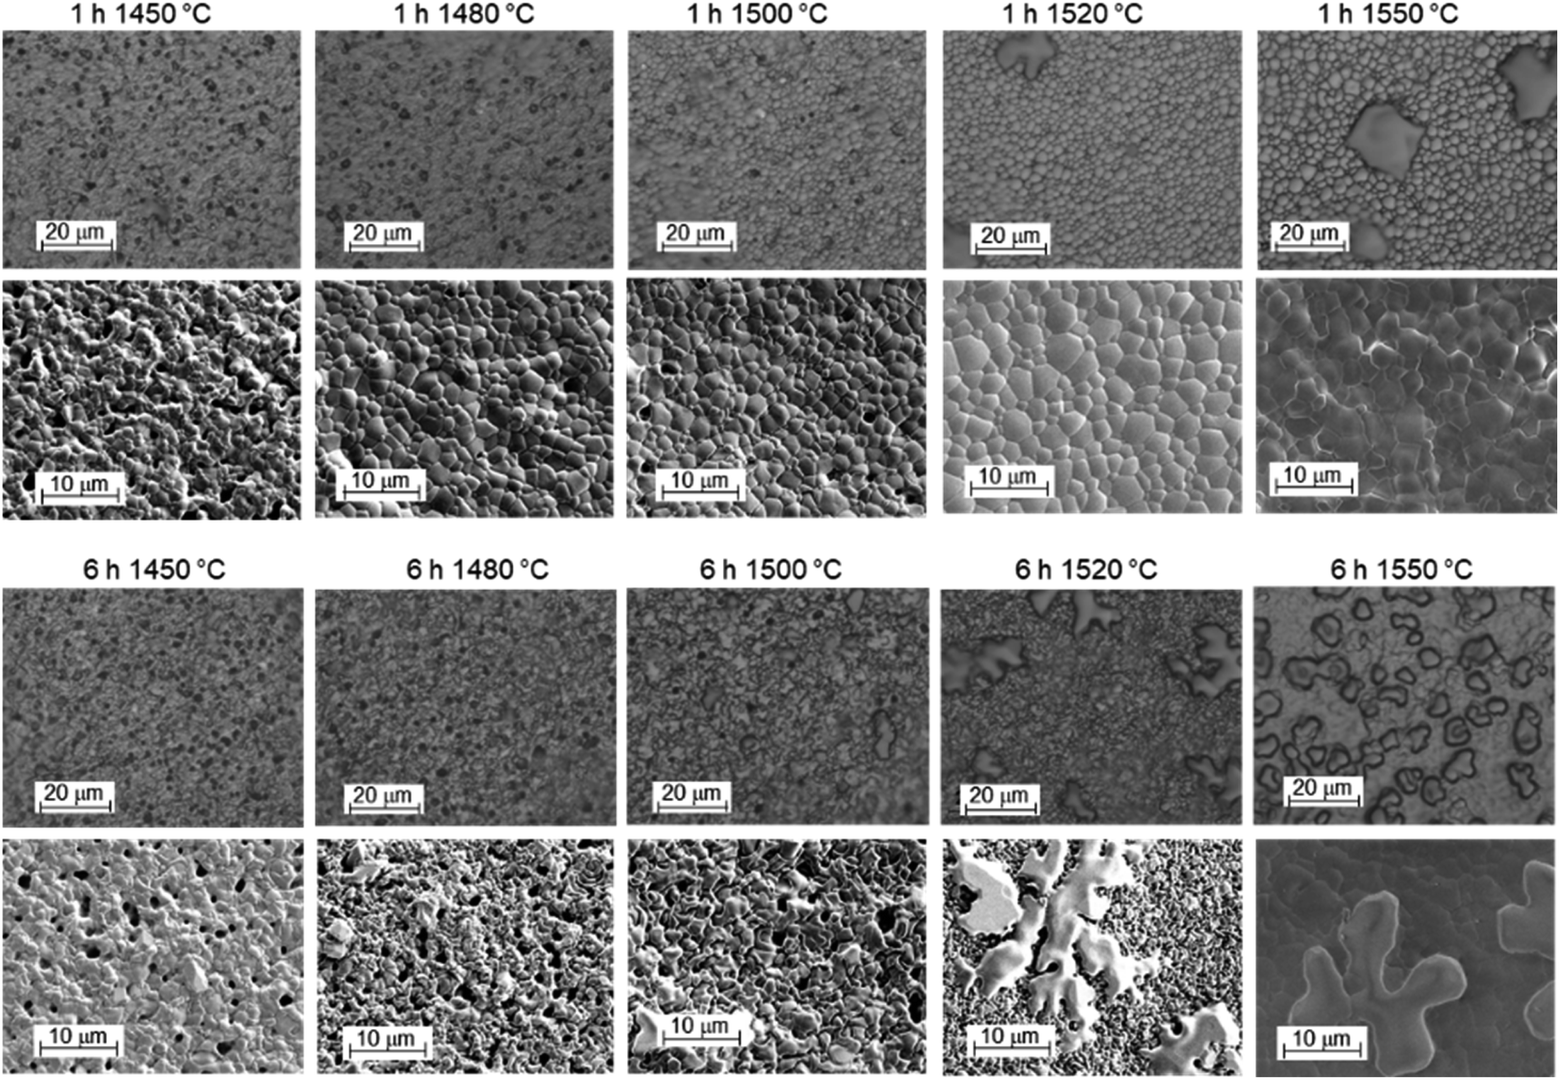 | ||
| Fig. 13 Top-view optical microscopy and SEM images of the electrolyte side of BZCY assemblies after sintering for 1 h (top row) or 6 h (bottom row) at different temperatures. | ||
The XRD results are presented in Fig. 14, which shows pronounced differences with time and temperature. For a soaking time of 1 h, the lattice parameter moderately increases with sintering temperature (Fig. 14a). This is in line with literature reports, which indicate that an elevated temperature is required for full Y incorporation on the B site of BaZrO3.33 In contrast, the lattice parameter of samples with 6 h soaking time decreases with increasing T. This goes in parallel with a strongly increasing Y2O3 fraction (Fig. 14b and c; exemplary diffractogram in Fig. 14e) and the observation of large Y2O3 grains in optical and SEM images. The precipitation of Y2O3 as second phase is a typical phenomenon when Ba(Zr,Y)O3 perovskites suffer from BaO loss, as this can restore the balance of A- and B-site cations and avoid the presence of energetically unfavourable cation vacancies.
 | ||
| Fig. 14 XRD results for the assemblies of Fig. 13. (a) Lattice parameter of the BZCY perovskite, (b) fraction of Y2O3 and BaY2NiO5 second phases, (c) relation of BZCY lattice parameter and Y2O3 fraction, (d) full width at half maximum of the (110) peak of the BZCY, (e) diffractograms for samples sintered for 1 h and 6 h at 1480 °C with Y2O3 and BaY2NiO5 peaks indicated. | ||
It is important to note that the BaO sink that is acting here is not evaporation into the gas phase, as one might initially guess based on the large surface to volume ratio of the BZCY layers. Samples sintered under a MgO cover, or under a cover with BaZrO3/BaCO3 powder placed nearby to decrease potential BaO loss via the gas phase do not show systematic differences in the appearance of secondary phases in optical/SEM images or XRD. Thus, the BaO sink is the formation of (Ba,Ni,Y)Ox transient liquid phases, which extracts Ba from the perovskite.24 The fact that the anode layer is very NiO-rich makes it a very effective BaO sink. The large size of the Y2O3 grains and their peculiar shape strongly suggests they were formed by passing through a liquid state. Since the melting point of pure Y2O3 is above 2400 °C, these particles are probably remainders of a (Ba,Ni,Y)Ox transient liquid phase. Their growing concentration with soaking time indicates there is a strong interaction of the 10 μm thin electrolyte layer with the much thicker NiO-rich anode support (the small 0.5 wt% NiO addition in the electrolyte layer is too low to form such large amounts of (Ba,Ni,Y)Ox transient liquid phase). The liquid phase formation in the anode layer appears to increase with temperature (samples sintered at 1550 °C have a high tendency to stick to the setter plate), and correspondingly also the BaO extraction from the electrolyte layer becomes larger. Such detrimental interactions are expected even if no NiO is added into the electrolyte layer.
XRD for samples with 1 h soaking time show small but well-perceptible peaks of BaY2NiO5 at T ≤ 1480 °C (green symbols in Fig. 14b, diffractogram shown in Fig. 14e), in line with the observation of some Ni,Y,Ba-rich particles by SEM-EDX. The BaY2NiO5 peaks vanish for longer soaking time, which emphasizes the transient character of the low-melting BaY2NiO5 phase.
For samples with 1 h soaking time, the XRD peak width decreases slightly with increasing T, while for the 6 h samples an increase (with some downturn at highest T) is observed in Fig. 14d and e. Since the grain sizes are well above the range which causes size broadening, this broadening is tentatively attributed to the formation of intergranular Ba and/or Y concentration gradients.
We can summarize that from the viewpoints of electrolyte layer morphology, BZCY lattice parameter, and concentration of second phases, long soaking times and temperatures above 1500 °C are not beneficial. The sintering involving a transient liquid phase in the NiO-rich anode as well as in the NiO-poor BZCY electrolyte layer is a complex process, but with appropriately chosen conditions dense anode–electrolyte assemblies with minimized secondary phase content can be achieved.
3.6. Electrical properties
Fig. 15 shows exemplary conductivity measurements of electrolyte–support assembly samples sintered at 1450 °C and 1500 °C. Under these conditions (wet N2 or wet diluted H2) the proton conductivity dominates.2 In addition to the high-frequency arc that is assigned to bulk conductivity, the impedance spectra of electrolyte as well as pellet samples exhibit an additional semicircle which is related to the well-known blocking character of the grain boundaries in Ba(Zr,Ce,Y)O3−z materials2,35–37 and which typically exhibits a larger activation energy than the bulk proton conductivity. At temperature above ≈300 °C bulk and GB arcs cannot be resolved any more, and only the total conductivity is given. For comparison, also the bulk and GB conductivity of a ceramic pellet with same Ce, Y and Ni content is shown. The bulk conductivity of the electrolytes is very similar to that of the ceramic pellet; its activation energy of 0.52 eV (determined from a plot of log(σT) vs. 1/T) agrees well with literature data for BaZr0.6Ce0.2Y0.2O3−δ – 2 wt% NiO.38 On the other hand, the GB conductivity of the electrolyte in the assembly samples is about one order of magnitude lower than that of the ceramic pellet. The corresponding decrease of the total conductivity is more severe at low T and increasingly vanishes above 400 °C. The difference in GB conductivity may be related to a smaller grain size in the membrane samples (cf. higher sintering T for ceramic pellet), but also to detrimental effects of BaO evaporation at the exposed film surface, and potential Ni-indiffusion from the supporting anode layer (Fig. 12c and d).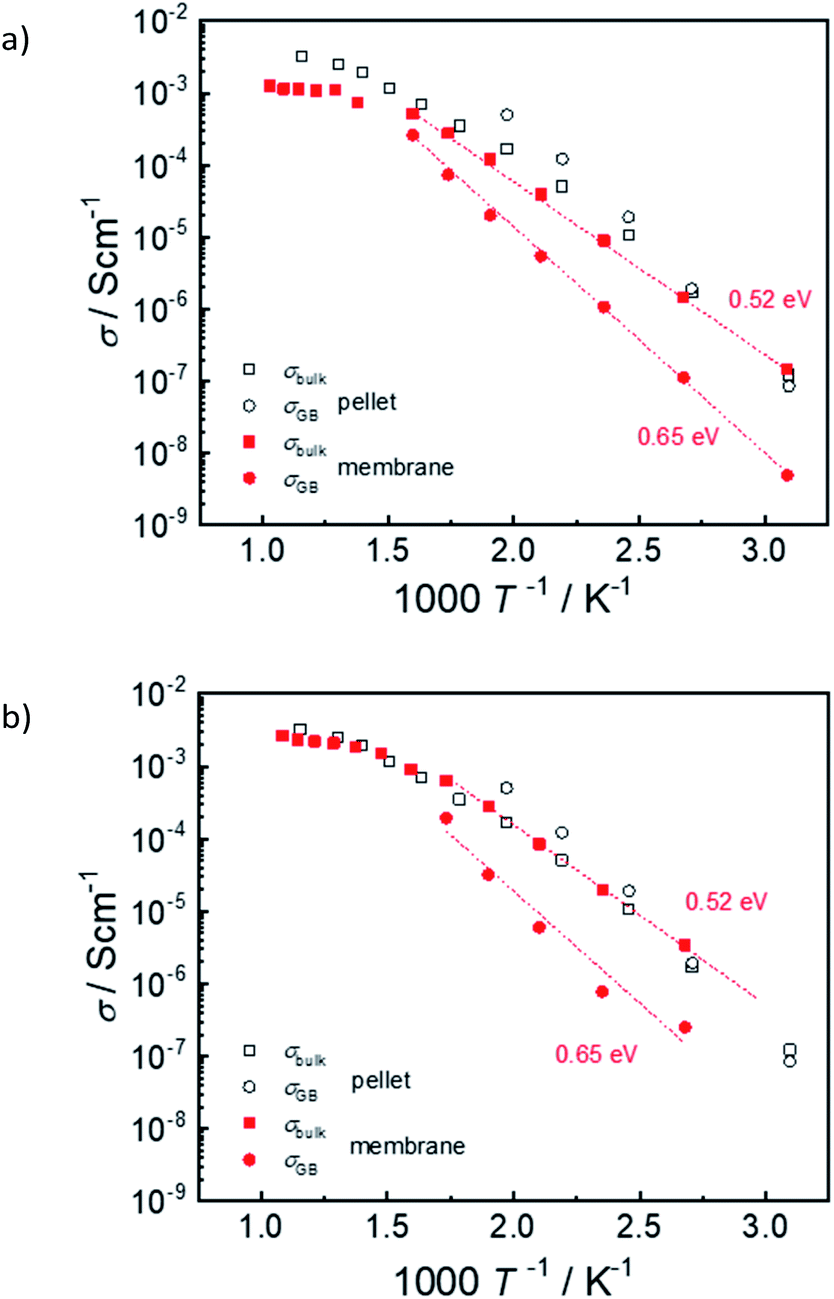 | ||
| Fig. 15 Arrhenius plot of reduced assemblies sintered (a) 6 h at 1450 °C, (b) 3 h at 1500 °C. For comparison the values of a ceramic pellet sample are shown (nominally identical cation composition and NiO addition, sintered 4 h at 1550 °C). Assemblies were measured in wet H2 (pH2O = 20 mbar), the pellet in wet N2 from 700 °C to 400 °C and wet 2% H2 at lower T. | ||
In general it is found that NiO addition to Ba(Zr,Ce,Y)O3−δ is beneficial for sintering properties and grain growth but decreases the bulk proton conductivity, see e.g.39–41 This is at least in part due to a decreased proton incorporation.24,25,38 Even if NiO is not deliberately added into the Ba(Zr,Ce,Y)O3−δ layer of co-sintered anode-supported cells, its presence in the anode layer affects the Ba(Zr,Ce,Y)O3−δ electrolyte layer. Thus, it is not surprising that the electrolyte conductivity extracted from such cells are lower than expected for ceramic pellets sintered without NiO addition (data compilation e.g. in ref. 25 and 40). This observation applies for different methods of electrolyte layer preparation such as co-pressing, dip coating, screen printing etc. At 600 °C the present membrane sintered at 1500 °C reaches a total conductivity of about 0.003 S cm−1 which is comparable to the literature data. The present approach of anode and electrolyte sequential tape-casting and co-sintering has the advantage that it is suitable for further upscaling of the cell area, in contrast to methods based on pressing/co-pressing.
4. Conclusions
In this work it was shown that protonic ceramic half-cells can be successfully manufactured by using the scalable and industrially established tape-casting process, applying solid state reactive sintering. BZCY perovskite powder for the substrate layer was synthesized via a solid-state reaction route, while the powder for the electrolyte layer still contains some unreacted BaCO3. The powder properties were adjusted for the tape-casting process by controlling the calcination temperatures which were 1100 °C and 1300 °C for electrolyte and substrate, respectively. The electrolyte layer thickness was between 10 and 20 μm, while anode substrate layers consisting of a BZCY–NiO composite were around 250 μm thick. To further increase the substrate layer thickness effectively, lamination technique was introduced, where heat and pressure were used to connect several tape-cast layers to each other.The heat treatment of the green samples was studied by different methods to develop an optimised temperature profile. Therefore, the burn out of the organic additives was investigated by thermogravimetry. The sintering behaviour and the thermal expansion of the single layers was studied before the final sintering profile was adapted to the bi-layer combination of dense BZCY electrolyte and composite BZCY/NiO substrate. Sintering temperature of 1500 °C was found to be optimal. Extended soaking times are detrimental since they cause BaO loss from the electrolyte into the BZCY–NiO anode layer. A scale-up approach to a cell size of 25 cm2 was successful.
Sintered anode–electrolyte assemblies were characterized in detail by XRD and SEM. It was shown that the BaY2NiO5 transient liquid phase causes some inhomogeneities in the thin electrolyte layer by forming Y-rich domains after the decomposition of the phase itself. Nevertheless, the electrical properties are competitive compared to other data from literature. The proton conductivity of the tape-cast half-cells was measured to be σ = 0.003 S cm−1 at 600 °C in humid atmosphere.
Conflicts of interest
There are no conflicts to declare.Acknowledgements
This work was conducted thanks to the financial support of Federal Ministry of Education and Research BMBF, Germany under the funding reference 03SF0537A, C (ProtOMem Project). J. Deuschle, A. Fuchs, H. Hoier (MPI FKF Stuttgart) and Y.-J. Sohn (IEK-1, Forschungszentrum Jülich GmbH) are highly acknowledged for performing the SEM, EDX and XRD studies.References
- K.-D. Kreuer, Solid State Ionics, 1999, 125, 285–302 CrossRef CAS.
- K. D. Kreuer, Annu. Rev. Mater. Res., 2003, 33, 333–359 CrossRef CAS.
- Y. Matsuzaki, Y. Tachikawa, T. Somekawa, T. Hatae, H. Matsumoto, S. Taniguchi and K. Sasaki, Sci. Rep., 2015, 5, 12640 CrossRef CAS PubMed.
- S. Hossain, A. M. Abdalla, S. N. B. Jamain, J. H. Zaini and A. K. Azad, Renewable Sustainable Energy Rev., 2017, 79, 750–764 CrossRef CAS.
- K. Leonard, W. Deibert, M. E. Ivanova, W. A. Meulenberg, T. Ishihara and H. Matsumoto, Membranes, 2020, 10, 339 CrossRef CAS PubMed.
- C. C. Duan, R. J. Kee, H. Y. Zhu, C. Karakaya, Y. C. Chen, S. Ricote, A. Jarry, E. J. Crumlin, D. Hook, R. Braun, N. P. Sullivan and R. O'Hayre, Nature, 2018, 557, 217–222 CrossRef CAS PubMed.
- S. Choi, C. J. Kucharczyk, Y. Liang, X. Zhang, I. Takeuchi, H.-I. Ji and S. M. Haile, Nat. Energy, 2018, 3, 202–210 CrossRef CAS.
- H. An, H.-W. Lee, B.-K. Kim, J.-W. Son, K. J. Yoon, H. Kim, D. Shin, H.-I. Ji and J.-H. Lee, Nat. Energy, 2018, 3, 870–875 CrossRef CAS.
- K. Bae, D. Y. Jang, H. J. Choi, D. Kim, J. Hong, B. K. Kim, J. H. Lee, J. W. Son and J. H. Shim, Nat. Commun., 2017, 8, 14553 CrossRef CAS PubMed.
- C. Duan, J. Tong, M. Shang, S. Nikodemski, M. Sanders, S. Ricote, A. Almansoori and R. O'Hayre, Science, 2015, 349, 1321–1326 CrossRef CAS PubMed.
- J. H. Tong, D. Clark, L. Bernau, A. Subramaniyan and R. O'Hayre, Solid State Ionics, 2010, 181, 1486–1498 CrossRef CAS.
- J. H. Tong, D. Clark, L. Bernau, M. Sanders and R. O'Hayre, J. Mater. Chem., 2010, 20, 6333–6341 RSC.
- H. L. Dai, E. H. Da'as, S. P. Shafi, H. Q. Wang and L. Bi, J. Eur. Ceram. Soc., 2018, 38, 2903–2908 CrossRef CAS.
- L. S. Mahmud, A. Muchtar and M. R. Somalu, Renewable Sustainable Energy Rev., 2017, 72, 105–116 CrossRef CAS.
- J. Dailly, M. Marrony, G. Taillades, M. Taillades-Jacquin, A. Grimaud, F. Mauvy, E. Louradour and J. Salmi, J. Power Sources, 2014, 255, 302–307 CrossRef CAS.
- M. Marrony, M. Ancelin, G. Lefevre and J. Dailly, Solid State Ionics, 2015, 275, 97–100 CrossRef CAS.
- J. Dailly, G. Taillades, M. Ancelin, P. Pers and M. Marrony, J. Power Sources, 2017, 361, 221–226 CrossRef CAS.
- J. Xiao, H. Yuan, L. Chen, C. Xiong, J. Ma, Y. Zhao, J. Chai, W. Du and X. Zhu, Int. J. Mod. Phys. B, 2017, 31, 1744062 CrossRef CAS.
- J. Huang, Y. Ma, M. Cheng and S. Ruan, Int. J. Hydrogen Energy, 2018, 43, 12835–12846 CrossRef CAS.
- S. H. Nien, C. S. Hsu, C. L. Chang and B. H. Hwang, Fuel Cells, 2011, 11, 178–183 CrossRef CAS.
- N. Sata, F. Han, H. Zheng, A. M. Dayaghi, T. Norby, M. Stange, R. Semerad and R. Costa, ECS Trans., 2021, 103, 1779–1789 CrossRef CAS.
- K. H. Ryu and S. M. Haile, Solid State Ionics, 1999, 125, 355–367 CrossRef CAS.
- W. Deibert, M. E. Ivanova, W. A. Meulenberg, R. Vaßen and O. Guillon, J. Membr. Sci., 2015, 492, 439–451 CrossRef CAS.
- Y. Huang, R. Merkle and J. Maier, Solid State Ionics, 2020, 347, 115256 CrossRef CAS.
- D. Han, S. Uemura, C. Hiraiwa, M. Majima and T. Uda, ChemSusChem, 2018, 11, 4102–4113 CrossRef CAS.
- E. Kim, Y. Yamazaki, S. M. Haile and H. I. Yoo, Solid State Ionics, 2015, 275, 23–28 CrossRef CAS.
- D. Han, K. Shinoda, S. Tsukimoto, H. Takeuchi, C. Hiraiwa, M. Majima and T. Uda, J. Mater. Chem. A, 2014, 2, 12552–12560 RSC.
- K. Xie, R. Yan, Y. Jiang, X. Liu and G. Meng, J. Membr. Sci., 2008, 325, 6–10 CrossRef CAS.
- J. A. Lewis, Annu. Rev. Mater. Sci., 1997, 27, 147–173 CrossRef CAS.
- A. Kaiser, A. S. Prasad, S. P. Foghmoes, S. Ramousse, N. Bonanos and V. Esposito, J. Eur. Ceram. Soc., 2013, 33, 549–556 CrossRef CAS.
- A. Løken, S. Ricote and S. Wachowski, Crystals, 2018, 8, 365 CrossRef.
- Y. Huang, PhD thesis, University of Stuttgart, 2020 Search PubMed.
- C. Hiraiwa, D. Han, A. Kuramitsu, A. Kuwabara, H. Takeuchi, M. Majima, T. Uda and R. Koc, J. Am. Ceram. Soc., 2013, 96, 879–884 CrossRef CAS.
- Y. Huang, R. Merkle and J. Maier, J. Mater. Chem. A, 2021, 9, 14775–14785 RSC.
- M. Shirpour, B. Rahmati, W. Sigle, P. A. van Aken, R. Merkle and J. Maier, J. Phys. Chem. C, 2012, 116, 2453–2461 CrossRef CAS.
- F. Iguchi, C.-T. Chen, H. Yugami and S. Kim, J. Mater. Chem., 2011, 21, 16517–16523 RSC.
- C. Kjølseth, H. Fjeld, Ø. Prytz, P. I. Dahl, C. Estournès, R. Haugsrud and T. Norby, Solid State Ionics, 2010, 181, 268–275 CrossRef.
- D. Han, K. Goto, M. Majima and T. Uda, ChemSusChem, 2021, 14, 614–623 CrossRef PubMed.
- N. Nasani, D. Pukazhselvan, A. V. Kovalevsky, A. L. Shaula and D. P. Fagg, J. Power Sources, 2017, 339, 93–102 CrossRef CAS.
- D. Han, J. Iihara, S. Uemura, K. Kazumi, C. Hiraiwa, M. Majima and T. Uda, J. Mater. Chem. A, 2016, 4, 10601–10608 RSC.
- S. Ricote, N. Bonanos, A. Manerbino, N. P. Sullivan and W. G. Coors, J. Mater. Chem. A, 2014, 2, 16107–16115 RSC.
| This journal is © The Royal Society of Chemistry 2022 |