 Open Access Article
Crystallization and molecular mobility in renewable semicrystalline copolymers based on polycaprolactone and polyisosorbide†
Chaima
Bouyahya
ab,
Nikolaos D.
Bikiaris
a,
Alexandra
Zamboulis
a,
Apostolos
Kyritsis
 c,
Mustapha
Majdoub
*b and
Panagiotis A.
Klonos
 *ac
*ac
aDepartment of Chemistry, Laboratory of Polymer Chemistry and Technology, Aristotle University of Thessaloniki, GR-541 24, Thessaloniki, Greece. E-mail: pklonos@central.ntua.gr
bLaboratoire des Interfaces et Matériaux Avancés, Université de Monastir, 5000 Monastir, Tunisia. E-mail: mustapha.majdoub@fsm.rnu.tn
cDepartment of Physics, National Technical University of Athens, Zografou Campus, 15780, Athens, Greece
First published on 10th November 2022
Abstract
A series of novel block copolymers based on two biodegradable polymers, poly(ε-caprolactone), PCL, and poly(isosorbide), PIS, with PIS fractions 5, 10, and 25 wt%, are studied herein. The aim is to assess the effects of the amorphous PIS phase on the properties of the semicrystalline PCL (majority), in addition to the synthesis strategy. The latter involved the polymerization of caprolactone onto initial PIS of low molar mass, resulting, thus, in gradually shorter PCL blocks when the starting amount of PIS is increased. The structure–property relationship investigation, with an emphasis on molecular mobility and crystallization, involves the following sum of complementary techniques: differential scanning calorimetry, dielectric spectroscopy, polarized optical microscopy and X-ray diffraction. The molecular mobility map for these PCL/PIS and initial PIS is drawn here for the first time. Despite the high glass transition temperature of PIS (Tg ∼ 51 °C) compared to that of PCL (−66 °C), the Tg of the copolymers barely changes, as it is mainly ruled by crystallinity. The latter seems to be facilitated in the copolymers, in both the amount and the rate. The local molecular mobility of PCL and PCL/PIS consists of faster γPCL relaxation which is unaffected in the copolymers, whereas the slower βPCL process arising from the backbone ester group rotation exhibits a systematic deceleration in the presence of PIS. A connection between such local motions and the corresponding segmental α relaxation, observed previously in other polyesters, is also found to be true here. Apart from that, the dielectric Tg as well as the cooperativity of the polymer chains drop moderately, which indicates spatial confinement between the PCL crystals, whereas correlations with the looser lamellar chain packing within the spherulites are gained. The relaxations of initial PIS, i.e., γPIS, βPIS and αPIS, could not be resolved within the copolymers. Along with other properties, such as ionic conductivity, we conclude to the homogeneity of our systems, with sufficient PCL/PIS distribution.
1. Introduction
Synthetic polymers have been improving our everyday life for more than a century now1–3 and nowadays plastics are found everywhere: in our homes, transport, buildings, healthcare, etc. Polymeric materials owe their success to their unique properties; indeed, they are high performance materials, which are easily processed and have a low cost of production.2 However, numerous concerns are being raised regarding the oil-based origin of most polymers and their accumulation in the environment due to their lack of degradability.4–7 Plastics are increasingly perceived as non-eco-friendly materials by the wider public, overestimating their actual contribution to the environmental crisis. These concerns have driven the advent of the field of biobased polymers, i.e., polymers synthesized from renewable resources, the polylactide family being the most commercially viable for the time being.8–13 To widen the portfolio of biobased polymers and, thus their potential applications, intensive research in the field is being conducted, both by academia and industry.14,15 Several other polyesters, both aliphatic ones such as poly(n-alkylene succinate)s16,17 and glycerol-based polyesters,18 as well as aromatic ones, furanoate polyesters, produced from 2,5-furan-dicarboxylic acid,19,20 and polyvanillates,21 are being investigated. In addition to good performance, renewability and biocompatibility, such materials serve well within the circular and the green economic prescripts.22,23 Moreover, copolymers, blends and composites of biobased polymers24–32 are being developed to further improve the properties and performance of these promising polymers.33,34Isosorbide is a V-shaped diol that carries two sterically different secondary hydroxyl groups, with the so-called ‘exo-’ and ‘endo-’ configurations, respectively, and two ‘cis-’ connected tetrahydrofuran rings.35,36 It is a commercially available biobased monomer, produced from D-glucose (on the industrial scale) or starch.36 This non-toxic chiral diol has been employed for the stepwise development of various polymers, including polyesters, polyurethanes, polyamides, polycarbonates, etc.37–40 In the context of the present study, we will discuss poly(isosorbide), PIS, which is an isosorbide-based poly(acetal).41,42 PIS is an amorphous polymer with a Tg of around 50 °C. PIS has two pending hydroxyl groups and its copolymerization with other aliphatic polymers could contribute to the increase in their rigidity and phase-transition temperatures. Herein, we have combined PIS with poly(ε-caprolactone) (PCL).
PCL is a biocompatible (non-toxic) and hydrophobic polyester,43 that is characterized by a slow in vivo hydrolysis.44 It is generally synthesized by the ring-opening polymerization (ROP) of ε-caprolactone.45,46 PCL demonstrates quite good mechanical performance and permeation (gas barrier) characteristics, but relatively low glass transition temperatures (far below room temperature) and mild melting points (∼60 °C).43 Since this polyester is semicrystalline, with a high degree of crystallinity (mainly 50% and larger),30,43,47,48 its performance is strongly connected with crystallinity. As a consequence, its permeation to small molecules (air, humidity),49 heat transport and mechanical strength50,51 depends on the semicrystalline morphology (size, numbers and distributions of polymer crystals).52,53 In connection to that, PCL demonstrates a pronounced phenomenon of ‘crystal/nucleation memory’48,54,55 that plays a key role in manipulating the semicrystalline morphology by appropriately chosen thermal protocols (melting temperature, supercooling, etc.). Crystal memory, nucleation and lamella packing depend also on the macromolecular chain mobility, chain–chain organization, interchain interactions and reactivity.56–58
As already mentioned, the materials’ performance can be further tuned by combining one polymer with another. PCL has been widely demonstrated to show almost unique compatibility with various polymers.59 PCL co-polyesters of various forms, from linear blocks to star-shaped and hyperbranched copolymers, can be synthesized employing either multifunctional comonomers or oligomers.18,50,60–62
For the present study, we have combined PCL with a newer biobased polymer, i.e., poly(isosorbide) (PIS). PIS is produced from starch, or, on the industrial scale, from D-glucose.36 Isosorbide is a V-shaped diol that carries two sterically different secondary hydroxyl groups, with the so-called ‘exo-’ and ‘endo-’ configurations, respectively, and two ‘cis-’ connected tetrahydrofuran rings.35,36 This non-toxic chiral diol has been employed within various synthetic processes for the step-development of various polymers, including polyesters, polyurethanes, polyamides, polycarbonates, etc.35,38–40
Herein, PIS of relatively small molar mass (short length) was used, via its hydroxyl groups (–OH), as a macro-initiator for the ROP of ε-caprolactone, yielding copolymers with PIS and PCL blocks. We have synthesized three diblock copolymers, namely, with different PCL/PIS wt% ratios of 95/5, 90/10 and 75/25, which are studied and compared with neat PCL and initial PIS. The focus here is on the direct and indirect effects of block copolymer composition and chain length on the glass transition, crystallization and finally on the local and segmental mobility. The investigation involves a series of complementary techniques, differential scanning calorimetry (DSC), polarized optical microscopy (POM), X-ray diffraction (XRD), combined with the technique of broadband dielectric spectroscopy (BDS).63 To the best of our knowledge, the molecular mobility for these PCL/PIS systems and PIS individually is shown for the first time.
2. Materials and experimental techniques
2.1 Materials – preparation of PCL/PIS copolymers
PIS was synthesized according to a previously reported method with some modifications.42 Briefly, a stirred mixture of isosorbide and potassium hydroxide powder in a small amount of dimethyl sulfoxide was purged with argon. Then, an excess of methylene chloride was gradually added, and the reaction mixture was kept under magnetic stirring at room temperature for 120 h. The polymer obtained was precipitated in methanol and dried under vacuum.Three PCL-b-PIS copolymer samples were synthesized by the ROP of ε-caprolactone64,65 in the presence of the pre-synthesized low molar mass, Mn ∼ 15 kg mol−1 PIS (Fig. 1). PIS exhibits terminal –OH sites, onto which the building of PCL block takes place, in accordance also with previous works on PCL58 and other polyesters.66 The PCL(%)/PIS(%) ratios have been chosen here as 95/5, 90/10 and 74/25. To facilitate a direct comparison with copolymers with neat polymers, we synthesized neat –OH terminated PCL, again by ROP. The latter is studied in parallel with the copolymers and initial PIS. Due to the method of copolymer synthesis, we expect a decrease in the average molar mass (chain length, bottom of Fig. 1) with the increase of the PIS fraction, as the number of ROP initiation points increases.58,66,67 This was confirmed by the intrinsic viscosity, [η], which drops from 0.78 dL g−1 in PCL to 0.48, 0.36 and 0.28 dL g−1, for 5%, 10% and 20% PIS, respectively. According to gel permeation chromatography, Mn is ∼90 kg mol−1 in neat PCL and drops gradually to ∼12 kg mol−1 in PCL(75%)-b-PIS(25%). Please note that [η] of the initial PIS was 0.32 dL g−1. The prepared samples were placed in a homemade mold, thermally pressed and finally, received in the form of disks ∼1.8 mm in thickness and 25 mm in diameter.
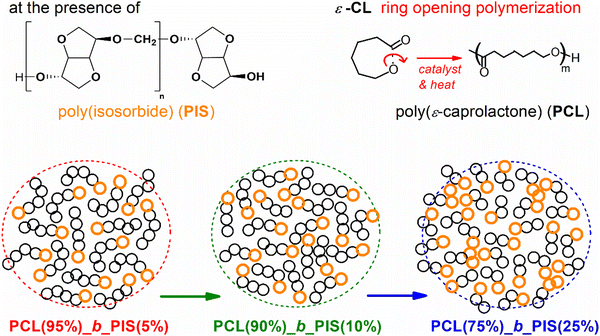 | ||
| Fig. 1 Schematic view of PCL/PIS copolymer preparation, via ROP and building of PCL blocks on existing PIS segments. | ||
2.2. Characterization methods
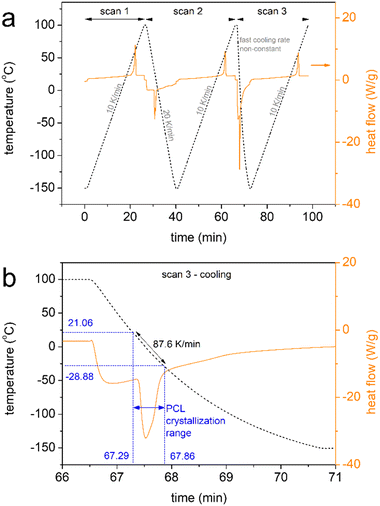
DSC was employed to investigate the polymers’ thermal transitions. The measurements were performed under a high purity helium atmosphere (99.9995%), on samples 8–9 mg in mass sealed in TZero aluminium pans and within the temperature range from −150 to 100 °C, by means of a TA Q200 DSC apparatus (TA Instruments, USA) equipped with a liquid nitrogen control system (LNCS). The instrument had been previously calibrated with indium for temperature and enthalpy and sapphires for heat capacity. The cooling/heating profiles are shown in Scheme 1. Upon erasing the thermal history via a first heating scan up to 100 °C at 10 K min−1 (scan 1), all samples were cooled down to −150 at 20 K min−1 (scan 2) and, in another scan, at the fastest achievable rate (‘jump’ command of the TA software, scan 3). The latter resulted in a non-constant cooling rate, being ∼90 K min−1 (Scheme 1b) on average in the temperature range of PCL's crystallization. The employment of different cooling rates for scans 2 and 3 aims at the manipulation of crystallization, for example, to be suppressed during fast cooling or facilitated during slower cooling. The subsequent heating scans up to 100 °C were performed at a fixed rate of 10 K min−1 (Scheme 1).The crystalline fraction, CF, was estimated by both crystallization and melting peaks in DSC, by comparing the crystallization enthalpy (ΔHc and ΔHm, respectively) with the theoretical heat of fusion for a 100% crystalline PCL, ΔH100%,PCL, taken as 139.5 J g−1,68 according to eqn 1.
 | (1) |
To assess the semicrystalline structure, X-ray diffraction, XRD, was employed on samples that had been previously subjected to erased thermal history and cooled at 20 K min−1. The diffraction spectra were recorded at room temperature employing a MiniFlex II XRD system (Rigaku Co., Japan), with Cu Ka radiation (λ = 0.154 nm), over a 2θ range from 5° to 50° with a scanning rate of 1 deg min−1. Upon analysis of the diffraction peaks by mathematical models (Lorentzians), we were able to extract a rough estimation of the crystalline fraction, CFXRD,67 by comparing the sum of crystalline peak areas, Acryst, with the overall diffraction area, amorphous halos and crystalline peaks, ‘Aamorphous+ Acryst’ (eqn 2).
 | (2) |
Polarized optical microscopy, POM, images of the semicrystalline morphology for all PCL-based systems, during the evolution of crystallization from the melt state and upon cooling at ∼10 K min−1 (the actual time–temperature profile can be seen in section S1 of the ESI†), were recorded by means of a Nikon Optiphot-1 polarizing microscope equipped with a Linkam THMS 600 heated stage, a Linkam TP91 control unit and a Jenoptic ProgRes GRYPHAX® NAOS 20mp microscope camera.
To investigate molecular mobility in the copolymers and the corresponding effects of composition and compare with the molecular mobility of neat PCL and initial PIS, BDS was employed, a technique characterized by a quite high resolving power.63 For that, a Novocontrol BDS setup was used, i.e., an Alpha frequency response analyzer combined with a Quatro liquid nitrogen cryosystem (Novocontrol GmbH, Germany). Prior to the measurements, the samples were kept in a dry environment. Small pieces of ∼50 mg in mass of the synthesized polymers were initially placed and melted at ∼100 °C between finely polished brass electrodes of 14 mm diameter. To prevent the electrical contact of the electrodes and keep them parallel with each other, silica spacers of ∼100 μm thickness by Novocontrol were used. Then, the complex dielectric permittivity (eqn 3),
| ε*(f, T) = ε′(f, T) − i·ε′′(f, T) | (3) |
 | (4) |
 | (5) |
 | (6) |
3. Results and discussion
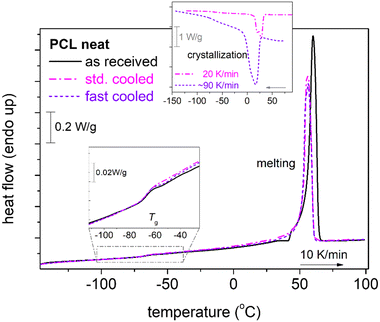
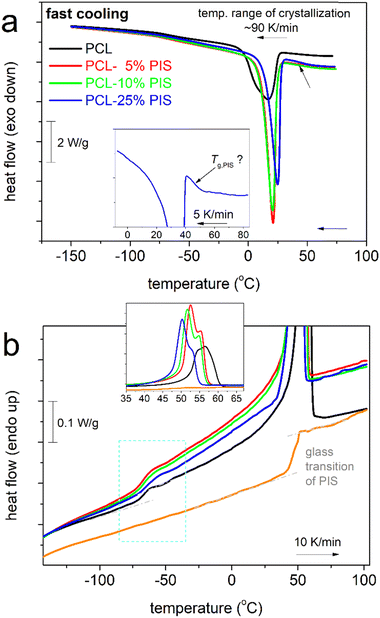
To provide the first view of the thermal transitions of PCL, we show in Fig. 2 the corresponding DSC thermograms. In all cases, neat PCL exhibits a glass transition step, with the characteristic temperature, Tg= −66 °C. Tg seems independent of the rate of prior cooling, as during both slow and faster cooling, PCL crystallized at around 20–30 °C. The degree of crystallinity of neat PCL is CFc = 0.32 wt (eqn 1).We note that the employment of the highest cooling rate aimed at the elimination of crystallization and, thus, the production of ‘amorphous’ PCL. The latter was found impossible by such ‘conventional’ method, in accordance with previous works.48,58,74
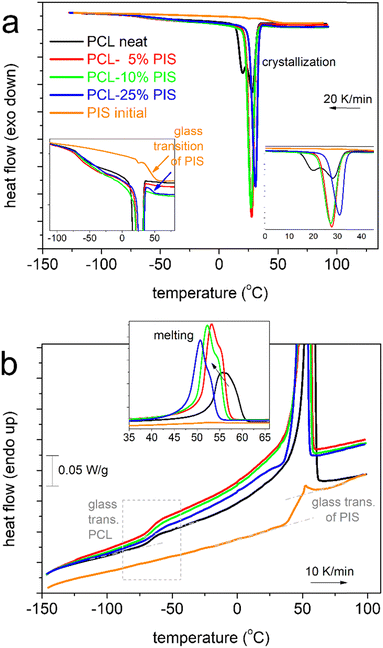
We may now follow the effects imposed on the thermal events in the copolymers. In Fig. 3, results from scan 2 (cooling at 20 K min−1, Fig. 3a, heating at 10 K min−1, Fig. 3b) are shown, comparatively for all compositions and initial PIS.
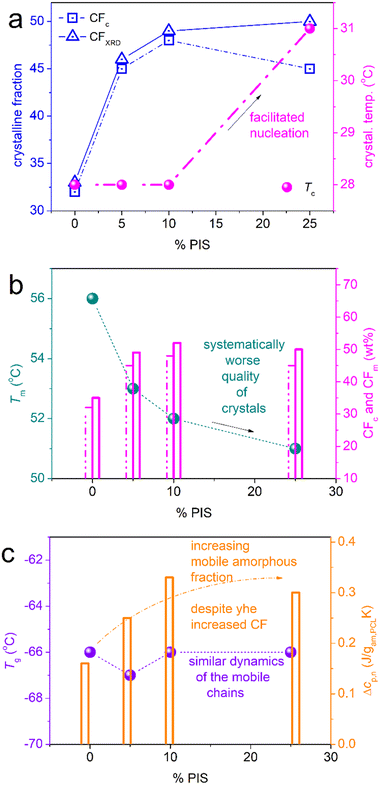
Beginning from the melt state, during cooling (Fig. 3a), PCL exhibits a wide and double-structured crystallization exotherm. This probably correlates with multiple crystallization mechanisms of PCL.54 All copolymers exhibit a single peak, located mainly at higher temperatures. The effect may originate from the favoring of one crystallization mechanism or, in other words, a more oriented crystallization. Such effects on crystallizability are often recorded in block copolymers.75 This point can be further followed by specific experiments (isothermal crystallization, crystallization under various cooling rates, etc.) and corresponding analysis (e.g., Avrami method).75 The results are further evaluated and the values are listed in Table 1. Selected values have been plotted as a function of PIS fraction and are shown in Fig. 4. Therein, the crystallization temperature, Tc, tends to increase from 28 to 31 °C and so does CFc, from 0.32 up to 0.48 wt (Fig. 4a). These are indications of the facilitation of both the rate and the amount of crystallization, which seems to be more homogeneous (single-peaked) in the copolymers. Qualitatively similar results were revealed from scan 3, involving faster cooling (Fig. 5).
| T c (°C) | ΔHc,n (J gPCL−1) (±1) | CFc (wt) (±0.01) | T g (°C) | Δcp,n (J gam−1 K−1) | T m (°C) | ΔHm,n (J gPCL−1) | CFm (wt) (±0.03) | CFXRD (±0.05) | |
|---|---|---|---|---|---|---|---|---|---|
| PCL (neat) | 28/20 | 44 | 0.32 | −66 | 0.16 | 56 | 49 | 0.35 | 0.33 |
| PCL(95%)-b-PIS(5%) | 28 | 63 | 0.45 | −67 | 0.25 | 53 | 68 | 0.49 | 0.46 |
| PCL(90%)-b-PIS(10%) | 28 | 67 | 0.48 | −66 | 0.33 | 52 | 72 | 0.52 | 0.49 |
| PCL(75%)-b-PIS(25%) | 31 | 63 | 0.45 | −66 | 0.30 | 51 | 69 | 0.50 | 0.50 |
| PIS (initial) | — | — | — | 51 | 0.26 | — | — | — | — |
When estimating CF from melting, CFm, and comparing with CFc, we record a qualitative agreement in Fig. 4b. Then, we interestingly record a monotonic decrease in the melting temperature, Tm, from 56 down to 51 °C with increasing PIS. This could suggest the lowering of crystal quality in the copolymers, e.g., in the chains’ packing density, and correlate with the existence of PIS segments that act as defects in the copolymers.
Based on the overall data on crystallization, we expect mild alternations in the semicrystalline morphology, namely, on the size and distribution of PCL spherulites, whereas, stronger effects on the density of the crystals.
Coming to the chains’ mobility, we follow the effects on glass transition. Individual Tg of initial PIS, which is amorphous, is 51 °C (Fig. 3b and 5b), whereas the corresponding heat capacity change is Δcp = 0.26 J g−1 K−1. Obviously, the polymer chain mobility within all the PCL-based systems will be ruled by the presence of crystals, thus, the direct chain copolymeric structure effects cannot be simply resolved. In Fig. 4c, Tg seems mainly unchanged, about −66 °C. With the exception of PCL(75%)-b-PIS(25%), we have no indication of separate glass transition of the PIS phase. Thus, for the rest of the copolymers, we expect homogeneous distribution of PCL_PIS blocks, with gradually shorter PCL segments on increasing PIS.58,67,76 The shortening of the chain length should result in general in the lowering of the Tg. Most probably, this does not apply here, as the measured molar masses are above the value of 10 kg mol−1, namely, all laying above the expected threshold for chain–chain entanglements. On the other hand, an increase in the number of free chain ends, i.e., the number of free hydroxyls (–OH), is expected when the overall copolymer chain length decreases (Fig. 1). In turn, this should favor more chain–chain interactions, for example, between the hydroxyls and the ester groups (–C![[double bond, length as m-dash]](https://www.rsc.org/images/entities/char_e001.gif) O) of caprolactone. Taken individually, without considering the PCL chain shortening, the increased chain–chain interactions are expected to lead to higher Tg values. Therefore, we believe that the ‘unchanged’ Tg shown in Fig. 4c, is a result of compensation between the two effects described above along with the high crystalline fraction. It is worth noting that the said PCL interchain interactions have been proven to be responsible for the interesting crystal-memory effects exhibited in PCL54,77 and studied by various techniques.48
O) of caprolactone. Taken individually, without considering the PCL chain shortening, the increased chain–chain interactions are expected to lead to higher Tg values. Therefore, we believe that the ‘unchanged’ Tg shown in Fig. 4c, is a result of compensation between the two effects described above along with the high crystalline fraction. It is worth noting that the said PCL interchain interactions have been proven to be responsible for the interesting crystal-memory effects exhibited in PCL54,77 and studied by various techniques.48
In the insets to Fig. 3a and 5a, we follow that during cooling of PCL(75%)-b-PIS(25%), a step-like event is recorded at around 45 °C. From our data it is not clear as to whether such step exists within the copolymers with smaller PIS contents. Recalling the results of neat PIS (Tg = 51 °C), the said step is most probably the individual glass transition of PIS in the copolymer. If so, PCL(75%)-b-PIS(25%) should be the only case of nano- or micro-phase separation within our copolymers. This phase separation is obviously more extensive when the amount of PIS is increased, as our materials are actually diblocks and PIS is not miscible with PCL. The same has been found true also in previous copolymers, based on other polyesters76 of severely different Tgs and miscibilities, and shows that despite the chemical forced coexistence of different polymers, there are still physical mechanisms that drive the phase separation. The results of the thermal transitions are quite similar when the samples are cooled at a higher rate (Fig. 5), with indications for weak cold crystallization upon heating slightly above Tg (Fig. 5b) probably due to incomplete crystallization during cooling.
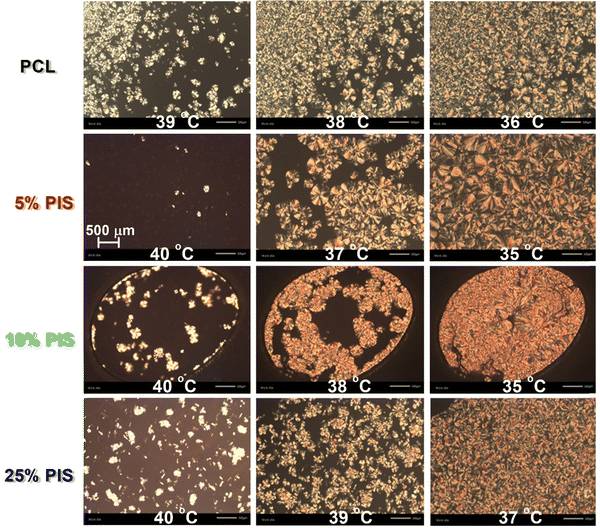
To visualize the situation on semicrystalline morphology, i.e., a term used to describe together the number(s)–size(s)–distributions(s) of the polymer crystallites, we employed POM. The results are shown in Fig. 6. The POM images are representative of all PCL-based systems, during crystallization from the melt. Please note that the thermal protocol employed for POM is similar to that of scan 2 in DSC, so that a comparison between the two techniques is facilitated. Within all compositions, spherulites are formed exhibiting similar sizes, varying between tens and hundreds μm. In all cases, the sample volume is finally filled with crystallites. The formation of small and larger crystals could possibly lay at the origins of the double-peaked melting recorded in DSC (insets to Fig. 3b and 5b). Regarding the effects of the copolymer composition on the semicrystalline morphology we do not observe systematic alternations. For example, on average larger crystals are formed in PCL(95%)-b-PIS(5%) and PCL(90%)-b-PIS(10%), whereas quite smaller ones are formed within PCL(75%)-b-PIS(25%), whereas, the latter samples demonstrates a view quite similar to that of neat PCL.
Regarding the quality of the spherulite structure, XRD measurements revealed interesting effects. In Fig. 7a, we present comparative XRD spectra for all samples, upon subjection to the same thermal/crystallization protocol. Neat PCL exhibits diffraction peaks originating from crystal forms, in accordance with the literature.48 The corresponding 2θ positions are reported within Fig. 7a.
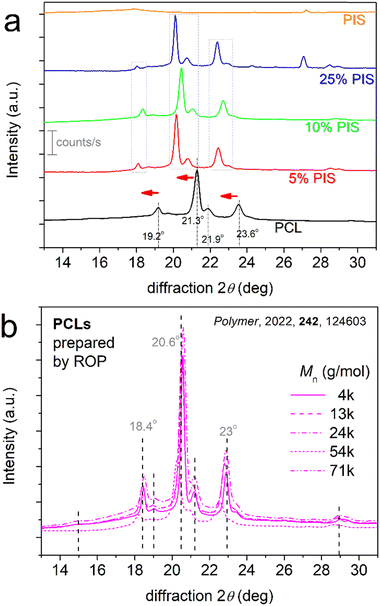 | ||
| Fig. 7 (a) Comparative XRD spectra for PCL, PCL-PIS and initial PIS samples. Indicated are the main 2θ positions for the crystalline-related diffraction peaks, whereas horizontal red arrows have been added to point the effects induced in the copolymers. For comparison with the present systems, we show in (b) the results for neat PCLs prepared via ROP, characterized by a variety of Mn (adapted from Ref. 48 with permission from Elsevier). | ||
When comparing neat PCL with the PCL-b-PIS systems, the diffraction peaks for the latter are the same in number and appear broadly in the same 2θ range, but with migration toward lower 2θ by about 1°. The result has been checked by different samples and re-positionings of all samples and was found repeatable. This interesting effect suggests larger unit cells for the crystals of the copolymers or, from another point of view, it can be connected to looser lamella packing in the crystals.48,78 These are compatible with the discussed effects on Tm in Fig. 4b. The effect on chain packing arises most probably from the presence of the more rigid PIS block. The first factor seems less possible. To support that, we present in Fig. 7b previously published XRD results48 on neat PCL samples prepared by ROP by our group, characterized by a variety of molar masses, and subjected to a similar thermal treatment to that of the present study. Within these results, no significant migration of the diffraction peaks was observed.
Also, from the data of XRD and upon careful analysis in terms of mathematical models (Lorentzians, not shown here),48 we estimated the crystalline fraction by the said technique, CFXRD. The results have been shown in Fig. 4a and show quite good agreement with those on CFc by DSC.
In the light of combined XRD (2θ changes) and DSC (lowering of Tm) effects on the probable looser lamella packing in the copolymers seems essential, however, at the same time, CF increases. An opposite behaviour would be expected in general; whereas, it has been observed before for complex systems, such as copolymers.67,76,79 This non-trivial situation here, regarding crystallization, suggests that the mechanisms of chain-folding (lamellae) or/and the inter-chain interaction, probably also the nucleation, in the case of the present copolymers is different as compared to homopolymers.
In the case of PCL(75%)-b-PIS(25%) shown in Fig. 4a, the mismatch between CFc and CFXRD is worth noting. The mismatch seems to exist even when considering together the uncertainties in the estimation of CFXRD (±0.01) and CFc (±0.05). This could be, in principle, due to the different techniques and the far different methods of calculation of crystalline fractions. Except for these, we should not ignore the presence of significant amounts of amorphous segments (PIS) in between the segments (PCL-rich) interfering in the crystallization process. Also, in some cases, XRD is known to be less sensitive in delicate/weak changes in crystallinity80 (and references therein).
A final comment on XRD, refers to a diffraction peak recorded at 27.2° in neat PIS. A similar peak is recorded in PCL-25%PIS at 27.0°. The measurements have been repeated to check the recordings and the peaks were recorded again. The origin of these two peaks is unknown and mainly unexpected, as they seem to arise from PIS, which, is, nevertheless, amorphous. Unfortunately, we could not propose anything on the origin of the peak, since this is a relatively novel polymer, the available data in the literature are limited and there are no similar recordings for comparison.
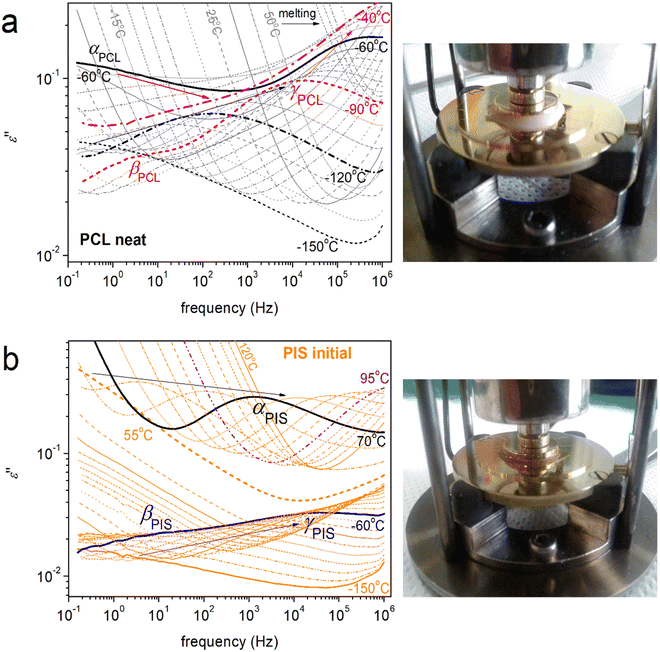
At this point, we turn our attention to molecular mobility as studied by BDS. The results by BDS are discussed on the basis of the frequency, f, and temperature, T, dependence of ε′′ (imaginary permittivity), which is related to the dielectric loss. In Fig. 8a and b, we present the raw results for neat PCL and initial PIS. Therein, we record in the form of ε′′(f) peaks the various types of dielectric relaxations, related directly to the relaxation times of the molecular groups. The relaxation processes are categorized into the local ones, recorded in general at temperatures below Tg, exhibiting low contributions to the permittivity and named with the Greek letters β, γ, etc.,81,82 whereas, the segmental (large scale) ones, are recorded at T ≥ Tg, named α.82,83 The α relaxations are related to the glass transition and, as expected, contribute more strongly to the dielectric signal. In polymers, there is a qualitative difference between the glass transition as recorded by calorimetry (static) and by dynamical techniques (dynamic, α relaxation). However, the static glass transition is due to collective chain segment mobility with relaxation times of ∼100 s, the dynamic α relaxation screens the molecular mobility of the chain, moreover, for various relaxation times (dynamics).84,85 In some cases of polymers of relatively short chains, including PCL, another segmental-related process can be recorded, i.e., the so-called Normal Mode.86
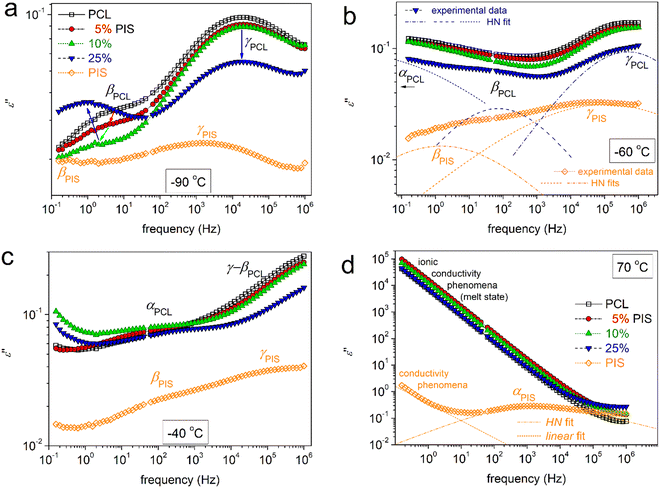
In neat PCL (Fig. 8a), at T between −150 and −50 °C, the γPCL and βPCL relaxations are recorded, arising from the mobility of local PCL molecular groups. Examples of fitting (HN model, eqn 4) of all processes are presented in Fig. 9. γPCL has been proposed to originate on dipole moments arising from rotations (crankshaft-type) of the non-bound carbonyls on the PCL backbone.81,87,88 Due to the latter, a connection of this local mobility with the segmental one is considered,82 similarly to many other polyesters (lactide-, furan-, vanillate-based).89–91 The connection is monitored, among others, via the sharp increase in its strength and changes in its overall time scale when T approaches Tg on heating (Fig. 8a). The time scale of γPCL has been found independent of Mn,48 whereas it exhibits a general increase in magnitude, Δε, with increasing Mn. The activation energy for γPCL is Eact = 0.36 eV. At higher temperatures/lower frequencies, the weaker βPCL is recorded with Eact ∼ 0.5 eV. βPCL has been attributed to chain crankshaft motions in the amorphous and crystalline phase by Vanderschueren et al.88 Grimau et al.82 showed that the strength of βPCL increases upon hydration whereas it is independent of Mn.48 The relaxation has also been categorized as a process of the so-called Johari–Goldstein -type.82,92 Finally, at around −60 °C, the segmental αPCL relaxation enters our frequency window (Fig. 8a). In general, for all polymers, the relaxation arises from dipole moments perpendicular to the polymer chains, subsequently, it screens the cooperative motions of the polymer chains in the rubbery state.69 The fragility of αPCL was mα = 75 (Table 2), denoting a weak level of chain–chain cooperativity, most probably due to the semicrystalline character of the polymer.48,93,94 With the increase of temperature, αPCL migrates fast to higher frequencies and the low-frequency becomes dominated by strong signal uptake, due to the involvement of strong effects related to ionic conductivity and interfacial charge effects.69,95 Examples are shown in Section S1 ESI† (Fig. S2).
| T g,DSC (°C) | T g,diel (°C) | m α (°C) | α HN | β HN | Δεαb | |
|---|---|---|---|---|---|---|
| a Refers to time scale of α relaxation upon stabilization of crystallization. b The arrows mark the effects recorded with increasing temperature. | ||||||
| PCL (neat) | −66 | −54 | 75 | ∼0.30 | 1 | 0.6 → 0.3 |
| PCL(95%)-b-PIS(5%) | −67 | −56 | 69 | ∼0.28 | 1 | 1.0 → 0.6 |
| PCL(90%)-b-PIS(10%) | −66 | −62 | 63 | ∼0.30 | 1 | 1.0 → 0.4 |
| PCL(75%)-b-PIS(25%) | −66 | −65 | 62 | ∼0.26 | 1 | 0.9 → 0.6 |
| PIS (initial) | 51 | 52 | 175 | 0.52 → 0.47 | ∼0.65 | 1.4 → 2.2 |
Regarding initial PIS, the ε′′(f, T) is presented in Fig. 8b. Please note that, in contrast to PCL, PIS is amorphous, whereas its dielectric relaxation spectra are shown here for the first time. Two local-like and one segmental relaxations are recorded within PIS. The faster relaxation is named here as γPIS, observed in a temperature range from −130 to −50 °C. γPIS could be fitted well with the symmetric HN term (eqn (4)) with αHN ∼ 0.2–0.3 and βHN = 1. The process exhibits an Eact equalling 0.43 eV. γPIS should monitor the most localized motion of PIS, however, due to the lack of similar data in the literature, we could not conclude its molecular origin. Following γPIS, the slower by ∼4 order of f-magnitude and slightly weaker βPIS is recorded at temperatures from about −80 to −50 °C. βPIS was fitted by a HN term with αHN ∼ 0.31 and βHN = 1 (Fig. 9). The Eact of βPIS is relatively high, ∼0.8 eV, denoting a more ‘difficult/rigid’ relaxation of the corresponding molecular unit. βPIS could possibly correlate with the coupled tetrahydrofuran rings of PIS, in part or in whole (Fig. 1). Finally, the strong segmental αPIS is recorded at temperatures from 55 to 95 °C. αPIS exhibits an asymmetric ε′′(f) peak, as expected for amorphous mobility.69,96 The corresponding HN shape parameters are αHN ∼ 0.5 and βHN = 0.65. The fragility of αPIS was estimated as mα = 175 (Table 2).
To directly assess the copolymer composition effects on molecular mobility, we present selected results in comparative isothermal ε′′(f) plots of Fig. 9. The same results are replotted as comparative isochronal ε′′(T) plots and shown in Fig. 10. This latter form of presentation enables a more direct comparison with the calorimetric data. Fig. 10a shows the isochronal ε′′(T) at the lowest frequency of measurement of ∼0.1 Hz, the excellent agreement and temperature coincidence of the calorimetric glass transition (step) with the dielectric one (α relaxation peak). The coincidence is due to low frequency which is comparable to the equivalent frequency of DSC (10−2.8 Hz or else, relaxation time ∼100 s). In the said figures, we follow that, within the copolymers, the local and segmental relaxations of PCL dominate the signal, since the latter is the majority. However, it is interesting that the αPIS relaxation cannot be resolved in the copolymers (Fig. 9d and 10). We recall results by DSC, in particular the insets to Fig. 3a and 5a, within which a glass transition step of PIS was recorded for PCL(75%)-b-PIS(25%). We can assume that the corresponding αPIS relaxation is present here, however, is cloaked by the strong conductivity of PCL (Fig. 9d and 10). This is a strong indication that the PCL-phase is continuous throughout the whole sample volume for all copolymer compositions. This continuity is not disturbed by the PIS phase, which is glassy between for low Ts and up to ∼50 °C.
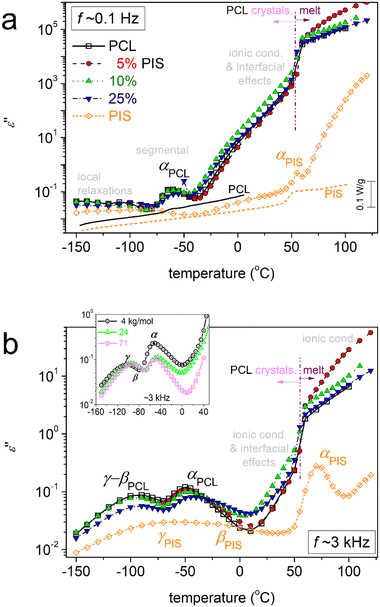 | ||
| Fig. 10 Comparative isochronal curves of ε′′ against temperature for all samples, indicated the main recorded relaxation processes (peaks of ε′′) and the conductivity related phenomena at higher temperatures. The results are shown for two selected frequencies (a) ∼0.1 Hz and (b) ∼3 kHz. In (a), the BDS data (left axis) are directly compared with the calorimetric ones (right axis) for neat PCL and initial PIS. In the inset to (b) we compare with corresponding results on neat PCLs prepared by ROP for a wide range of Mns (4–71 kg mol−1) from a recent work by our group.48 | ||
This thus provides strong indications that the distribution of PCL and PIS is excellent for 5 and 10% PIS, whereas, for 25%PIS, PIS can be organized in nanodomains that are also well distributed within the copolymer volume. These data provide support for the successful synthesis of the copolymers, as in previous works on other co-polyesters,58,67,76 while, from the methodological point of view, they prove the power of BDS as a tool for studying the structure–property relationship in polymers.
On the critical analysis of the complex spectra, shown in Fig. 9, we were able to construct the molecular mobility map that shows the time scale for all relaxations, in terms of the peak frequency maxima, log![[thin space (1/6-em)]](https://www.rsc.org/images/entities/char_2009.gif) fmax, against the inverse temperature, 1000/T (else called Arrhenius plots). These data are shown in Fig. 11.
fmax, against the inverse temperature, 1000/T (else called Arrhenius plots). These data are shown in Fig. 11.
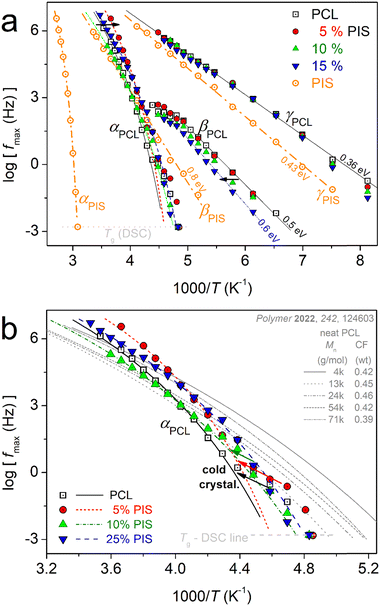 | ||
| Fig. 11 Molecular mobility map (Arrhenius plots) for all samples, within (a) the overall temperature range and (b) focusing on the PCL segmental mobility (αPCL relaxation). The added straight and curved lines connecting the experimental data points are fittings of the Arrhenius and Vogel–Fulcher–Tammann–Hesse equations. In (b, grey lines), we have added for comparison the results on neat PCL of various Mn, adapted from Ref. 48 with permission from Elsevier. | ||
In Fig. 11a, the different compositions of the copolymers does not seem to affect the time scale of γPCL, whereas, the addition of PIS leads to an acceleration of βPCL. Neither of these relaxations is expected to change with Mn alternation.48 The acceleration of βPCL is accompanied by systematic suppression of its strength, Δε, from ∼0.6 in PCL down to 0.2 in PCL(75%)-b-PIS(25%). At the same time, we recall the monotonic increase in CF (Fig. 4a). From that, we may conclude that βPCL is activated within the amorphous PCL domains. The suppressed Δε should not be due to increased interchain interactions, as in such case its time scale would be in general hindered and that would be incompatible with the recorded acceleration of βPCL.
The attention is now brought to segmental relaxation. Fig. 11b focuses on αPCL. We recall that the BDS data are recorded isothermally at each T and at gradually increasing temperatures. As can be seen in Fig. 11b, during the initial temperatures (closer to Tg) the time scale points for αPCL coincide well with the calorimetric Tg. As T increases, a disturbance-like change and a migration toward decelerated dynamics are recorded. This is due to the isothermal stay for some minutes at T where the polymer chains have become mobile (rubbery state) and most probably annealing of crystallization or additional cold crystallization take place.48 Thus, crystal rearrangements97,98 and/or additional growth is expected. This occurs in all cases of PCL-based samples. Please note that in DSC upon continuous heating, we have not recorded a significant exothermal event above Tg denoting cold crystallization. Among others this shows the high resolving power of BDS, being sensitive to such delicate polymer-phase changes.
So, only the experimental data for αPCL upon completion of crystal annealing have been fitted to the VFTH model (eqn 6).73 The fitting results are shown in Fig. 11b, as curved lines, which are characteristic of cooperative relaxations. The fitting involved the locking of the f0,VFTH parameter to the phonon frequency (1013 Hz).69,99 From the extrapolation of these curves to the equivalent frequency of conventional DSC (feq ∼ 10−2.8 Hz), we estimate the so-called ‘dielectric glass transition temperature’, Tg,diel. Also, from the evaluated fragility strength parameter of eqn 6, we calculated the fragility index, mα,99 which can be used as the measure of chains’ cooperativity. The results on Tg,diel and mα are listed in Table 2 and are presented in comparison to the calorimetric Tg in Fig. 12.
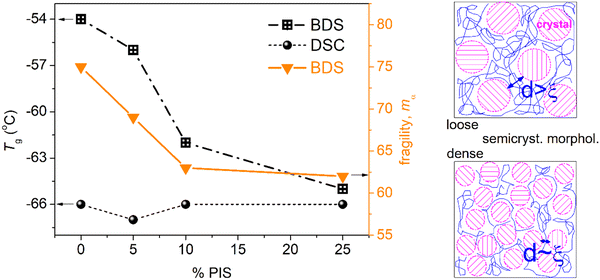
In Fig. 12, we follow a monotonic decrease in Tg,diel simultaneously with a decrease in mα. Both results can be compatible with the shortening of the average chain length in the copolymers. However, we should always take into account the existence of an important crystalline fraction.
Coming back to Fig. 11b, therein, we compare the data of the present work with those of neat PCLs prepared by ROP and of various Mns.48 The latter results correspond again to semicrystalline PCLs of CFs from 0.39 to 0.46 wt.48 Therein, with the exception of the lowest Mn (∼4 kg mol−1), the semicrystalline morphology was much denser as compared to the present PCL-based samples. As a result, the corresponding Tg,diel as well as mα had been recorded to be significantly smaller, namely, Tg,diel between −71 and −80 °C and mα between 39 and 42. These data have been interpreted in terms of systematic increasing effects of spatial nanoconfinement of the amorphous mobile chains between the PCL crystals.48
Adopting a similar scenario here, we propose that the decrease of Tg,diel and mα here, arises from spatial confinement of the chains between the crystals (milder compared to that of the previous work48). The said confinement is expected to arise from the formation of small/narrow amorphous polymer zones between the crystallites. To help the discussion, we visualized the situation by the scheme shown at the right side of Fig. 12. In order for the confinement to be effective, the average width, d, of these amorphous zones should be comparable to the chains’ cooperativity length, ξ, namely, a few nm48,83,100 (and references therein). Obviously, this cannot be checked by the present techniques. On the other hand, the effects of the expected decrease in Mn in the copolymers should be mainly indirect, via imposing direct effects on the rate and crystalline fraction. Except for the concept of crystals-related spatial confinement (scheme in Fig. 12), other complex scenarios could be employed to explain the dynamics situation. For example, special chain topology alternations in the copolymers and the existence of significant numbers of separated nano-phases, within which the constraints imposed on the polymer chains lead to suppression in the chain cooperativity. For the time being, only assumptions can be made, as these are quite delicate points that cannot be easily assessed by conventional techniques, especially when involving effects on the nanoscale. Small angle X-ray scattering (SAXS) could illuminate these aspect point71,72 in the future.
Compatible to the aforementioned spatial confinement, may be the increase in the free volume101 of the amorphous phase leads to the increase of the interchain distances. Such results could be interesting from the point of view of manipulating the air (oxygen) and water sorption, subsequently, to favour the compostability of our copolymers.
Such aspects as well as others referring, e.g., to the mechanical performance and thermal conductivity can be illuminated in future work. Along these, an in-depth structural characterization of PCL-b-PIS copolymers and degradation studies are in progress and will be soon reported.
4. Conclusions
In this work, we investigated the molecular mobility and thermal transitions in novel PCL – PIS block copolymers, with semicrystalline PCL being the majority. Due to the latter, the properties of PCL were found to govern the final material properties, from local to segmental mobilities, ionic conductivity and crystallinity. The impact of PIS, an amorphous renewable polymer exhibiting high Tg, was found to be indirect, in the sense of contributing to the lowering of the PCL block length and facilitating a certain chain topology. As a result, the segmental mobility of PCL chains was found to accelerate, demonstrating lower cooperativity. The mobility of PCL in the copolymers was found to be altered, in comparison to neat PCL (of various Mn values), and this again arises from the synthetic route. Subsequently, the indirect effects led to a moderately enhanced crystal nucleation and a worth noting increase in the crystalline fraction. On the other hand, compared with neat PCL, there are differences recorded in the structure of the crystals, consisting, for example, of looser lamellae. These outcomes are expected to play significant roles in the final properties of our materials, e.g., on the mechanical performance, thermal conductivity, gases and small molecule permeation, compostability, etc., that are exploitable within many applications regarding polymeric materials.31,102,103 Such issues are worth studying in the future, considering the sustainable character of the said polymers. From the methodological point of view, in accordance with previous works on co-polyesters synthesized by similar strategies,58,67,76 we showed that the combination of the employed techniques (BDS, DSC, etc.)104 in addition to careful analysis of as many parameters as possible, is able to provide a structure/topology/inter-chain association view of complex polymeric materials that cannot be easily discerned via optical microscopy or other structure techniques. Moreover, once again, we conclude that implementing a synthetic strategy for co-polyesters is found to be successful regarding the achievement of homogeneous systems.Author contributions
Chaima Bouyahya: investigation, formal analysis, resources, and writing – review and editing. Nikolaos D. Bikiaris: investigation, validation, and writing – review and editing. Alexandra Zamboulis: investigation, formal analysis, validation, and writing – review and editing. Apostolos Kyritsis: resources, validation, and writing – review and editing. Mustapha Majdoub: resources, validation, and writing – review and editing. Panagiotis A. Klonos: conceptualization, methodology, investigation, formal analysis, visualization, and writing – original draft.Data availability
The raw/processed data required to reproduce these findings cannot be shared at this time due to technical or time limitations.Conflicts of interest
There are no conflicts to declare.Acknowledgements
This work was developed within the scope of the ERASMUS+ project between the University of Monastir and the Aristotle University of Thessaloniki. P. A. K. would like to thank Dr Daniel Fragiadakis (Naval Research Laboratory, Polymer Physics Section, Washington DSC, USA) for the provision of the sophisticated data analysis software ‘Grafity’ (http://grafitylabs.com/).References
- H. G. Elias, An introduction to polymer science, VCH, Weinheim, 1997 Search PubMed.
- M. Chanda and S. K. Roy, Industrial polymers, specialty polymers, and their applications, CRC Press, Boca Raton, 2008 Search PubMed.
- S. J. Rowan, ACS Macro Lett., 2021, 10, 466–468 CrossRef CAS PubMed.
- P. Pan and Y. Inoue, Prog. Polym. Sci., 2009, 34, 605–640 CrossRef CAS.
- A. Lendlein and A. Sisson, Handbook of biodegradable polymers: isolation, synthesis, characterization and applications, Wiley-VCH, Weinheim, Germany, 2011 Search PubMed.
- M. Tanaka, K. Sato, E. Kitakami, S. Kobayashi, T. Hoshiba and K. Fukushima, Polym. J., 2015, 47, 114–121 CrossRef CAS.
- L. Sisti, G. Totaro and P. Marchese, PBS makes its entrance into the family of biobased plastics, John Wiley & Sons, Hobocan, NJ, USA, 2016 Search PubMed.
- E. Balla, V. Daniilidis, G. Karlioti, T. Kalamas, M. Stefanidou, N. D. Bikiaris, A. Vlachopoulos, I. Koumentakou and D. N. Bikiaris, Polymers, 2021, 13, 1822 CrossRef CAS PubMed.
- S. Saeidlou, M. A. Huneault, H. Li and C. B. Park, Prog. Polym. Sci., 2012, 37, 1657–1677 CrossRef CAS.
- I. Armentano, N. Bitinis, E. Fortunati, S. Mattioli, N. Rescignano, R. Verdejo, M. A. Lopez-Manchado and J. M. Kenny, Prog. Polym. Sci., 2013, 38, 1720–1747 CrossRef CAS.
- Y. Ikada and H. Tsuji, Macromol. Rapid Commun., 2000, 21, 117–132 CrossRef CAS.
- C. K. Williams, Chem. Soc. Rev., 2007, 36, 1573–1580 RSC.
- M. Ebara, K. Uto, N. Idota, J. M. Hoffman and T. Aoyagi, Soft Matter, 2013, 9, 3074–3080 RSC.
- Y. Zhu, C. Romain and C. K. Williams, Nature, 2016, 540, 354–362 CrossRef CAS PubMed.
- G. Z. Papageorgiou, Polymers, 2018, 10, 952 CrossRef PubMed.
- T. Fujimaki, Polym. Degrad. Stab., 1998, 59, 209–214 CrossRef CAS.
- M. Lahcini, H. Qayouh, T. Yashiro, P. Simon and H. R. Kricheldorf, J. Macromol. Sci., Part A: Pure Appl.Chem., 2010, 47, 503–509 CrossRef CAS.
- A. Zamboulis, E. A. Nakiou, E. Christodoulou, D. N. Bikiaris, E. Kontonasaki, L. Liverani and A. R. Boccaccini, Int. J. Mol. Sci., 2019, 20, 6210 CrossRef CAS.
- G. Z. Papageorgiou, D. G. Papageorgiou, Z. Terzopoulou and D. N. Bikiaris, Eur. Polym. J., 2016, 83, 202–229 CrossRef CAS.
- Z. Terzopoulou, L. Papadopoulos, A. Zamboulis, D. G. Papageorgiou, G. Z. Papageorgiou and D. N. Bikiaris, Polymers, 2020, 12, 1209 CrossRef CAS PubMed.
- E. Xanthopoulou, Z. Terzopoulou, A. Zamboulis, L. Papadopoulos, K. Tsongas, D. Tzetzis, G. Z. Papageorgiou and D. N. Bikiaris, ACS Sustainable Chem. Eng., 2021, 9, 1383–1397 CrossRef CAS.
- M. Hong and E. Y. X. Chen, Green Chem., 2017, 19, 3692–3706 RSC.
- W. Post, A. Susa, R. Blaauw, K. Molenveld and R. J. I. Knoop, Polym. Rev., 2020, 60, 359–388 CrossRef CAS.
- G. Rizis, T. G. van de Ven and A. Eisenberg, Soft Matter, 2014, 10, 2825–2835 RSC.
- I. Arandia, A. Mugica, M. Zubitur, R. Mincheva, P. Dubois, A. J. Müller and A. Alegría, Macromolecules, 2017, 50, 1569–1578 CrossRef CAS.
- Y. Yu, Z. Wei, Y. Liu, Z. Hua, X. Leng and Y. Li, Eur. Polym. J., 2018, 105, 274–285 CrossRef CAS.
- M. Safari, A. Mugica, M. Zubitur, A. Martínez de Ilarduya, S. Muñoz-Guerra and A. J. Müller, Polymers, 2020, 12, 17 CrossRef CAS PubMed.
- S. Nanaki, A. Viziridou, A. Zamboulis, M. Kostoglou, G. Z. Papageorgiou and D. N. Bikiaris, Polymers, 2020, 12, 852 CrossRef CAS PubMed.
- J. M. Raquez, Y. Habibi, M. Murariu and P. Dubois, Prog. Polym. Sci., 2013, 38, 1504 CrossRef CAS.
- T. P. Gumede, A. S. Luyt and A. J. Müller, eXPRESS Polym. Lett., 2018, 12, 505–529 CrossRef CAS.
- L. Calandrelli, M. Annunziata, F. Della Ragione, P. Laurenzo, M. Malinconico and A. Oliva, J. Mater. Sci.: Mater. Med., 2010, 21, 2923–2936 CrossRef CAS PubMed.
- P. A. Klonos, M. Lazaridou, Ch Samiotaki, A. Kyritsis and D. N. Bikiaris, Polymer, 2022, 259, 125329 CrossRef CAS.
- S. Fakirov, Biodegradable polyesters, JohnWiley & Sons, Auckland, New Zealand, 2015 Search PubMed.
- I. Manavitehrani, A. Fathi, H. Badr, S. Daly, A. Negahi Shirazi and F. Dehghani, Polymers, 2016, 8, 20 CrossRef.
- G. Fleche and M. Huchette, Starch-Starke, 1986, 38, 26–30 CrossRef CAS.
- W. Fang, F. Xu, Y. Zhang, Z. Zhang, Z. Yang, W. Wang, H. He and Y. Luo, Catal. Sci. Technol., 2022, 12, 1756–1765 RSC.
- S. Laanesoo, O. Bonjour, J. Parve, O. Parve, L. Matt, L. Vares and P. Jannasch, Biomacromolecules, 2021, 22, 640–648 CrossRef CAS PubMed.
- L. Feng, W. Zhu, W. Zhou, C. Li, D. Zhang, Y. Xiao and L. Zheng, Polym. Chem., 2015, 6, 7470–7479 RSC.
- Z. Terzopoulou, N. Kasmi, V. Tsanaktsis, N. Doulakas, D. N. Bikiaris, D. A. Achilias and G. Z. Papageorgiou, Materials, 2017, 10, 801 CrossRef.
- Y. Wang, C. J. E. Davey, K. van der Maas, R. J. van Putten, A. Tietema, J. R. Parsons and G. J. M. Gruter, Sci. Total Environ., 2022, 815, 152781 CrossRef CAS PubMed.
- N. Hammami, M. Majdoub and J. P. Habas, Eur. Polym. J., 2017, 93, 795–804 CrossRef CAS.
- N. Hammami, N. Jarroux, M. Robitzer, M. Majdoub and J. P. Habas, Polymers, 2016, 8, 294 CrossRef PubMed.
- S. Benali and P. Dubois, in Environmental silicate nano-biocomposites, green energy and technology, ed. L. Avérous and E. Pollet, Springer-Verlag, London, 2012, ch. 5, p. 119 Search PubMed.
- L. N. Woodard and M. A. Grunlan, ACS Macro Lett., 2018, 7, 976–982 CrossRef CAS PubMed.
- A. C. Albertsson, Adv. Polym. Sci., 2002, 157, 1–179 CrossRef CAS.
- Y. Wang, B. Liu, X. Wang, W. Zhao, D. Liu, X. Liu and D. Cui, Polym. Chem., 2014, 5, 4580–4588 RSC.
- M. C. Righetti, Materials, 2017, 10, 442 CrossRef.
- P. A. Klonos, N. D. Bikiaris, E. Christodoulou, A. Zamboulis, G. Z. Papageorgiou and A. Kyritsis, Polymer, 2022, 242, 124603 CrossRef CAS.
- J. Lin, S. Shenogin and S. Nazarenko, Polymer, 2002, 43, 4733–4743 CrossRef CAS.
- P. A. Klonos, S. N. Tegopoulos, C. S. Koutsiara, E. Kontou, P. Pissis and A. Kyritsis, Soft Matter, 2019, 18, 1813–1824 RSC.
- P. A. Klonos, V. Peoglos, D. N. Bikiaris and A. Kyritsis, J. Phys. Chem. C, 2020, 123, 5469–5479 CrossRef.
- A. Toda, R. Androsch and C. Schick, Polymer, 2016, 91, 239–263 CrossRef CAS.
- A. Wurm, E. Zhuravlev, K. Eckstein, D. Jehnichen, D. Pospiech, R. Androsch, B. Wunderlich and C. Schick, Macromolecules, 2012, 45, 3816–3828 CrossRef CAS.
- R. A. Pérez, M. E. Córdova, J. V. López, J. N. Hoskins, B. Zhang, S. M. Grayson and A. J. Müller, React. Funct. Polym., 2014, 80, 71–82 CrossRef.
- L. Sangroniz, R. G. Alamo, D. Cavallo, A. Santamaría, A. J. Müller and A. Alegría, Macromolecules, 2018, 51, 3663–3671 CrossRef CAS.
- J. Wang, M. K. Cheung and Y. Mi, Polymer, 2002, 43, 1357–1364 CrossRef CAS.
- M. F. Koenig and S. J. Huang, Polymer, 1995, 36, 1877–1882 CrossRef CAS.
- E. Christodoulou, P. A. Klonos, K. Tsachouridis, A. Zamboulis, A. Kyritsis and D. N. Bikiaris, Soft Matter, 2020, 16, 8187–8201 RSC.
- P. B. Messersmith and E. P. Giannelis, J. Polym. Sci., Part A: Polym. Chem., 1995, 33, 1047–1057 CrossRef CAS.
- D. J. A. Cameron and M. P. Shaver, Chem. Soc. Rev., 2011, 40, 1761–1776 RSC.
- H. Zhang and M. W. Grinstaff, Macromol. Rapid Commun., 2014, 35, 1906–1924 CrossRef CAS PubMed.
- S. G. Nanaki, G. Z. Papageorgiou and D. N. Bikiaris, J. Therm. Anal. Calorim., 2012, 108, 633–645 CrossRef CAS.
- A. Schönhals and P. Szymoniak, Dynamics of composite materials, Springer, Cham, Switzerland, 2022 Search PubMed.
- M. A. Woodruff and D. W. Hutmacher, Prog. Polym. Sci., 2010, 35, 1217–1256 CrossRef CAS.
- E. Roumeli, D. G. Papageorgiou, V. Tsanaktsis, Z. Terzopoulou, K. Chrissafis, A. Avgeropoulos and D. Bikiaris, ACS Appl. Mater. Interfaces, 2015, 7, 11683–11694 CrossRef CAS PubMed.
- Z. Terzopoulou, A. Zamboulis, D. N. Bikiaris, M. A. Valera and A. Mangas, Polymers, 2021, 13, 4121 CrossRef CAS PubMed.
- V. Karava, A. Siamidi, M. Vlachou, E. Christodoulou, A. Zamboulis, D. N. Bikiaris, A. Kyritsis and P. A. Klonos, Soft Matter, 2021, 17, 2439–2453 RSC.
- V. Crescenzi, G. Manzini, G. Calzolari and C. Borri, Eur. Polym. J., 1972, 8, 449–463 CrossRef CAS.
- F. Kremer and F. Schönhals, Broadband dielectric spectroscopy, Springer-Verlag, Berlin, 2002 Search PubMed.
- G. P. Baeza, C. Dessi, S. Constanzo, D. Zhao, S. Gong, A. Alegria, R. H. Colby, M. Rubinstein, D. Vlassopoulos and S. K. Kumar, Nat. Commun., 2016, 7, 11368 CrossRef PubMed.
- A. C. Genix, V. Bocharova, B. Carroll, M. Lehmann, T. Saito, S. Krueger, L. He, P. Dieudonné-George, A. P. Sokolov and J. Oberdisse, ACS Appl. Mater. Interfaces, 2019, 11, 17863–17872 CrossRef CAS PubMed.
- A. P. Holt, P. J. Griffin, V. BOcharova, A. L. Agapov, A. E. Imel, M. D. Dadmun, J. R. Sangoro and A. P. Sokolov, Macromolecules, 2014, 47, 1837–1843 CrossRef CAS.
- R. Boehmer, K. Ngai, C. A. Angell and D. J. Plazek, J. Chem. Phys., 1993, 99, 4201–4209 CrossRef CAS.
- S. Koutsoumpis, A. Poulakis, P. Klonos, S. Kripotou, V. Tsanaktsis, D. N. Bikiaris, A. Kyritsis and P. Pissis, Thermochim. Acta, 2018, 666, 229–240 CrossRef CAS.
- A. De Almeida, M. Nébouy and P. Baeza, Macromolecules, 2019, 52, 1227–1240 CrossRef.
- P. A. Klonos, Z. Terzopoulou, A. Zamboulis, M. A. Valera, A. Mangas, A. Kyritsis, P. Pissis and D. N. Bikiaris, Soft Matter, 2022, 18, 3725–3737 RSC.
- M. E. Córdova, A. T. Lorenzo, A. J. Müller, J. N. Hoskins and S. M. Grayson, Macromolecules, 2011, 44, 1742–1746 CrossRef.
- M. S. S. B. Monteiro, F. V. Chávez, P. J. Sebastião and M. I. B. Tavares, Polym. Test., 2013, 32, 553–566 CrossRef CAS.
- L. Papadopoulos, P. A. Klonos, M. Kluge, A. Zamboulis, Z. Terzopoulou, D. Kourtidou, A. Magaziotis, K. Chrissafis, A. Kyritsis, D. N. Bikiaris and T. Robert, Polym. Chem., 2021, 12, 5518–5534 RSC.
- M. Doumeng, L. Makhlouf, F. Berthet, O. Marsan, K. Delbé and F. Chabert, Polym. Test., 2021, 93, 106878 CrossRef CAS.
- R. Sabater i Serra, J. L. Escobar Ivirico, J. M. Meseguer Dueñas, A. Andrio Balado, J. L. Gómez Ribeller and M. Salmerón Sánchez, Eur. Phys. J. E: Soft Matter Biol. Phys., 2007, 22, 293–302 CrossRef CAS PubMed.
- M. Grimau, E. Laredo, Y. M. C. Pérez and A. Bello, J. Chem. Phys., 2001, 114, 6417–6425 CrossRef CAS.
- Y. Suzuki, H. Duran, W. Akram, M. Steinhart, G. Floudas and H. J. Butt, Soft Matter, 2013, 9, 9189–9198 RSC.
- J. Hintermeyer, A. Herrmann, R. Kahlau, C. Goiceanu and E. A. Rössler, Macromolecules, 2008, 41, 9335–9344 CrossRef CAS.
- A. Alegría, E. Guerrica-Echevarría, L. Goitiandía, I. Tellería and J. Colmenero, Macromolecules, 1995, 28, 1516–1527 CrossRef.
- O. Urakawa, K. Adachi, T. Kotaka, Y. Takemoto and H. Yasuda, Macromolecules, 1994, 27, 7410–7414 CrossRef CAS.
- K. A. Masser, H. Yuan, A. Karim and C. R. Snyder, Macromolecules, 2013, 46, 2235–2240 CrossRef CAS.
- J. Vanderschueren, M. Ladang and J. M. Heuschen, Macromolecules, 1980, 13, 973–977 CrossRef CAS.
- P. A. Klonos, D. N. Bikiaris and A. Kyritsis, in Dynamics of composite materials, ed. A. Schönhals and P. Szymoniak, Springer, Cham, 2022, pp. 87–121 Search PubMed.
- E. Xanthopoulou, P. A. Klonos, A. Zamboulis, Z. Terzopoulou, A. Kyritsis, P. Pissis, D. N. Bikiaris and G. Z. Papageorgiou, Polymer, 2021, 233, 124197 CrossRef CAS.
- D. Kourtidou, P. A. Klonos, L. Papadopoulos, A. Kyritsis, D. N. Bikiaris and C. Chrissafis, Soft Matter, 2021, 17, 5815–5828 RSC.
- G. P. Johari and M. Goldstein, J. Chem. Phys., 1970, 53, 2372 CrossRef CAS.
- H. Papananou, E. Perivolari, K. Chrissopoulou and S. Anastasiadis, Polymer, 2018, 157, 111–121 CrossRef CAS.
- P. A. Klonos, L. Papadopoulos, M. Kasimatis, H. Iatrou, A. Kyritsis and D. N. Bikiaris, Macromolecules, 2021, 54, 1106–1119 CrossRef CAS.
- R. Richert, A. Agapov and A. P. Sokolov, J. Chem. Phys., 2011, 134, 104508 CrossRef PubMed.
- R. Lund, A. Alegría, L. Goitandia, J. Colmenero, M. A. Gonzalez and P. Lindner, Macromolecules, 2008, 41, 1364–1376 CrossRef CAS.
- A. S. Altorbaq, A. A. Krauskopf, X. Wen, R. A. Pérez-Camargo, Y. Su, D. Wang, A. J. Müller and S. K. Kumar, Prog. Polym. Sci., 2022, 128, 101527 CrossRef CAS.
- K. Bornani, N. F. Mendez, A. S. Altorbaq, A. J. Müller, Y. Lin, E. Z. Qu, K. Zhang, S. K. Kumar and L. S. Schadler, ACS Macro Lett., 2022, 11, 818–824 CrossRef CAS PubMed.
- D. Fragiadakis, P. Pissis and L. Bokobza, Polymer, 2005, 46, 6001 CrossRef CAS.
- A. Schönhals, H. Goering, C. Schick, M. Frick, M. Mayorova and R. Zorn, Eur. Phys. J.: Spec. Top., 2007, 141, 255–259 Search PubMed.
- R. M. Hodge, T. J. Bastow, G. H. Edward, G. P. Simon and A. J. Hill, Macromolecules, 1996, 29, 8137–8143 CrossRef CAS.
- C. Pandis, S. Trujillo, M. Roganowicz and J. L. Gómez Ribelles, Macromol. Symp., 2014, 341, 34–44 CrossRef CAS.
- S. G. Nanaki, K. Pantopoulos and D. N. Bikiaris, Int. J. Nanomed., 2011, 6, 2981–2995 CAS.
- P. Szymoniak, X. Qu, M. Abbasi, B. R. Pauw, S. Henning, Z. Li, D. Y. Wang, C. Schick, K. Saalwächter and A. Schönhals, Soft Matter, 2021, 17, 2775–2790 RSC.
Footnote |
| † Electronic supplementary information (ESI) available. See DOI: https://doi.org/10.1039/d2sm01198k |
| This journal is © The Royal Society of Chemistry 2022 |

