
 Open Access Article
 This Open Access Article is licensed under a Creative Commons Attribution-Non Commercial 3.0 Unported Licence
Micropatterned functional interfaces on elastic substrates fabricated by fixing out of plane deformations†
Aurora
Nogales
 *a,
Carolina
García
b,
Adolfo
del Campo
c,
Tiberio A.
Ezquerra
a and
Juan
Rodriguez-Hernández
*b
*a,
Carolina
García
b,
Adolfo
del Campo
c,
Tiberio A.
Ezquerra
a and
Juan
Rodriguez-Hernández
*b
aInstituto de Estructura de la Materia (IEM), CSIC, Serrano 121, 28006 Madrid, Spain. E-mail: aurora.nogales@csic.es
bInstituto de Ciencia y Tecnología de Polímeros (ICTP), CSIC, C/Juan de la Cierva 3, 28006-Madrid, Spain. E-mail: jrodriguez@ictp.csic.es
cInstituto de Cerámica y Vidrio (ICV), CSIC, C/Kelsen 5, 28049-Madrid, Spain
First published on 9th August 2022
Abstract
We report on the preparation of micropatterned functional surfaces produced by inducing an out-of-plane deformation on elastic substrates and fixing these by creating a rigid oxidized top layer. Specifically, the elastic substrate used was Polydimethylsiloxane (PDMS) and the rigid layer on top was created by ozonation of this material. We evidenced that the surface pattern formed is directly dependent on the pressure applied, the mechanical properties of the elastic substrate and on the dimensions and shape of the mask employed to define the exposed and non-exposed areas. In addition to the pattern formed, another interesting aspect is related to the ozone diffusion within the material. Softer PDMS enables more efficient diffusion and produced a thicker oxidized layer in comparison to rigid PDMS. Finally, a simulation was carried out using the distribution of Von Misses stresses of a solid plate to understand the conditions in which the applied force resulted in the rupture of the rigid oxidized layer under a permanent deformation.
1. Introduction
Functionality of polymer surfaces can be tuned by the combination of chemical modifications1 and the formation of surface microstructures.2 This can be achieved using either conventional or non-conventional approaches. On the one hand, conventional strategies to pattern polymer surfaces include optical lithography, soft lithography, nanoimprint lithography or electron beam lithography just to mention few of them.3 These can be considered top–down strategies and are directly related to technological developments and required the use of expensive equipment and even clean rooms.4 On the other hand, non-conventional methodologies take profit from thermodynamically driven processes, like self-assembly,5 laser processing6 or the formation of instabilities in polymer surfaces.7 Instabilities can appear spontaneously due to ambient conditions, like film destabilization and dewetting,8–12 breath figures formation of nanometer to micrometer-size formed due to condensation of water droplets,13,14 water ions15 or nanobubbles16 or thermal gradients.17–19 Also surface instabilities can be induced by applying external forces that are capable to induce surface patterning. Examples of forces driving instabilities are those induced by electric-fields,20,21 repeated short pulse laser irradiation22,23 or mechanical stretching24,25 forming wrinkled interfaces.7 In this context, it is worth mentioning that non-conventional patterning techniques present important advantages. For instance, these techniques enable the fabrication of intricate surface patterns that are rather difficult, if not impossible to obtain by conventional approaches.26 In particular, the formation of wrinkles, folds and cracks resulting from instabilities induced on thin films attached to compliant elastic substrates have been extensively investigated. Several applications have been explored for this type of surfaces. These include substrates for biorelated applications including cell growth, control of cell alignment/differentiation, generation of spheroids or antimicrobial/antifouling supports. Conducting shrinkable devices for the preparation of either electrochromic devices or organic light-emitting diodes have also been described.7,26 This type of structures are typically produced by a two-step procedure that involves: first, the formation of a rigid top layer on either pre-stretched/compressed (in one or two directions)27–29 or swollen elastic substrates30 and) second, the relaxation/shrinking of the applied compression. The result of the relaxation/shrinking induces an out-of-plane deformation that can lead to the formation of wrinkles, folds and, eventually, cracks on the rigid top surface.26,31,32 Different studies have been devoted to describe both the systematic variations of the wrinkle dimensions. Most of the works are devoted to investigate either the impact of chemical modifications or the effect of in plane deformations33,34 while out-of-plane deformation induced by perpendicular stresses is still an open subject.In this paper, we report on the pattern formation induced by perpendicular compression on PDMS elastic substrates accompanied by simultaneous surface rigidification induced by ozonation. Ultraviolet Ozonation (UVO) on polydimethylsiloxane (PDMS) have been used in order to form hydrophilic silica layers on top of the PDMS substrate. Previous studies by our group showed that, for a given PDMS formulation, the thickness of the oxidized layer formed increases during an initial period of UVO treatment it stops growing further for longer treatments.35 The penetration of the ozone within the PDMS bulk material is a critical issue of the oxidation process.36 Here we study the influence of the PDMS formulation on the properties of the silica layer. Selective patterning has been achieved by using metallic grids as masks during the UVO process. Patterning with masks of different morphology and dimensions have been investigated. We describe how the properties of the elastic substrate and the dimensions of the mask employed enable for a fine control of pattern size as well as for the control of the folds and cracks formation.
2. Experimental section
2.1 Materials
Elastic foundations were fabricated from PDMS. PDMS films were prepared using Sylgard 184 silicon elastomer (Dow Corning). Circular copper grids with square and hexagonal holes of variable sizes and pitches were purchased from Ted Pella®. The masks with square holes are labelled Mx,y, where x is the pitch size and y is the hole size. The dimensions of the used grids are listed in Table 1.| Label | Commercial name | Pitch (μm) | Side of the hole (μm) | |
|---|---|---|---|---|
| Square hole grids | ||||
| M63,38 | G400 | 63 | 38 |
|
| M25,12 | T1000 | 25 | 12 | |
| M12,7 | T2000 | 12 | 7 | |
| Hexagonal grid | ||||
| Hexagonal | 8GC360 | 63 | 25 |

|
2.2 Methods
The topography, chemical composition and distribution of exposed and non-exposed areas on the polymeric films were determined using Confocal Raman microscopy (CRM) by using a Confocal Raman Microscopy WITec Alpha 300 RA (Ulm, Germany). A Nd:YAG laser was employed working at 10 mW output power with a wavelength of 532 nm. A 100X objective (N.A: 0.95) and two different gratings of 600 and 1800 grooves per line were used. The Raman images, 100 nm pixel size, were acquired point by point by using a piezo-driven stage and an optical fiber of 25 microns in diameter acting as a pinhole to guarantee a spatial resolution better than 300 nm. The software Witec Project Plus was used to analyze the spectra and for Raman imaging. Optical Profilometry was accomplished by using a Zeta-20 optical profiler (Zeta Instruments) with different optical objectives and with 13 nm of vertical resolution.Mechanical properties were measured by dynamic compression test. Measurements were performed on different PDMS samples using a universal test system (MTS System) working in compression mode. Cylindrical samples with diameter of 3 mm and thickness of around 1.3 mm were used. The samples were placed between compression plates. Each sample was deformed to a specific compressive strain level (up to 60%) at 5 mm min−1. The measurements were performed several times for reproducibility.
Nanomechanical properties of the regions with different chemical composition, either silica or PDMS, were evaluated using a Bruker Multimode 8, with a Nanoscope V controller, by the PeakForce Quantitative Nanomechanical Mapping (PF-QNM) method. All measurements were performed in air, at room temperature. Quantitative measurements were carried out by using different probes depending on the actual mechanical properties of every sample. In particular, we used RTESPA150 and RTESPA525 probes (Bruker). Cantilever spring constants for each probe were measured by the thermal tune method and found to be around 5 N m−1 for RTESPA150 used in the characterization of the unoxidized regions and 200 N m−1 for RTESPA525 employed for the measurements on hardest UVO treated areas. Every tip radius was calibrated against appropriate standards of known elastic modulus (Bruker), considering the DMT model37 through eqn (1):
 | (1) |
 | (2) |
PF-QNM is a contact AFM protocol which is based on the force–volume method. Here, force–distance curves are collected by nanoindentation of the sample in a point-by-point fashion.39 To obtain the force-distance curves the piezo-scanner is oscillated at 2 kHz while the probe remains at rest.
2.3 Experimental procedures
![[thin space (1/6-em)]](https://www.rsc.org/images/entities/char_2009.gif) :1 to 10:1 SO/C ratios). In this way, elastomer PDMS substrates with shear moduli ranging from 0.55 MPa to 7.8 MPa, as measured by dynamical compression tests, can be prepared.
:1 to 10:1 SO/C ratios). In this way, elastomer PDMS substrates with shear moduli ranging from 0.55 MPa to 7.8 MPa, as measured by dynamical compression tests, can be prepared.
 | ||
| Fig. 1 Strategy employed to pattern elastic PDMS by using a perpendicular compressive stress. (a) Set-up employed comprising (from the bottom to the top) of a rigid support, a PDMS substrate, the grid, acting as a mask during the UVO process, and finally a 1 mm thick metallic ring. (b) Top view optical photographs of the 2 mm hole in the plate before (left) and after (right) a compression stress. Steps to produce the patterned surface including a deformation produced by compression, oxidation of the exposed areas by O3 and finally removal of the applied compressions stress. (c) Different out of plane morphology, as revealed by AFM topography, obtained after releasing compression and UVO treatment in the case of three different PDMS silicon oligomer to catalyst ratios (SO/C) as labelled on top. On the left of these panel, schematic drawing of the samples before and after UVO treatment. | ||
2.4 Simulation of the stress distribution
COMSOL Multiphysics 4.3 was utilized for the simulation and structural analysis of the solid microplates formed after UVO treatment. The Solid Mechanics interface was utilized to define the features and boundary conditions for the mechanical analysis. The simulations were performed assuming clamped plates with dimensions and mechanical properties similar to those obtained in the experiments. The effect of releasing the pressure of the system was simulated assuming a vertical force applied at the bottom surface of the plate, which can be understood as the force applied by the compliant substrate. The lateral surfaces of the plates were kept fixed. The results are presented in terms of the Von Misses stress surface. Von Misses stress is proportional to the total distortional strain energy in the material, and is considered the driving force for damage in many ductile engineering materials.40 Further details of the simulations are described in the ESI.†3. Results and discussion
The formation of micron sized patterns onto the elastic PDMS was carried out following the setup depicted in Fig. 1b.The basis of the strategy relies on the use of pressure onto a soft PDMS substrate to produce deformations on selected areas defined by the metallic grid. As depicted in Fig. 1b applying a vertical compressive stress the areas of soft PDMS in the holes of the grid are stressed and exhibit and out-of-plane deformation. This is a reversible process and the initial surface dimensions of the PDMS substrate can be recovered upon removal of the compressive stress. However, after UVO treatment, dimensional recovery upon compression removal is compromised by the rigid layer formed at the surface of the PDMS. In the following paragraph we will be describe how the surface patterns created depend on the geometry of the mask and on the mechanical properties of the PDMS.
3.1 Influence of silicon oligomer to catalyst ratio (SO/C) on the mechanical properties of the UVO exposed regions
PDMS with different Young moduli in the range of 0.55 MPa to 7.8 MPa can be obtained depending on the silicon oligomer to catalyst ratio (SO/C) of the precursors. The lower the amount of catalyst, the lower the modulus of the obtained PDMS as described in Table S1 of the ESI.† As revealed by the topography AFM images shown in Fig. 1c those PDMS substrates with lower modulus will present higher out-of-plane deformations when compressed. On the contrary, those with higher modulus will only deform to a limited extent.Fig. 2 shows the dependence of the deformation under compression as a function of the applied pressure for PDMS with different (SO/C) ratios. As observed, the lower the catalyst amount, the higher deformation obtained for similar pressures.
 | ||
Fig. 2 Compression induced in PDMS samples with different (SO/C) ratios (10:1 ( ), 20:1 ( ), 20:1 ( ) and 30:1( ) and 30:1( )). Continuous lines are guidelines. )). Continuous lines are guidelines. | ||
Once the precise deformation obtained for a certain applied pressure and its dependence on SO/C ratio, the next step involves the characterization of the UVO effects on the exposed areas. For this purpose, a PDMS surfaces was covered with at M12,7 mask and exposed to UVO under a pressure of 0.78 MPa. Fig. 3a shows Raman spectra obtained in UVO illuminated and non-illuminated areas revealing significant differences in the 400–900 cm−1 range (Fig. 3b). Chemical contrast two-dimensional maps can be obtained by using the integrated area of the 753 cm−1 band. Fig. 3d shows the Raman mapping of a selected area of the sample shown in in Fig. 3c. The results clearly indicate that the treatment is localized in the exposed areas (colored in red) whereas the areas below the mask remain unaffected (colored in blue).
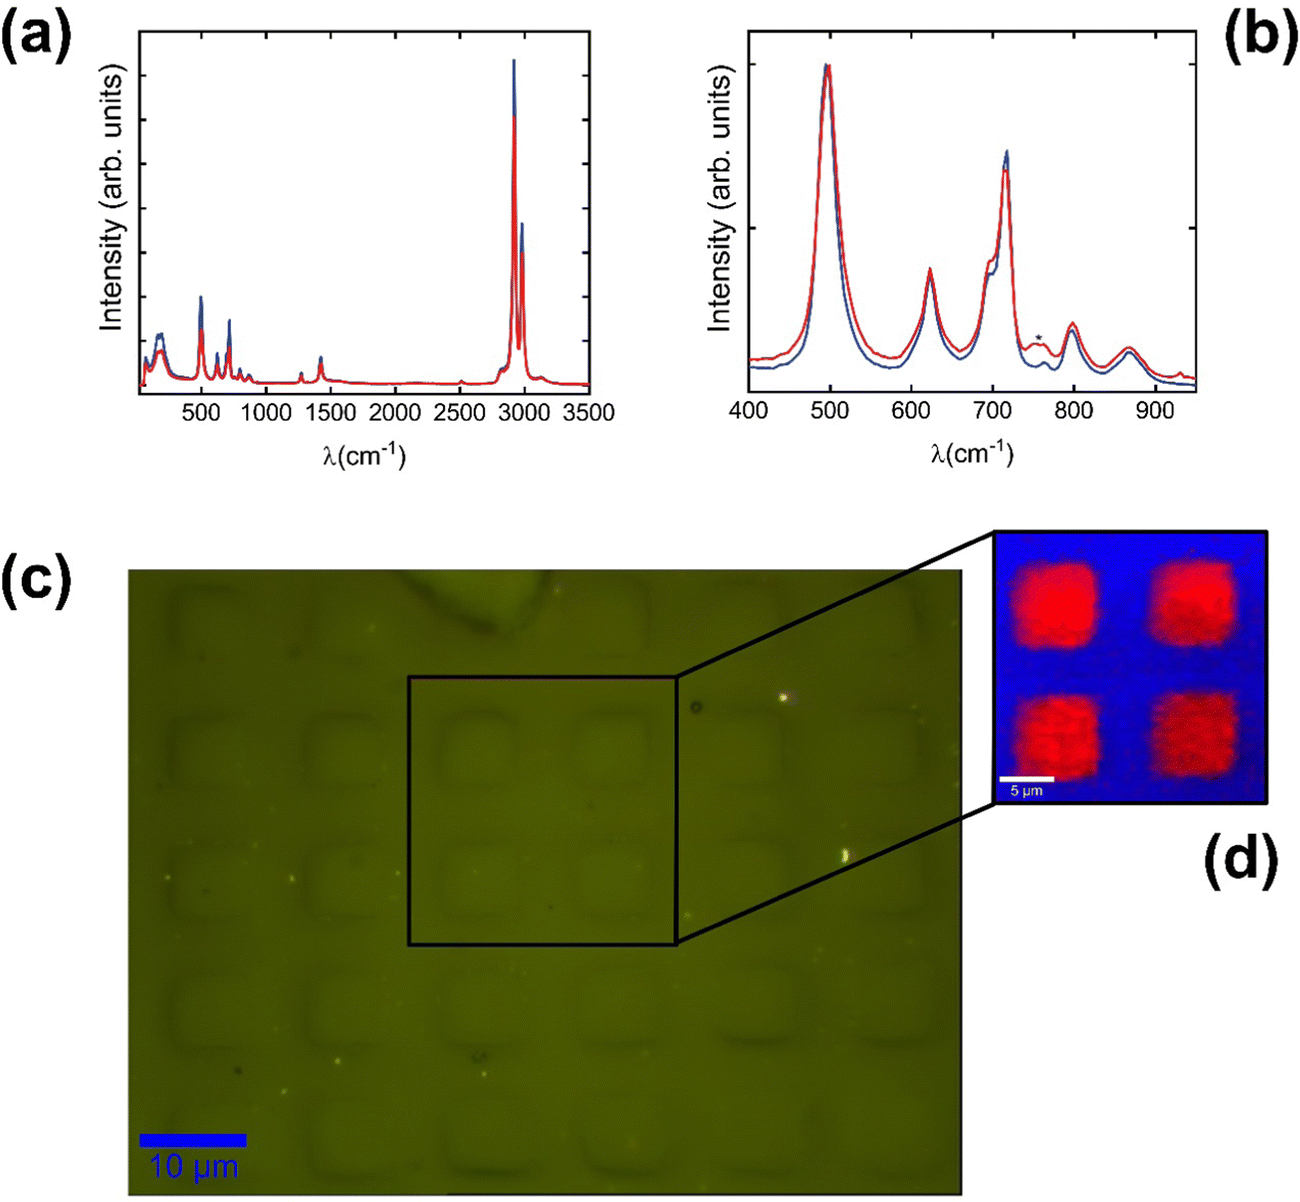 | ||
| Fig. 3 (a) Raman spectra of UVO treated (red line) and non-treated (blue line) PDMS areas. (b) Zoom of the Raman spectra (c) Optical images of a PDMS substrate treated with UVO using a T2000 mask and (d) Raman mapping using the area of the band at 753 cm−1 as reference. Red zones correspond to oxidized areas, blue regions correspond to unmodified PDMS. | ||
As expected,35 the observed variations of the chemical composition correlate with modifications of the mechanical properties of the treated areas. Areas colored in red in Fig. 3d (UVO treated region) correspond to rigid areas where a silica layer has been formed. On the contrary, those areas colored in blue (UVO shadowed by the mask) correspond to pristine PDMS.
Fig. 4 shows the QNM Young Modulus a silica layer region (UVO illuminated area under 0.78 MPa pressure) as a function of the QNM Young Modulus of the original PDMS substrate. Young modulus values for the PDMS substrates with different (SO/C) ratios are gathered in Table 1 of the ESI.† The results shown in Fig. 4 reveal a clear correlation between the Young Modulus of the original untreated PDMS substrate and those of the silica layer formed after UVO treatment. The silica layer formed presents higher modulus for softer initial PDMS samples. The inset in Fig. 4 shows, as an example, the AFM topography image and the QNM Young modulus image for the silica layer formed on a PDMS substrate (40:1 SO/C ratio) with an initial modulus of 1.0 MPa.
 | ||
| Fig. 4 QNM Young Modulus of the silica layer (QNM Eoxs) as a function of the QNM Young Modulus of the original PDMS substrate (QNM E0s). Continuous line is a guide for the eye. The inset shows AFM topography and QNM Young modulus images of a selected UVO treated area during compression (0.78 MPa, 30 min) using a mask M12,7. | ||
3.2 Effect of the PDMS silica oligomer/catalyst (SO/C) ratio on the thickness of the silica layer obtained by UVO illumination
Five different PDMS substrates prepared with different SO/C ratios and therefore, with variable Young modulus were investigated. The PDMS substrates, covered by a M12,7 grid, were compressed applying a pressure of 0.81 MPa during the UVO exposure. Fig. 5a shows in the top the optical images of the structures obtained after the process. Fig. 5a (bottom) shows the chemical contrast Raman mapping (753 cm−1) of cross sections across the direction indicated by the red lines in the optical images. Clearly, the UVO treatments produces rigid silica layers of different thicknesses depending on the type of PDMS employed. Fig. 5(a) shows the results obtained for three selected PDMS substrates with different SO/C ratios. The PDMS with lower SO/C ratio and therefore higher Young Modulus, formed a thin silica layer with a thickness below 1 μm. However, an 8 μm thickness silica region is formed in the softer PDMS with higher SO/C ratio (see Fig. 5(b)). This effect can be intuitively explained by a synergistic effect of the lower crosslinking density of the softer PDMS together with a higher capacity of deformation during the compression step. We may speculate that both aspects significantly improve the ozone diffusion inside the bulk PDMS producing higher thicknesses of the modified layer. | ||
| Fig. 5 (a) Top-view: optical images of the patterned PDMS substrates with different SO/C ratios as labelled on top. Samples were treated using a M12,7 copper grid and applying 0.81 MPa during the UVO process for 30 min. Bottom-view: Chemical contrast Raman mapping (753 cm−1) of cross sections across the direction indicated by the red lines in the optical images. Blue bar corresponds to 20 microns whereas white bar corresponds to 6 microns. (b) Thickness and (c) width (right) of the exposed (red) and the non-exposed areas (blue) as a function of the mechanical modulus of the PDMS substrates. In green, the pitch of the treated sample. Lines indicate the width of the mask used for the selected treatment. | ||
3.3 Role of the geometry of ozone treated regions on the structures formed after releasing compression
Another interesting effect in the use of PDMS prepared by different SO/C ratio is related to the possibility of tuning the dimensions of the structure formed by this method. In Fig. 5(c) the observed dependence of the width of the silica layer region as a function of the Young Modulus of the PDMS substrate is shown. A gradual increase of the size of the silica areas together with a gradual decrease of the distance between consecutive irradiated areas is observed as the modulus of the PDMS substrate decreases. Upon compression, deformations induced in the softer PDMS are significantly larger than those induced in harder PDMS. As a result, the exposed area to UVO is larger and, after the UVO treatment and stress release, the rigid layer formed accommodates differently. For that, the rigid silica areas exert some pressure on the softer UVO shadowed PDMS areas. This results in a compression stress of the PDMS region between two consecutive silica areas. It is interesting to note that, for harder PDMS substrates, the deformation is affine, even after UVO treatment. For PDMS substrate with modulus higher than 2 MPa, the pitch (green symbols in Fig. 6c) of the obtained structure is similar to the one of the used masks. However, for PDMS substrates below 2 MPa, the UVO treatment under compression produces slightly larger pitches after releasing the compression. | ||
| Fig. 6 (Left) Optical images of the patterns formed using a 30:1 PDMS, a M63,38 Mask with varying the pressure applied during the UVO exposure (treatment duration 30 min). On the central panel, a profile along the white line (250 μm) indicated in the images. Dashed blue lines mark the distance between two consecutive silica regions (pitch) for each sample. Right panel shows the simulations on the distribution of Von Misses stresses after applying the deformation on a 38 × 38 μm square plate with Young Modulus 12.3 MPa, i.e. similar mechanical and geometrical characteristics of the ones formed during UVO treatment are presented on the right panel. | ||
3.4 Influence of the applied pressure on crack formation
In some cases, cracks are formed in the rigid regions. In this section, we analyze the key parameters in terms of PDMS SO/C ratio, applied pressure and geometry of the rigid silica regions to obtain crack free patterned surfaces.:1 SO/C ratio (Young modulus of 2.1 MPa) UVO treated using the M63,38 mask for different compression forces, varying between 0.11 and 1.78 MPa, applied during 30 min. of UVO treatment. As shown in Fig. 6, for a selected PDMS sample with identical duration of the UVO treatment the variation on the compression force produced different crack patterns. When applying low compression forces (0.11 MPa and 0.19 MPa) the PDMS substrate only deforms to a limited extent and the final surface pattern result in an elevation of the UVO exposed areas in relation to the shadowed ones. However, larger compression forces induce, upon relaxation, the formation of cracked structures. The stiff silica layer, which is formed in these cases, is forced to form on a highly deformed PDMS substrate with a significant curvature. This curvature, upon relaxation, is unable to accommodate the deformation and finally breaks down by crack formation. Interestingly, these cracks are observed in the exposed areas indicating the rupture of the silica layer.
In order to understand the rupture patterns observed in the silica areas, simulations were performed to obtain the map of distribution of Von Misses stresses of a solid plate with similar dimensions and mechanical properties to the ones obtained by the ozonation process. Extended details of the simulations are included in the ESI.† The results of the simulations are presented in the right panel of Fig. 6. As observed, the modeling predicts very little tension when low pressure is applied. However, as the applied pressure increases, the map of Von Misses tension shows diagonal regions with high tension where rupture is more likely to occur. These regions are located in the diagonals and in the center. The result of the modeling agrees with the observed rupture patterns. It is worth mentioning that the Von Misses tension maps for each plate condition shows the highest values in the regions close to the edges. In the real sample, this tension is absorbed by the compliant flexible substrate. This is probably an effect of the simplification, since for the modeling, the edges of the plate are assumed to be fixed, whereas probably some of this tension is absorbed by the compliant lateral PDMS.
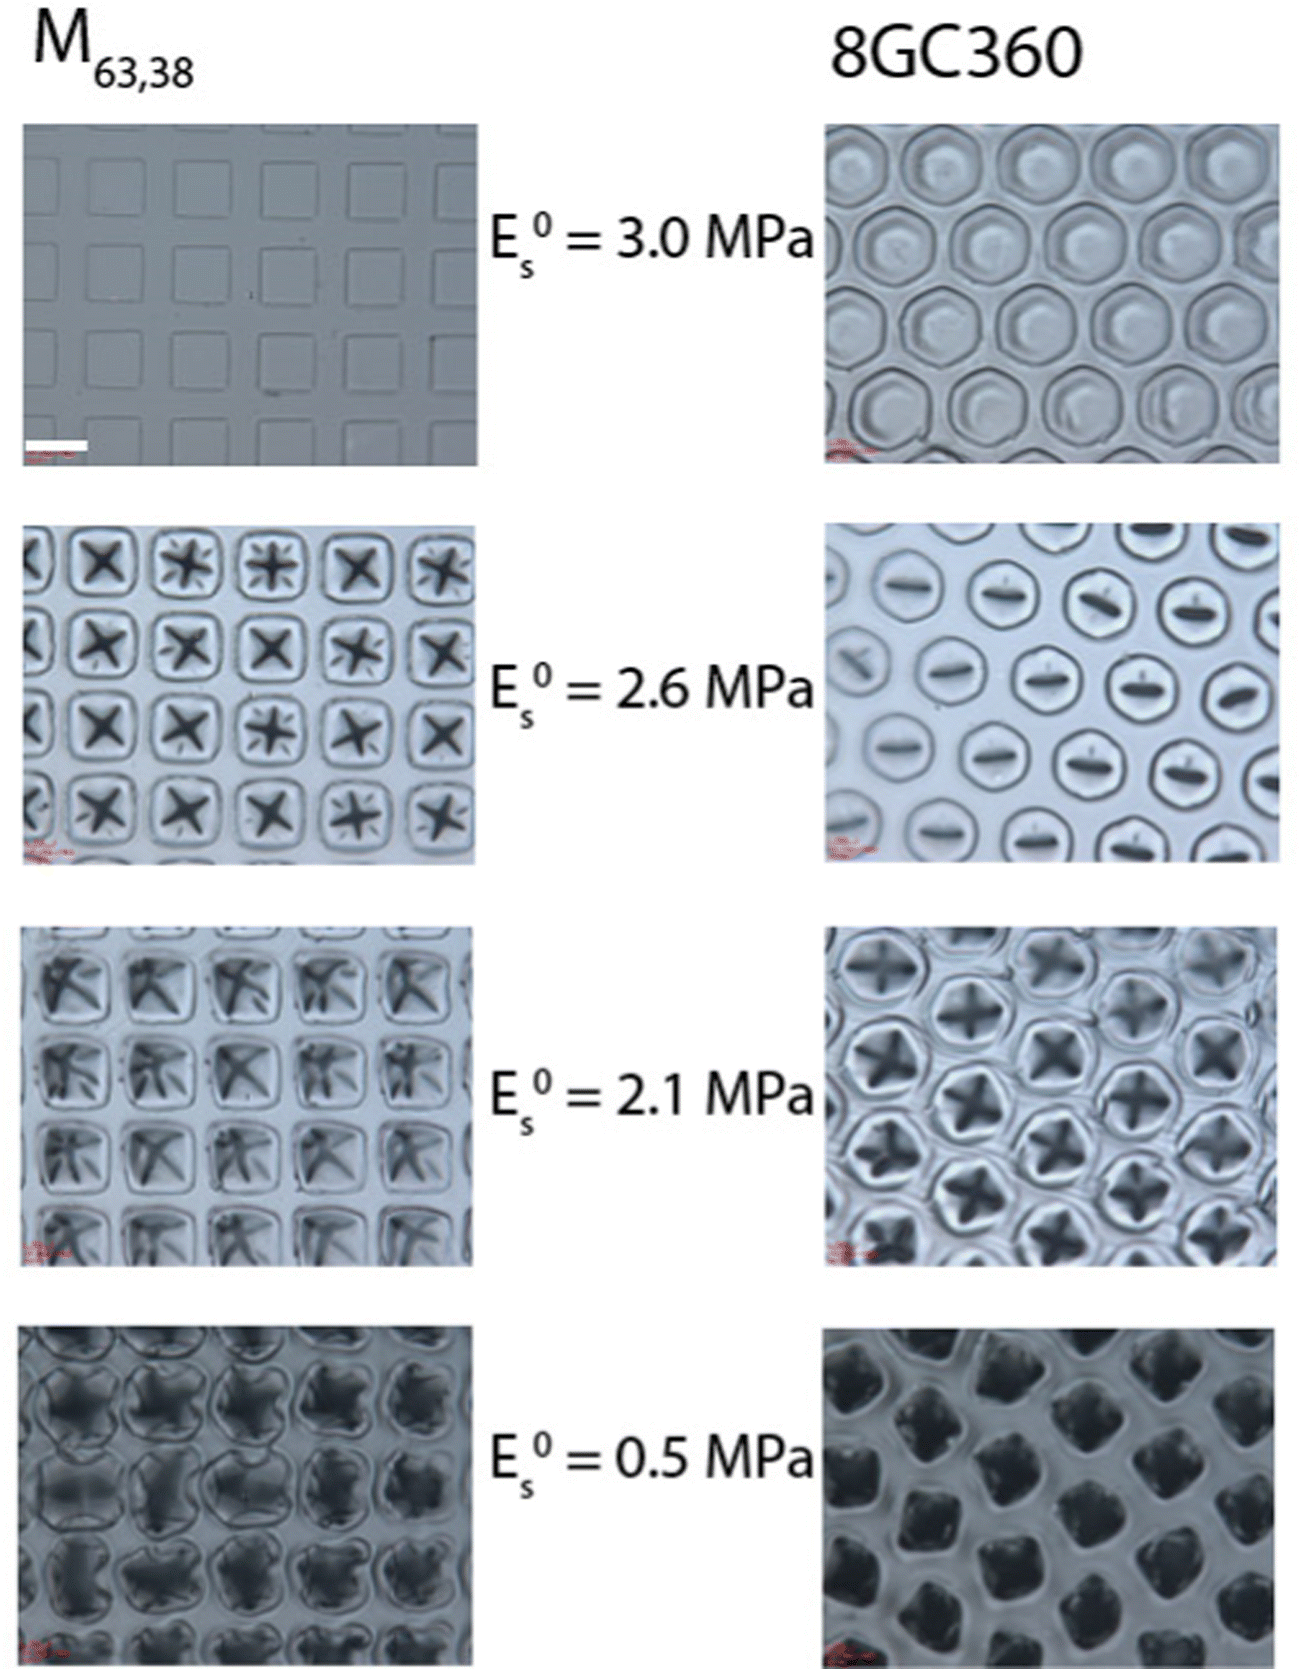 | ||
| Fig. 7 Optical images of the patterns formed on PDMS substrates with different SO/C ratios corresponding to different Young Moduli (labelled in the middle). A pressure of 0.81 MPa was applied using different shaped masks. Left column corresponds to square M63,38 Mask and right column corresponds to hexagonal 8GC360 Mask (UVO exposure 30 min.). The white bar in the top left image provides the spatial scale of 50 microns. | ||
Finally, for the softest PDMS the rigid structure collapse after releasing the pressure, leading to the formation of holes. Most probably, under compression, in the case of softer PDMS, the compression produces a large “balloon” of material through each hole of the mask. This balloon is exposed to the UVO and rigidified. Upon stress removal, the accommodation of the stress applied cannot occur by formation of cracks but rather the entire rigid surface of the balloon is introduced inside of the soft bulk PDMS thus forming holes.
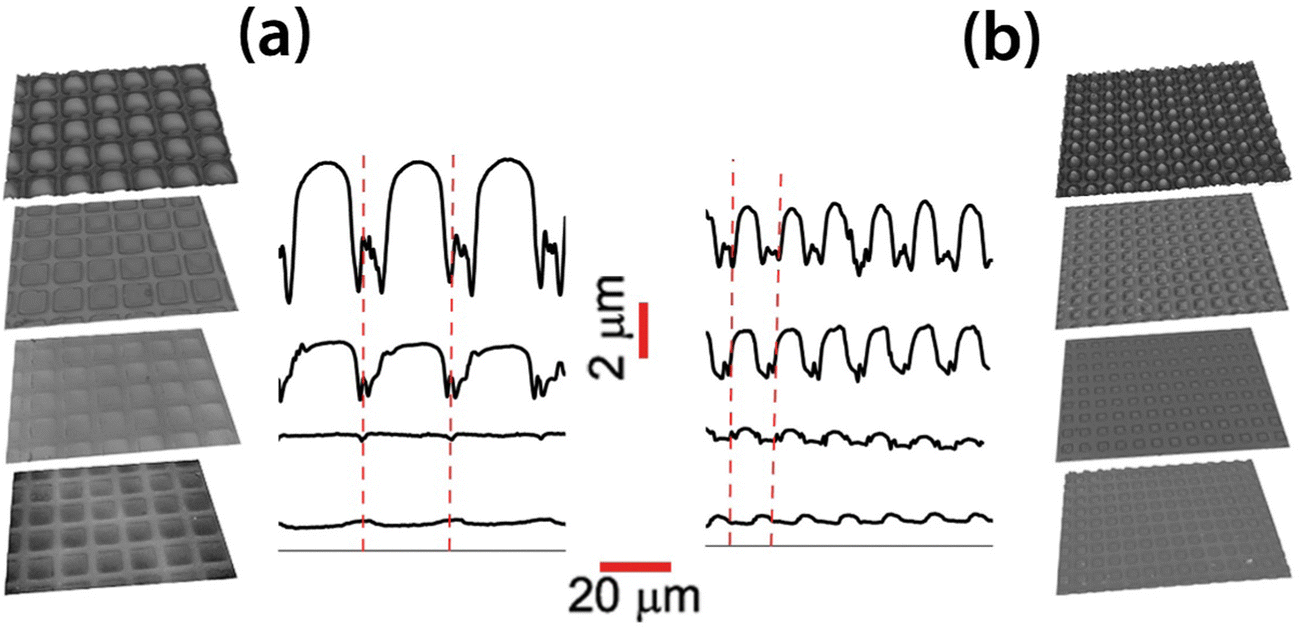 | ||
| Fig. 8 Optical profilometer images and cross-sectional profiles of the patterned PDMS films using: (a): M25,12 (pitch 25 μm, hole 12 μm) and (b): M12,7 (pitch 12 μm, hole 7 μm). The initial modulus of the PDMS employed: 3 MPa, 2.5 MPa, 2.01 MPa and 0.98 MPa. Red dashed lines mark the beginning and end of a complete pitch for each sample. | ||
In summary, the formation of cracks can be avoided by using mask with smaller holes. The presence of cracks is most likely due to the tension accumulated at the center of the rigid silica region. These tensions are stronger for thinner rigid areas.
4. Conclusions
We reported the preparation of micrometer size patterns on an elastic substrate taking advantage of the rigidification occurring during the exposure to UVO upon stress and the resulting deformations observed upon stress relaxation. The process involves the out of plane deformation of an elastic substrate (PDMS) with variable Young modulus by applying a precise compression stress. The use of a metallic grid on top of the elastic substrate directs the deformation to occur exclusively in the holes of the grid. By exposure to UVO a rigid silica layer with variable thicknesses is formed exclusively in the deformed areas. As it has been described, both the size of the exposed areas as well as the compression stress applied play a critical role on the formation of regular surface patterns or on the appearance of cracks. These observations were confirmed by modeling the system to obtain a map of distribution of Von Misses stresses of a solid plate with similar dimensions and mechanical properties to the ones obtained by the ozonation process. Both model and experimental observations concluded that reducing the pattern size prevent the formation of cracks and allows for the formation or regular patterns.Author contributions
J. R. H. conceived this experiment; A. N. and J. R. H. led the study; J. R. H. prepared the samples; A. C. conducted the Raman spectra and performed Raman data analysis; C. G. performed bulk mechanical properties measurements; A. N. and T. A. E. performed NanoMechanical Measurements; A. N. carried out the simulations; J. R. H. prepared an initial version of the manuscript. The final version of the manuscript was prepared by A. N. and revised T. A. E.Conflicts of interest
The authors declare no competing financial interests.Acknowledgements
The authors gratefully acknowledge support from the Consejo Superior de Investigaciones Científicas (CSIC). Equally, this work was financially supported by the Ministerio de Ciencia e Innovación (MICINN) (Grants RTI2018-096328-B-I00 and PID2019-107514GB-I00/AEI/10.13039/501100011033).References
- S. K. Nemani, R. K. Annavarapu, B. Mohammadian, A. Raiyan, J. Heil, M. A. Haque, A. Abdelaal and H. Sojoudi, Surface Modification of Polymers: Methods and Applications, Adv. Mater. Interfaces, 2018, 5(24), 1801247 CrossRef.
- P. Li, X. Dou and H. Schönherr, Micropatterning and nanopatterning with polymeric materials for advanced biointerface-controlled systems, Polym. Int., 2019, 68(6), 1015–1032 CrossRef CAS.
- C. Acikgoz, M. A. Hempenius, J. Huskens and G. J. Vancso, Polymers in conventional and alternative lithography for the fabrication of nanostructures, Eur. Polym. J., 2011, 47(11), 2033–2052 CrossRef CAS.
- J. Rodríguez-Hernández and C. Drummond, Polymer surfaces in motion: Unconventional patterning methods, Springer, 2015 Search PubMed.
- R. A. Hughes, E. Menumerov and S. Neretina, When lithography meets self-Assembly: A review of recent advances in the directed assembly of complex metal nanostructures on planar and textured surfaces, Nanotechnology, 2017, 28(28), 282002 CrossRef PubMed.
- E. Gutiérrez-Fernández, T. A. Ezquerra, A. Nogales and E. Rebollar, Straightforward Patterning of Functional Polymers by Sequential Nanosecond Pulsed Laser Irradiation, Nanomaterials, 2021, 11(5), 1123 CrossRef PubMed.
- C. González-Henríquez and J. Rodríguez-Hernández, Wrinkled Polymer Surfaces, 2019 Search PubMed.
- G. Reiter, Unstable thin polymer-films - rupture and dewetting processes, Langmuir, 1993, 9(5), 1344–1351 CrossRef CAS.
- K. Kargupta and A. Sharma, Dewetting of thin films on periodic physically and chemically patterned surfaces, Langmuir, 2002, 18(5), 1893–1903 CrossRef CAS.
- Z. Q. Lin, T. Kerle, T. P. Russell, E. Schaffer and U. Steiner, Electric field induced dewetting at polymer/polymer interfaces, Macromolecules, 2002, 35(16), 6255–6262 CrossRef CAS.
- R. Mukherjee, A. Sharma and U. Steiner, Surface Instability and Pattern Formation in thin Polymer Films, Generating Micro- and Nanopatterns on Polymeric Materials, Wiley-VCH Verlag GmbH & Co. KgaA, 2011, pp. 217–265 Search PubMed.
- P. Muller-Buschbaum, Dewetting and pattern formation in thin polymer films as investigated in real and reciprocal space, J. Phys.: Condens. Matter, 2003, 15(36), R1549–R1582 CrossRef.
- A. Munoz-Bonilla, M. Fernández-García and J. Rodríguez-Hernández, Towards hierarchically ordered functional porous polymeric surfaces prepared by the breath figures approach, Prog. Polym. Sci., 2014, 39(3), 510–554 CrossRef CAS.
- J. Rodríguez-Hernández and E. Bormashenko, Breath figures: mechanisms of multi-scale patterning and strategies for fabrication and applications of microstructured functional porous surfaces, Springer Nature, 2020 Search PubMed.
- I. Siretanu, J. P. Chapel and C. Drummond, Water-Ions Induced Nanostructuration of Hydrophobic Polymer Surfaces, ACS Nano, 2011, 5(4), 2939–2947 CrossRef CAS PubMed.
- Y. Wang, B. Bhushan and X. Zhao, Nanoindents produced by nanobubbles on ultrathin polystyrene films in water, Nanotechnology, 2009, 20(4), 045301 CrossRef PubMed.
- M. Dietzel and S. M. Troian, Mechanism for spontaneous growth of nanopillar arrays in ultrathin films subject to a thermal gradient, J. Appl. Phys., 2010, 108(7), 074308 CrossRef.
- M. Nedelcu, M. D. Morariu, S. Harkema, N. E. Voicu and U. Steiner, Pattern formation by temperature-gradient driven film instabilities in laterally confined geometries, Soft Matter, 2005, 1(1), 62–65 RSC.
- E. Schaffer, S. Harkema, R. Blossey and U. Steiner, Temperature-gradient-induced instability in polymer films, Europhys. Lett., 2002, 60(2), 255–261 CrossRef CAS.
- G. Amarandei, P. Beltrame, I. Clancy, C. O'Dwyer, A. Arshak, U. Steiner, D. Corcoran and U. Thiele, Pattern formation induced by an electric field in a polymer-air-polymer thin film system, Soft Matter, 2012, 8(23), 6333–6349 RSC.
- M. D. Morariu, N. E. Voicu, E. Schaffer, Z. Q. Lin, T. P. Russell and U. Steiner, Hierarchical structure formation and pattern replication induced by an electric field, Nat. Mater., 2003, 2(1), 48–52 CrossRef CAS PubMed.
- E. Rebollar, T. A. Ezquerra and A. Nogales, Laser-induced periodic surface structures (Lipss) on polymer surfaces, Wrinkled Polymer Surfaces, Springer, 2019, pp. 143–155 Search PubMed.
- J. Cui, A. Nogales, T. A. Ezquerra and E. Rebollar, Influence of substrate and film thickness on polymer LIPSS formation, Appl. Surf. Sci., 2017, 394, 125–131 CrossRef CAS.
- E. P. Chan, E. J. Smith, R. C. Hayward and A. J. Crosby, Surface wrinkles for smart adhesion, Adv. Mater., 2008, 20(4), 711–716 CrossRef CAS.
- J. Genzer and J. Groenewold, Soft matter with hard skin: From skin wrinkles to templating and material characterization, Soft Matter, 2006, 2(4), 310–323 RSC.
- J. Rodriguez-Hernandez, Wrinkled interfaces: Taking advantage of surface instabilities to pattern polymer surfaces, Prog. Polym. Sci., 2015, 42, 1–41 CrossRef CAS.
- R. Al-Rashed, F. L. Jiménez, J. Marthelot and P. M. Reis, Buckling patterns in biaxially pre-stretched bilayer shells: Wrinkles, creases, folds and fracture-like ridges, Soft Matter, 2017, 13(43), 7969–7978 RSC.
- J. Yin, J. L. Yagüe, D. Eggenspieler, K. K. Gleason and M. C. Boyce, Deterministic order in surface micro-topologies through sequential wrinkling, Adv. Mater., 2012, 24(40), 5441–5446 CrossRef CAS PubMed.
- P. Kim, M. Abkarian and H. A. Stone, Hierarchical folding of elastic membranes under biaxial compressive stress, Nat. Mater., 2011, 10(12), 952–957 CrossRef CAS PubMed.
- E. P. Chan and A. J. Crosby, Spontaneous formation of stable aligned wrinkling patterns, Soft Matter, 2006, 2(4), 324–328 RSC.
- D. Wu, Y. Yin, H. Xie, Y. Shang, C. Li, L. Wu and X. Dai, Controlling the surface buckling wrinkles by patterning the material system of hard-nano-film/soft-matter-substrate, Sci. China: Phys., Mech. Astron., 2014, 57(4), 637–643 Search PubMed.
- Y. Xuan, X. Guo, Y. Cui, C. Yuan, H. Ge, B. Cui and Y. Chen, Crack-free controlled wrinkling of a bilayer film with a gradient interface, Soft Matter, 2012, 8(37), 9603–9609 RSC.
- A. Nogales, A. Del Campo, T. A. Ezquerra and J. Rodriguez-Hernández, Wrinkling and Folding on Patched Elastic Surfaces: Modulation of the Chemistry and Pattern Size of Microwrinkled Surfaces, ACS Appl. Mater. Interfaces, 2017, 9(23), 20188–20195 CrossRef CAS PubMed.
- T. Ouchi, J. Yang, Z. Suo and R. C. Hayward, Effects of Stiff Film Pattern Geometry on Surface Buckling Instabilities of Elastic Bilayers, ACS Appl. Mater. Interfaces, 2018, 10(27), 23406–23413 CrossRef CAS PubMed.
- A. del Campo, A. Nogales, T. A. Ezquerra and J. Rodríguez-Hernández, Modification of poly (dimethylsiloxane) as a basis for surface wrinkle formation: Chemical and mechanical characterization, Polymer, 2016, 98, 327–335 CrossRef CAS.
- Y. Berdichevsky, A. Guttman and Y.-H. Lo, UV/ozone modification of poly(dimethylsiloxane) microfluidic channels, Sens. Actuators, B, 2004, 97, 402–408 CrossRef CAS.
- B. V. Derjaguin, V. M. Muller and Y. P. Toporov, Effect of contact deformations on the adhesion of particles, J. Colloid Interface Sci., 1975, 53(2), 314–326 CrossRef CAS.
- J. E. Mark, Polymer data handbook, 1999 Search PubMed.
- D. E. Martínez-Tong, A. S. Najar, M. Soccio, A. Nogales, N. Bitinis, M. A. López-Manchado and T. A. Ezquerra, Quantitative mapping of mechanical properties in polylactic acid/natural rubber/organoclay bionanocomposites as revealed by nanoindentation with atomic force microscopy, Compos. Sci. Technol., 2014, 104, 34–39 CrossRef.
- A. G. Atkins, T. Atkins and M. Escudier, A dictionary of mechanical engineering, Oxford University Press, 2013 Search PubMed.
Footnote |
| † Electronic supplementary information (ESI) available. See DOI: https://doi.org/10.1039/d2sm00873d |
| This journal is © The Royal Society of Chemistry 2022 |