
 Open Access Article
 This Open Access Article is licensed under a
 Creative Commons Attribution 3.0 Unported Licence
Light-responsive Pickering emulsions based on azobenzene-modified particles†
Kieran D.
Richards
 and
Rachel C.
Evans
*
and
Rachel C.
Evans
*
Department of Materials Science and Metallurgy, University of Cambridge, 27 Charles Babbage Road, Cambridge, CB3 0FS, UK. E-mail: rce26@cam.ac.uk
First published on 26th July 2022
Abstract
Light-responsive particle-stabilised (Pickering) emulsions can in principle be selectively emulsified/demulsified on-demand through the remote application of light. However, despite their wide-ranging potential in applications such as drug delivery and biphasic catalysis, their rational design is extremely challenging and there are very few examples to date. Herein, we investigate a model system based on silica particles functionalised with azobenzene photoswitches to understand the key factors that determine the characteristics of light-responsive Pickering emulsions. The particle hydrophobicity is tuned through judicious variation of the spacer length used to graft the chromophores to the surface, the grafting density, and irradiation to induce trans–cis photoisomerisation. For select emulsions, and for the first time, a reversible transition between emulsified water-in-oil droplets and demulsified water and oil phases is observed with the application of either UV or blue light, which can be repeatedly cycled. A combination of surface energy analysis and optical microscopy is shown to be useful in predicting the stability, and expected light-response, of a given emulsion. Using the observed trends, a set of design rules are presented which will help facilitate the rational design, and therefore, more widespread application of light-responsive Pickering emulsions.
Introduction
Pickering or particle-stabilised emulsions have recently seen a resurgence in interest1–3 as a method of encapsulation for the key areas of food, pharmaceutical technologies and biphasic catalysis.4,5 In a Pickering emulsion, one liquid is dispersed as droplets throughout a second immiscible liquid, and the interface is decorated with solid ‘stabilising’ particles. Stimuli-responsive Pickering emulsions are of particular interest as they permit the selective stabilisation and destabilisation of emulsion droplets, or inversion between oil-in-water (O/W) and water-in-oil (W/O) emulsions, in response to external factors such as pH,6,7 magnetic fields,8 temperature9 and light.3,10 Of all the stimuli, light may be considered the most advantageous, offering superior remote, spatial and temporal control, compared to pH or temperature.3,11 For biphasic catalysis this permits facile product separation and catalyst recovery,12 while for medicinal therapeutics it offers targeted, non-invasive treatments that avoid premature delivery of the droplet cargo.2Despite this potential, only a handful of light-responsive Pickering emulsions have previously been reported. Bai et al. used inherently light-responsive TiO2 particles as stabilisers, which caused emulsion destabilisation upon UV irradiation.13 Chen et al. demonstrated light responsivity using silica particles whose surface was grafted with photoswitchable donor-acceptor Stenhouse adducts (DASAs).10 Likewise, Chen et al. used spiropyran-type photoswitches to accomplish a similar result.14 In both cases, inversion between O/W and W/O emulsions was achieved upon irradiation. Recently Li et al. used ionic liquid surfactants based on azobenzene (Azo) photoswitches adsorbed to silica, to induce reversible emulsification and demulsification for application in biphasic catalysis.12 It was shown that the system was fully recyclable, allowing separation of the ionic liquid and catalyst.
The design of light-responsive particles for Pickering emulsions is non-trivial. As shown in Fig. 1 (regions I and IV), particles that lie at the extremes of hydrophobic or hydrophilic character are completely wetted by the oil or water phase, respectively, and form aggregates. For particles of intermediate hydrophobicity, it is energetically favourable for them to sit at the interface as they reduce the overall interfacial tension between the oil and water. Particles that are more hydrophobic and therefore better wetted by the oil phase, will favour the formation of W/O emulsions (Fig. 1, region III) and will have an angle >90°, as measured through the oil–water interface. Conversely, particles that are more hydrophilic will favour O/W emulsions (Fig. 1, region II), with an angle <90°. It is therefore important to tune the hydrophobicity/hydrophilicity of the particles to form a stable emulsion.15 For the emulsion to be light-responsive, two key criteria must be met. Firstly, the particles should exist in two different states of hydrophobicity upon irradiation (e.g., Fig. 1 A and B). Secondly, the two states must alter the interfacial energy sufficiently, such that different morphological states can be accessed (Fig. 1 I to IV).16
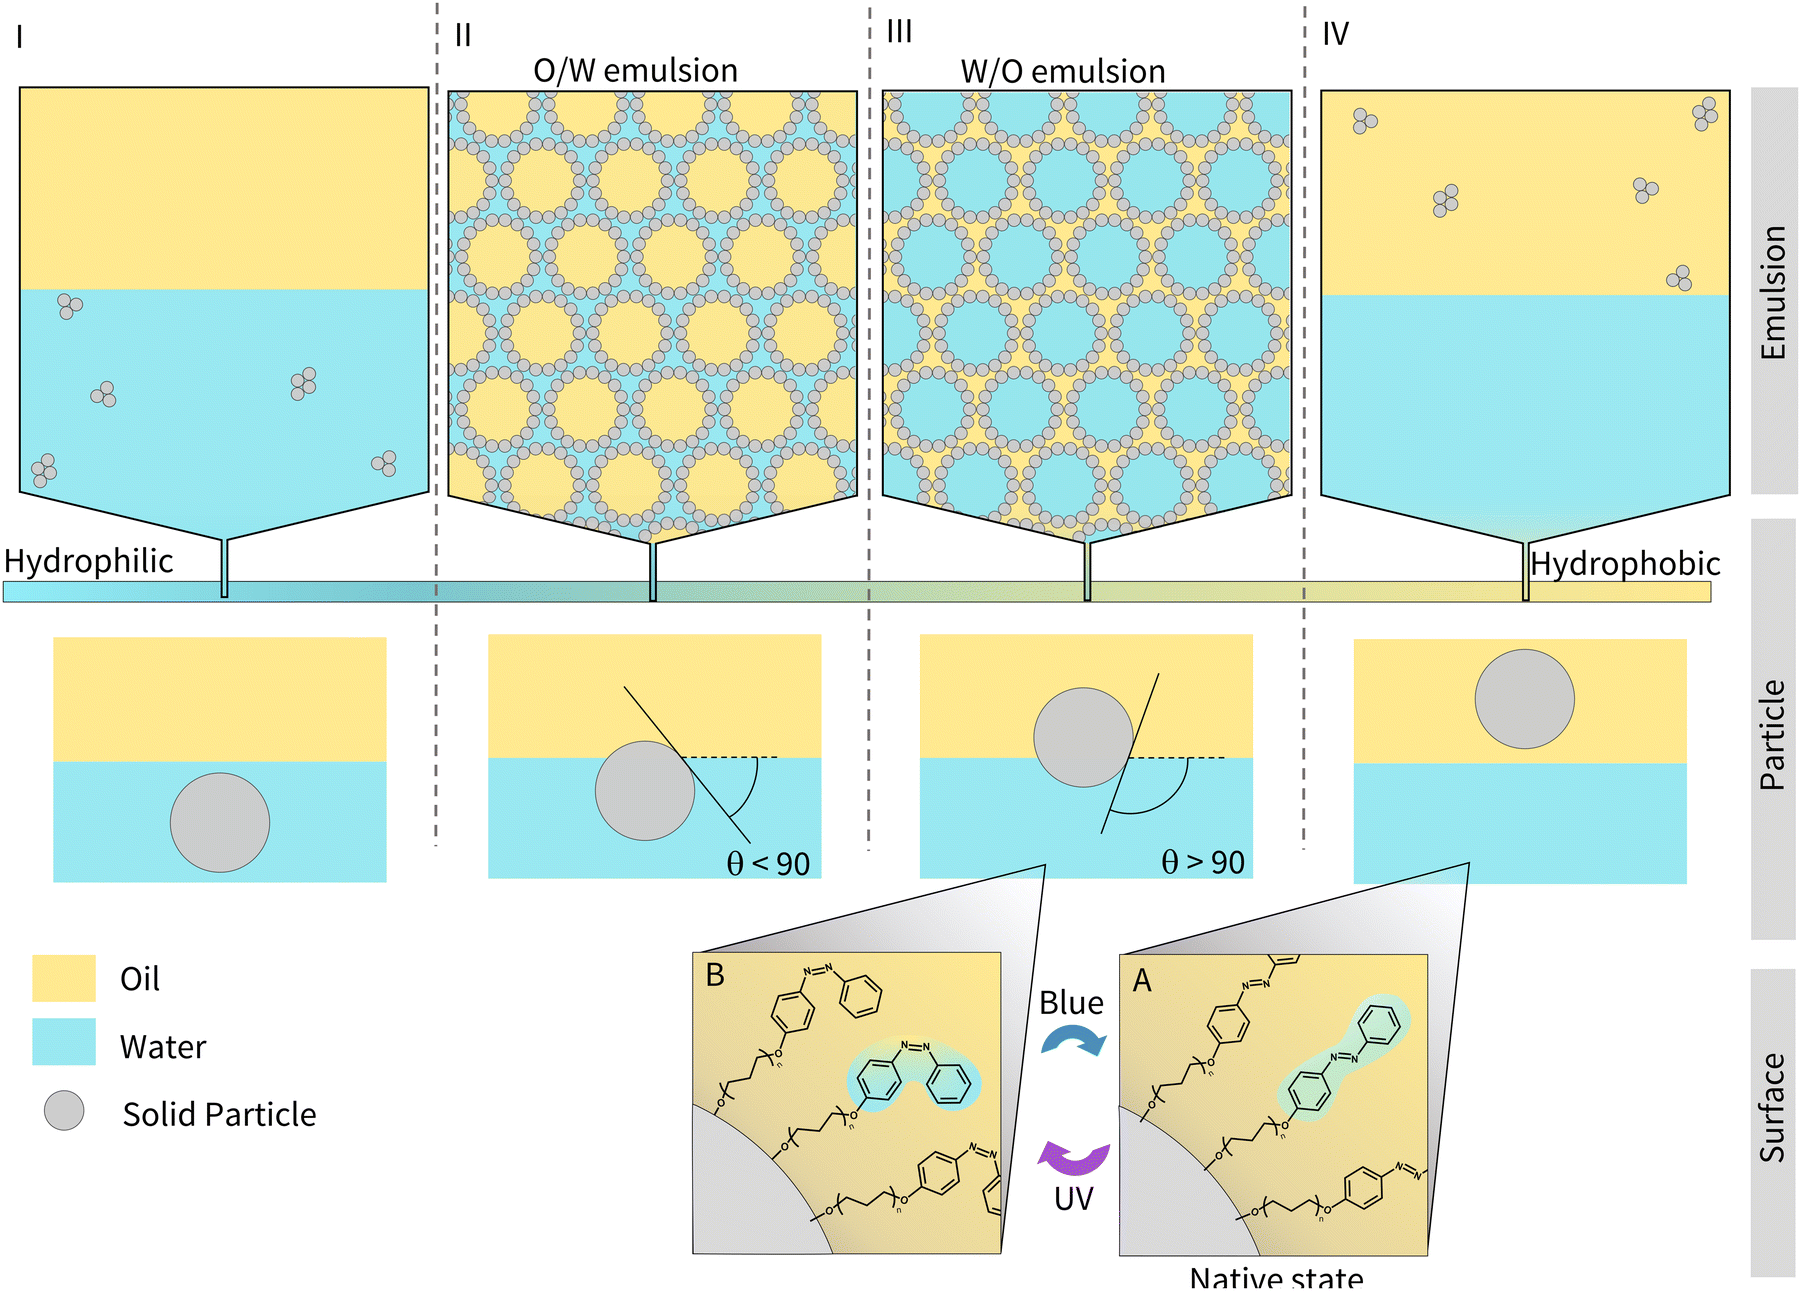 | ||
| Fig. 1 The relationship between the hydrophobicity of the stabilising particle and the type of Pickering emulsion produced. I–IV show the different morphologies that can be accessed (I – aggregates in water, II oil-in-water (O/W) emulsion, III water-in-oil (W/O) emulsion, IV aggreagtes in oil). A and B show the reversible photoisomerisation of azobenzene molecules grafted to the particle surface and the resulting changes in hydrophobicity. The oil–water contact angle, θ, which increases with increasing hydrophobicity is indicated. | ||
Despite these observations, to the best of our knowledge, there has been no detailed discussion about how to design or choose an appropriate lead for a light-responsive Pickering system (i.e., choice of photoswitch, chain-length, grafting density, and oil selection). With this information, properties such as the morphologies that light-responsive emulsions invert between, or the oil that they are compatible in could be tailored to a given purpose, i.e., biphasic catalysis or drug delivery, promoting their more widespread use. Herein, we address this omission, by identifying a set of key principles that will facilitate the rational design of light-responsive Pickering emulsions. To achieve this, we examine a model system based on fumed silica particles whose surface is functionalised with three different azobenzene derivatives (Fig. 2 – AzoOH, AzoO(CH2)3OH and AzoO(CH2)11OH). Azo chromophores have been widely studied17–19 due to their high and reversible polarisability upon trans–cis photoisomerisation (ca. 0 D to 3 D, respectively for native, unmodified azobenzene20). This property has previously been exploited to alter the wettability of solid surfaces, with some examples showing an ability to reversibly cycle between superhydrophobic and superhydrophilic states upon irradiation with different wavelengths of light.21 Moreover, there has been extensive work on functionalised azobenzenes affixed to gold nanoparticles, which reversibly aggregate in single-phase media.22–24 Dimethyl amino substitution of the Azo molecules,22 or the incorporation of different thiolate linkers, has been shown to modify both the nanoparticle solubility and the wavelength at which self-assembly occurs.25 Similar results have also been observed in related systems using spiropyran photoswitches.26,27
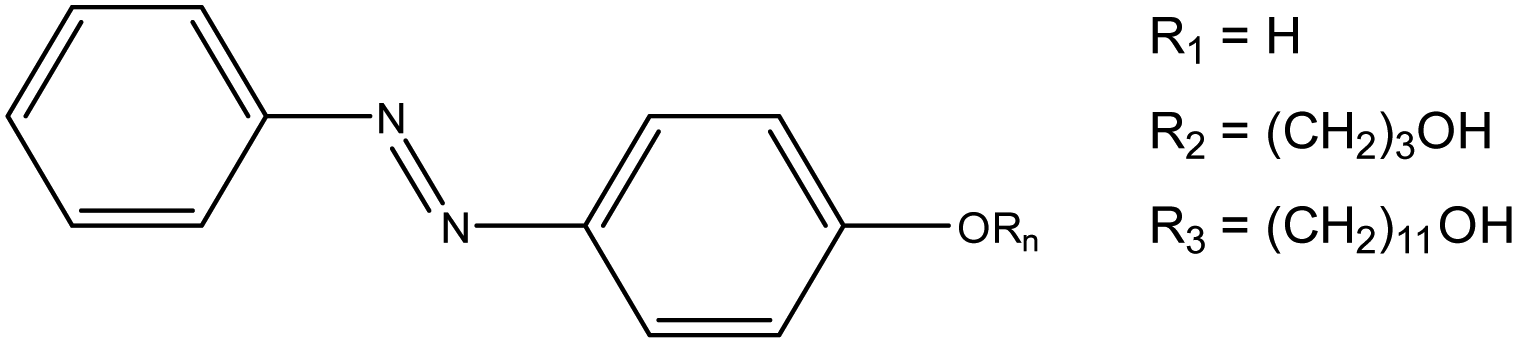 | ||
| Fig. 2 Azobenzene derivatives studied in this work. The naming convention is as follows: R1 corresponds to AzoOH, R2 is AzoO(CH2)3OH and R3 is AzoO(CH2)11OH. | ||
This work aims to apply similar principles to larger (200 nm) fumed-silica particles in biphasic systems, inducing morphological changes on the tens of micron scale. The hydrophobicity of Azo-functionalised particles in the native trans-state is modulated by using alkyl spacers of different lengths and by using three different grafting densities. Pickering emulsions are prepared using diethyl adipate as a polar oil, selected as it is capable of stabilising emulsions with fumed silica and shows limited solubility in water.28 Moreover, adipate oils are capable of stabilising, typically unstable, hydrophilic particles in situ.29
Whereas previous work has taken an application-led approach to creating light-responsive emulsions,10,12–14 here we demonstrate that through detailed characterisation of the light-responsive particle stabilisers, the morphology of the emulsion morphology can be predicted and the particle/oil composition tailored to deliver the desired characteristics. A combination of optical microscopy and contact angle tensiometry are used to investigate how the particle hydrophobicity, surface morphology of the droplets and surface energy of the particles determine the stability of the resultant emulsion. Through rationalisation of these key structure–property relationships we propose key selection criteria for the design of light-responsive Pickering emulsions based on the judicious choice of photoswitch, its grafting density and an appropriate oil.
Experimental
Materials
Three azobenzene derivatives were used in this study (Fig. 2). 4-(Phenyldiazenyl)phenol (AzoOH) was used as received from the supplier (Sigma-Aldrich, 99%) and the other derivatives were prepared via a Williamson ether synthesis as outlined below. 11-Bromo-1-undecanol (99%), n-hexadecane (99%), fumed silica (0.2–0.3 μm diameter, 200 ± 25 m2 g−1 surface area, 5 free hydroxyl groups per nm2) and silicone oil (100 mPa S (20 °C), [–Si(CH3)2O–]n, molecular weight ca. 5970 g mol−1, ≥99%)30 were purchased from Sigma-Aldrich. 3-Bromo-1-propanol (97%) dicyclohexano-18-crown-6 (97%) and potassium carbonate (99%) were purchased from Alfa Aesar. Acetone (analytical grade), dichloromethane (DCM, HPLC grade), diethyl adipate (99%), ethanol (≥99.8), ethyl acetate (analytical grade), n-hexane (95%), dimethyl formamide (DMF, ≥99%), methanol (≥99%) and Nile Red (≥99%) were purchased from Fisher Scientific. Deuterated chloroform (99.8%) was purchased from Eurisotop. Water was obtained from a Millipore Simak 2 water purification system. All reagents were used as received.Synthesis of azobenzene derivatives with varying spacer lengths
4-(Phenyldiazenyl)phenol (1.02 g, 5.04 mmol) was dissolved in DMF (50 mL). To this mixture was added either 3-bromopropan-1-ol (0.715 g, 5.04 mmol) or 11-bromo-1-undecanol (1.29 g, 5.04 mmol), potassium carbonate (0.47 g, 3.4 mmol) and dicyclohexano-18-crown-6 (0.067 g, 0.25 mmol). The mixture was heated at 100 °C for 3 h. The dark orange solution that formed was extracted in ethyl acetate (100 mL) and distilled water (100 mL). The organic layer was then dried and recrystallised from a minimum volume of hot ethanol. For the 3-bromo-1-undecanol reaction, additional purification via column chromatography was required (DCM–MeOH 99![[thin space (1/6-em)]](https://www.rsc.org/images/entities/char_2009.gif) :1). The reaction products were obtained as solids and characterised by NMR spectroscopy (ESI,† Fig. S1 and S2) and mass spectrometry (ESI,† Fig. S3 and S4). (i) 3-(4-(Phenyldiazenyl)phenoxy)propan-1-ol (AzoO(CH2)3OH, 0.74 g, 57%).1H NMR (400 MHz; CDCl3) δ 7.94–7.87 (m, 4H, CHaromatic), 7.50 (t, 2H, CHaromaticJ = 7.4 Hz), 7.01 (d, 2H, CHaromaticJ = 8.97 Hz), 4.19 (t, 2H, CH2, J = 6.00 Hz), 3.87 (dd, 2H,CH2J = 10.6, 5.5 Hz), 2.07 (p, 2H, CH2, J = 6.0 Hz), 1.95 (t, 1H, OH, J = 5.0 Hz). 13C NMR (100 MHz; CDCl3) 61.40 (Car), 152.82 (Car), 147.11 (Car), 130.51 (Car), 129.14 (Car), 124.87 (Car), 122.66 (Car), 114.80 (Car), 65.81 (CH2), 60.09 (CH2), 32.03 (CH2). m/z [M+H+] C15H17N2O: calc.: 257.1245; found: 257.1300. (ii) 11-(4-(Phenyldiazenyl)phenoxy)undecane-1-ol (AzoO(CH2)11OH, 1.18 g, 65%) 1H NMR(CDCl3) δ 7.93–7.87 (m, 4H, CHar), 7.52–7.41 (m, 3H, CHar), 7.00 (d, 2H, CHarJ = 8.91 Hz), 4.03 (t, 2H, CH2, J = 6.55 Hz), 3.63 (t, 2H, CH2, J = 6.52 Hz), 1.82 (p, 2H, CH2, J = 7.20 Hz), 1.56 (p, 2H, CH2, J = 2.80 Hz), 1.477 (p, 2H, CH2, J = 2.80 Hz), 1.38–1.29 (m, 13H, CH2). 13C NMR (100 MHz; CDCl3) δ 161.71 (Car), 152.78 (Car), 146.83 (Car), 130.30 (CHar), 129.02 (CHar), 124.75 (CHar), 122.53 (CHar), 114.69 (CHar), 68.35 (CH2), 63.06 (CH2), 32.81 (CH2), 29.60 (CH2), 29.55 (CH2), 29.52 (CH2), 29.44 (CH2), 29.38 (CH2), 29.19 (CH2), 26.01 (CH2), 25.76 (CH2). m/z [M + H+] C23H33N2O2: calc.: 369.2497; found: 369.2551. *ar = aromatic.
:1). The reaction products were obtained as solids and characterised by NMR spectroscopy (ESI,† Fig. S1 and S2) and mass spectrometry (ESI,† Fig. S3 and S4). (i) 3-(4-(Phenyldiazenyl)phenoxy)propan-1-ol (AzoO(CH2)3OH, 0.74 g, 57%).1H NMR (400 MHz; CDCl3) δ 7.94–7.87 (m, 4H, CHaromatic), 7.50 (t, 2H, CHaromaticJ = 7.4 Hz), 7.01 (d, 2H, CHaromaticJ = 8.97 Hz), 4.19 (t, 2H, CH2, J = 6.00 Hz), 3.87 (dd, 2H,CH2J = 10.6, 5.5 Hz), 2.07 (p, 2H, CH2, J = 6.0 Hz), 1.95 (t, 1H, OH, J = 5.0 Hz). 13C NMR (100 MHz; CDCl3) 61.40 (Car), 152.82 (Car), 147.11 (Car), 130.51 (Car), 129.14 (Car), 124.87 (Car), 122.66 (Car), 114.80 (Car), 65.81 (CH2), 60.09 (CH2), 32.03 (CH2). m/z [M+H+] C15H17N2O: calc.: 257.1245; found: 257.1300. (ii) 11-(4-(Phenyldiazenyl)phenoxy)undecane-1-ol (AzoO(CH2)11OH, 1.18 g, 65%) 1H NMR(CDCl3) δ 7.93–7.87 (m, 4H, CHar), 7.52–7.41 (m, 3H, CHar), 7.00 (d, 2H, CHarJ = 8.91 Hz), 4.03 (t, 2H, CH2, J = 6.55 Hz), 3.63 (t, 2H, CH2, J = 6.52 Hz), 1.82 (p, 2H, CH2, J = 7.20 Hz), 1.56 (p, 2H, CH2, J = 2.80 Hz), 1.477 (p, 2H, CH2, J = 2.80 Hz), 1.38–1.29 (m, 13H, CH2). 13C NMR (100 MHz; CDCl3) δ 161.71 (Car), 152.78 (Car), 146.83 (Car), 130.30 (CHar), 129.02 (CHar), 124.75 (CHar), 122.53 (CHar), 114.69 (CHar), 68.35 (CH2), 63.06 (CH2), 32.81 (CH2), 29.60 (CH2), 29.55 (CH2), 29.52 (CH2), 29.44 (CH2), 29.38 (CH2), 29.19 (CH2), 26.01 (CH2), 25.76 (CH2). m/z [M + H+] C23H33N2O2: calc.: 369.2497; found: 369.2551. *ar = aromatic.
Surface grafting of azobenzene derivatives to fumed silica
Ethanol (20 mL) was added to fumed silica (0.5 g) and the sample was sonicated for 2 min at room temperature. To this mixture, either AzoOH, AzoO(CH2)3OH or AzoO(CH2)11OH was added at a concentration corresponding to 100, 60 or 20% of the maximum available surface hydroxyl groups. The solution was refluxed for 3 h and dried in vacuo before being transferred to an oven and heated at 200 °C for 18 h. The resulting powder was Soxhlet-extracted for 48 h in acetone and dried. Nine different solid samples were produced and are referred to as AzoOH-silica, AzoO(CH2)3OH-silica and AzoO(CH2)11OH-silica with a nominal surface grafting density of either 1, 3 or 5 molecules per nm2.Characterisation of modified fumed silica particles
Diffuse-reflectance UV-Vis (DRUV) measurements were carried out using a PerkinElmer Lambda 750 spectrophotometer equipped with a Labsphere 60 mm RSA ASSY integrating sphere. Samples were measured in a powder sample holder with a fused quartz disc. Spectra were then transformed using the Kubelka–Munk transformation.31 Dynamic light scattering (DLS) was conducted using a Malvern Zetasizer Nano equipped with a He–Ne laser emitting at 633 nm with a 4 mW power source. The scattering intensity was detected at a backscatter angle of 173°. Samples (0.2 mg mL−1) were prepared by dispersing azo-grafted silica particles in triple-filtered (0.2 μm) H2O and sonicating for 2 min. For samples that were too hydrophobic to be dispersed in H2O, propan-2-ol was used. The hydrodynamic diameter (Dh) was calculated by assuming that the diffusing particles were monodispersed spheres. The Dh was averaged from 3 runs of approximately 20 measurements each. Cumulants analysis, which is a fit of the logarithm of the correlation function, gave a mean value for the diameter (Z-average) and width parameter of the distribution, the polydispersity index (PDI). Elemental analysis was conducted using an Exeter Analytical CE-440 elemental analyser and the percentage of nitrogen present used to calculate the number of azobenzene molecules that are present at the surface of the silica (see ESI,† Section 2). Dispersion tests were carried out by adding 1 mg of the functionalised silica powders to 1 mL of either silicone oil (100 mPa S), diethyl adipate, n-hexadecane or water and sonicating for 2 min using a Fisherbrand S-series sonication bath. Samples were considered dispersed if no aggregates were visible to the naked eye.Determination of surface energy from contact angle measurements
The difficulties that exist in determining the surface energy of irregular solid powders have been discussed previously.32,33 This work follows a similar procedure to Binks et al.32,33 Briefly, azobenzene-modified silica powers were adhered to glass slides using cotton-paper double-sided tape and tested with 4 different liquids: water, glycerol, ethylene glycol and α-bromonaphthalene. An FTA1000 B contact tensiometer was used to measure the contact angles between test liquids and the solid. Static contact angles of a drop of each test liquid (ca. 10 μL) were measured and the average of at least 3 droplets was taken. For UV-irradiated samples the process was carried out in the dark and a 575 nm longpass filter applied to the front of the instrument's illumination source (a diffuse white light-emitting diode (LED)). Further details regarding data processing can be found in the ESI† (Section 7).Preparation of Pickering emulsions
Pickering emulsions were prepared by adding as-synthesised Azo-silica particles to equal volumes (1 mL) of H2O (Millipore) and diethyl adipate or n-hexadecane. Particles were initially dispersed in the oil by sonicating at room temperature for 2 min using a Fisherbrand S-series sonication bath and water added. Homogenisation was then carried out using a Sciquip basic homogeniser (max. 30000 rpm) operating at 50% speed for 2 min while cooling the samples in an ice bath. Samples were contained in a vial during homogenisation (inner diameter 16.8 mm, outer diameter 18.6 mm) and the homogeniser tip placed 8 mm from the bottom of the vial.
Characterisation of Pickering emulsions
Pickering emulsions were characterised via optical microscopy by pipetting a droplet of the emulsion layer onto a glass slide. Samples were analysed both 15 min and 24 h after homogenisation. Images were recorded using a Canon 400D camera mounted to a Swift 350T microscope using an ×4 objective at a resolution of 5184 × 3456 px. To acquire the droplet sizes, a computer vision technique that uses the circle Hough transformation was first used to extract a series of ‘circles’ from the microscopy images.34 A programme utilising the circle Hough transform, provided as part of OpenCV,35 was developed, which is able to scan across the acquired microscope images.36 More information on this technique can be found in the ESI† (Section 3). To ascertain whether oil-in-water or water-in-oil emulsions formed, samples were dyed with a minimum quantity of Nile red (a lipophilic dye)37 and the stained component of the optical micrographs was determined to be the oil phase. The emulsion stability was determined by assessing the fraction of oil/water phase resolved over the course of 21 days for n-hexadecane emulsions and 14 days for adipate emulsions.Irradiation with light
Sample irradiation was carried out using high-power UV and blue LEDs (365 nm, 6.00 mW cm−2 irradiance and 455 nm, 5.16 mW cm−2 irradiance, respectively) for 20 min. Solid powders were irradiated directly with regular agitation of the samples. Coated slides were irradiated similarly. For samples that showed photoswitching (as determined by DRUV), a colour change from yellow to dark orange was observed, corresponding to photoisomerisation of the azobenzene chromophore from the trans to cis form.Results and discussion
The hydrophobicity of the particle stabilisers in their native state (i.e., before photoswitching) is important in determining which type of emulsion forms (see Fig. 1, regions I–IV). In this work, the hydrophobicity is modulated in two ways: (i) the length of alkyl spacer separating the azobenzene photoswitch from the particle surface and (ii) the grafting density on the particle surface (n Azo molecules per nm2). For clarity, the azobenzene-modified particles are denoted as “Azo-silica (number of molecules of azo per nm2 surface area).”Grafting of azobenzene derivatives to fumed silica
AzoOH, AzoO(CH2)3OH and AzoO(CH2)11OH were grafted to fumed silica particles via alkoxidation of the surface silanol groups using a heat treatment method.38 Grafting was confirmed via DRUV measurements following a solvent extraction step which removed non-bound azobenzene. The DRUV spectra of the particles show characteristic peaks at approximately 340 nm and 440 nm corresponding to the π–π* and n–π* transitions of the azobenzene species, respectively (ESI,† Fig. S5).17 No significant changes in the absorption maxima were observed for the different azobenzene derivatives, suggesting that the length of the carbon spacer has negligible effect on the electronic character of the chromophore. We note that DRUV spectra are comparable to UV/Vis absorption spectra for the Azo ligands in solution (ESI,† Fig. S6).The degree of surface functionalisation was synthetically controlled by varying the quantity of azobenzene species relative to the surface hydroxyl groups in the reaction mixture. The resulting grafting density was determined via elemental analysis (EA, see Table 1; further information available in the ESI† Section 2 and Table S3). As anticipated, a direct correlation between the azobenzene concentration in the reaction mixture and final grafting density is observed. The surface of the fumed silica particles has 5 free hydroxyl groups per nm2 (as according to supplier information39). As calculated from EA data, between 0.4 and 1.7 of the available hydroxyl groups (per nm2 surface area) undergo alkoxidation with the Azo-species. This result is consistent with existing literature for silanol–alcohol condensation38,40,41 and the density obtained does not show a significant dependence on the choice of Azo chromophore. Notably, the relationship between the reaction concentration and grafting density is non-linear, and never reaches the maximum theoretical grafting density, suggesting that there is reduced access to the silanol sites at higher grafting densities, or that some of the reactive silanol sites may have been removed during the heating step (200 °C) of the grafting reaction.38,42
| System | No. of molecules per nm2 (synthesis) | Grafting density molecules per nm2 (EA) | Water | Diethyl adipate | n-Hexadecane | Silicone oil |
|---|---|---|---|---|---|---|
| AzoOH-silica | 1 | 0.5 | • | • | • | ○ |
| 3 | 1.0 | • | • | • | ○ | |
| 5 | 1.5 | • | • | • | ○ | |
| AzoO(CH2)3OH-silica | 1 | 0.6 | • | • | • | ○ |
| 3 | 1.4 | ○ | • | • | • | |
| 5 | 1.7 | ○ | • | • | • | |
| AzoO(CH2)11OH-silica | 1 | 0.4 | • | • | • | ○ |
| 3 | 1.5 | ○ | ◎ | • | • | |
| 5 | 1.7 | ○ | ◎ | • | • |
DLS confirmed that no significant change in the size or polydispersity of the particle occurred during the grafting process. All particles showed a mean hydrodynamic diameter of DH ∼ 200 ± 50 nm, which is in good agreement with the unmodified fumed silica samples (ESI,† Table S4 and Fig. S8).
Dispersion tests with liquids of varying polarity (Table 1) showed a marked change in hydrophobicity for AzoO(CH2)3OH- and AzoO(CH2)11OH-silica particles with surface coverages >20%. These samples no longer dispersed in water but could be dispersed in silicone oil. This was not observed for AzoOH, which was insoluble in silicone oil at all grafting densities consistent with previous studies.38
Light-response of Azo-silica powders
We have seen that the hydrophobicity of fumed silica can be tuned by varying the spacer length and grafting density of the Azo modifiers. The next step was to assess the change in hydrophobicity that resulted from photoisomerisation of the grafted chromophores under UV light. This could be observed visually by the sample colour change from yellow to orange (ESI,† Fig. S7). Conversion to a cis-dominant photostationary state (PSS) is further indicated in the DRUV spectra by a decrease in intensity of the π–π* transition at 340 nm, accompanied by an increase of the cis-centred n–π* transition at 440 nm.17,43,44Comparable DRUV spectra were obtained for both AzoO(CH2)3OH- and AzoO(CH2)11OH-silica samples at all grafting densities (Fig. S5, ESI†). The PSS composition was determined to be ∼70–85% cis-isomer for both AzoO(CH2)3OH- and AzoO(CH2)11OH-silica, depending on the grafting density (see Tables S1 and S2 and Section 2, ESI†). In contrast, the cis-isomer absorption peak was essentially absent for AzoOH-silica at all grafting densities. This is due to the enhanced rate at which AzoOH thermally isomerises back to the trans-form, particularly in polar solvents to which it can hydrogen bond,17 making measurement of the cis-isomer difficult without the use of ultra-fast spectroscopic techniques.
Dispersion tests were also performed using UV-irradiated Azo-silica particles. From Table 1 it can be seen that irradiation had a negligible effect on the dispersion results for all samples except AzoO(CH2)11OH-silica-(1.5 and 1.7 molecules per nm2). In the trans form, these samples aggregated in diethyl adipate but upon UV irradiation their hydrophobicity decreased sufficiently for them to disperse. For all other samples it is expected that there is a change in hydrophobicity, but this is not sufficient to change the compatibility with the dispersants used here.
Emulsion stability
So far, we have demonstrated a facile method to control the surface grafting and thus hydrophobicity of fumed silica particles using Azo derivatives with different spacer lengths. These particles also exhibit different photoswitchable responses. A series of emulsions was then made in order to evaluate how these particle characteristics affect the emulsion stability and their ability to undergo morphological changes in response to light.Emulsions were prepared containing an equal volume of H2O and diethyl adipate and 10 mg mL−1 particle loading. Fig. 3 shows representative images of the emulsions obtained. Average particle sizes and dispersity for all samples can be found in the in the ESI,† Table S5. For all particles, characteristic droplets of a W/O emulsion are seen, where water droplets are dispersed throughout the continuous diethyl adipate phase. Emulsion stability was assessed by measuring the fraction of oil or water phase that was resolved over the course of >14 days (ESI,† Fig. S9 and S10). No significant change in the droplet size or dispersity was observed over this period.
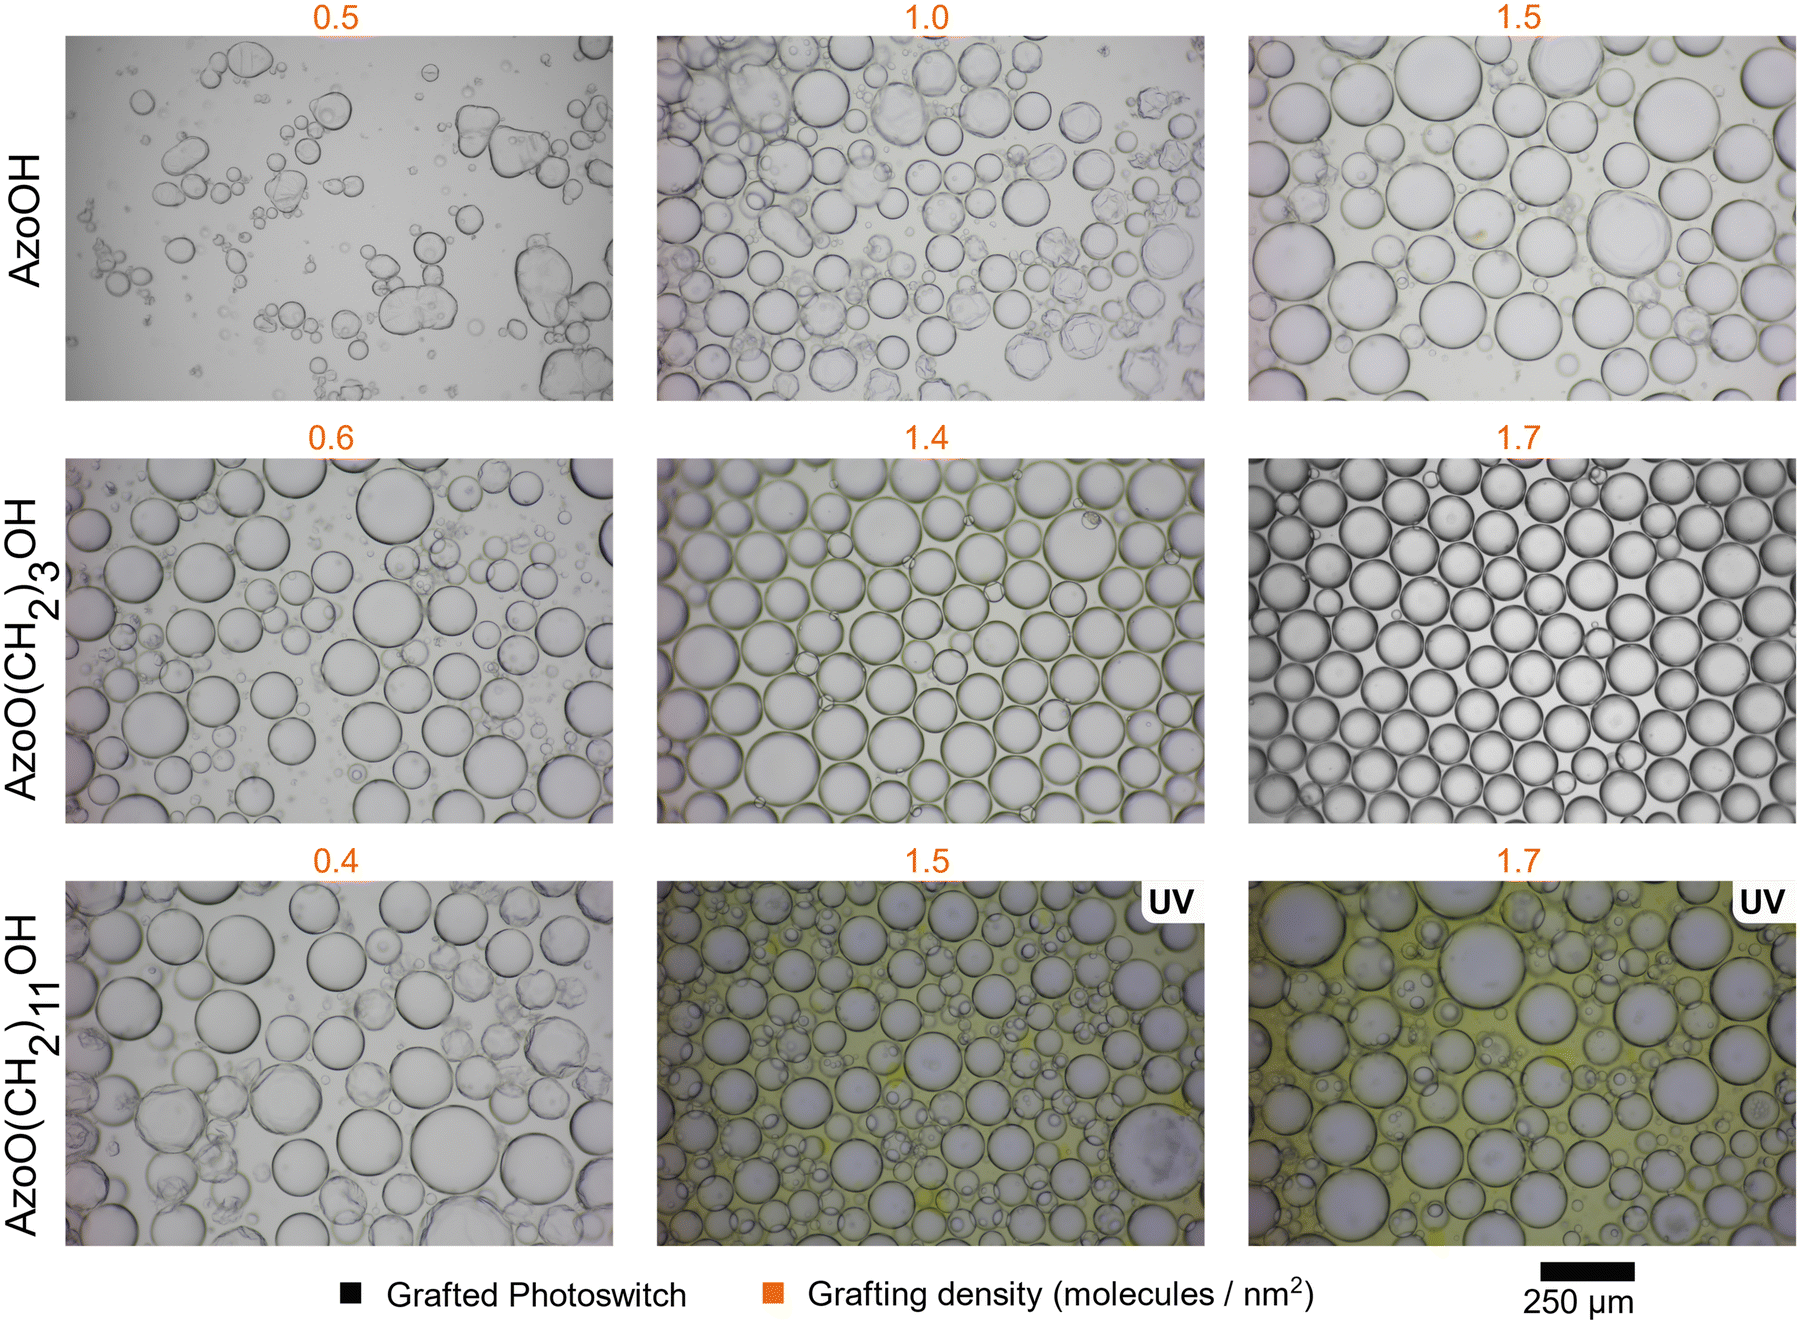 | ||
| Fig. 3 Optical microscopy images of W/O particle-stabilised emulsions (10 mg mL−1 relative to H2O) with (i) AzoOH-, (ii) AzoO(CH2)3OH- and (iii) AzoO(CH2)11OH-silica at different grafting densities (values shown in orange text). Morphological differences arising from changes in surface energy of the particles are apparent. AzoO(CH2)11OH-silica (1.5 and 1.7 molecules per nm2) were irradiated with UV light before emulsion preparation as the non-irradiated counterparts did not form a stable emulsion. All images were taken 24 h after emulsion formation. | ||
Interestingly, AzoO(CH2)11OH-silica (1.5 and 1.7 molecules per nm2) did not from stable emulsions in the trans-state (ESI,† Fig. S9c), instead favouring formation of oil-phase aggregates (Fig. 1 – IV). However, when irradiated with UV light, the emulsion was stabilised (Fig. 1 – III). From Fig. 3, we observed that these stable emulsions are more polydisperse than trans-stable emulsions for the other systems and the oil phase appears yellow, indicating the presence of aggregated particles. This suggests that not all of particles reach the interface during homogenisation. This could be due to the higher hydrophobicity of both isomers of AzoO(CH2)11OH-silica (compared to the other Azos) or alternatively a result of the reduced penetration depth of the light into the particle aggregates, which results in incomplete photoswitching. These UV-stabilised emulsions have a similar stability to coalescence/sedimentation (see ESI,† Fig. S9) as similar grafting density, but more hydrophilic particles (i.e., AzoO(CH2)3OH). For all other samples, UV irradiation did not affect the emulsion morphology or stability, with similar emulsion droplet radii and polydispersity observed. The stability of the UV-stabilised emulsions was also assessed at different water fractions to see if catastrophic inversion could occur,32 but no such process was observed (ESI,† Section 5 and Fig. S11).
In situ irradiation experiments were performed on the AzoO(CH2)11OH-silica emulsion (1.5 molecules per nm2, 10 mg mL−1) to demonstrate the reversibility of the emulsification/demulsification process and to show that switching could occur while the particles were adsorbed at the droplet interface (Fig. 4 and Fig. S12, ESI†). The emulsion mixture was irradiated with either UV (365 nm) or blue (450 nm) light and homogenised between images. In the trans form, the particles are too hydrophobic to form a stable emulsion, and favour aggregation. Following UV irradiation, an emulsion containing densely packed, spherical droplets is formed. When this sample is then irradiated with blue light under stirring to induce reverse cis–trans isomerisation, the droplets disperse and particle aggregates form. The irradiation-homogenisation process can be cycled with similar morphologies achieved each time. However, the mean droplet radius decreases with cycling, and the sample becomes less polydisperse (Fig. 5). This is attributed to better dispersion of the Azo-silica aggregates through repeated homogenisation processes, which effectively increases the available surface area on the stabilising particles. The ability to cycle these materials between stable and unstable states suggests that they are suitable candidates for light-responsive encapsulant applications such as biphasic catalysis.
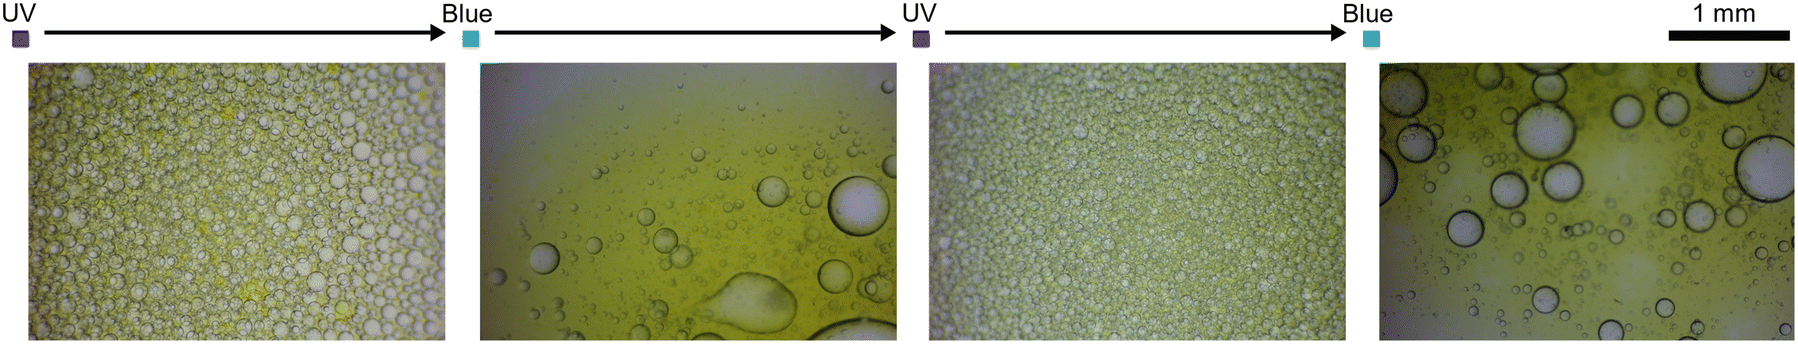 | ||
| Fig. 4 Optical microscopy images of W/O AzoO(CH2)11OH-silica (1.5 molecules per nm2) stabilised emulsion (particle conc. = 10 mg mL−1 relative to H2O) that is light-responsive. The oil–water mixture was irradiated with either UV (365 nm) or blue (450 nm) light and homogenised prior to image capture. The images represent 2 cycles of emulsification and demulsification. | ||
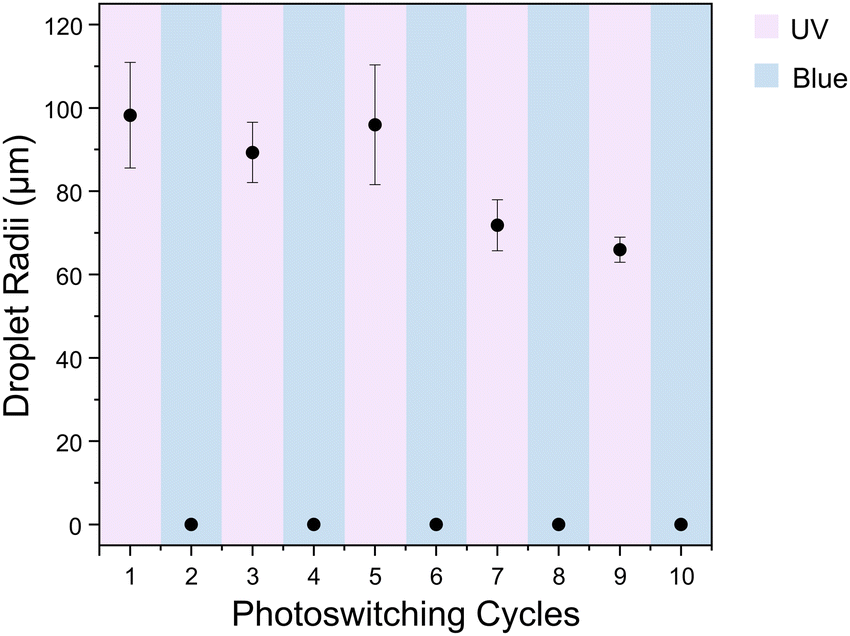 | ||
| Fig. 5 Change in mean droplet radii after successive irradiation and homogenisation cycles with UV and blue light, alternating between ∼60–120 μm droplets and 0 μm, indicating aggregation and loss of droplets. Blue bars indicates that the emulsion has been irradiated with blue light and pink bars indicates irradiation with UV light. Error bars show polydispersity of droplets formed. | ||
We note that diethyl adipate oil is quite polar and partially soluble in water.29 It was chosen in this study as it is likely to form unstable emulsions with hydrophobic particles (Table 1). To show parity with existing literature, hexadecane, a less polar oil was also investigated. The analogous hexadecane systems follow broadly similar trends (ESI,† Fig. S10).
The main difference is that all emulsions remain stable and O/W emulsions are now accessed by the most hydrophilic particles (see ESI,† Table S6). None of the emulsions were found to show significant changes upon UV irradiation suggesting that in hexadecane the hydrophobicity of the particles is not near enough to any of the boundary points identified in Fig. 1.
Estimation of particle surface energy
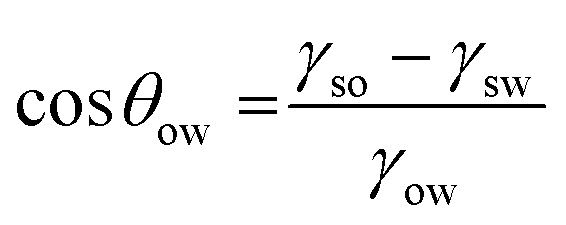
We have shown qualitatively that the particle hydrophobicity can be tuned and increased to a point where an emulsion is no longer stable (for a given oil) and that UV-irradiation increases the hydrophilicity and allows emulsion stabilisation for some systems. However, to rationally design a light-responsive emulsion, we now need to quantify the particle hydrophobicity and use this to predict the emulsion stability for each photoisomer.The contact angle of the solid particle at the oil–water interface (θow) dictates whether it sits preferentially in the oil or water phases. This gives an indication of the preference of the solid particles for the oil phase in both the cis and trans states and allows us to predict whether a light-response would be seen with oils other than diethyl adipate.28 While θow is difficult to measure experimentally, it can be estimated from the interfacial energies according to:
 | (1) |
| γ = γd + γp | (2) |
The interfacial energy between two different phases can then be calculated as follows, shown for the oil–water interface as an example:
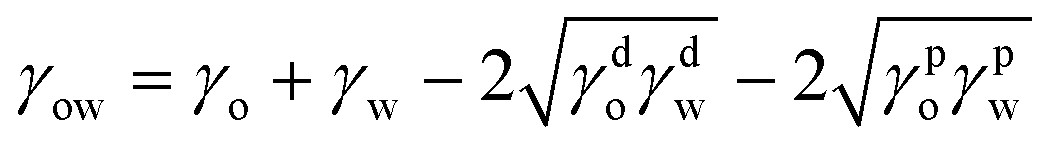 | (3) |
Values for the various γ components for common liquids are readily available in the literature.32,33,49 Estimation of γso or γsw is more complicated as γds and γps for the Azo-silica particles are unknowns. One solution is to determine these values indirectly from the solid–liquid contact angle, obtained from combination of the relevant forms of eqn (1) and (3):
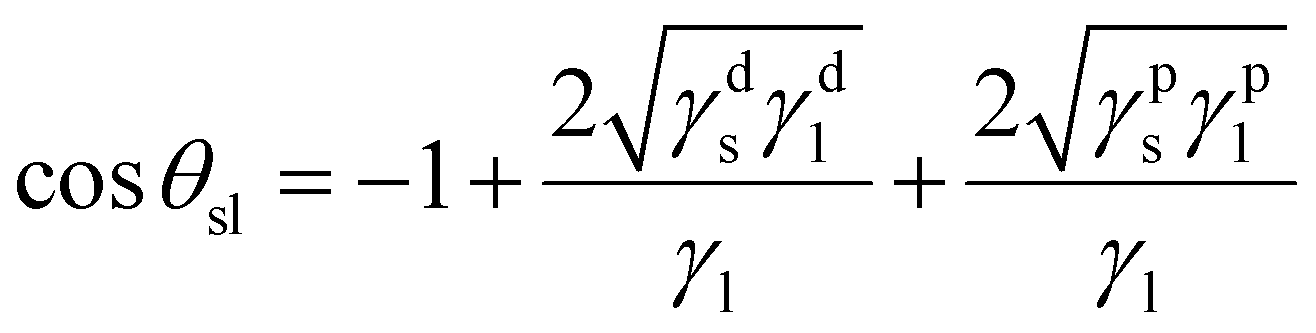 | (4) |
Using contact angle measurements between a particle-coated surface and a series of test liquids (l) of known polarity enables values for γds and γps to be estimated using a weighted least-squares analysis to find the values that best fit all the liquids simultaneously, represented as a 3D surface energy plot (see Fig. 6 and Fig. S13, ESI† for examples).33 The test liquids chosen in this work are water, glycerol, ethylene glycol and α-bromonaphthalene (see Table S7, ESI† for literature data of interfacial tensions). Further information on these calculations can be found in the ESI† (Section 7).
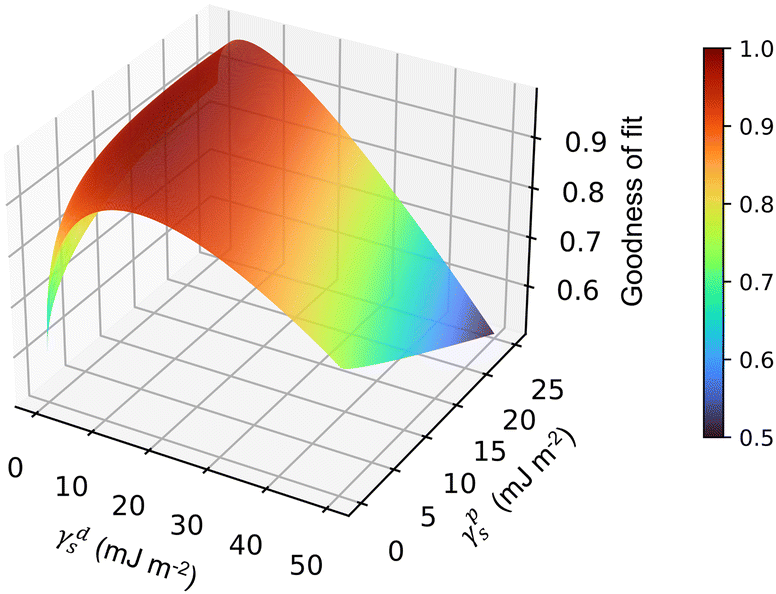 | ||
| Fig. 6 Example 3D surface energy plot for AzoO(CH2)11OH-silica (0.6 molecules per nm2) giving the ‘goodness of fit’ for different values of γps and γds. The highest point represents the best fit values of γps and γds. | ||
Table 2 gives the polar and dispersive components for each Azo-silica sample determined from the surface energy plots, and the estimated total surface energy, γs, at the solid–air interface (calculated from eqn (2)). The overall trend shows a decrease in the surface energy with increasing length of the carbon spacer, and by extension, an increase in the hydrophobicity. A similar surface energy is obtained for all grafting densities of AzoOH, due to its relatively hydrophilic nature compared to AzoO(CH2)3OH and AzoO(CH2)11OH. This is consistent with studies on the hydrophobisation of fumed silica, where partial or substantial fluorination, respectively, led to similar changes in surface energy.33
| System | Azo grafting density (molecules per nm2 (EA)) | γ ds/mJ m−2 | γ ps/mJ m−2 | γ s/mJ m−2 | |||
|---|---|---|---|---|---|---|---|
| No UV | UV | No UV | UV | No UV | UV | ||
| AzoOH-silica | 0.50* | 28.3 ± 1.7 | 24.3 ± 7.8 | 5.6 ± 0.1 | 8.5 ± 3.3 | 33.9 ± 1.7 | 32.8 ± 6.2 |
| 1.0 | 25.5 ± 2.3 | 16.1 ± 5.1 | 7.8 ± 0.6 | 18.3 ± 1.8 | 33.3 ± 2.0 | 34.3 ± 6.0 | |
| 1.5 | 20.3 ± 1.6 | 15.5 ± 1.1 | 15.2 ± 3.0 | 12.9 ± 1.8 | 35.4 ± 3.1 | 28.3 ± 2.0 | |
| AzoO(CH2)3OH-silica | 0.6 | 6.2 ± 0.8 | 11.5 ± 1.2 | 25.0 ± 1.7 | 24.8 ± 0.3 | 31.2 ± 1.2 | 36.2 ± 0.9 |
| 1.4 | 1.4 ± 0.3 | 2.4 ± 0.2 | 10.9 ± 1.4 | 15.5 ± 0.7 | 12.3 ± 0.6 | 17.9 ± 1.2 | |
| 1.7 | 1.61 ± 0.4 | 3.6 ± 0.4 | 13.7 ± 1.8 | 17.0 ± 0.6 | 15.3 ± 1.1 | 20.6 ± 1.3 | |
| AzoO(CH2)11OH-silica | 0.4 | 9.2 ±± 2.4 | 5.2 ± 2.2 | 11.1 ± 2.6 | 22.2 ± 2.5 | 20.4 ± 1.7 | 27.5 ± 1.0 |
| 1.5 | 1.2 ± 0.2 | 0.6 ± 1.5 | 2.9 ± 1.5 | 9.4 ± 0.6 | 4.1 ± 1.0 | 10.0 ± 0.6 | |
| 1.7 | 1.8 ± 0.5 | 1.4 ± 0.4 | 5.1 ± 0.7 | 16.2 ± 0.5 | 6.9 ± 1.3 | 17.6 ± 0.7 | |
These results also confirm observations from the dispersion tests, where samples containing the longer carbon spacers showed a marked increase in hydrophobicity at approximately 20% coverage. For AzoO(CH2)11OH-silica, γs drops from 27.5 mJ m−2 to 10.0 mJ m−2 upon increasing the surface coverage from 0.4 to 1.5 molecules per nm2, rendering it unable to disperse in the moderately polar diethyl adipate (γl = 31.7 mJ m−2).28 Moreover, comparison of the different Azo-silica samples shows that the choice of adsorbed molecule is more critical than the grafting density, when modulating the surface hydrophobicity is the aim. Furthermore, there is a critical grafting density (ca. 20%) at which there is a stark increase in hydrophobicity. This may be attributed to both the bulkiness and degree of coverage for molecules with a carbon spacer, which prevent the adsorption of a layer of water.38 It should also be noted that AzoO(CH2)3OH-silica and AzoO(CH2)11OH-silica show a higher surface energy at 1.7 than 1.5 molecules per nm2, which we believe is due to the imprecision of contact angle measurements at high angles (>100°).
Now that we have estimates for the polar and dispersive components of the solid, we can in principle use eqn (3) to calculate the various interfacial energies required in eqn (1) to obtain the contact angle. However, this approach led to overpredicted values of θow (>180°). It has previously been shown that a number of systematic errors inherent to the measurement of finely divided solids make it difficult to accurately predict θow for a given emulsion.28 Moreover, the emulsions investigated here are stable in polar oils. These have a tendency to be overpredicted using this simplistic model, which does not account for the complex structuring of polar molecules at the interface.33,49 Despite this, we can obtain a comparative understanding of the emulsion stability using values of cosθow.
Fig. 7 shows the relationship between the surface energy, γs, of the particle and cosθow, for diethyl adipate oil. Alternate oils (silicone oil, n-hexadecane and ethylene glycol) can be found in the ESI,† Fig. S14. The closer cosθow is to zero, the greater the preference of the solid particles for the aqueous phase. Emulsions that appear below the lower boundary line were experimentally determined to be unstable and formed aggregates. In diethyl adipate all emulsions favoured the oil phase, forming W/O emulsions, so the cosθow values are negative. Overall, increasing the grafting density and using longer carbon spacers led to a shift to more negative values of cosθow, which is attributed to an increasing surface energy with the water phase. Interestingly, the hydrophilic AzoOH-silica has strong preference for the oil phase, greater than AzoO(CH2)3OH-silica (at the same grafting density), arising from its low surface energy with diethyl adipate. It can also be seen that as the Azo grafting density is increased, this preference for the oil phase decreases. This agrees with previous literature where a strong affinity between unmodified fumed silica and adipate oils was reported.29
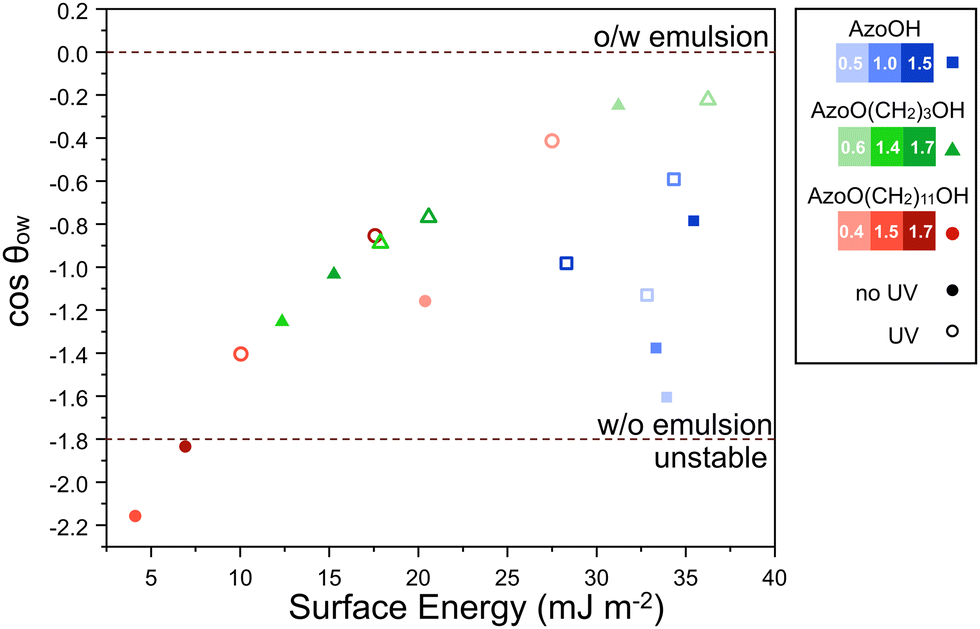 | ||
| Fig. 7 Relationship between the surface energy, γs, and predicted cosθow (from eqn (1)) for Azo-silica particles in diethyl adipate/water emulsions. A general decrease in surface energy with increasing grafting density/length of carbon spacer and a resulting decrease in cosθow is observed, indicating that emulsion formation is less favourable. Note that values are over-predicted and therefore exceed −1 and are used for comparison only. Darker shades of each colour represent higher grafting densities for a given azo derivative. Hollow shapes indicate that the surface energy was calculated using samples irradiated with UV light. The crossover between W/O and unstable emulsion was determined experimentally using optical microscopy on emulsions (particle conc. 5 mg mL−1 relative to H2O) 24 h after preparation and is shown by the dashed lines. | ||
Comparing these results to the stability study and optical microscopy data helps to explain the previously qualitative observations. For example, in diethyl adipate why does AzoO(CH2)11OH-silica form aggregates at 1.5 and 1.7 molecules per nm2 whereas the other solid particles do not? AzoO(CH2)11OH-silica has the greatest preference for the oil phase, particularly for grafting densities of 1.5 and 1.7 molecules per nm2 (cosθow = −2.2 and −1.8, respectively). This is driven by the high interfacial energy with the aqueous phase (γsw = 35 and 42 mJ m−2 respectively). By comparison, the most hydrophobic AzoO(CH2)3OH-silica (1.4 molecules per nm2) has a lower preference for the oil phase (cosθow = −1.2) and so remains stable even at this higher grafting density. This cosθow value is similar to that for AzoO(CH2)11OH (0.4 molecules per nm2) which also forms a stable emulsion. From this it is evident that, in diethyl adipate oil, there is a boundary point at ca. 8 mJ m−2, below which particles aggregate in the oil phase.
For each of the light-responsive systems (AzoO(CH2)3OH- and AzoO(CH2)11OH-silica), irradiation with UV light (Fig. 7, hollow shapes) leads to an increase in the surface energy and a shift in cosθow to more positive values, reducing the preference for the oil phase. This effect is more pronounced at higher grafting densities and may be attributed to a higher surface concentration of Azo moieties. Consistent with optical microscopy, AzoO(CH2)11OH-silica (1.5 and 1.7 molecules per nm2)-stabilised systems uniquely formed W/O emulsions in the cis state, but not in the trans. For the other emulsions, UV irradiation had negligible effect on the droplet morphology, as neither the cis nor trans states had a strong enough preference for the adipate oil phase to induce aggregation.
Predictions were also made for non-UV responsive n-hexadecane emulsions (ESI,† Fig. S14). Overall, results remain over-predicted, especially for polar AzoOH-silica emulsions. However, It can be seen that the most hydrophobic samples (i.e., AzoO(CH2)11OH-silica, 1.4 and 1.7 molecules per nm2) lie further from cosθow = 0, which is in agreement with the observed transition from O/W to W/O morphology. We note that, for some azo-silica samples, despite cis and trans isomers lying at different morphologies (i.e., cosθow above or below 0), no change in emulsion inversion was observed. We attribute this to the imprecision of surface energy analysis noted earlier.
When designing light-responsive emulsions it is clear that both photoisomers need to have a sufficiently different affinities for the oil and water phases to enable different morphologies to form. It should also be noted that the results here are dependent on the choice of oil used in the emulsion. For example, calculations suggest that the use of a more polar oil (e.g., ethylene glycol) would lower the adsorption energy of the particles at the oil–water interface (cosθow shifted closer to 0 – Fig. S10, ESI†) and as such, fewer of the emulsions would be expected to be stable in their native trans state.
Effect of particle concentration
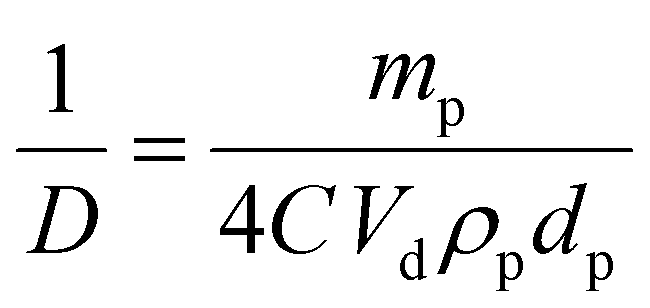
Emulsions containing different particle concentrations were also prepared (2.5, 5, 10, 20 and 50 mg mL−1 with respect to the aqueous phase) to evaluate the surface coverage at the droplet interface and to see if UV irradiation had an effect on the composition of the droplets or the mechanism of stabilisation (ESI,† Table S5). Overall, there is an increase in droplet diameter with decreasing particle concentration, similar to previous studies.50,51 For the more hydrophobic emulsions it can be seen that a minimum particle concentration of 5 mg mL−1 is required to stabilise the emulsion, which supports the lower interfacial stability predicted from surface energy measurements.Under ideal conditions, the droplet diameter is directly related to the number of stabiliser particles that are able to sit at the interface between the two phases:32,51
 | (5) |
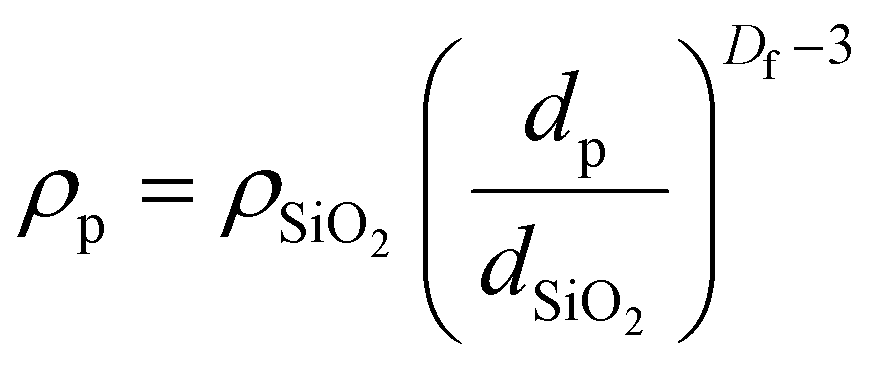
Fumed silica has a fractal aggregate structure and so its density is best described by:50
 | (6) |
Fig. 8(a) gives an example histogram of the droplet sizes obtained from optical microscopy for an AzoO(CH2)3OH-silica (1.4 molecules per nm2) stabilised emulsion (20 mg mL−1).
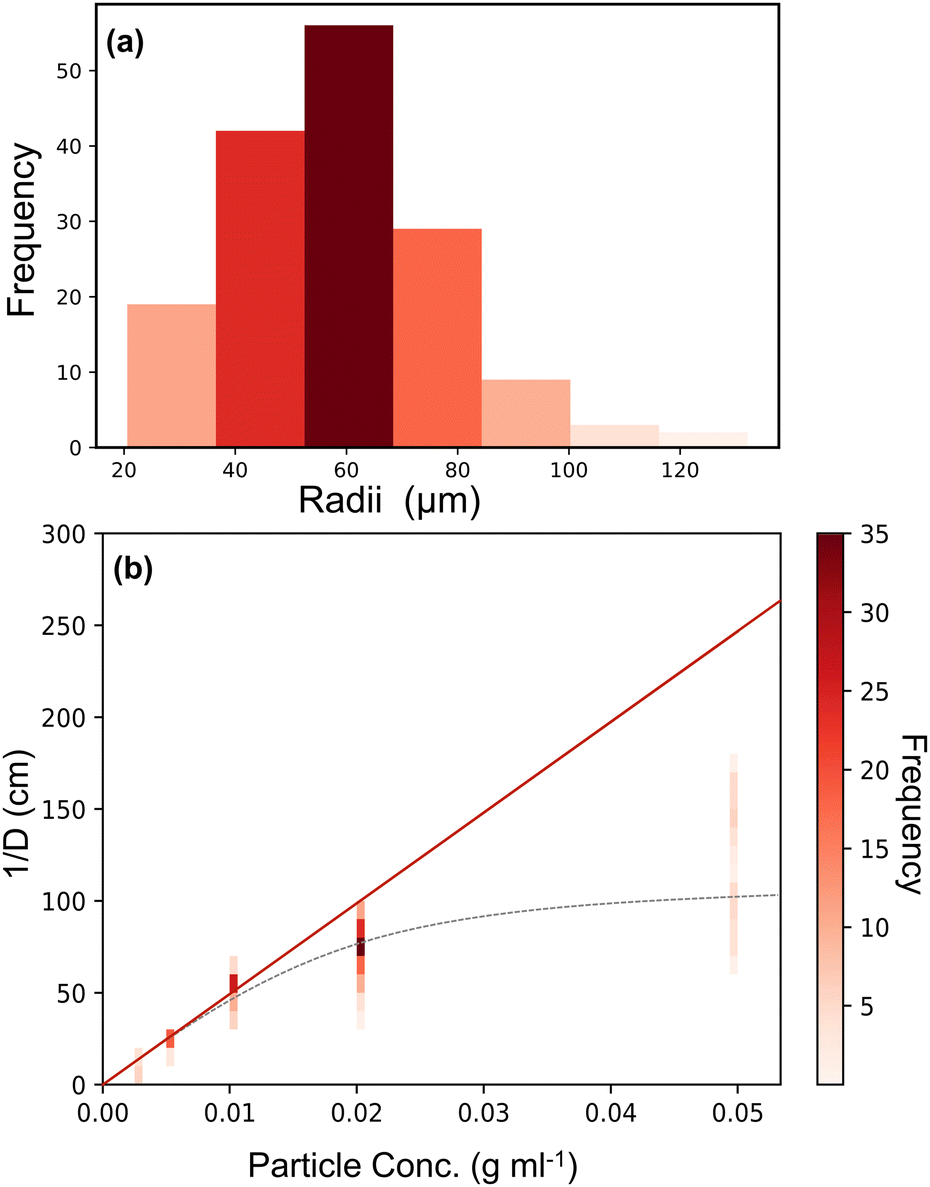 | ||
| Fig. 8 Example plots used for the determination of surface coverage of AzoO(CH2)3OH-silica(1.4 molecules per nm2) particle emulsions. (a) Representative histogram of droplet sizes obtained from optical microscopy for a particle loading of 20 mg mL−1. (b) Plot of inverse mean droplet diameter (1/D) against particle concentration (relative to the oil phase). The red line shows linearity at low concentration and regression is performed using the masses in this region (<0.01 g ml−1). The grey dashed line (---) is only to guide the eye and shows the non-linearity at higher particle concentrations. Coloured vertical bars are analagous to histogram (a) for each particle concentration. More examples can be found in the ESI,† Fig. S15. | ||
Fig. 8(b) shows a typical plot of mass versus 1/D, where the y-axis values are given as a histogram to better represent the particle size distribution. At low particle loadings, eqn (5) holds, indicating that the emulsions form via limited coalescence.16 However, at higher particle concentrations the values deviate from linearity, suggesting that other stabilisation mechanisms dominate, such as aggregation and network formation.50
Using eqn (5) in conjunction with eqn (6), it can be seen that in general the samples show a surface coverage of roughly 20%, as reported in Table 3. This is true for all samples which are stable in their native trans state. This result is consistent with other studies that use fumed silica and the low coverage supports the idea that the interface is stabilised by networks of the branched fumed silica particles.52 The particles, which have a fractal aggregate morphology, are attached to the interface through a reduced number of anchoring points and protrude into the continuous phase.51
| System | Grafting density (molecules per nm2) | Surface coverage (± 0.01) | |
|---|---|---|---|
| No UV | UV | ||
| AzoOH-silica | 0.50* | N/A* | N/A* |
| 1.0 | 0.18 | 0.15 | |
| 1.5 | 0.20 | 0.18 | |
| AzoO(CH2)3OH-silica | 0.6 | 0.21 | 0.18 |
| 1.4 | 0.58 | 0.20 | |
| 1.7 | 0.20 | 0.20 | |
| AzoO(CH2)11OH-silica | 0.4 | 0.18 | 0.21 |
| 1.5 | N/A** | 0.42 | |
| 1.7 | N/A** | 0.39 | |
Notably, the cis-stabilised (UV irradiated) emulsions (AzoO(CH2)11OH-silica, 1.5 and 1.7 molecules per nm2) and the AzoO(CH2)3OH-silica (1.4 molecules per nm2) emulsion formed with a significantly higher surface coverage >0.4. These are also three of the samples with the lowest surface energy. This suggests that the emulsions formed from the most hydrophobic particles are not well described by eqn (5) and are not stabilised by the same mechanism. As shown by optical microscopy, greater particle aggregation occurs in the oil phase for these samples, decreasing the effective mass of particles available at the interface.
Design rules for light-responsive Pickering emulsions
Despite the limited range of morphologies encountered in this system, i.e., W/O emulsions and unstable oil aggregates (Fig. 1 regions III and IV respectively), this work highlights several design considerations when creating light-responsive Pickering emulsions. (i) Foremost, the choice of photoswitch. Photoswitchable particles such as AzoO(CH2)11OH-silica remain isomerised for >1 h and showed a decrease in their surface energy when switched. As a result, a shift from demulsified to emulsified state was seen. Azo-OH-silica, meanwhile, does not switch in a suitable time frame and so no change was seen in the emulsion morphology.(ii) The length of carbon chain used to anchor the photoswitch to the particle surface is also important. Upon increasing from a zero-carbon spacer for Azo-OH-silica to a three-carbon chain for AzoO(CH2)3OH-silica, a photoswitch response was observed, which persisted long enough (>10 min) to be measurable by DRUV spectroscopy. Moreover, longer spacers increase the hydrophobicity of the particle surface. Optical microscopy of particle-stabilised emulsions (10 mg ml−1) showed AzoOH-silica (0.5 molecules per nm2) systems form non-spherical droplets due to their hydrophilic character, while AzoO(CH2)11-silica (1.5 and 1.7 molecules per nm2) do not form stable emulsions in their native trans-state due to their hydrophobic character.
(iii) The grafting density directly influences the particle hydrophobicity, but the relationship is non-linear. For example, a dramatic decrease in surface energy at above 1 molecule per nm2 was observed for both AzoO(CH2)3OH-silica and AzoO(CH2)11OH-silica (ca. 15 mJ m−2). The effect that this has on the resulting emulsion is best seen for AzoO(CH2)11OH-silica, which forms W/O emulsions at 0.4 molecules per nm2 and aggregates in the oil phase at 1.5 molecules per nm2 for the trans form (Fig. 1 – III to IV). The cis isomer does not show the same behaviour.
(iv) Finally, the choice of oil is also important in determining which morphology is the most stable. Using the calculated surface energy, it is possible to predict the particle's preference for a given phase. For example, in a polar oil a hydrophobic particle (e.g., AzoO(CH2)11OH-silica, 1.5 molecules per nm2) will have a much greater preference for the oil phase and form aggregates. Therefore, by choosing an appropriate oil we can modulate the solid–oil interfacial energy so that in the trans state the particle forms aggregates, while in the cis state it forms a stable emulsion (see ESI,† Fig. S14).
In theory, these general principles can be used to access and to transition between any of the morphological regions shown in Fig. 1. For instance, if targeting a transition between aqueous aggregates to O/W emulsions upon irradiation (i.e., Fig. 1 – region I to II), a polar photoswitch should be chosen (short chain, modification with a hydrophilic group), which becomes more hydrophobic upon irradiation (decrease in surface energy) and a hydrophobic oil used. However, there are several limiting factors, such as oil–water miscibility which restricts the maximum polar character of the oil, and the minimum requirement for the number of photoswitch moieties on the surface required to induce changes in wettability upon irradiation. For the present example, increasing the grafting density of the hydrophilic photoswitch is likely to only have a minor effect on the hydrophobicity as bare fumed silica is already hydrophilic in character.
Conclusions
In summary, we have demonstrated that water-in-oil Pickering emulsions (water–diethyl adipate, 1:1 vol) can be stabilised by fumed silica particles that are functionalised with Azo photoswitches. Alkoxidation of the surface using alcohol-terminated azobenzenes proved to be a facile method for varying the surface density of photoswitches on fumed silica particles. Moreover, the surface hydrophobicity of the particles could be tuned by varying the length of the carbon spacer used to attach Azo to the particle surface. Notably, the most the hydrophobic particles (AzoO(CH2)11OH-silica, 1.5 and 1.7 molecules per nm2), did not form stable emulsions in the native trans-state. However, irradiation of these systems with UV light resulted in emulsification, due to conversion of the grafted Azo-molecules to their more hydrophilic cis-state. These systems could be cycled between emulsified and demulsified states through the application of UV or blue light under shear, respectively. To our knowledge, these are the first examples of light-responsive Pickering emulsions that switch between W/O emulsions to aggregates in the oil phase.
A second emulsions system using hexadecane oil was chosen for comparison and a (>14 day) stability study carried out. A mixture of O/W and W/O hexadecane emulsions of varying stability were formed, depending on the hydrophobicity of the particles, and they did not show the same light-response character. These trends were as expected based on the degree of surface modification and choice of photoswitch used on the particles.
Surface energy estimations and interfacial energy predictions combined with optical microscopy analysis on this model system have been harnessed as a powerful tool to understand emulsion stability. This approach has allowed us to identify a set of design principles that should enable light-responsive Pickering emulsions to be accessed more readily. These rules show that through consideration of the key components (particle, photoswitch and oil), it should be possible to tailor the system and its light-response to a given application. Furthermore, by adding electron-donating or withdrawing substituents, the azobenzene chromophore can be tailored to switch at different wavelengths,53,54 overcoming limitations such as poor penetration depth or UV exposure which could hinder use in biological systems.2,53 While we have demonstrated this for a model system based on the Azo chromophore, it is general and can be applied to other photoswitches, e.g., DASA, spiropyrans. This work represents an important advance in the rational design of light-responsive Pickering emulsions and the methodologies employed can be applied anywhere that transient encapsulation is required.
Conflicts of interest
There are no conflicts of interest to declare.Acknowledgements
K. D. R. thanks the EPSRC (EP/R513180/1) for a postgraduate studentship.Notes and references
- C. Albert, M. Beladjine, N. Tsapis, E. Fattal, F. Agnely and N. Huang, J. Controlled Release, 2019, 309, 302–332 CrossRef CAS PubMed
.
- C. L. G. Harman, M. A. Patel, S. Guldin and G.-L. Davies, Curr. Opin. Colloid Interface Sci., 2019, 39, 173–189 CrossRef CAS
- J. Tang, P. J. Quinlan and K. C. Tam, Soft Matter, 2015, 11, 3512–3529 RSC
- Y. Zhang, M. Zhang and H. Yang, ChemCatChem, 2018, 10, 5224–5230 CrossRef CAS
- M. Pera-Titus, L. Leclercq, J.-M. Clacens, F. De Campo and V. Nardello-Rataj, Angew. Chem., Int. Ed., 2015, 54, 2006–2021 CrossRef CAS PubMed
- H. Yang, T. Zhou and W. Zhang, Angew. Chem., Int. Ed., 2013, 52, 7455–7459 CrossRef CAS PubMed
- K. Liu, J. Jiang, Z. Cui and B. P. Binks, Langmuir, 2017, 33, 2296–2305 CrossRef CAS PubMed
- K. Y. A. Lin, H. Yang, C. Petit and W. der Lee, J. Colloid Interface Sci., 2015, 438, 296–305 CrossRef CAS PubMed
- S. Tsuji and H. Kawaguchi, Langmuir, 2008, 24, 3300–3305 CrossRef CAS PubMed
- Y. Chen, Z. Li, H. Wang, Y. Pei, Y. Shi and J. Wang, Langmuir, 2018, 34, 2784–2790 CrossRef CAS PubMed
- E. A. Kelly, J. E. Houston and R. C. Evans, Soft Matter, 2019, 15, 1253–1259 RSC
- Z. Li, Y. Shi, A. Zhu, Y. Zhao, H. Wang, B. P. Binks and J. Wang, Angew. Chem., Int. Ed., 2021, 60, 3928–3933 CrossRef CAS PubMed
- R.-X. Bai, L.-H. Xue, R.-K. Dou, S.-X. Meng, C.-Y. Xie, Q. Zhang, T. Guo and T. Meng, Langmuir, 2016, 32, 9254–9264 CrossRef CAS PubMed
- Z. Chen, L. Zhou, W. Bing, Z. Zhang, Z. Li, J. Ren and X. Qu, J. Am. Chem. Soc., 2014, 136, 7498–7504 CrossRef CAS PubMed
- Y. Chevalier and M.-A. Bolzinger, Colloids Surf., A, 2013, 439, 23–34 CrossRef CAS
- C. Whitby and E. Wanless, Materials, 2016, 9, 626 CrossRef PubMed
- H. M. D. Bandara and S. C. Burdette, Chem. Soc. Rev., 2012, 41, 1809–1825 RSC
- A. A. Beharry and G. A. Woolley, Chem. Soc. Rev., 2011, 40, 4422–4437 RSC
- C. J. Barrett, J. Mamiya, K. G. Yager and T. Ikeda, Soft Matter, 2007, 3, 1249 RSC
- G. S. Hartley and R. J. W. Le Fèvre, J. Chem. Soc., 1939, 531–535 RSC
- C. Zong, M. Hu, U. Azhar, X. Chen, Y. Zhang, S. Zhang and C. Lu, ACS Appl. Mater. Interfaces, 2019, 11, 25436–25444 CrossRef CAS PubMed
- D. Manna, T. Udayabhaskararao, H. Zhao and R. Klajn, Angew. Chem., Int. Ed., 2015, 127, 12571–12574 CrossRef
- H. Zhao, S. Sen, T. Udayabhaskararao, M. Sawczyk, K. Kučanda, D. Manna, P. K. Kundu, J.-W. Lee, P. Král and R. Klajn, Nat. Nanotechnol., 2016, 11, 82–88 CrossRef CAS PubMed
- R. Klajn, Pure Appl. Chem., 2010, 82, 2247–2279 Search PubMed
- Z. Chu, Y. Han, T. Bian, S. De, P. Král and R. Klajn, J. Am. Chem. Soc., 2019, 141, 1949–1960 CrossRef CAS PubMed
- P. K. Kundu, D. Samanta, R. Leizrowice, B. Margulis, H. Zhao, M. Börner, T. Udayabhaskararao, D. Manna and R. Klajn, Nat. Chem., 2015, 7, 646–652 CrossRef CAS PubMed
- R. Klajn, Chem. Soc. Rev., 2014, 43, 148–184 RSC
- J. Frelichowska, M.-A. Bolzinger and Y. Chevalier, Colloids Surf., A, 2009, 343, 70–74 CrossRef CAS
- B. P. Binks and D. Yin, Soft Matter, 2016, 12, 6858–6867 RSC
- Sigma Aldritch Certificate of Analysis, https://www.sigmaaldrich.com/certificates/Graphics/COfAInfo/fluka/pdf/PDF640814.pdf, (accessed 23 February 2022).
-
F. M. Mirabella, Modern Techniques in Applied Molecular Spectroscopy, John Wiley & Sons, New York, 1998 Search PubMed
- B. P. Binks and S. O. Olusanya, Chem. Sci., 2017, 8, 708–723 RSC
- B. P. Binks and A. T. Tyowua, Soft Matter, 2013, 9, 834–845 RSC
-
V. F. Leavers, Shape Detection in Computer Vision Using the Hough Transform, Springer, London, 1992 Search PubMed
- OpenCV, https://opencv.org/, (accessed 29 September 2021).
- Hough-scan, https://github.com/KRichardsF/Hough-Scan, (accessed 28 May 2021).
- R. Plenderleith, T. Swift and S. Rimmer, RSC Adv., 2014, 4, 50932–50937 RSC
- M. Fuji, T. Takei, T. Watanabe and M. Chikazawa, Colloids Surf., A, 1999, 154, 13–24 CrossRef CAS
- Sigma-Aldrich Product Information S5505, https://www.sigmaaldrich.com/deepweb/assets/sigmaaldrich/product/documents/246/034/s5505pis.pdf, (accessed 8 November 2021).
- H. J. H. Kang, R. F. Ali, M. T. Y. Paul, M. J. Radford, I. Andreu, A. W. H. Lee and B. D. Gates, Chem. Commun., 2019, 55, 10452–10455 RSC
- L. T. Zhuravlev, Colloids Surf., A, 2000, 173, 1–38 CrossRef CAS
- A. Kawamura, S. Ueno, C. Takai, T. Takei, H. Razavi-Khosroshahi and M. Fuji, Adv. Powder Technol., 2017, 28, 2488–2495 CrossRef CAS
- P. Sierocki, H. Maas, P. Dragut, G. Richardt, F. Vögtle, L. De Cola, F. Brouwer and J. I. Zink, J. Phys. Chem. B, 2006, 110, 24390–24398 CrossRef CAS PubMed
- Z. Wu, X. Li, X. Jiang, T. Xie, H. Li, G. Zhang and J. Jiang, Phys. Chem. Chem. Phys., 2019, 21, 21030–21037 RSC
- W. A. Zisman, Adv. Chem., 1964, 43, 1–51 CAS
- D. K. Owens and R. C. Wendt, J. Appl. Polym. Sci., 1969, 13, 1741–1747 CrossRef CAS
- F. M. Fowkes, Ind. Eng. Chem., 1964, 56, 40–52 CrossRef CAS
- C. J. Van Oss, R. J. Good and M. K. Chaudhury, J. Colloid Interface Sci., 1986, 111, 378–390 CrossRef CAS
- B. P. Binks and J. H. Clint, Langmuir, 2002, 18, 1270–1273 CrossRef CAS
- J. Frelichowska, M.-A. Bolzinger and Y. Chevalier, J. Colloid Interface Sci., 2010, 351, 348–356 CrossRef CAS PubMed
- S. Arditty, C. P. Whitby, B. P. Binks, V. Schmitt and F. Leal-Calderon, Eur. Phys. J. E: Soft Matter Biol. Phys., 2003, 11, 273–281 CrossRef CAS PubMed
- H. Katepalli, V. T. John, A. Tripathi and A. Bose, J. Colloid Interface Sci., 2017, 485, 11–17 CrossRef CAS PubMed
- D. Wang, W. Zhao, Q. Wei, C. Zhao and Y. Zheng, ChemPhotoChem, 2018, 2, 403–415 CrossRef CAS
- J. Calbo, A. R. Thawani, R. S. L. Gibson, A. J. P. White and M. J. Fuchter, Beilstein J. Org. Chem., 2019, 15, 2753–2764 CrossRef CAS
Footnote |
| † Electronic supplementary information (ESI) available: DRUV data, elemental analysis, DLS, surface energy estimation, optical microscopy processing and surface coverage calculation details. See DOI: https://doi.org/10.1039/d2sm00697a |
| This journal is © The Royal Society of Chemistry 2022 |