
Real time high voltage capacitance for rapid evaluation of dielectric elastomer actuators†
Ang (Leo)
Li
 *,
Siyoung
Lee
,
Haleh
Shahsa
and
Mihai
Duduta
*,
Siyoung
Lee
,
Haleh
Shahsa
and
Mihai
Duduta
Department of Mechanical and Industrial Engineering, University of Toronto, 5 King's College Road, Toronto, Ontario M5S 3G8, Canada. E-mail: shffleo.li@mail.utoronto.ca; duduta@mie.utoronto.ca
First published on 25th August 2022
Abstract
Dielectric elastomer actuators (DEAs) are soft electromechanical transducers that have enabled robotic, haptic, and optical applications. Despite their advantages in high specific energy, large bandwidth, and simple fabrication, their widespread adoption is limited by poor long-term performance. While the mechanical work output has been studied extensively, the electrical energy input has rarely been characterized. Here we report a method to continuously monitor high voltage capacitance during DEA actuation to directly measure the electrical energy consumption. Our approach can track energy conversion efficiency, but also show changes in the device's properties in real-time. This unprecedented insight enables a novel way to study DEAs, evaluate degradation mechanisms, and correlate material structure to device performance. Moreover, it provides a data acquisition platform for data-driven optimization and prediction of long-term actuator performance. This work is a necessary step towards developing ultra-resilient DEAs and enabling a wide range of applications, from wearable devices to soft machines across different scales.
1 Introduction
Artificial muscles mimic the actuation performance of natural muscles,1,2 acting as compliant actuators for soft robots – a new class of machines that can ensure safe interactions with humans, and their environments. These robots have a broad range of applications including search and rescue,3–8 rehabilitation,9–12 haptic feedback,13–16 surgical tools,17–19 and potentially neuromuscular prostheses20etc. Dielectric elastomer actuators (DEAs) are a promising solution for artificial muscles, as direct electro-mechanical transducers, with the structure of a compliant parallel plate capacitor. The dielectric elastomer layer is deformed by Maxwell stress originating from an electric field across the compliant electrodes21,22 (Fig. 1(A)). DEAs can operate at large bandwidths (>500 Hz)3,23 and can achieve specific energy comparable to natural muscles (20 J kg−1).24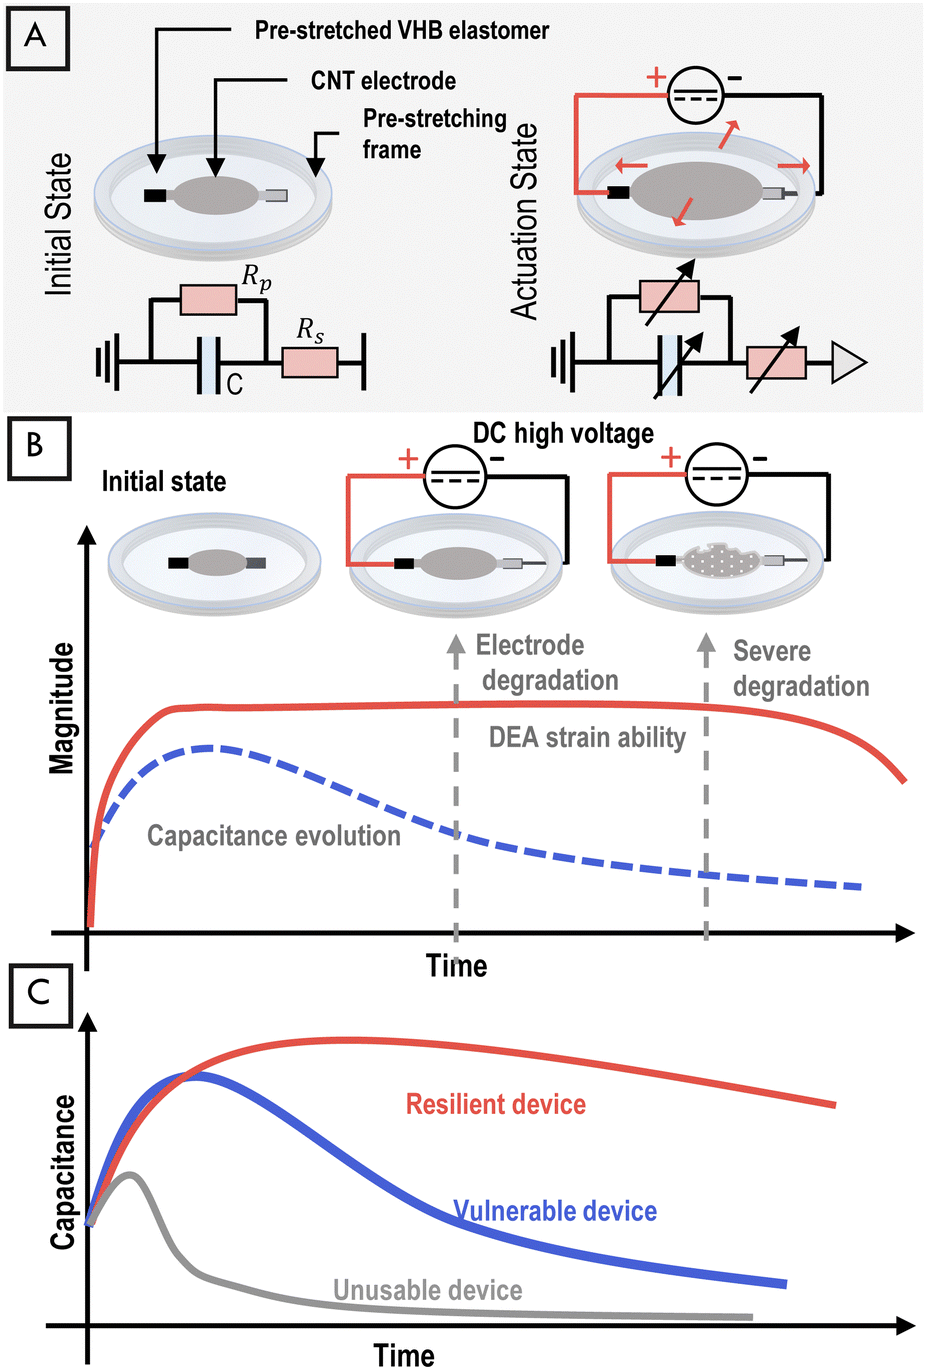 | ||
| Fig. 1 Schematics and the conceptual graph showing the real-time monitoring of DEA high voltage capacitance. (A) The DEAs are fabricated by stamping CNT electrodes onto pre-stretched VHB films (top left). The electrical model of DEAs consists of a capacitor and two resistive components, equivalent series resistance (Rs) and parallel resistance (Rp) (bottom left). Upon actuation, The compliant electrodes expand radially upon applied electrical fields (top right), while all the electrical components are continuously varying in the time domain (bottom right). (B) Conceptual operation of DEAs: as a constant electric field is applied, the stretchable electrodes expand radially (top middle device) and begin to degrade, as reflected in the capacitance evolution (blue dashed line). The strain exhibited by the device (red solid line) shows a plateau throughout its operation and only decays after the device has severely degraded (top right device). (C) DEA evaluation based on high voltage capacitance monitoring: a resilient device shows a high value of capacitance, staying close to its peak for a long duration. A vulnerable device degrades rapidly after reaching a peak in capacitance. Devices which show only minor increases in capacitance when actuated are not usable as DEAs due to rapid degradation. | ||
DEA performance relies on stretchable electrodes, which need to be as soft as possible, as thin as possible, and stay electrically conductive when stretched.25 Carbon nanotubes (CNTs) are promising electrode materials for DEAs.26 The electrodes formed by CNTs are ultra-thin and compliant, conductive when stretched, and adaptable for multi-layering.24,27 However, the electro-mechanical energy conversion mechanism and efficiency across the actuation period are still unclear. Due to continuous degradation of electrodes during high voltage actuation,28 the energy conversion efficiency of DEAs dynamically changes across time, which cannot be analytically modeled. Most research to date has only investigated the mechanical deformation of the device28–30 to characterize the mechanical work output. For electro-mechanical transducers, tracking the evolution of electrical properties during actuation, specifically high voltage capacitance, provides the missing part needed to understand the fundamentals of energy conversion during operation.
As evidenced in earlier work, electrical properties including sheet resistance31,32 and capacitance33,34 can be used to track DEA degradation. However, the change of sheet resistance cannot be linked to the energy conversion and offers little insight into degradation. These high voltage capacitance tracking methods either require complex post-processing of acquired data,33 which limits the ability to monitor devices in real-time, or are constrained to the AC actuation domain for feedback control purposes,34 which restricts the user to a subset of actuation scenarios. Capacitance self-sensing of DEAs has been investigated in previous work.35,36 However the method requires the integration of not widely available self-sensing units and complicated capacitance estimation algorithms. Our work aims to provide a simple method to acquire real-time high voltage capacitance for DEAs with CNT electrodes during actuation (Fig. 1(B) to monitor the electromechanical energy conversion efficiency. Building upon earlier work, the biggest advantages of our method are simplicity and flexibility. (i) Simplicity means the measurement setup directly measures capacitance from the LCR meter in real-time at high voltages and does not require algorithms or equations to process the data, thus enabling rapid evaluation of a large number of devices. (ii) Flexibility means the measurement setup can conduct real-time capacitance measurements at various input voltage profiles (DC or AC) or device geometries without any modifications, thus can be utilized for testing various types of DEAs under different actuation scenarios. Moreover, our method provides a richer understanding of DEA electrical behavior and degradation process (Fig. 1(C)), enabling new research avenues for device evaluation and prediction.
2 Results
To capture the evolution of high voltage device properties of DEAs, we carried out real-time capacitance monitoring during actuation. The DEA to be evaluated, an LCR meter, and a high voltage power supply were interfaced through a custom-designed isolation box circuit that contains mainly a high voltage decoupling ceramic capacitor and resistors with straightforward data acquisition. The data sampling rate for real-time capacitance measurement is 13 Hz. Details of the design and calibration of this simple, plug-and-play measurement setup are presented in SI Appendix, Fig. S6 and S7 (ESI†). Throughout this work, high voltage refers to absolute voltages applied at >1 kV. All the devices presented start at a thickness of 100 μm, meaning the threshold of high voltage (1 kV) corresponds to an electric field of 10 V μm−1. Real-time capacitance data is collected simultaneously once the DEA is actuated by the high voltage power source. A video camera captures the concomitant area expansion, recorded as A/A0 (A is the measured electrode area and A0 is the original electrode area) and electrode degradation condition by taking videos of DEA actuation from a top-down view. The procedure of measuring area expansion is explained in SI Appendix, Fig. S7 (ESI†).The DEAs to be tested were made by attaching circular CNT electrodes on both sides of VHB4910 film after pre-stretching to 3 times its original diameter22 on a circular frame (SI Appendix, Fig. S1, ESI†). We modified DEA electrodes by tuning CNT ink area concentration and mixing ratio of two types of inks with different average CNT lengths (longer ink A and shorter ink B), to modify the conductive network composition. Electrodes were made with purely ink A, ink B, or a mixture of the two. We modified the area concentration of CNT on the electrode by keeping constant the area of the electrodes, and changing the amount of the CNT ink.24 Mixing the two types of ink at different mixing ratios tunes the average CNT length of the conductive network on the electrodes. Fabrication procedures of CNT electrodes are in SI Appendix, Fig. S2 (ESI†). As an analytical framework, the electrical model of a single-layered DEA is perceived as a capacitor with an equivalent series resistance (Rs) and an equivalent parallel resistance (Rs) (Fig. 1(A)).35 The capacitance governs the ability to store electrical energy, (Rs) is the resistive component governing the charge and discharge rate of the capacitor, and Rp is the component governing leakage current. All these electrical components evolve in the time domain during high voltage DC actuation (Fig. 1(A)). Since all the devices made in this work have an identical electrode surface area of 7.07 cm2, for ease of communication, the area concentration of CNT ink μL per 7.07 cm2, is reported by the volume of ink used in μL (for example, 65 μL per 7.07 cm2 is reported as 65 μL).
2.1 Monitoring high voltage capacitance in real time
Real-time capacitance monitoring reveals that the device capacitance and area strain evolve differently when charged at high voltage. While the area strain increases and plateaus, the capacitance hits a peak and decays rapidly. To illustrate this trend, DEAs fabricated with 150 μL of ink A were actuated by continuous DC voltages with various magnitudes for 30 minutes (5, 5.5, and 6 kV). The real-time change in high voltage capacitance (recorded as C/C0, where C is the measured real-time value and C0 is the initial capacitance value) (Fig. 2(A)) and area expansion ratio (A/A0, where A is the measured real-time electrode area and A0 is the initial area) (Fig. 2(B).) were continuously monitored. By applying a higher voltage, the devices reached a higher area expansion (Fig. 2(B)), accompanied by a more dramatic capacitance increase to a higher peak value. Compared to area strain data (comparing Fig. 2(A) and (B)) which shows a monotonous increase, the capacitance starts declining after a short actuation period. The maximum possible increase in capacitance is determined by finite element simulation (FES) using COMSOL, assuming the electrodes are perfectly compliant and conductive (Fig. 2(A)). As can be seen, given above assumptions, the simulated capacitance is constant and does not undergoes time domain evolution, also the magnitude is much higher than the maximum value reached by the experimental data of devices made of real CNT ink electrodes. The misalignment of FES simulated data and the experimental data reveals that the CNT network deformation and degradation under high voltage actuation causes the evolution of capacitance measurement and prevents capacitance from reaching its maximum theoretical value. The detailed FES process and relevant assumptions are shown in SI Appendix, Fig. S9 (ESI†). To have a benchmark for the performance of DEAs made with CNT electrodes, we also conducted experiments to monitor the high voltage capacitance evolution and real-time areal expansion on devices made with carbon grease electrodes (SI Appendix, Fig. S17, ESI†). We discovered that under the same testing conditions, carbon grease electrodes breakdown much earlier, reaching a much lower peak capacitance and areal strain values. The experiments indicate much better strain capacity and breakdown resilience of the CNT electrodes over carbon grease electrodes. The observed rapid evolution of DEA capacitance versus the area strain indicates that real-time high voltage capacitance may be a better in situ indicator of device state-of-health.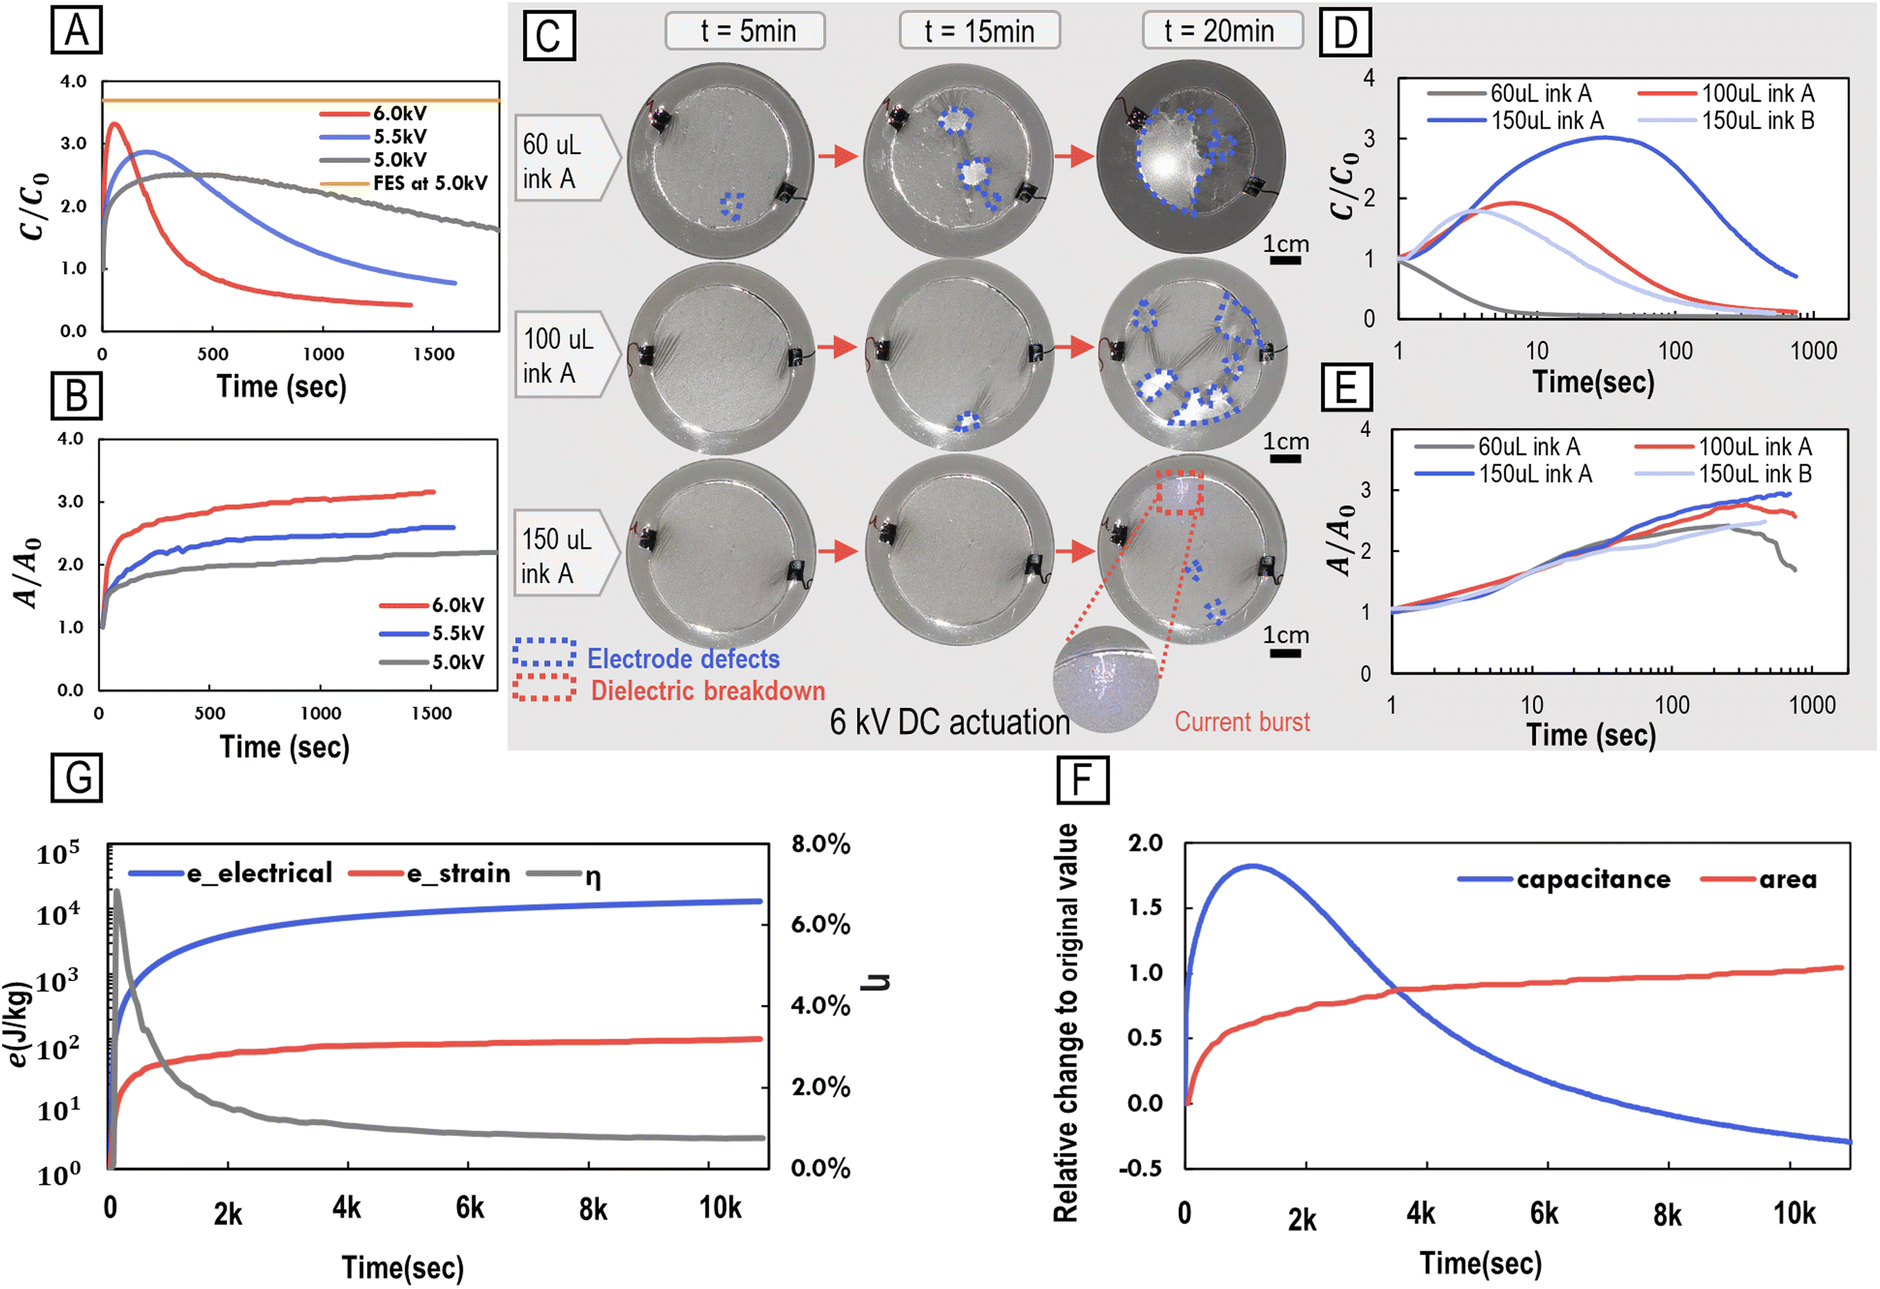 | ||
| Fig. 2 High voltage real-time capacitance monitoring. (A) Capacitance evolution (presented in C/C0) as the ratio to the initial capacitance C0 of DEAs fabricated under the same conditions. These devices are actuated with DC voltage of different magnitude. Testing ends when the dielectric breakdown occurs (at 5.5 kV and 6 kV) or after 30 minutes (at 5 kV). Finite element simulation (FES) result of theoretical capacitance at 5 kV is also plotted (data labeled as “FES at 5 kV”), detailed FES process and relevant assumptions are shown in SI Appendix, Fig. S9 (ESI†). (B) Electrode area expansion ratio, A/A0 as a function of time. The measurement was conducted simultaneously as the same devices being tested in Fig. 2(A). (C) Camera observation of the CNT electrode degradation process for devices with different electrode CNT area concentrations of ink A under continuous 6 kV DC actuation. Under the same actuation voltage, electrode defects appear earlier and more severely for devices with lower CNT area concentration. The current burst causing breakdown is also captured (bottom right image). (D) and (E), The real-time capacitance changing ratio and electrode area expansion ratio are measured for identical devices made with different electrode CNT area concentrations of ink A. Devices with higher CNT area concentrations correspond to higher peak capacitance values (D), indicating higher strain capacity and slower decay (E). (F) Demonstration of a resilient DEA, with electrodes of 200 μL ink A. The vertical axis indicates strain measurements, both capacitive and area strain are plotted as a function of time. (G) For the resilient DEA tested, the specific electrical energy (e_electrical), specific strain energy (e_strain), and energy conversion efficiency (η) is plotted as a function of time. | ||
To test the hypothesis of high voltage capacitance as an indicator of device state-of-health, we compared devices made with CNT electrodes of different average lengths, or different area concentrations. These artificial muscles were actuated by continuous DC voltages with a magnitude of 6 kV for 30 minutes, and the real-time high voltage capacitance, area strain, and electrode surface degradation were monitored via video camera. At the same actuation duration, the electrodes with lower CNT area concentrations show surface defects earlier and with larger defect areas than the ones with higher CNT area concentrations (Fig. 2(C) (detailed electrode comparison with ink B included is in SI Appendix, Fig. S10, ESI†). During actuation, devices with lower electrode CNT area concentration undergo a much earlier and steeper capacitance drop compared to the ones with higher concentration (Fig. 2(D)), while the ones with higher electrode CNT area concentration can reach larger area expansion ratio in real-time (Fig. 2(E)). We tested DEAs with a wide range of CNT electrodes made of various CNT area concentrations of purely ink A or B (SI Appendix, Fig. S11, and S13, ESI†), and different mixing ratios of ink A and B (SI Appendix, Fig. S12, ESI†). The capacitance response across different voltages for these CNT electrode compositions were also recorded (SI Appendix, Fig. S14, ESI†). The results indicated that electrodes containing relatively high CNT area concentration and longer average CNT length (200 μL ink A) tend to maintain better resilience during actuation. By comparing Fig. 2(C)–(E), and data collected in SI Appendix, Fig. S11–S13 (ESI†), we confirmed the hypothesis that the alignment of the camera observation of CNT electrode degradation and the capacitance measurements indicates that capacitance evolution is a real-time indicator of device degradation.
2.2 Evaluating performance from capacitance behavior
Using our method, we can acheive our initial goal and measure the real-time electrical energy consumption and electromechanical energy conversion efficiency of DEAs across the entire actuation period. The test device was a relatively stable DEA made with CNT electrodes of 200 μL ink A, actuated continuously at 5 kV for more than three hours. The electrical specific energy (eelectrical), and strain-specific energy (estrain), presented in Fig. 2(G), can easily be calculated from the capacitance evolution (C/C0) and area strain ((A − A0)/A0) (Fig. 2(F)). The electrical specific energy consumed at a given actuation time step is the integration of instantaneous electrical energy over the actuation period. The electrical-mechanical energy conversion efficiency η = eelectrical/estrain is plotted against time Fig. 2(G). The peak efficiency of 7% is achieved at the early actuation stage. The energy conversion model is explained in SI Appendix, Fig. S15 (ESI†) and the calculation procedures of electrical and strain-specific energy are in SI Appendix, Fig. S16 (ESI†). In this experiment, we demonstrated a resilient DEA that can withstand continuous high voltage actuation at 5 kV (peak electrical field >100 V μm−1), meanwhile having a stable area strain of >100%, with peak electrical specific energy of 110 J kg−1 and peak strain specific energy of >90 J kg−1 considering only the mass of active elastomer region covered by electrodes. When taking in account the mass of the frame and inactive elastomer, the peak specific electrical energy is 2.45 J kg−1 and strain specific energy is >2.19 J kg−1. Previous work37–39 lays a foundation on the electromechanical energy conversion of DEAs but mainly focuses on the initial actuation states. Here, being able to continuously monitor the high voltage capacitance enables further understanding of the energy transfer process over the entire DEA lifetime. With our method, we also discovered that the device degradation rate depends on actuation frequency. DEAs made with identical electrode CNT area concentrations are tested under periodic DC square voltages with the same magnitude but different frequencies. The real-time capacitance is plotted in (Fig. 3(A)). As can be seen from the capacitance evolution, both high frequency (0.25 Hz) and low frequency (0.025 Hz) accelerate the device degradation, while the optimized actuation frequency under which the device can reach a higher peak capacitance with slower decays is around 0.1 Hz. A 0.05 Hz square wave signal with the same magnitude of 5.5 kV is used to actuate DEAs with different amounts of ink A (Fig. 3(B)) or different average CNT length (achieved by changing the mixing ratio of ink A and B), (Fig. 3(C)). As can be seen from both figures, the CNT electrode compositions that contribute to more resilient DC stability generally also show better resilience when a periodic signal is applied. This surprising result shows that the method may enable other researchers to optimize devices for specific actuation frequencies required by different applications.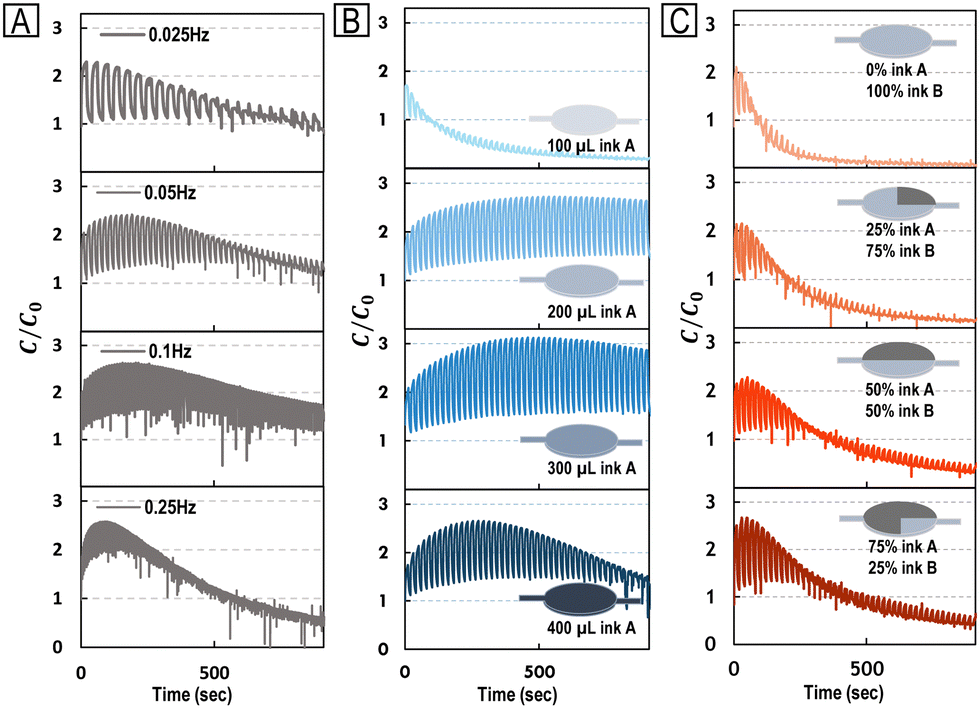 | ||
| Fig. 3 Capacitance monitoring during periodic actuation with DC high voltage square wave. (A) identical devices with CNT area concentration of 150 μL ink A being actuated at inputs with different frequencies (0.025, 0.05, 0.1, and 0.25 Hz) of the same magnitude of 5.5 kV. Actuation frequencies impact the device degradation process, the optimal frequencies need to be selected for each specific application. (B) devices made with electrodes of different area concentrations of ink A, being actuated under the same input (magnitude of 5.5 kV, 0.05 Hz). The data indicates better capacitance stability during actuation, thus better device resilience at relatively high CNT area concentrations. (C) devices made with electrodes of different mixing ratios of ink A and B, but the same total area concentration of 200 μL. These devices are all actuated under the same input (magnitude of 5.5 kV, 0.05 Hz). The devices with longer average CNT lengths electrodes can reach a higher peak capacitance and maintain it for longer, indicating higher actuation stability. | ||
High voltage capacitance monitoring provides significantly more information than low voltage measurements. Without the isolation box described in our methods, measuring capacitance can only be done by directly linking the DEA to the LCR meter, and conducting tests at <10 V. Low voltage capacitance measurement (SI Appendix, Fig. S3A, ESI†) indicates that a smaller number of longer CNTs (ink A) are required to form a percolative network compare to the shorter ones (ink B) because ink A reaches maximum capacitance at much lower CNT area concentration than ink B. Also, longer CNTs are dominating the network formation process, since the data set of mixing ink A and B at a 1![[thin space (1/6-em)]](https://www.rsc.org/images/entities/char_2009.gif) :1 ratio is close to the ink A data set (SI Appendix, Fig. S3A, ESI†). However, by comparing to high voltage capacitance monitoring data (SI Appendix, Fig. S11–S13, ESI†), we discovered that although the low voltage capacitance values are relatively constant beyond saturation concentration, adding more CNTs to electrode contributes to increasing high voltage resilience of electrodes, until reaching very high concentration (>200 μL). Moreover, blending even a small percentage (25%) of shorter CNTs (ink B) to the electrode would result in much more rapid degradation of the device under high voltage actuation, which cannot be captured by low voltage measurements. Scanning electron microscopy (SEM) images (SI Appendix, Fig. S4 and S5, ESI†) confirm the link between electrode area coverage and low voltage measurements.
:1 ratio is close to the ink A data set (SI Appendix, Fig. S3A, ESI†). However, by comparing to high voltage capacitance monitoring data (SI Appendix, Fig. S11–S13, ESI†), we discovered that although the low voltage capacitance values are relatively constant beyond saturation concentration, adding more CNTs to electrode contributes to increasing high voltage resilience of electrodes, until reaching very high concentration (>200 μL). Moreover, blending even a small percentage (25%) of shorter CNTs (ink B) to the electrode would result in much more rapid degradation of the device under high voltage actuation, which cannot be captured by low voltage measurements. Scanning electron microscopy (SEM) images (SI Appendix, Fig. S4 and S5, ESI†) confirm the link between electrode area coverage and low voltage measurements.
3 Discussion
We proposed and demonstrated a simple method to track electrical energy input during the actuation of dielectric elastomer artificial muscles. Beyond our initial goal, we discovered that the key property measured, high voltage capacitance, can provide valuable data in real-time, and a new understanding of device performance. Most surprisingly, we found that tracking mechanical properties alone provides limited insight into actuator degradation. In this work, we demonstrated that the degradation of the CNT conductive network is aligned with the trend of high voltage capacitance evolution (Fig. 2(C)–(E)) and then used this discovery to optimize a resilient electrode composition (Fig. 2(F) and (G)). During electromechanical energy conversion, the electrical properties of DEAs evolve faster than their mechanical properties. Specifically, capacitance mesured at high voltage shows degradation and decay, where area strain suggests a performance plateau (SI Appendix, Movie S1, ESI†). This unique insight may be the key to understanding the causes of device degradation and breakdown, in particular the degradation of the stretchable conductor network, and the energy conversion efficiency of DEAs.The conventional targets for DEA performance may need to be reconsidered, in particular, optimizing devices to reach the highest possible breakdown field. Previous work24 has discovered that lower electrode CNT area concentration contributes to a higher dielectric breakdown limit, suggesting devices should be made with as few CNTs as possible to avoid dielectric breakdown. Following this approach, we recorded the initial equivalent series resistance for the circuit (Rs) and breakdown electrical field (Fig. 4(A).) of DEAs made with various CNT area concentrations of ink A. Same experiments are also conducted for devices with different mixing ratios of ink A and B (Fig. 4(B)). We observed larger values of Rs are correlated with higher breakdown fields, while electrodes with longer average CNT length showed breakdown at lower electrical fields. However, when testing these devices at high voltage, we found that high dielectric breakdown and actuator resilience are not correlated. The metrics we focused on are the remaining capacitance after 30 minutes at 5 kV, the time taken to reach the capacitance inflection point (Ti), and the maximum capacitance reached (recorded as C/C0). By comparing the performance across these new metrics Fig. 4(C) and (D) to the breakdown fields (Fig. 4(A) and 4(B)), a trade-off became apparent – namely, that lower CNT concentrations and shorter CNT lengths slightly increase the breakdown field of the device. However, when devices are operating below the dielectric breakdown limit, as in most practical applications, higher CNT area concentration, and longer average CNT lengths enable more resilient devices, which can withstand high electrical stresses for longer.
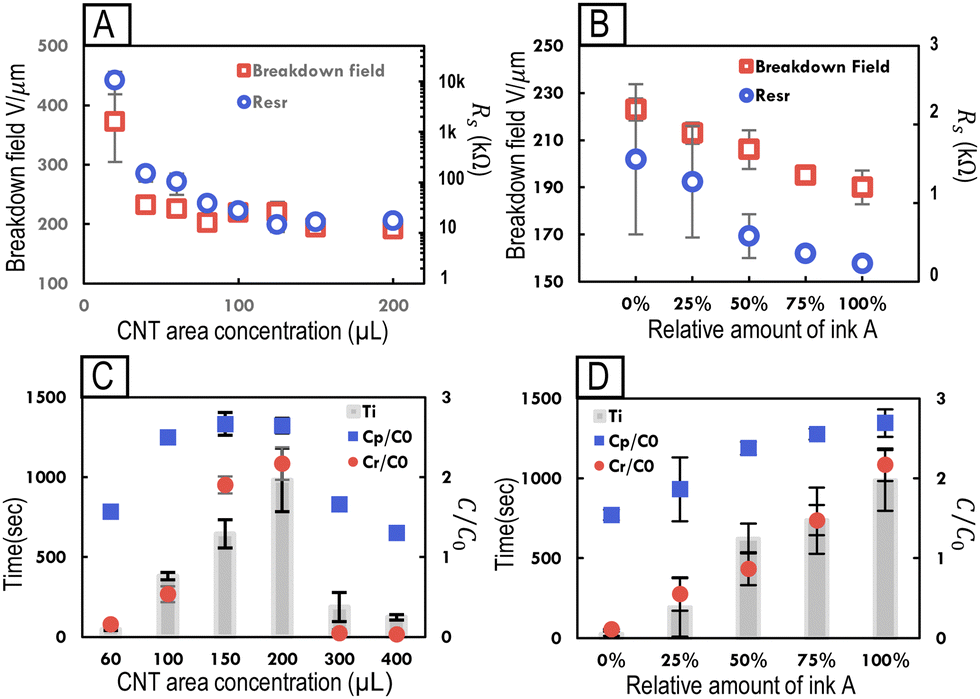 | ||
| Fig. 4 Breakdown and high voltage capacitance stability. (A) and (B) instantaneous dielectric breakdown fields were recorded (left axis) for devices with electrodes of different CNT area concentrations of ink A (Fig. 4(A)), and for devices with different ink A: ink B mixing ratios (Fig. 4(B)). Equivalent series resistance (Rs) for these devices are also recorded (right axis). (C) and (D) The time taken to reach capacitance inflection point Ti for devices with different CNT area concentrations of ink A (Fig. 4(C)), and for devices with different ink A: ink B mixing ratios (Fig. 4(D)) are recorded (left axis), the peak capacitance ratio Cp/C0 (where Cp is the peak capacitance and C0 is the initial capacitance) and the remaining capacitance ratio Cr/C0 (where Cr is the remaining capacitance) across these concentrations are also recorded (right axis). | ||
4 Conclusions
The new method presented here to track capacitance in real time while undergoing high voltage actuation is a powerful data acquisition platform for data-driven optimization and performance prediction of DEAs. For example, by testing devices under 5 kV DC actuation voltage, different capacitance degradation trends can be distinguished within the first 10 minutes (SI Appendix, Fig. S10–S12, ESI†) for devices with various CNT electrode compositions. The proposed method is also flexible since it only requires voltage connections to the sample devices. Thus the proposed method may potentially be further generalized to analyze other dielectric artificial muscles, such as piezoelectric actuators,40 ionic polymer–metal composite (IPMC) actuators,41 Hydraulically Amplified Self-healing Electrostatic (HASEL) actuators,42 and liquid amplified zipping actuators (LAZA).43 We envision this simple method becoming a standard measurement for DEAs across scales, materials, and fabrication methods. With the capacity of collecting large DEA actuation data set with time efficiency, future work can investigate performance and cycle life predictions for individual DEAs in a data-driven research manner. The resources and time required to add this capability are minimal, while the data is extremely powerful at enabling the optimization of devices. We foresee that this method can accelerate the research in developing resilient, high-performance, and energy-efficient electrical artificial muscles.5 Materials and methods
5.1 Fabrication of CNT electrodes
In this work, two types of CNT inks with different average CNT lengths are used to fabricate electrodes, where ink A with longer CNTs refers to Invisicon CNT3500 and ink B with shorter CNTs refers to Invisicon CNT 3600 (both supplied by Nano-C). According to the manufacturer, ink A has an average CNT length of 1 μm, while ink B has an average length of 0.4–0.5 μm.To prepare the CNT ink for electrode fabrication, two types of inks are first transferred to testing tubes using a pipette directly from the bottle with the desired mixing ratio. The ink mixture is then diluted with an excessive isopropanol–DI water mixture (3:1 volume ratio). The mixture is then sonicated for 5 minutes, and a Digital Ultrasonic Cleaner provided by DIGITAL PRO is used for sonication. Insufficiently sonicated inks would result in ununiform CNT aggregations (Fig. S2D, ESI†) on the fabricated electrodes, which causes early dielectric breakdown during actuation. The CNT electrodes were fabricated by filtering the prepared CNT ink mixture through polytetrafluoroethylene (PTFE) filters, as described by earlier works.14,24,27 The complete electrode fabrication procedure is shown in (Fig. S2, ESI†).
5.2 Fabrication of DEA devices
The circle-shaped VHB4910 elastomer film is pre-stretched to 3× of its original diameter onto a rigid circular pre-stretching film. Electrode masks made out of Drytac non-adhesive sheets are cut into the desired electrode shape and aligned on both sides of the elastomer. CNT electrodes are then transferred from the PTFE filter onto the elastomer by stamping. Then take off the mask and filter. Electrical connections are made using thin stranded copper wires, and then the connections are secured with conductive carbon tapes. Detailed fabrication procedure is shown in (Fig. S1, ESI†).5.3 Low voltage capacitance and equivalent resistance measurements
Electrical property measurements are carried out using BK894 bench-top precision LCR meter. Corresponding modes are selected for capacitance (Cp mode), equivalent series resistance (Rs mode) and equivalent parallel resistance (Rp mode) measurements.5.4 CNT electrode sheet resistance measurements
Sheet resistance measurements for CNTs on both PTFEs and VHB films are carried out using the Delcom 20J3 benchtop sensor (Minneapolis, MN, 55413). The electrode is first secured on a flat surface and then place directly in between the two measurement probes, waiting 1 minute for the measurement value to settle down. The measurements indicate an increase in surface resistance when the CNT is transferred from PTFE filters to the VHB film (Fig. S3D and E, ESI†).5.5 High voltage capacitance monitoring setup
Our measurement setup is built by using a custom-designed isolation box circuit to connect the high voltage power source (Gamma High Voltage Research ES100), LCR meter, and the DEA being measured. In this way, the real-time capacitance, equivalent parallel or series resistance and be directly measured in real-time as the DEA is being actuated. The data acquisition relies on a LabVIEW program interfacing the LCR meter and a computer (connected to the LCR meter via USB). The diagram of the entire measurement setup and the circuit diagram of the isolation box is shown in Fig. S6 (ESI†). The circuit calibration procedure is explained in Fig. S7 (ESI†).5.6 Electrode area expansion measurement
A video camera is monitoring the changing process of CNT electrodes during the entire actuation period from a top-down view. The raw video is then taken for post-processing: first compress in length (compress to <5 minutes long), frame rate (to 8 frames per second), and pixel resolution (to 640 × 480 resolution); and then convert the compressed video into Greyscale frames. The area expansion measurements are conducted using the software ImageJ. The pixel-to-distance calibration for each video is first carried out. Then for each frame of interest, the electrode area is measured by extracting contours from the electrode on the frame and measuring its area. The acquired area measurements can then be converted to area strain or area expansion ratio relative to the initial value (A/A0). The above measurement sequence is illustrated in Fig. S8 (ESI†).5.7 Dielectric breakdown characterization
First, the devices are actuated at continuously increasing high voltages until the breakdown is observed. The breakdown voltage vb is recorded. The entire process of the electrode change is monitored by video cameras from a top-down view. The electrode area Ab right before the occurance of breakdown is recorded. The total volume of the active region of elastomers can be calculated based on the device dimension, denoted as VDEA, which is kept constant throughout the entire actuation period prior to breakdown. Thus, the distance between top and buttom electrodes db prior to breakdown is db = VDEA/Ab The breakdown field, Eb can then be calculated as Eb = vb/db (V μm−1).Author contributions
AL fabricated the actuators, built the measurement setup, designed and conducted experiments, analyzed data, and wrote the article; SL conducted finite element simulation, helped with experiment design, and edited the article; HS contributed to SEM imaging, sheet resistance measurement, and edited the article; MD initiated the concept, guided the research and edited the article.Conflicts of interest
There are no conflicts to declare.Acknowledgements
The authors acknowledge support from the Canadian Foundation for Innovation, through the John Evans Leaders Fund – project 42132, and from the National Science and Engineering Research Council of Canada, through a Discovery Grant – RGPIN-2021-02791. S. L. was directly supported by a grant from the National Research Foundation of Korea funded by the Korean government – 2021R1A6A3A03045331.References
- C. S. Haines, N. Li, G. M. Spinks, A. E. Aliev, J. Di and R. H. Baughman, Proc. Natl. Acad. Sci. U. S. A., 2016, 113, 11709–11716 CrossRef CAS.
- T. Mirfakhrai, J. D. Madden and R. H. Baughman, Mater. Today, 2007, 10, 30–38 CrossRef CAS.
- Y. Chen, H. Zhao, J. Mao, P. Chirarattananon, E. F. Helbling, N.-s P. Hyun, D. R. Clarke and R. J. Wood, Nature, 2019, 575, 324–329 CrossRef CAS PubMed.
- E. W. Hawkes, L. H. Blumenschein, J. D. Greer and A. M. Okamura, Sci. Robot., 2017, 2, eaan3028 CrossRef PubMed.
- N. D. Naclerio, A. Karsai, M. Murray-Cooper, Y. Ozkan-Aydin, E. Aydin, D. I. Goldman and E. W. Hawkes, Sci. Robot., 2021, 6, eabe2922 CrossRef.
- T. TolleyMichael, F. ShepherdRobert, C. GallowayKevin, J. WoodRobert and M. WhitesidesGeorge, et al. , Soft Robotics, 2014, 1, 213–223 CrossRef.
- R. F. Shepherd, F. Ilievski, W. Choi, S. A. Morin, A. A. Stokes, A. D. Mazzeo, X. Chen, M. Wang and G. M. Whitesides, Proc. Natl. Acad. Sci. U. S. A., 2011, 108, 20400–20403 CrossRef CAS.
- G. Li, X. Chen, F. Zhou, Y. Liang, Y. Xiao, X. Cao, Z. Zhang, M. Zhang, B. Wu and S. Yin, et al. , Nature, 2021, 591, 66–71 CrossRef CAS.
- Z. Q. Tang, H. L. Heung, K. Y. Tong and Z. Li, Int. J. Robot. Res., 2021, 40, 256–276 CrossRef.
- P. Polygerinos, Z. Wang, K. C. Galloway, R. J. Wood and C. J. Walsh, Rob. Auton. Syst., 2015, 73, 135–143 CrossRef.
- P. Maeder-York, T. Clites, E. Boggs, R. Neff, P. Polygerinos, D. Holland, L. Stirling, K. Galloway, C. Wee and C. Walsh, J. Med. Dev., 2014, 8, 020933 CrossRef.
- R. Nuckols, S. Lee, K. Swaminathan, D. Orzel, R. Howe and C. Walsh, Sci. Robot., 2021, 6, eabj1362 CrossRef CAS PubMed.
- X. Ji, X. Liu, V. Cacucciolo, Y. Civet, A. El Haitami, S. Cantin, Y. Perriard and H. Shea, Adv. Funct. Mater., 2021, 31, 2006639 CrossRef CAS.
- H. Zhao, A. M. Hussain, M. Duduta, D. M. Vogt, R. J. Wood and D. R. Clarke, Adv. Funct. Mater., 2018, 28, 1804328 CrossRef.
- H. Zhao, A. M. Hussain, A. Israr, D. M. Vogt, M. Duduta, D. R. Clarke and R. J. Wood, Soft Robot., 2020, 7, 451–461 CrossRef.
- J. Yin, R. Hinchet, H. Shea and C. Majidi, Adv. Funct. Mater., 2021, 31, 2007428 CrossRef CAS.
- O. Erin, M. Boyvat, J. Lazovic, M. E. Tiryaki and M. Sitti, Adv. Sci., 2021, 8, 2100463 CrossRef PubMed.
- T. Gopesh, J. H. Wen, D. Santiago-Dieppa, B. Yan, J. S. Pannell, A. Khalessi, A. Norbash and J. Friend, Sci. Robot., 2021, 6, eabf0601 CrossRef PubMed.
- J. Lussi, M. Mattmann, S. Sevim, F. Grigis, C. De Marco, C. Chautems, S. Pané, J. Puigmart-Luis, Q. Boehler and B. J. Nelson, Adv. Sci., 2021, 8, 2101290 CrossRef PubMed.
- A. Bruschi, D. M. Donati, P. Choong, E. Lucarelli and G. Wallace, Adv. Healthcare Mater., 2021, 10, 2100041 CrossRef CAS PubMed.
- R. Pelrine, R. Kornbluh, Q. Pei and J. Joseph, Science, 2000, 287, 836–839 CrossRef CAS PubMed.
- E. Hajiesmaili and D. R. Clarke, J. Appl. Phys., 2021, 129, 151102 CrossRef CAS.
- Z. Ren, S. Kim, X. Ji, W. Zhu, F. Niroui, J. Kong and Y. Chen, Adv. Mater., 2022, 2106757 CrossRef CAS PubMed.
- M. Duduta, E. Hajiesmaili, H. Zhao, R. J. Wood and D. R. Clarke, Proc. Natl. Acad. Sci. U. S. A., 2019, 116, 2476–2481 CrossRef CAS.
- S. Rosset and H. R. Shea, Appl. Phys. A: Mater. Sci. Process., 2013, 110, 281–307 CrossRef CAS.
- W. Yuan, L. Hu, Z. Yu, T. Lam, J. Biggs, S. M. Ha, D. Xi, B. Chen, M. K. Senesky, G. Grüner and Q. Pei, Adv. Mater., 2008, 20, 621–625 CrossRef CAS.
- M. Duduta, R. J. Wood and D. R. Clarke, Adv. Mater., 2016, 28, 8058–8063 CrossRef CAS PubMed.
- Z. Peng, Y. Shi, N. Chen, Y. Li and Q. Pei, Adv. Funct. Mater., 2021, 31, 2008321 CrossRef CAS.
- J. Pu, Y. Meng, Z. Xie, Z. Peng, J. Wu, Y. Shi, R. Plamthottam, W. Yang and Q. Pei, Sci. Adv., 2022, 8, eabm6200 CrossRef CAS.
- X. Liu, Y. Xing, W. Sun, Z. Zhang, S. Guan and B. Li, Front. Robot. AI, 2021, 8, 91 Search PubMed.
- D. Kühnel, F. B. Albuquerque, V. Py and H. Shea, Smart Mater. Struct., 2021, 30, 065020 CrossRef.
- F. B. Albuquerque and H. Shea, Smart Mater. Struct., 2021, 30, 125022 CrossRef CAS.
- S. Jiang, C. Tang, X.-J. Liu and H. Zhao, Adv. Eng. Mater., 2021, 2101017 Search PubMed.
- K. Ly, N. Kellaris, D. McMorris, B. K. Johnson, E. Acome, V. Sundaram, M. Naris, J. S. Humbert, M. E. Rentschler, C. Keplinger and N. Correll, Soft Robot., 2021, 8, 673–686 CrossRef.
- T. A. Gisby, B. M. O’Brien and I. A. Anderson, Appl. Phys. Lett., 2013, 102, 193703 CrossRef.
- S. Rosset, B. M. O’Brien, T. Gisby, D. Xu, H. R. Shea and I. A. Anderson, Smart Mater. Struct., 2013, 22, 104018 CrossRef.
- J.-P. L. Bigué and J.-S. Plante, IEEE/ASME Trans. Mechatron., 2011, 18, 169–177 Search PubMed.
- X. Zhao and Z. Suo, Appl. Phys. Lett., 2007, 91, 061921 CrossRef.
- V. T. K. Vo, M. H. Ang Jr and S. J. A. Koh, Soft Robot., 2021, 8, 200–212 CrossRef.
- M. Asghari, S. M. Rezaei, A. H. Rezaie, M. Zareinejad and H. Ghafarirad, J. Intell. Mater. Syst. Struct., 2015, 26, 186–200 CrossRef.
- W. MohdIsa, A. Hunt and S. H. HosseinNia, Sensors, 2019, 19, 3967 CrossRef CAS PubMed.
- E. Acome, S. K. Mitchell, T. Morrissey, M. Emmett, C. Benjamin, M. King, M. Radakovitz and C. Keplinger, Science, 2018, 359, 61–65 CrossRef CAS PubMed.
- T. Helps, C. Romero, M. Taghavi, A. T. Conn and J. Rossiter, Sci. Robot., 2022, 7, eabi8189 CrossRef PubMed.
Footnote |
| † Electronic supplementary information (ESI) available. See DOI: https://doi.org/10.1039/d2sm00690a |
| This journal is © The Royal Society of Chemistry 2022 |