
 Open Access Article
 This Open Access Article is licensed under a
 Creative Commons Attribution 3.0 Unported Licence
Phase separation in evaporating all-aqueous sessile drops†
Alexander
May
,
Johannes
Hartmann
 and
Steffen
Hardt
*
and
Steffen
Hardt
*
Technische Universität Darmstadt, Fachbereich Maschinenbau, Fachgebiet Nano-und Mikrofluidik, Alarich-Weiss-Str. 10, 64287 Darmstadt, Germany. E-mail: hardt@nmf.tu-darmstadt.de
First published on 22nd August 2022
Abstract
The phase transition and phase distribution in an all-aqueous sessile drop containing polyethylene glycol (PEG) and dextran is studied. Evaporation of water triggers the formation of dextran-rich droplets close to the contact line of the drop that subsequently migrate towards the drop center. The likely reason for the droplet migration is Marangoni convection due to stresses at the interface between the dextran-rich droplets and the surrounding liquid.
The evaporation of sessile drops plays a role in a large number of industrial processes, for example inkjet printing1 or spray cooling2 applications. The presence of a solid surface makes the physics of drop evaporation significantly more complex than that of drops fully suspended in a fluid. Perhaps the most prominent signature of this complexity is the coffee-ring effect3–5 that refers to the deposition of species dissolved or suspended in an evaporating drop at the three-phase contact line. Overviews of different aspects of evaporating sessile drops are available.6–8 In the past few years, the evaporation of drops of ternary liquids (containing three different components) has moved into the focus. “Ouzo” drops, i.e. drops consisting of alcohol, water and oil constitute a prominent example. Starting with a miscible ternary system, evaporation induces oversaturation and nucleation of oil drops that form a ring-like structure at the three-phase contact line.9,10
Aqueous two-phase systems (ATPS) form a class of complex liquids that have found numerous applications. They are often ternary liquids consisting of water and two incompatible polymers, such as polyethylene glycol (PEG) and dextran. When the mass fraction of water falls below a threshold value, two immiscible phases are formed. Classical applications of ATPS are in the area of separation and purification protocols that make use of the fact that many biomolecules partition unevenly over the two phases.11,12 In the past few years, novel applications of ATPS have been reported that often utilize microfluidic technologies.13 Examples include DNA14,15 and protein separation by electroextraction, ATPS compartments mimicking specific functionalities of biological cells,16,17 or the patterned delivery of reagents to cells on surfaces.18
In spite of the intensifying research activities related to ATPS, detailed studies on how exactly the transition from a single-phase to a two-phase system occurs and what determines the distribution of the phases on small scales are rather scarce. Boreyko et al.19 studied the phase transition induced by the extraction of water in aqueous PEG-dextran droplets in an oil phase and found core–shell microbeads as the final configuration. Only recently, the phase transition induced by evaporation of sessile ATPS drops was studied. Moon et al.20 performed experiments with ATPS drops initially in a single-phase state and reported that, owing to the higher evaporation rate close to the three-phase contact line, the phase transition is initiated in the contact-line region. Guo et al.21 focused more on the overall evolution of the phase distribution in an evaporating drop. In their experiments with aqueous drops containing PEG and dextran, they observed that dextran-rich droplets are formed close to the contact line, after which they move radially inward, resulting in a dextran-rich central region of the evaporating drop embraced by a PEG-rich ring. They attributed the radial transport to Marangoni stresses acting along the drop surface.
In the present paper, we study the phase transition and distribution in an evaporating sessile aqueous PEG-dextran drop using brightfield and confocal microscopy. In agreement with previous work, we observe the formation of dextran-rich droplets moving radially inward. However, our data suggest an explanation for this phenomenon different from the one summarized above. We conclude that rather than Marangoni convection along the free surface of the drop, Marangoni stresses between two liquids are responsible for the droplet transport.
The experiments were conducted by pipetting a 1 μL drop of aqueous PEG-dextran mixture onto an ethanol-cleaned glass slide. The drop then evaporates under laboratory conditions (22 °C, 40% ± 5% relative humidity). The same liquid composition as reported by Guo et al.21 was chosen: 9% (w/w) PEG 8000 (Carl Roth), 4% (w/w) dextran 10000 (Sigma Aldrich), 0.1% (w/w) Rhodamin B (Carl Roth), 0.1% (w/w) fluorescein isothiocyanate-dextran 10000 (Sigma Aldrich), and 86.8% (w/w) deionized water (Milli-Q, resistivity 18.2 MΩ·cm). The evaporation process was recorded using a Nikon Eclipse TI inverted fluorescence microscope and employing three different imaging modes. Dynamic processes such as droplet transport were recorded in brightfield mode. Apart from that, fluorescence microscopy was performed either in confocal mode (Andor iXon Ultra 897 EMCCD camera, Yokogawa CSU-X spinning disc unit, Plan Fluor 20X objective (NA = 0.75, Nikon)) or in epifluorescence mode (Andor iXon DU897 camera, Plan APO 2x objective (NA 0.10, Nikon)). The fluorophores were excited using lasers of 488 nm and 561 nm wavelength. As Rhodamin B mainly accumulates in the PEG-rich phase and fluorescein isothiocyanate-dextran mainly in the dextran-rich phase, it is possible to distinguish both phases based on fluorescence detection.
Characteristic time stamps showing the time evolution of the evaporating drop are shown in Fig. 1. At the beginning of an experiment, the drop is in a single-phase configuration. A short time later a multitude of dextran-rich droplets become visible close to the three-phase contact line of the sessile drop. The majority of these move towards the centre of the sessile drop, while a small number of dextran-rich droplets remain immobilized. As time passes, at the centre of the sessile drop a region with an increased dextran concentration is formed. This redistribution of PEG and dextran corresponds well to the findings reported by Guo et al.21 for the identical liquid mixture. The evaporation process goes along with a changing contact angle of the drop at the solid surface. At the beginning of an experiment, the contact angle is 68.21° ± 2.24°, after which it decreases while the contact line remains pinned. At a later stage, evaporation proceeds in the constant contact angle mode, with a contact angle of 20.45° ± 1.67°. Typically, the constant contact angle mode is reached after 10–13 minutes of evaporation. About 5 minutes later, the polymer concentration becomes so high that the drop starts behaving like a viscoelastic material. At this stage, the drop shape significantly deviates from a spherical cap.
 | ||
| Fig. 1 Time evolution of the phase distribution inside an evaporating drop, as recorded using epifluorescence microscopy. The time labels indicate the time elapsed after the drop was deposited on the surface. The dextran-rich phase appears in light blue, the PEG-rich phase in red. | ||
The epifluorescence images shown in Fig. 1 only indicate how the phases are distributed in the xy-plane (parallel to the glass surface). To image the phase distribution in z-direction (normal to the surface), we have performed measurements using a fast confocal scanner (Yokogawa CSU-X1 Spinning Disk Unit). Two representative micrographs are shown in Fig. 2. It can be seen that both in the region close to the three-phase contact line and in the region close to the drop centre, the dextran droplets are mostly found at the bottom and are in contact with the glass surface. An explanation for the proximity of the dextran-rich droplets to the solid surface will be given below.
 | ||
| Fig. 2 Confocal fluorescence micrographs showing the phase distribution in a direction normal to the solid surface. The frame at the top shows a region close to the three-phase contact line, the frame at the bottom a region close to the centre of the drop. The liquid surface is indicated by the dash-dotted line. The dextran-rich phase appears in light blue, the PEG-rich phase yellowish. | ||
Fig. 3 provides more details on the phase distribution and flow patterns in the evaporating drops. Notably, in a region close to the three-phase contact line, some of the the dextran-rich droplets perform a recirculating motion. This motion is nicely visible in videos recorded in brightfield mode (see ESI†). The recirculating motion was observable in every experiment. The direction of the recirculation motion was determined by taking advantage of reflection confocal microscopy.22 When using the confocal imaging mode and illuminating the drop with visible light, dextran-rich droplets appear bright when above the focal plane, while they appear dark when below the focal plane. In corresponding experiments, the focal plane was positioned midway between the glass surface and the highest observable point of the sessile drop surface. The direction of motion of the dextran-rich droplets is indicated by arrows in Fig. 3b. Based on that, we identify a recirculating motion as sketched in Fig. 3c.
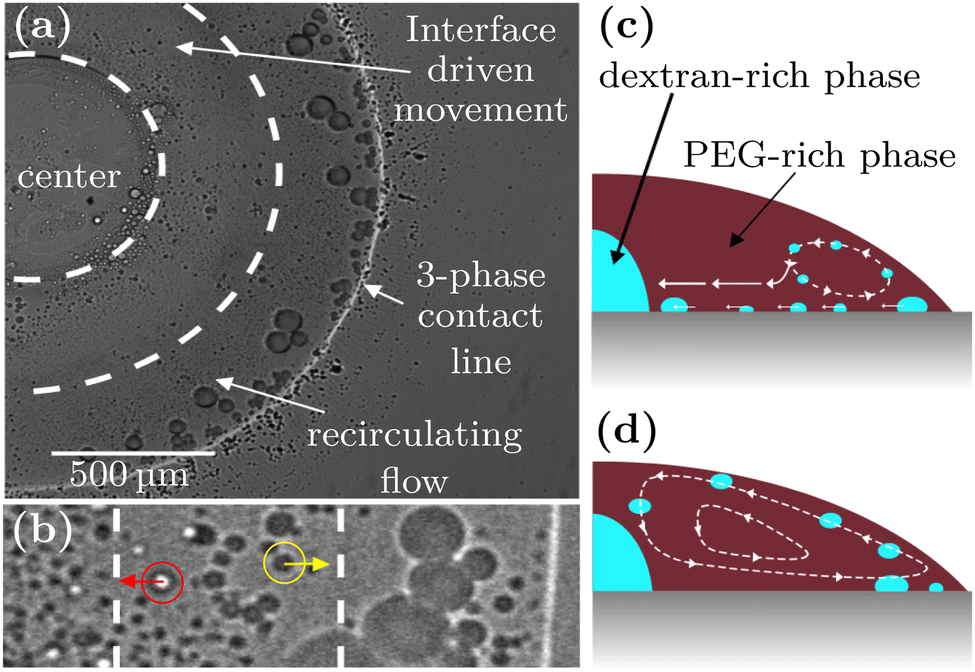 | ||
| Fig. 3 Dextran droplet motion inside an evaporating drop. (a) Brightfield image showing a ring of dextran droplets that perform a recirculating motion. The different regions with recirculating droplet motion and interface-driven motion toward the centre of the drop are delineated by dashed lines. (b) Dextran droplets imaged using reflection confocal microscopy, with droplets above the focal plane appearing bright and those below the focal plane appear dark. The direction of motion of the drops is indicated by arrows. (c) Schematic showing the droplet motion inferred from the experiments presented in this work. (d) Schematic showing the droplet motion that would follow from the explanation presented by Guo et al. | ||
Presumably, the recirculation is induced by Marangoni stresses at the liquid surface due to an increase in PEG concentration in the continuous phase close to the contact line of a drop. As explained by Guo et al.,21 PEG is a surface-active agent that reduces the surface tension in the contact-line region, the result of which is a Marangoni flow from the edge of a drop towards its centre. This will be referred to as “surface-driven droplet transport”. However, the surface-driven droplet transport does not contribute significantly to the transport of dextran-rich droplets to the centre of the ATPS drop. Even if surface-driven Marangoni convection were present in larger parts of the droplet, it would not contribute to the transport of dextran-rich droplets towards the drop centre. As is depicted in Fig. 3d, a Marangoni flow directed towards the centre of the drop at its surface always implies a backflow close to the solid surface. Since the dextran-rich droplets are located close to the solid surface (c.f.Fig. 2), they would be advected away from the drop centre instead of towards it.
To explain why the dextran-rich droplets get collected at the centre, we suggest a different mechanism, termed “interface-driven droplet transport”. The interfacial tension between the dextran and the PEG-rich phase rapidly increases with the total polymer concentration.23 The higher evaporation rate close to the contact line of a drop induces a radial dependence of the total polymer concentration. Since the solvent (water) evaporates, the total polymer concentration will be higher close to the edge compared to the centre. Therefore, the interfacial tension of a dextran-rich droplet with the continuous phase has a maximum at the contact line of the evaporating drop. The resulting interfacial Marangoni stresses induce a recirculating flow inside the droplet and a droplet motion towards the regions with lower interfacial tension, i.e. the centre of the evaporating drop. This is depicted in Fig. 4a. The corresponding motion of the dextran-rich droplets towards the centre of the sessile drop is sketched in Fig. 3c.
 | ||
| Fig. 4 Analysis of interface-driven droplet transport. (a) Schematics showing the flow field induced by interfacial Marangoni stress and the coordinate systems used in the scaling analysis of the droplet velocity. (b) Experimental results (symbols) showing the dependence of the velocity of dextran droplets on the droplet diameter. The line represents a linear fitting curve. | ||
Based on the hypothesis of interface-driven droplet transport, it can be inferred how the droplet velocity scales with the droplet diameter D. For this purpose, we consider a spherical droplet and a linear variation of the interfacial tension between the droplet and the continuous phase: σ = σ0 + αx (c.f.Fig. 4a). Such a model for the interfacial tension is the simplest model consistent with our knowledge of the spatial dependence of the polymer concentration inside the ATPS drop. The fact that it does not contain any time dependence reflects our hypothesis that after a short time, a steady-state concentration profile establishes. This is due to two mechanisms counteracting the increase of polymer concentration at the contact line. First, the recirculation zone close to the contact line (sketched in Fig. 3c) supplies liquid from the interior of the drop to the contact-line region. Second, the dextran-rich droplets (with high polymer concentration), formed close to the contact line are transported to the centre of the ATPS drop by Marangoni convection.
On a specific point of the surface of the droplet, we consider the unit vectors n, the projection of the surface normal vector onto the xy-plane, and t, the tangential vector in a plane parallel to the xy-plane. Then the Marangoni force on a droplet can be written as an integral over the droplet surface S:
 | (1) |
 | (2) |
 | (3) |
To check this prediction derived from the hypothesis of interface-driven droplet transport, we have evaluated the velocities of 37 different dextran-rich droplets migrating towards the centre of the sessile drop. The evaluation was done in an area extending between radial coordinates 0.4Rmax and 0.7Rmax, where Rmax is the wetting radius of the sessile drop. The recirculation region lies beyond 0.7Rmax. The centres of mass and diameters of the droplets were determined by visual inspection. The droplet velocity was then calculated based on a first-order finite-difference method and the known time increment between successive frames. The resulting droplet velocities are displayed in Fig. 4b as a function of D. The data are well compatible with a linear relationship between U and D, which, in turn, is in agreement with the hypothesis of interface-driven droplet transport.
Finally, let us re-consider the fact that the dextran-rich droplets are found in proximity to the solid surface, as can be seen in Fig. 2. The mass density of the dextran-rich phase (1049 kg m−3) is higher than that of the PEG-rich phase (1017 kg m−3), so one can hypothesize that the droplets sediment to the surface. The droplets analyzed in Fig. 4 have a mean diameter of about 16 μm. Using the Hadamard–Rybczynski equation, a sedimentation velocity of about 1 nm s−1 is obtained. This means that, based on the average height of a sessile drop, the dextran-rich droplets would not have enough time to settle to the solid surface during the evaporation/phase separation process. Instead, the droplets end up at the surface via two different mechanisms. As explained above, the droplets are formed close to the three-phase contact line, i.e. in the utmost vicinity of the solid surface. Many of these droplets then migrate to the center of the ATPS drop, without getting trapped in the recirculation zone. They were formed at the solid surface and simply stay there. A second mode of droplet migration, although much less frequently observed than the first mode, is as follows. A dextran-rich droplet is trapped in the recirculation zone close to the contact line, circulates a number of times before it leaves the recirculation zone to travel to the center of the ATPS drop. A droplet can escape from the recirculation zone by cross-stream migration. Diffusion is a potential cause of cross-stream migration but unlikely, since the diffusion coefficient of droplets significantly larger than one micrometer in such a high-viscosity medium is very small. Rather than that, cross-stream migration due to Marangoni convection is the likely cause behind droplets leaving a recirculation zone. The gradient of interfacial tension between a dextran-rich droplet and the surrounding liquid does not only have a radial component, but also a component normal to the solid surface. This is due to the fact that because of evaporation, the polymer concentration is higher at the liquid surface than at the solid surface. Therefore, Marangoni-induced transport drives dextran-rich droplets to the solid surface and causes cross-stream migration allowing droplets to escape from a recirculation zone. The two modes of droplet migration are schematically represented in Fig. 3c.
In conclusion, we have studied the phase transition and phase distribution in an all-aqueous sessile drop containing polyethylene glycol (PEG) and dextran. Initially, the system is in a single-phase state, and the phase transition starts close to the contact line of the drop where the evaporation mass flux is highest. For the comparatively small dextran mass fractions studied here, dextran-rich droplets are formed that recirculate in a region close to the contact line. The driving force of this recirculation is presumably due to solutal Marangoni stresses acting along the ATPS drop surface. However, these stresses are not the cause for the migration of the dextran-rich droplets, which are found close to the solid surface, towards the centre of the drop. The likely reason for their inward motion are Marangoni stresses acting at the interface between the droplets and the surrounding liquid. These stresses are presumably due to the variation of interfacial tension with the total polymer concentration and propel the droplets relative to the PEG-rich phase. The fact that the corresponding droplet velocity scales linearly with the droplet diameter support this hypothesis.
Author contributions
S. H. conceptualized research, J. H. and S. H. designed methodology and created models, A. M. and J. H. performed experiments, A. M. and J. H. analysed and visualized data, S. H. and J. H. wrote the paper.Conflicts of interest
There are no conflicts to declare.Acknowledgements
We kindly acknowledge the financial support by the German Research Foundation (DFG) within the Collaborative Research Centre 1194 “Interaction of Transport and Wetting Processes” Project-ID 265191195, subproject A02b.References
- D. Lohse, Fundamental Fluid Dynamics Challenges in Inkjet Printing, Annu. Rev. Fluid Mech., 2022, 54(1), 349–382, DOI:10.1146/annurev-fluid-022321-114001.
- J. Breitenbach, I. V. Roisman and C. Tropea, From Drop Impact Physics to Spray Cooling Models: A Critical Review, Exp. Fluids, 2018, 59(3), 1–21, DOI:10.1007/s00348-018-2514-3.
- R. D. Deegan, O. Bakajin, T. F. Dupont, G. Huber, S. R. Nagel and T. A. Witten, Capillary Flow as the Cause of Ring Stains from Dried Liquid Drops, Nature, 1997, 389(6653), 827–829, DOI:10.1038/39827.
- R. D. Deegan, Contact Line Deposits in an Evaporating Drop, Phys. Rev. E: Stat. Phys., Plasmas, Fluids, Relat. Interdiscip. Top., 2000, 62, 756–764 CrossRef CAS PubMed.
- R. D. Deegan, O. Bakajin, T. F. Dupont, G. Huber, S. R. Nagel and T. A. Witten, Contact Line Deposits in an Evaporating Drop, Phys. Rev. E: Stat. Phys., Plasmas, Fluids, Relat. Interdiscip. Top., 2000, 62(1B), 756–765, DOI:10.1103/PhysRevE.62.756.
- D. Zang, S. Tarafdar, Y. Y. Tarasevich, M. Dutta Choudhury and T. Dutta, Evaporation of a Droplet: From Physics to Applications, Phys. Rep., 2019, 804, 1–56, DOI:10.1016/j.physrep.2019.01.008.
- N. M. Kovalchuk, A. Trybala and V. M. Starov, Evaporation of Sessile Droplets, Curr. Opin. Colloid Interface Sci., 2014, 19(4), 336–342, DOI:10.1016/j.cocis.2014.07.005.
- D. Brutin and V. Starov, Recent Advances in Droplet Wetting and Evaporation, Chem. Soc. Rev., 2018, 47(2), 558–585, 10.1039/c6cs00902f.
- H. Tan, C. Diddens, P. Lv, J. G. M. Kuerten, X. Zhang and D. Lohse, Evaporation-Triggered Microdroplet Nucleation and the Four Life Phases of an Evaporating Ouzo Drop, Proc. Natl. Acad. Sci. U. S. A., 2016, 113(31), 8642–8647, DOI:10.1073/pnas.1602260113.
- C. Diddens, H. Tan, P. Lv, M. Versluis, J. G. M. Kuerten, X. Zhang and D. Lohse, Evaporating Pure, Binary and Ternary Droplets: Thermal Effects and Axial Symmetry Breaking, J. Fluid Mech., 2017, 823, 470–497, DOI:10.1017/jfm.2017.312.
- P. Å. Albertsson, Partition of Cell Particles and Macromolecules in Polymer Two-Phase Systems, Adv. Protein Chem., 1970, 24, 309–341, DOI:10.1016/S0065-3233(08)60244-2.
- P. Å. Albertsson, Partition of Cell Particles and Macromolecules, John Wiley & Sons, Inc., New York, 1960 Search PubMed.
- Y. Chao and H. C. Shum, Emerging Aqueous Two-Phase Systems: From Fundamentals of Interfaces to Biomedical Applications, Chem. Soc. Rev., 2020, 49(1), 114–142, 10.1039/c9cs00466a.
- T. Hahn and S. Hardt, Concentration and Size Separation of DNA Samples at Liquid-Liquid Interfaces, Anal. Chem., 2011, 83(14), 5476–5479, DOI:10.1021/ac201228v.
- T. Hahn and S. Hardt, Size-Dependent Detachment of DNA Molecules from Liquid-Liquid Interfaces, Soft Matter, 2011, 7(13), 6320–6326, 10.1039/c1sm05309d.
- M. S. Long, C. D. Jones, M. R. Helfrich, L. K. Mangeney-Slavin and C. D. Keating, Dynamic Microcompartmentation in Synthetic Cells, Proc. Natl. Acad. Sci. U. S. A., 2005, 102(17), 5920–5925, DOI:10.1073/pnas.0409333102.
- Y. Song, T. C. T. Michaels, Q. Ma, Z. Liu, H. Yuan, S. Takayama, T. P. J. Knowles and H. C. Shum, Budding-like Division of All-Aqueous Emulsion Droplets Modulated by Networks of Protein Nanofibrils, Nat. Commun., 2018, 9(1), 0–6, DOI:10.1038/s41467-018-04510-3.
- H. Tavana, A. Jovic, B. Mosadegh, Q. Y. Lee, X. Liu, K. E. Luker, G. D. Luker, S. J. Weiss and S. Takayama, Nanolitre Liquid Patterning in Aqueous Environments for Spatially Defined Reagent Delivery to Mammalian Cells, Nat. Mater., 2009, 8(9), 736–741, DOI:10.1038/nmat2515.
- J. B. Boreyko, P. Mruetusatorn, S. T. Retterer and C. P. Collier, Aqueous Two-Phase Microdroplets with Reversible Phase Transitions, Lab Chip, 2013, 13(7), 1295–1301, 10.1039/c3lc41122b.
- B. U. Moon, L. Malic, K. Morton, M. Jeyhani, A. Elmanzalawy, S. S. H. Tsai and T. Veres, Evaporation-Driven Water-in-Water Droplet Formation, Langmuir, 2020, 36(47), 14333–14341, DOI:10.1021/acs.langmuir.0c02683.
- W. Guo, A. B. Kinghorn, Y. Zhang, Q. Li, A. D. Poonam, J. A. Tanner and H. C. Shum, Non-Associative Phase Separation in an Evaporating Droplet as a Model for Prebiotic Compartmentalization, Nat. Commun., 2021, 12, 3194, DOI:10.1038/s41467-021-23410-7.
- A. Boyde and S. J. Jones, Mapping and Measuring Surfaces Using Reflection Confocal Microscopy, in Handbook of Biological Confocal Microscopy, ed. J. B. Pawley, Plemun Press, New York, 1995, pp 255–265 Search PubMed.
- Y. Liu, R. Lipowsky and R. Dimova, Concentration Dependence of the Interfacial Tension for Aqueous Two-Phase Polymer Solutions of Dextran and Polyethylene Glycol, Langmuir, 2012, 28(8), 3831–3839, DOI:10.1021/la204757z.
- G. L. Leal, Advanced Transport Phenomena, Cambridge University Press: Cambridge, 2007 Search PubMed.
Footnote |
| † Electronic supplementary information (ESI) available. See DOI: https://doi.org/10.1039/d2sm00613h |
| This journal is © The Royal Society of Chemistry 2022 |