DOI:
10.1039/D2SM00484D
(Paper)
Soft Matter, 2022,
18, 4197-4204
Rheological scaling of ionic-liquid-based polyelectrolytes in ionic liquid solutions: the effect of the ion diameter of ionic liquids†
Received
16th April 2022
, Accepted 17th May 2022
First published on 18th May 2022
Abstract
We investigate the effect of the ion diameter a of ionic liquids (ILs) on the shear viscosity of polymerized ionic liquids (PILs) in IL solutions. When both the PIL and IL contain large PFSI anions (a ≈ 0.57 nm), the specific viscosity ηsp first decreases with increasing IL concentration cIL in the low cIL regime, reaches a minimum and then increases with increasing cIL in the high cIL regime. By comparing the measured ηsp with the modified charge screening model proposed in our previous study [Matsumoto et al., Macromolecules, 2021, 54, 5648–5661], we attribute the observed non-monotonic trend of ηsp against cIL to the charge underscreening phenomenon, i.e., an increase of the screening length at high cIL leads to the upturn of ηsp. On the other hand, when the PIL and IL contain small BF4 anions (a ≈ 0.34 nm), the ηsp decreases asymptotically with increasing cIL, because the charge on the PIL chain is likely screened fully in the entire cIL regime. Our results demonstrate that the ion diameter of ILs plays an important role in governing the charge screening mechanism of PILs in IL solutions, and thus influencing the viscoelastic properties of PIL solutions.
1 Introduction
Polymerized ionic liquids (PILs) are a special type of polyelectrolytes with ionic liquid (IL) structures on their repeating units.1 Since PILs combine unique features of ILs (e.g., CO2 adsorption, high ionic conductivity, antimicrobial) with those of polymers (e.g., low glass transition temperatures, processability), they have attracted significant attention with applications in batteries,2–4 molecular separations,5,6 drug delivery,7,8 lubrication,9,10 and antimicrobial agents.11–13 The performance of PIL-based materials can be further improved by adding solvents, e.g., ILs, as plasticizers.14–20 Consequently, understanding the conformation and the polymer dynamics of PILs in IL solutions is of great importance because they are intimately related to the properties of PIL-based materials.
We recently investigated the viscoelastic properties of a PIL (PC4-TFSI) in the mixture of non-ionic DMF and ILs (Bmim-TFSI) while varying IL concentrations from IL-free to IL ion saturated conditions at a fixed polymer concentration.21,22 We reported that the specific viscosity ηsp = (η0 − ηs)/η0, where η0 and ηs denote the zero shear viscosity of polymer solutions and the solvent viscosity respectively, initially decreased with increasing IL concentrations cIL at low cIL regime because IL ions acted as salt ions to screen the electrostatic force working between the PIL repeating units.23,24 The observed behavior at low cIL could be captured by Dobrynin's charge screening model for polyelectrolyte solutions,25 based on the Debye–Hückel (DH) theory.26 However, at high cIL, we observed that the measured ηsp reached a minimum and then started to increase with increasing cIL. A similar trend was observed in the longest relaxation time λ versus the IL concentration cIL of the PIL solutions. These results suggested that extended PIL chains shrunk initially by the addition of ILs caused by the Debye screening, but reverted to an expanded conformation due to strong ionic correlations at high cIL, i.e., the so-called charge underscreening.27
In order to capture the observed non-monotonic dependence of ηsp and λ on the IL concentration cIL, we proposed a modified charge screening model on the basis of Dobrynin's charge screening model for polyelectrolyte solutions at low IL concentrations.25 In the Dobrynin model, the Debye screening effect is considered, and the specific viscosity ηsp,SU for semidilute unentangled (SU) solutions of polyelectrolytes in good solvents is given by
| | 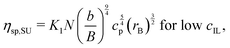 | (1) |
where
N,
b,
cp, and
K1 are the degree of polymerization, the monomer size, the molar concentration of monomers, and the scaling prefactor, respectively.
B = (
bA2/
lB)
2/7 is the dimensionless contour length parameter, where
A and
lB =
e2/4π
ε0εrkBT are the number of monomers between uncondensed charges and the Bjerrum length, respectively. Here
e,
ε0,
εr,
kB, and
T are the elementary charge, the vacuum permittivity, the relative dielectric constant of solvents, the Boltzmann constant, and the absolute temperature, respectively. The screening length
rB of polyelectrolyte solutions is proposed as
25| |  | (2) |
Here,
NA and
cIL is the Avogadro constant and the molar concentration of ILs, respectively.
Eqn (2) predicts that the screening length decreases monotonically with increasing
cIL, similar to the model prediction by the DH theory. Thus, the specific viscosity, given by
eqn (1), predicts a monotonic decrease with the increasing
cIL, suggesting a reduction in the chain size of polyelectrolytes with increasing
cIL. However,
eqn (1) may not be applicable at high
cIL because, in reality, polyelectrolyte chains shrink and eventually reach the initial polyelectrolyte chain size at high
cIL when the charge is completely screened.
28–30 Dobrynin and co-workers
31,32 have recently reported that the finite chain dimension of polyelectrolytes in the absence of electrostatics depends on chains persistent length and the second virial coefficient. Assuming the second virial coefficient for PC
4-TFSI monomers in the mixture of DMF and Bmim-TFSI is independent of
cIL in the high
cIL regime, as observed by Dobrynin
et al., we can adjust the Dobrynin model of
eqn (1) by adding parameter
ηintsp, a constant denoting the intrinsic specific viscosity:
| |  | (3) |
The specific viscosity, given by
eqn (3), decreases asymptotically with increasing
cIL due to the complete charge screening based on the Debye screening, shown as the red dashed curve in
Fig. 1. Since
ηintsp is related to the size of polyelectrolyte chains in the absence of electrostatic forces, the value of
ηintsp should follow the scaling of
ηsp for electrically neutral polymers,
e.g.,
ηintsp ∝
cp1.3 for neutral polymers in good solvents.
33 However, the model prediction by
eqn (3) does not capture the non-monotonic dependence of
ηsp on
cIL, observed for PIL solutions. To account for the charge underscreening,
27 we replaced the screening length
rB in
eqn (3) with the modified screening length
rBmod, proposed by Lee
et al. as
34| |  | (4) |
Here,
a is the ion diameter of ILs. The specific viscosity
ηsp,SU can be rewritten as
22| |  | (5) |
In
eqn (4), the modified screening length
rmodB is initially equal to the screening length
rB at low
cIL, given by
eqn (2), but starts to increase with increasing
cIL when
a >
rB at high
cIL. As a result, the specific viscosity, given by
eqn (5), is predicted to exhibit a non-monotonic trend against
cIL due to the charge underscreening following the Debye screening effects, illustrated as black solid curve in
Fig. 1.
 |
| | Fig. 1 The dependence of the specific viscosity ηsp,SU on cIL for semidilute unentangled (SU) solutions of polyelectrolytes in IL solutions, predicted by eqn (5). The black solid curve represents the trend of ηsp,SU against cIL when the charge underscreening is dominant, i.e., the ion diameter of ILs is large. On the other hand, the red dashed curve represents the trend of ηsp,SU against cIL when the complete charge screening is dominant, i.e., the ion diameter of ILs is small. | |
Subsequently, we validated eqn (5) by measuring ηsp for a polymerized ionic liquid, poly(1-butyl-3-vinylimidazolium bis(trifluoromethanesulfonyl)imide) (PC4-TFSI), in the mixture of DMF and an IL, 1-butyl-3-methylimidazolium bis(trifluoromethanesulfonyl)imide (Bmim-TFSI), while varying cIL at a fixed cp. Both the charge underscreening and complete charge screening were observed in the trend of ηspversus cIL for the PC4-TFSI in the mixture of DMF and Bmim-TFSI.22
Motivated by our prior results involving PC4-TFSI in the mixture of DMF and Bmim-TFSI (ion diameter a = 0.49 nm) supported by the modified charge screening model described above, in this study, we focus on the effect of the ion diameter of ILs on the shear viscosity of PILs in IL solutions. According to eqn (4), the ion diameter of ILs is related to the charge underscreening behavior, i.e., the larger the ion diameter of ILs, the smaller the molar concentration of ions where the charge underscreening is observed since for a fixed molar concentration (i.e., at the fixed number of ions per unit volume), the distance of larger ions is shorter than those of smaller ions. We vary the ion diameter a of ILs by changing the anion structure of PILs and ILs while keeping their cation structure the same as that of PC4-TFSI and Bmim-TFSI. We show a clear upturn of ηsp when choosing larger sized bis(pentafluoroethanesulfonyl)imide (PFSI) anions with an estimated ion diameter a = 0.57 nm, indicating a significant charge underscreening effect on the viscoelastic response of PC4–PFSI solutions. On the other hand, when using tetrafluoroborate (BF4) anions with smaller anion size of a = 0.34 nm, the ηsp decreases asymptotically with increasing cIL, indicating that only charge screening is at play. The model predictions of eqn (5) (ηsp on cIL) are able to capture very distinct behavior for both PFSI and BF4 systems. Our results also demonstrate that the ion diameter of ILs does influence the viscoelastic properties of PILs in IL solutions, as predicted by the modified charge screening model.
2 Experimental section
2.1 Materials
1-Vinylimidazole and lithium bis(pentafluoroethanesulfonyl) imide (Li-PFSI) were purchased from Tokyo Chemical Industry, Japan. Sodium tetrafluoroborate (Na–BF4), 1-bromobutane, 2.2′-azobis(isobutyronitrile) (AIBN), super dehydrated dimethylformamide (DMF), methanol, and silver nitrate (AgNO3) at 0.1 M in an aqueous solution were purchased from Wako Pure Chemicals, Japan. 1-Butyl-3-methylimidazolium bis(pentafluoroethanesulfonyl)imide (Bmim-PFSI; Purity >99%) and 1-butyl-3-methylimidazolium tetrafluoroborate (Bmim–BF4; Purity >99%) were purchased from Ionic Liquid Technologies, Germany. 1-Vinylimidazole was used after distillation at 85 °C under vacuum, while the other chemicals were used as received. After passing through a Q-POD Element unit (Merck Millipore, Japan), Milli-Q water with a resistivity higher than 18.2 MΩ was obtained and used as solvents for the PIL synthesis.
2.2 Synthesis of PC4–BF4 and PC4–PFSI
Two vinylimidazolium-based PILs, PC4–BF4 and PC4–PFSI, were prepared through three synthetic steps illustrated in Fig. 2. Since we obtained PC4–BF4 and PC4–PFSI from the same precursor polymer (i.e., PC4-Br with bromide anions) used for PC4-TFSI in our previous study,22 it is reasonable to assume that the degree of polymerization of PC4–BF4 and PC4–PFSI is the same as that of the PC4-TFSI. As described in Section S1 of the ESI,† we measured the weight-averaged molecular weight Mw of the PC4-TFSI based on static light scattering measurements, and estimated the degree of polymerization N = 2944 for PC4–BF4 and PC4–PFSI. We note that the estimated Mw of the PC4-TFSI may have an uncertainty in magnitude because we omitted a dialysis process to determine an accurate refractive index increment.36 Moreover, we assumed the form factor P(θ) = 1 to estimate Mw based on the Debye plot obtained from our static light scattering measurements.33 More detailed reasons are provided in Section S1 of the ESI.† The details for each step are explained below.
 |
| | Fig. 2 Three-step synthesis is conducted to prepare two PILs with different counter-anions, i.e., PC4–BF4 and PC4–PFSI. Step I: the quaternization of 1-vinylimidazole with 1-bromobutane to obtain the PIL monomer of C4–Br. Step II: free radical polymerization of C4–Br to prepare the precursor polymer of PC4–Br. Step III: counter-anion exchange of PC4–Br from Br to BF4 and PFSI anions via the counter-anion conversion method by Marcilla et al.35 | |
2.2.1 Step I: synthesis of C4-Br monomers.
The monomer of 1-butyl-3-vinylimidazolium bromide (C4-Br) was synthesized by refluxing 1-vinylimidazole (157.2 g, 1.67 mol) with excess 1-bromobutane (256.0 g, 1.87 mol) in methanol (150 mL) at 60 °C for 3 days. The molar ratio of the 1-vinylimidazole and the 1-bromobutane was set at 1.2. The quaternization of 1-vinylimidazole with 1-bromobutane proceeded with the change in solution color from colorless to yellowish. After removing the unreacted 1-vinylimidazole and 1-bromobutane at 50 °C under vacuum, a viscous yellowish solution of C4-Br was obtained. The purity of C4-Br was confirmed by 1H-NMR in deuterated water.22
2.2.2 Step II: free radical polymerization of C4–Br.
The precursor polymer PC4-Br was prepared via free radical polymerization of C4–Br (356.5 g, 1.54 mol) in Milli-Q water (200 mL) with an initiator of AIBN (7.662 g, 0.0467 mol) at 60 °C for 16 h. The molar ratio of the monomer to the initiator was set at 100. After polymerization, the obtained solution was dialyzed against Milli-Q water for 3 days using a dialysis tube (Fisher Scientific Japan, Ltd), with a nominal molecular cut-off of 6000–8000. The Milli-Q solvent was replaced with a fresh one 2 times per day. The resultant solution was dried using a freeze-drying method, and PC4-Br was obtained in powder form.
2.2.3 Step III: counter-anion conversion of PC4-Br from Br to BF4 or PFSI anions.
PC4–BF4 and PC4–PFSI were prepared by applying the counterion conversion method proposed by Marcilla et al.35 Specifically, PC4–BF4 was synthesized by slowly titrating an aqueous solution containing excess amount of Na–BF4 (10.67 g, 0.50 mol L−1) into an aqueous solution of PC4-Br (12.08 g, 0.12 mol L−1), followed by the stirring of the mixture for 3 days at room temperature (∼25 °C). The molar ratio of the Na–BF4 to the repeating unit of PC4-Br was set at 1.9. The counterion conversion was proceeded soon after titrating the solution of Na–BF4, resulting in the precipitation of PC4–BF4. The precipitate was washed with Milli-Q water until the filtrate remained transparent when adding an aqueous solution containing 0.1 M of Ag–NO3. Finally, a yellowish chunk of PC4–BF4 was obtained after drying the precipitate at Tg + 10 K under vacuum. The same procedure was applied to obtain PC4–PFSI while setting the molar ratio of alkali salts to the repeating unit at 1.3, i.e., Li-PFSI: 20.25 g, 0.54 mol L−1; PC4-Br: 9.56 g, 0.12 mol L−1. The final product of the PC4–PFSI was in powder form. The prepared PILs were then stored in a desiccator before use. The glass transition temperatures of PC4–BF4 (Tg = 141 °C) and PC4–PFSI (Tg = 51 °C) were reported from literature.37,38
2.3 Preparation of the test mixture
Our test mixtures consist of the PIL and solvent mixture of an IL and a non-ionic DMF. We selected the appropriate IL with its ionic structures similar to those of the PIL, i.e., Bmim–BF4 for PC4–BF4 and Bmim-PFSI for PC4–PFSI since prior literature39–41 reported the change in the viscosity of ILs by the dissolution of ions consisting of different chemical structures. The test mixture was prepared using two different methods, depending on the concentration of the PIL and the IL. At high concentrations (both cp and cIL ≥ 0.01 M), test mixtures were prepared by directly adding the components into a glass vial. The PIL was dissolved quickly and homogeneous solutions were obtained by shaking the vial gently at room temperature. The concentration of ILs, cIL, in the high concentration regime, was calculated as  where mIL, dmix, M0, and mmix are the mass of ILs, the density of the solvent mixture, the molar mass of ILs, and the mass of the solvent mixture, respectively. The density of the solvent mixture dmix was measured using a density meter (DMA 35 Basic, Anton Paar) at room temperature (∼25 °C), and the plot of dmixversus cIL is provided in Fig. S3 of the ESI.† The monomer concentration of PILs, cp, was calculated as the ratio of the number of moles of the repeating unit to the volume of the solvent mixture added to the polymer sample:
  where mp and Mr are the mass of PILs and the molar mass of the repeating unit of PILs associated with the counter-anion, respectively. At low concentrations of cp and cIL, the test mixtures were prepared by diluting more concentrated solutions. The value of cIL varied in the range of 0 M ≤ cIL ≤ 5.26 M for the mixture of Bmim–BF4 and DMF and 0 M ≤ cIL ≤ 2.91 M for the mixture of Bmim-PFSI and DMF, with 1.77 × 10⁻⁴ M ≤ cp ≤ 3.16 × 10⁻¹ M. The obtained solutions were hermetically sealed, and then stored in a desiccator while maintaining humidity lower than 30% until use.
2.4 Shear viscosity measurements
The shear viscosity η of the test mixture at 25 °C was measured using a strain-controlled rheometer ARES-G2 (TA Instruments) by varying shear rates ![[small gamma, Greek, dot above]](https://www.rsc.org/images/entities/i_char_e0a2.gif) from 0.1 s−1 to 1000 s−1. A stainless steel cone and plate geometry with 50 mm in diameter and 1° in cone angle was used as an upper geometry, while a stainless steel flat plate with 60 mm in diameter was attached into an advanced Peltier system (TA Instruments) as a lower geometry to regulate temperature with temperature accuracy of ±0.1 °C. The sample solution loaded between the top and bottom geometry was covered with a solvent trap to prevent both moisture absorption from the ambient environment and the sample evaporation. The obtained shear viscosity curve was then used to estimate the zero-shear viscosity of both solvent and polymer solutions.
from 0.1 s−1 to 1000 s−1. A stainless steel cone and plate geometry with 50 mm in diameter and 1° in cone angle was used as an upper geometry, while a stainless steel flat plate with 60 mm in diameter was attached into an advanced Peltier system (TA Instruments) as a lower geometry to regulate temperature with temperature accuracy of ±0.1 °C. The sample solution loaded between the top and bottom geometry was covered with a solvent trap to prevent both moisture absorption from the ambient environment and the sample evaporation. The obtained shear viscosity curve was then used to estimate the zero-shear viscosity of both solvent and polymer solutions.
3 Results and discussion
3.1 Salt-free solutions in DMF
Fig. 3(a) shows the dependence of the measured shear viscosity η at 25 °C on the shear rate , i.e., the so-called shear viscosity curve, for PC4–BF4 solutions in non-ionic DMF at representative monomer concentrations. The value of η increased monotonically with increasing cp. For a given cp, e.g., at cp = 3.16 × 10⁻³ M (red open square in Fig. 3(a)), the shear viscosity remained a constant at low and then decreased with increasing , showing a typical shear thinning behavior observed for polymer solutions. A similar trend of η with respect to the increasing and cp was observed for PC4–PFSI solutions, as shown in Fig. 3(b).
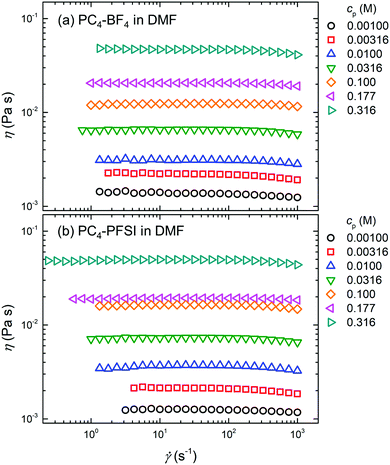 |
| | Fig. 3 Shear viscosity curves of (a) PC4–BF4 and (b) PC4–PFSI in non-ionic DMF at various representative monomer concentrations cp. The value of the shear viscosity η at 25 °C is plotted as a function of the shear rate . | |
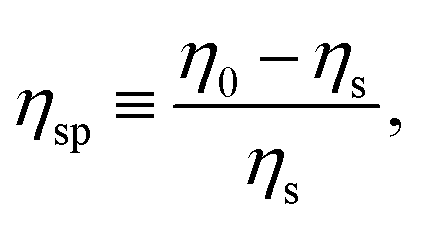
The observed increase of the solution shear viscosity with the increasing PILs concentration cp can be further analyzed by estimating the specific viscosity ηsp, defined as33
| |  | (6) |
where
η0 and
ηs are the zero-shear viscosity of the polymer solution and the solvent, respectively.
Fig. 4 shows the dependence of
ηsp on
cp for PC
4–BF
4 and PC
4–PFSI solutions in DMF. The plot also includes the
ηsp data for PC
4-TFSI solutions in DMF (red symbols) reported in our previous study.
22 Here, the values of
η0 and
ηs, used to calculate
ηsp by
eqn (6), were estimated by averaging the shear viscosity data in
Fig. 3 at shear rates where
η was independent of
at low
. In
Fig. 4, the values of
ηsp are very similar among the three PILs in DMF over the entire
cp range investigated. Since the specific viscosity is related to the chain size in a given solvent,
33 our results indicate that three different PIL chains in our studies are expanded equally due to the electrostatic interaction. As a result, the charge fraction, characterized by
A in
eqn (2), for PC
4–BF
4 and PC
4–PFSI in DMF was found to be
A = 2, the same value determined for PC
4-TFSI in DMF in our previous study.
21
 |
| | Fig. 4 The dependence of the specific viscosity ηsp at 25 °C on the monomer concentration cp for PC4–BF4 (black circles), PC4-TFSI (red squares), and PC4–PFSI (blue triangles) solutions in DMF. The green line represents the predicted slope of ηsp against cp for dilute (DL) polymer solutions, i.e., ηsp,DL ∝ cp1.0, while the cyan dashed line represents the predicted slope of ηsp against cp for salt-free semidilute unentangled (SU) solutions at cIL = 0 M, i.e., ηsp,SU ∝ cp0.5, given by eqn (1).25 The ηsp data for PC4-TFSI were copied from ref. 22. | |
We also found that the dependence of ηsp on cp was independent of three different counter-anions used in our studies, see Fig. 4. The value of ηsp increased linearly with increasing cp for cp < 3 × 10⁻³ M, beyond which the increase of ηsp with cp became more gradual at higher cp. In particular, the power-law exponent changed from ηsp ∝ cp1.0 to ηsp ∝ cp0.5 at ηsp ∼ 1, corresponding to the transition from dilute (DL) to semidilute unentangled (SU) polymer concentration regimes for salt-free solutions of polyelectrolytes in good solvents.25 Consequently, the overlap monomer concentration  could be determined as
  . Thus, our result in the SU regime indicates that DMF, used as a non-ionic solvent, acts as a good solvent for PC4–BF4 and PC4–PFSI. As the cp was further increased, the chain overlap usually grows and the motion of a polyelectrolyte chain starts to be constrained topologically by other chains. Such polymer concentration regime is called as the semidilute entangled (SE) regime, and the specific viscosity in the SE regime is predicted to be scaled as ηsp,SE ∝ cp1.5 for salt-free solutions.25 However, the measured ηsp for
  exhibited a cp – dependence weaker than the model predicted of ηsp,SE ∝ cp1.5, indicating that our tested PIL solutions (3.0 × 10⁻² M < cp < 3.16 × 10⁻¹ M) still lie in the SU regime.
3.2 Salt-rich solutions in the mixture of DMF and ILs
We now investigate the effect of the ion diameter of ILs on the charge screening behavior for PIL solutions in the SU regime. In doing so, we measured ηsp of PC4–BF4 and PC4–PFSI solutions at a fixed cp in the semidilute unentangled polymer concentration regime while varying cIL.
3.2.1 Charge screening behavior with small BF4 anions.
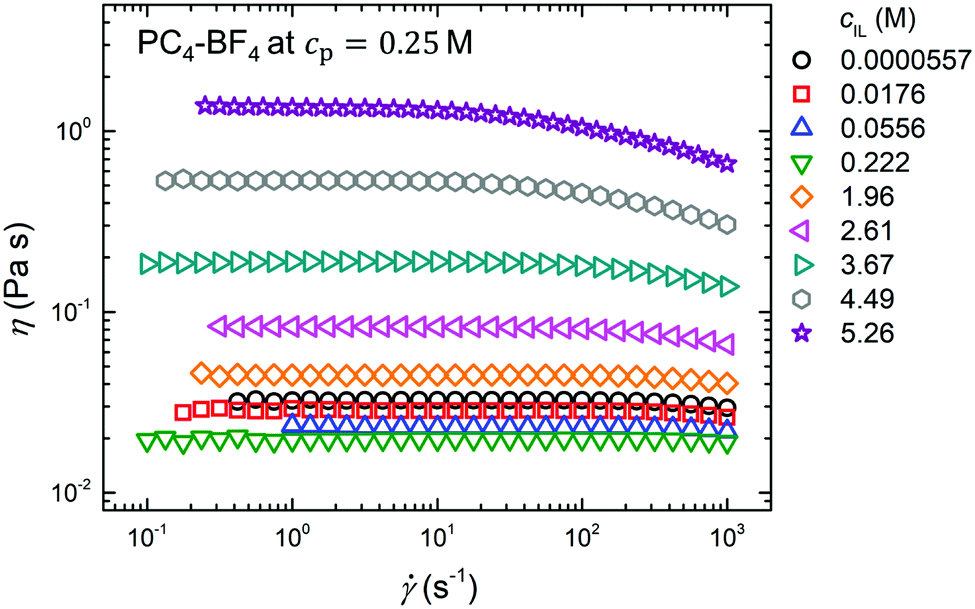
Fig. 5 shows shear viscosity curves for PC4–BF4 in the mixture of DMF and Bmim–BF4 obtained at a fixed cp = 0.25 M while varying cIL. When adding Bmim–BF4 to the solvent mixture, the value of η decreased with increasing cIL for cIL ≤ 0.222 M, showing a typical Debye screening behavior for polyelectrolyte solutions.42–45 On the other hand, for cIL > 0.222 M, the η increased monotonically with increasing cIL until cIL reached its saturation concentration for the mixture of DMF and Bmim–BF4, i.e., cIL = 5.26 M for pure Bmim–BF4. The observed increase in η is mainly caused by an increase in the solvent viscosity with respect to the increasing cIL. Fig. 6 shows the dependence of the zero-shear solvent viscosity ηs at 25 °C on cIL for the solvent mixture of Bmim–BF4 and DMF: the value of ηs started to increase rapidly with increasing cIL at cIL ∼ 0.2 M.
 |
| | Fig. 5 Shear viscosity curves of the PC4–BF4 in the mixture of DMF and Bmim–BF4 at cp = 0.25 M. The values of the shear viscosity η at various representative Bmim–BF4 concentrations are plotted as a function of the shear rate . | |
 |
| | Fig. 6 The dependence of the zero-shear viscosity ηs at 25 °C on the IL concentration cIL for the solvent mixture of Bmim–BF4 and DMF. | |
Next, we estimated the specific viscosity ηsp using eqn (6), and the obtained values of ηsp were plotted as a function of cIL in Fig. 7. The ηsp remained a constant for cIL < 2 × 10⁻³ M, and then decreased with increasing cIL at higher cIL until cIL reached its saturation value, i.e., cIL = 5.26 M for pure Bmim–BF4. We also observed a similar trend of ηsp against cIL for a PC4–BF4 solution at a smaller cp = 0.05 M, shown as red circles in Fig. 7. The absence of a clear upturn of the measured ηsp suggests that the charge screening is completed before the charge underscreening takes effect on ηsp. To examine this hypothesis, we compared the measured ηsp at cp = 0.25 M with the model prediction of ηsp,SU, given by eqn (5), while assuming ηintsp = 0, i.e., neglecting the complete charge screening effect on ηsp. The dashed curve in Fig. 7 represents the fitted curve of ηsp,SU, obtained using eqn (5) at ηintsp = 0. In the curve fitting, the value of εr was obtained from independent measurements of εr, as shown in Fig. S4 of the ESI.† The diameter of Bmim–BF4 ions was estimated as a = 0.34 nm, in good agreement with the value predicted by Lee et al.34 by using a = cIL−1/3/2. Moreover, since the chemical structure of the repeating unit of PC4–BF4 is similar to that of Bmim–BF4, the monomer size b should be similar to the ion diameter (b = a). As a result, there was only one adjustable parameter in the curve fitting, that is, the scaling prefactor K1 determining the vertical position of the fitted curve. From the comparison shown in Fig. 7, we found that the measured ηsp agreed well with the predicted ηsp,SU (at ηintsp = 0) only for cIL < 3 × 10⁻² M. However, a significant discrepancy between the predicted curve of ηsp,SU and the measured ηsp was observed for cIL > 3 × 10⁻² M. In particular, although the modified charge screening model, given by eqn (5), predicts the upturn of ηsp to occur at ηsp ∼ 3 and cIL ∼ 3 M, the measured ηsp was significantly larger in magnitude and exhibited an asymptotic decrease of ηsp around cIL = 3 M. A similar result was obtained for the comparison between the measured ηsp and the model prediction of ηsp,SU at cp = 0.05 M.
 |
| | Fig. 7 The dependence of the specific viscosity ηsp at 25 °C on the Bmim–BF4 concentration for PC4–BF4 in the mixture of Bmim–BF4 and DMF at two monomer concentrations cp = 0.25 M (black squares) and cp = 0.05 M (red circles). The dashed curve represents the curve fit of ηsp,SU to the measured ηsp at ηintsp = 0, while the solid curve represents the predicted curve of ηsp,SU to the measured ηsp, obtained with ηintsp = 11.2 at cp = 0.25 M and ηintsp = 1.1 at cp = 0.05 M. | |
The observed discrepancy between the model prediction and the experimental result can be explained by considering the complete charge screening effect on ηsp. The best curve fit of ηsp,SU, obtained using eqn (5) with varying ηintsp, was shown as the solid curve in Fig. 7. The predicted curve of ηsp,SU captured the measured ηsp over the entire cIL range, regardless of different values of cp. Moreover, as shown in Fig. 8, the estimated values of ηintsp, i.e., ηintsp = 11.2 at cp = 0.25 M and ηintsp = 1.1 at cp = 0.05 M, satisfied the required scaling law of ηintsp ∝ cp1.3 for neutral polymer solutions in good solvents. A good agreement between the model prediction and the experimental results confirms our hypothesis that the charge on the PC4–BF4 chain is fully screened in the mixture of Bmim–BF4 and DMF. Our results demonstrate that the charge underscreening can be suppressed when choosing IL ions sufficiently small (i.e., when a ≤ 0.34 nm).
 |
| | Fig. 8 The dependence of the intrinsic specific viscosity ηintsp on the monomer concentration cp for PC4–BF4 in the mixture of Bmim–BF4 and DMF (black squares) and PC4–PFSI in the mixture of Bmim-PFSI and DMF (blue triangles). The value of ηintsp is obtained from the curve fitting to the measured ηsp with the model prediction of ηsp,SU, given by eqn (5). The plot includes the data for PC4-TFSI in the mixture of Bmim-TFSI and DMF, copied from our previous study in ref. 22. The dashed line represents the scaling relation of ηintsp ∝ cp1.3 predicted for neutral polymers in good solvents. | |
3.2.2 Charge screening behavior with large PFSI anions.
If the dominant charge screening process for PIL solutions depends on the diameter of IL ions, we anticipate that the viscoelastic response of PC4–PFSI solutions will be affected by the charge underscreening since PFSI anions are larger in diameter than TFSI anions. Fig. 9 shows the dependence of ηsp on cIL for PC4–PFSI in the mixture of Bmim-PFSI and DMF at a fixed cp = 0.20 M. The value of ηsp remained a constant at low cIL, and then decreased with increasing cIL until cIL ∼ 1 M. However, the ηsp increased with increasing cIL for cIL > 1 M, showing an upturn of the measured ηsp. A similar upturn of ηsp was observed at cIL ∼ 1 M for PC4–PFSI solutions at a smaller cp = 0.05 M, shown as red circles in Fig. 9.
 |
| | Fig. 9 The dependence of the specific viscosity ηsp at 25 °C on the Bmim-PFSI concentration for PC4–PFSI in the mixture of Bmim-PFSI and DMF at two monomer concentrations cp = 0.20 M (black squares) and cp = 0.05 M (red circles). The solid curve represents the curve fit of ηsp,SU to the measured ηsp at ηintsp = 0, while the dashed curve represents the predicted curve of ηsp,SU to the measured ηsp, obtained with ηintsp = 2.0 at cp = 0.20 M and ηintsp = 0.40 at cp = 0.05 M. | |
We compared the dependence of the measured ηsp on cIL with the model prediction of ηsp,SU, given by eqn (5). The best fit curve was obtained with a = 0.57 nm and ηintsp = 2.0 for PC4–PFSI solutions at cp = 0.20 M, shown as the solid curve in Fig. 9. Note that the ion diameter estimated from our curve fit based on eqn (5) is about 1.4 times larger than the value (a = 0.42 nm) predicted by using cIL−1/3/2 based on Lee et al.34 This discrepancy is likely due to different screening process in our experimental systems. Lee et al.34 confined ILs between smooth plates and used surface force apparatus to estimate the screening length from the measured separation force-distance profiles. In our system, a three dimensional charge screening process on charged polymer molecules with strong steric constraints for large PFSI anions may increase a effectively, resulting in a reduction of cIL where the charge underscreening is observed (see eqn (4)). We also performed curve fitting to the measured ηsp for PC4–PFSI solutions at cp = 0.05 M by using eqn (5) with ηintsp = 0.4 while keeping the ion diameter fixed as a = 0.57 nm. As shown in Fig. 8, we obtained the scaling of ηintsp ∝ cp1.3 using ηintsp values from the curve fitting, further validating the fitting procedure shown in Fig. 9. The predicted solid curve of ηsp,SU is able to capture the measured ηsp over the entire cIL range, regardless of cp. These results indicate that the charge underscreening is dominant for the dependence of ηsp on cIL for PC4–PFSI in the mixture of Bmim-PFSI and DMF.
4 Conclusions
The electrostatic interaction plays an important role in determining the viscoelastic properties of PIL solutions. Therefore, it is important to understand how IL ions screen the charge on PIL chains and affect the viscoelastic properties of PILs in IL solutions. In this study, we evaluated the dependence of the specific viscosity ηsp in the semidilute unentangled (SU) regime on the IL concentration cIL for two PIL solutions possessing anions with different ion diameters: PC4–BF4 in the mixture of Bmim–BF4 and DMF and PC4–PFSI in the mixture of Bmim-PFSI and DMF. We showed that the ηsp for PC4–BF4 solutions with small anions exhibited an asymptotic decrease with the increasing cIL, while the value of ηsp for PC4–PFSI solutions with large anions decreased initially at low cIL but increased at high cIL as cIL was increased. By comparing the measured ηsp with the model prediction of ηsp,SU by eqn (5), the observed asymptotic decrease of ηsp for PC4–BF4 solutions was attributed to the full screening of charges on the PC4–BF4 chain. On the other hand, the upturn of ηsp observed for PC4–PFSI solutions was caused by the charge underscreening associated with the increase in the screening length at high cIL. Our results demonstrate that the ion diameter of IL ions is a key parameter determining the charge screening mechanism and thus the viscoelastic properties of PILs in IL solutions.
Author contributions
Conceptualization, A. M. and A. Q. S.; data collection, A. M.; data analysis, A. M.; funding acquisition, A. M. and A. Q. S.; writing-original draft, A. M.; writing-review & editing, A. M. and A. Q. S. Both A. M. and A. Q. S. have read and agreed to the published version of the manuscript.
Conflicts of interest
The authors declare no conflict of interest.
Acknowledgements
A. M and A. Q. S acknowledge the support of the Okinawa Institute of Science and Technology Graduate University with subsidy funding from the Cabinet Office, Government of Japan. A. M. acknowledges funding from the Japanese Society for the Promotion of Science (Grants-in-Aid for Early-Career Scientists, Grant No. 21K14686). Both authors acknowledge the funding from the Joint Research Projects (JRPs) supported by JSPS. A. M. also gratefully acknowledges the financial support of University of Fukui to complete and publish this work.
References
- S.-Y. Zhang, Q. Zhuang, M. Zhang, H. Wang, Z. Gao, J.-K. Sun and J. Yuan, Chem. Soc. Rev., 2020, 49, 1726–1755 RSC
 .
.
- H. A. Elwan, R. Thimmappa, M. Mamlouk and K. Scott, J. Power Sources, 2021, 510, 230371 CrossRef CAS .
- B. Yang, G. Yang, Y.-M. Zhang and S. X.-A. Zhang, J. Mater. Chem. C, 2021, 9, 4730–4741 RSC .
- S. T. Russell, R. Raghunathan, A. M. Jimenez, K. Zhang, S. D. Brucks, C. Iacob, A. C. West, O. Gang, L. M. Campos and S. K. Kumar, Macromolecules, 2020, 53, 548–557 CrossRef CAS .
- N. H. Solangi, A. Anjum, F. A. Tanjung, S. A. Mazari and N. M. Mubarak, J. Environ. Chem. Eng., 2021, 9, 105860 CrossRef CAS .
- K. Friess, P. Izák, M. Kárászová, M. Pasichnyk, M. Lanč, D. Nikolaeva, P. Luis and J. C. Jansen, Membranes, 2021, 11, 97 CrossRef CAS PubMed .
- P. Banerjee, M. Anas, S. Jana and T. Mandal, J. Polym. Res., 2020, 27, 177 CrossRef CAS .
- B. Lu, G. Zhou, F. Xiao, Q. He and J. Zhang, J. Mater. Chem. B, 2020, 8, 7994–8001 RSC .
- J. Wu, Y. Luo, Y. Chen, X. Lu, X. Feng, N. Bao and Y. Shi, Tribol. Int., 2022, 165, 107278 CrossRef CAS .
- J. Zhang, Z. Chen, Y. Zhang, S. Dong, Y. Chen and S. Zhang, Adv. Mater., 2021, 33, 2100962 CrossRef CAS PubMed .
- N. Nikfarjam, M. Ghomi, T. Agarwal, M. Hassanpour, E. Sharifi, D. Khorsandi, M. Ali Khan, F. Rossi, A. Rossetti, E. Nazarzadeh Zare, N. Rabiee, D. Afshar, M. Vosough, T. Kumar Maiti, V. Mattoli, E. Lichtfouse, F. R. Tay and P. Makvandi, Adv. Funct. Mater., 2021, 31, 2104148 CrossRef CAS .
- A. M. Curreri, S. Mitragotri and E. E.-L. Tanner, Adv. Sci., 2021, 8, 2004819 CrossRef CAS PubMed .
- A. Muñoz-Bonilla and M. Fernández-García, Eur. Polym. J., 2018, 105, 135–149 CrossRef .
- S. Doblinger, C. E. Hay, L. C. Tomé, D. Mecerreyes and D. S. Silvester, Anal. Chim. Acta, 2022, 1195, 339414 CrossRef CAS PubMed .
- F. Xie, X. Gao, Y. Yu, F. Lu and L. Zheng, Soft Matter, 2021, 17, 10918–10925 RSC .
- A. S. Gouveia, V. Oliveira, A. M. Ferraria, A. M. Do Rego, M. J. Ferreira, L. C. Tomé, A. Almeida and I. M. Marrucho, J. Membr. Sci., 2022, 642, 119903 CrossRef CAS .
- L. Liang, X. Chen, W. Yuan, H. Chen, H. Liao and Y. Zhang, ACS Appl. Mater. Interfaces, 2021, 13, 25410–25420 CrossRef CAS PubMed .
- A. S.-L. Gouveia, E. Malcaitè, E. I. Lozinskaya, A. S. Shaplov, L. C. Tomé and I. M. Marrucho, ACS Sustainable
Chem. Eng., 2020, 8, 7087–7096 CrossRef CAS .
- T. Watanabe, R. Takahashi and T. Ono, Soft Matter, 2020, 16, 1572–1581 RSC .
- S. Mogurampelly and V. Ganesan, Macromolecules, 2018, 51, 9471–9483 CrossRef CAS .
- A. Matsumoto, F. Del Giudice, R. Rotrattanadumrong and A. Q. Shen, Macromolecules, 2019, 52, 2759–2771 CrossRef CAS .
- A. Matsumoto, R. Yoshizawa, O. Urakawa, T. Inoue and A. Q. Shen, Macromolecules, 2021, 54, 5648–5661 CrossRef CAS .
- D. Izzo, Soft Matter, 2022, 18, 1696–1705 RSC .
- A. B. Marciel, S. Srivastava and M. V. Tirrell, Soft Matter, 2018, 14, 2454–2464 RSC .
- A. V. Dobrynin, R. H. Colby and M. Rubinstein, Macromolecules, 1995, 28, 1859–1871 CrossRef CAS .
- P. Debye and E. Huckel, J. Phys., 1923, 24, 185 CAS .
- A. A. Lee, C. S. Perez-Martinez, A. M. Smith and S. Perkin, Faraday Discuss., 2017, 199, 239–259 RSC .
- K. Tsutsumi and T. Norisuye, Polym. J., 1998, 30, 345–349 CrossRef CAS .
- E. Hirose, Y. Iwamoto and T. Norisuye, Macromolecules, 1999, 32, 8629–8634 CrossRef CAS .
- R. Hagino, J. Yashiro, M. Sakata and T. Norisuye, Polym. J., 2006, 38, 861–867 CrossRef CAS .
- A. V. Dobrynin and M. Jacobs, Macromolecules, 2021, 54, 1859–1869 CrossRef CAS .
- A. V. Dobrynin, M. Jacobs and R. Sayko, Macromolecules, 2021, 54, 2288–2295 CrossRef CAS .
-
M. Rubinstein and R. H. Colby, Polymer Physics, Oxford University Press: New York, 2003 Search PubMed .
- A. A. Lee, C. S. Perez-Martinez, A. M. Smith and S. Perkin, Phys. Rev. Lett., 2017, 119, 026002 CrossRef PubMed .
- R. Marcilla, J. A. Blazquez, R. Fernandez, H. Grande, J. A. Pomposo and D. Mecerreyes, Macromol. Chem. Phys., 2005, 206, 299–304 CrossRef CAS .
- R. Schweins, J. Hollmann and K. Huber, Polymer, 2003, 44, 7131–7141 CrossRef CAS .
- K. Nakamura, K. Fukao and T. Inoue, Macromolecules, 2012, 45, 3850–3858 CrossRef CAS .
- A. Matsumoto, C. Iacob, T. Noda, O. Urakawa, J. Runt and T. Inoue, Macromolecules, 2018, 51, 4129–4142 CrossRef CAS .
- J. J. Fillion and J. F. Brennecke, J. Chem. Eng. Data, 2017, 62, 1884–1901 CrossRef CAS .
- H. Niedermeyer, J. P. Hallett, I. J. Villar-Garcia, P. A. Hunt and T. Welton, Chem. Soc. Rev., 2012, 41, 7780–7802 RSC .
- A. Takada, K. Imaichi, T. Kagawa and Y. Takahashi, J. Phys. Chem. B, 2008, 112, 9660–9662 CrossRef CAS PubMed .
- D. C. Boris and R. H. Colby, Macromolecules, 1998, 31, 5746–5755 CrossRef CAS .
- P. Kujawa, A. Audibert-Hayet, J. Selb and F. Candau, Macromolecules, 2006, 39, 384–392 CrossRef CAS .
- C. G. Lopez, F. Horkay, M. Mussel, R. L. Jones and W. Richtering, Soft Matter, 2020, 16, 7289–7298 RSC .
- C. G. Lopez, Macromolecules, 2019, 52, 9409–9415 CrossRef CAS .
|
| This journal is © The Royal Society of Chemistry 2022 |
Click here to see how this site uses Cookies. View our privacy policy here. 
 Open Access Article
 This Open Access Article is licensed under a Creative Commons Attribution-Non Commercial 3.0 Unported Licence
 *ab and
Amy Q.
Shen
*ab and
Amy Q.
Shen


 where mIL, dmix, M0, and mmix are the mass of ILs, the density of the solvent mixture, the molar mass of ILs, and the mass of the solvent mixture, respectively. The density of the solvent mixture dmix was measured using a density meter (DMA 35 Basic, Anton Paar) at room temperature (∼25 °C), and the plot of dmixversus cIL is provided in Fig. S3 of the ESI.† The monomer concentration of PILs, cp, was calculated as the ratio of the number of moles of the repeating unit to the volume of the solvent mixture added to the polymer sample:
  where mp and Mr are the mass of PILs and the molar mass of the repeating unit of PILs associated with the counter-anion, respectively. At low concentrations of cp and cIL, the test mixtures were prepared by diluting more concentrated solutions. The value of cIL varied in the range of 0 M ≤ cIL ≤ 5.26 M for the mixture of Bmim–BF4 and DMF and 0 M ≤ cIL ≤ 2.91 M for the mixture of Bmim-PFSI and DMF, with 1.77 × 10⁻⁴ M ≤ cp ≤ 3.16 × 10⁻¹ M. The obtained solutions were hermetically sealed, and then stored in a desiccator while maintaining humidity lower than 30% until use.


 could be determined as
  . Thus, our result in the SU regime indicates that DMF, used as a non-ionic solvent, acts as a good solvent for PC4–BF4 and PC4–PFSI. As the cp was further increased, the chain overlap usually grows and the motion of a polyelectrolyte chain starts to be constrained topologically by other chains. Such polymer concentration regime is called as the semidilute entangled (SE) regime, and the specific viscosity in the SE regime is predicted to be scaled as ηsp,SE ∝ cp1.5 for salt-free solutions.25 However, the measured ηsp for
  exhibited a cp – dependence weaker than the model predicted of ηsp,SE ∝ cp1.5, indicating that our tested PIL solutions (3.0 × 10⁻² M < cp < 3.16 × 10⁻¹ M) still lie in the SU regime.