
 Open Access Article
 This Open Access Article is licensed under a Creative Commons Attribution-Non Commercial 3.0 Unported Licence
Upstream wall vortices in viscoelastic flow past a cylinder†
Cameron C.
Hopkins
 *,
Simon J.
Haward
and
Amy Q.
Shen
*
*,
Simon J.
Haward
and
Amy Q.
Shen
*
Okinawa Institute of Science and Technology Graduate University, Onna-son, Okinawa 904-0495, Japan. E-mail: cameron.hopkins@oist.jp; amy.shen@oist.jp
First published on 13th June 2022
Abstract
We report a novel inertia-less, elastic flow instability for a viscoelastic, shear-thinning wormlike micellar solution flowing past a microcylinder in a channel with blockage ratio BR = 2R/W = 0.5 and aspect ratio α = H/W ≈ 5, where R ≈ 100 μm is the cylinder radius, W is the channel width, and H is the channel height. The instability manifests upstream of the cylinder and changes form with increasing Weissenberg number over the range 0.5 ≲ Wi = Uλ/R ≲ 900, where U is the average flow velocity and λ is the terminal relaxation time of the fluid. Beyond a first critical Wi, the instability begins as a bending of the streamlines near the upstream pole of the cylinder that breaks the symmetry of the flow. Beyond a second critical Wi, small, time-steady, and approximately symmetric wall-attached vortices form upstream of the cylinder. Beyond a third critical Wi, the flow becomes time dependent and pulses with a characteristic frequency commensurate with the breakage timescale of the wormlike micelles. This is accompanied by a breaking of the symmetry of the wall-attached vortices, where one vortex becomes considerably larger than the other. Finally, beyond a fourth critical Wi, a vortex forms attached to the upstream pole of the cylinder whose length fluctuates in time. The flow is highly time dependent, and the cylinder-attached vortex and wall-attached vortices compete dynamically for space and time in the channel. Our results add to the rapidly growing understanding of viscoelastic flow instabilities in microfluidic geometries.
1 Introduction
Viscoelastic fluids are a class of complex fluid that have rheological properties intermediate between a viscous fluid and an elastic solid. The elasticity in viscoelastic fluids is due to the formation of complex microstructures arising from the presence of macromolecules like polymers, DNA, or proteins, or aggregations of surfactants, colloidal particles or bubbles.1 Of particular relevance to the present work is the influence of extensible molecules or aggregates such as high-molecular-weight polymers or wormlike micelles (so-called ‘living’ polymers.2,3) Subject to shearing flow, the rearrangement of these molecules or micelles can lead to a reduction in the resistance to the flow (shear-thinning viscosity), while under extensional flow, the stretching of the molecules or micelles can lead to an increase in the extensional viscosity (extension-hardening).Flow of a viscoelastic fluid can become unstable due to nonlinearities arising from elasticity and/or inertia.4 The relative strength of elasticity in a flow compared to dissipative viscosity can be quantified by their ratio via the dimensionless Weissenberg number Wi = λ![[small gamma, Greek, dot above]](https://www.rsc.org/images/entities/i_char_e0a2.gif) , where λ is the fluid relaxation time, and = U/L is a characteristic shear rate, where U and L are a characteristic velocity and length-scale, respectively. The relative strength of inertia to viscosity in a flow can be quantified by their ratio via the dimensionless Reynolds number Re = ρUL/η, where ρ is the fluid density and η is the fluid viscosity. At the small length-scales L∼
, where λ is the fluid relaxation time, and = U/L is a characteristic shear rate, where U and L are a characteristic velocity and length-scale, respectively. The relative strength of inertia to viscosity in a flow can be quantified by their ratio via the dimensionless Reynolds number Re = ρUL/η, where ρ is the fluid density and η is the fluid viscosity. At the small length-scales L∼![[scr O, script letter O]](https://www.rsc.org/images/entities/char_e52e.gif) (100 μm) accessible in microfluidic devices,5,6 viscoelastic flow experiments can be performed at negligible inertia (Re
(100 μm) accessible in microfluidic devices,5,6 viscoelastic flow experiments can be performed at negligible inertia (Re![[thin space (1/6-em)]](https://www.rsc.org/images/entities/char_2009.gif) ≪1), but high elasticity (Wi≫1). Such flows are prone to instability in a variety of different geometries, driven entirely by elastic effects.4,7–15 These elastic instabilities can affect widespread industrially and biologically relevant processes such viscoelastic flow in porous media,16–24 hemodynamics,25–27 and jet fragmentation.28,29
≪1), but high elasticity (Wi≫1). Such flows are prone to instability in a variety of different geometries, driven entirely by elastic effects.4,7–15 These elastic instabilities can affect widespread industrially and biologically relevant processes such viscoelastic flow in porous media,16–24 hemodynamics,25–27 and jet fragmentation.28,29
A common morphological structure that appears due to elastic instability is the formation of a vortex, or vortices, upstream of a geometric feature in a channel.30–44 For the creeping flow (i.e., Re≪1) of shear-thinning viscoelastic polymer, wormlike micellar, or DNA solutions in a microchannel with a 90° L-bend, a lip vortex can form at the re-entrant, upstream corner of the bend.30–33,45 Similarly, upstream vortices have also been observed attached to the walls in the flow of viscoelastic, shear-thinning fluids in the cross-slot,34–38 and abrupt contraction geometries.39–44
More relevant to the present study is viscoelastic flow past a cylinder in a channel. Flow past a cylinder has long been considered a benchmark test for the study of viscoelastic fluid dynamics.46–49 This geometry incorporates extensional kinematics near the stagnation points at the upstream and downstream poles of the cylinder, and shear in the gaps between the cylinder and walls.48,50 These competing influences can be varied by changing the channel blockage ratio BR = 2R/W, where R is the cylinder radius and W is the channel width (Fig. 1). How the elastic flow instability manifests in this system depends significantly on fluid rheology and the geometry of the channel. For creeping flow of a constant-viscosity, highly-elastic Boger fluid past a macro-scale cylinder (R = (1 mm), with channel aspect ratio α = H/W ≈ 6, where H is the channel height), over a range of blockage ratio 0.17 ≤ BR ≤ 0.50, the strength of elasticity in the flow was found to have almost no influence on the velocity profile upstream of the cylinder, but resulted in the formation of a low-velocity wake downstream of the cylinder that developed a three-dimensional cellular structure along its length.48
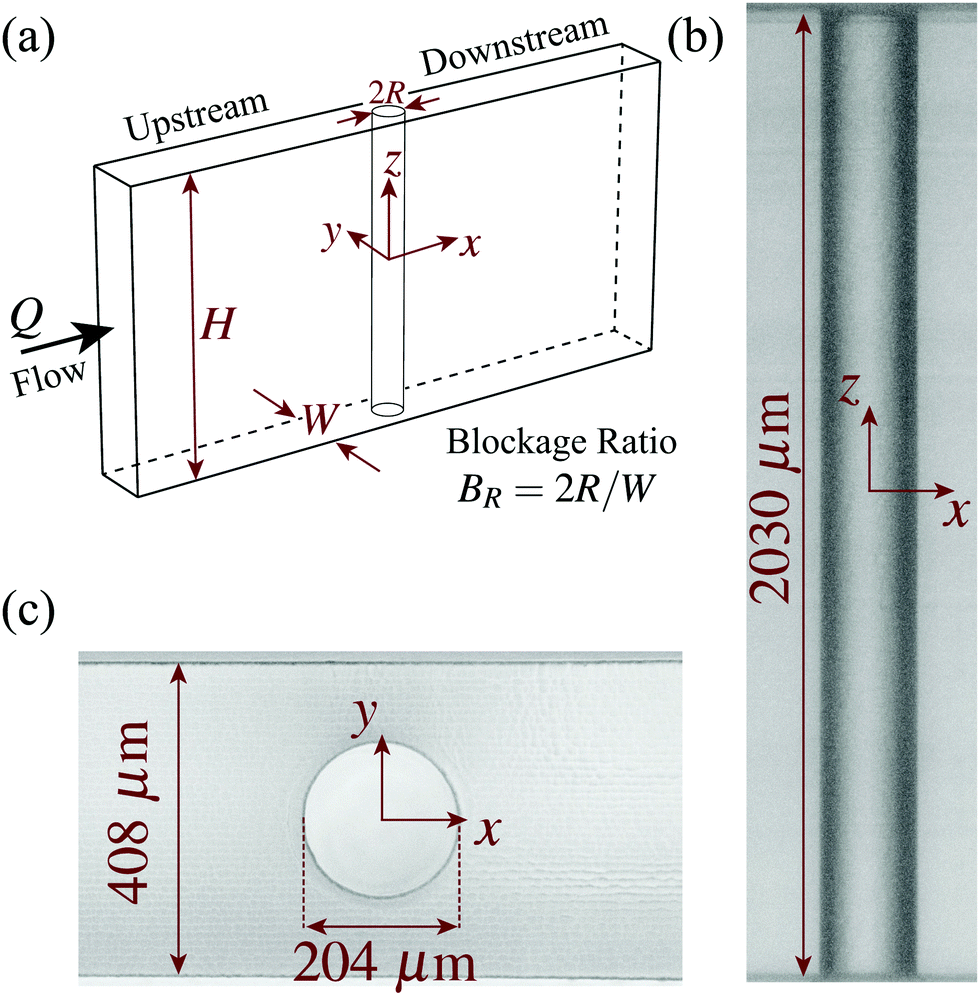 | ||
| Fig. 1 (a) Schematic diagram of the flow geometry. (b) Top-view, and (c) side-view micrographs of the microfluidic channel illustrate the measured dimensions of the channel and cylinder. The coordinate system is indicated with the origin located at the center of the cylinder. | ||
In contrast, for creeping flow of a weakly elastic but constant-viscosity dilute polymer solution past a microcylinder (R = 20 μm) with BR = 0.1 and α = 5, the flow was found to destabilize upstream of the cylinder; polymers were stretched in the upstream extension-dominated region of the flow and were accelerated past the cylinder, leaving a very long, slow-moving wake downstream of the cylinder that shielded the downstream stagnation point from the flow.51 For test fluids that are both viscoelastic and shear-thinning, creeping flows past high aspect-ratio (α = 5), low blockage-ratio (BR ≤ 0.2) microcylinders have been observed to destabilize to a state with a strong lateral asymmetry where most of the fluid flows preferentially around one side of the cylinder. Detailed experiments and numerical simulations suggest that this steady flow asymmetry arises due to a combination of extension in the wake and shear-thinning in the gaps between cylinder and walls.20,52–58
For viscoelastic flow past high-blockage-ratio microcylinders (BR ≥ 0.5) in low-aspect-ratio channels (α ≤ 0.6), experiments show dynamics that are significantly different from those observed in flow past smaller blockage ratio cylinders in higher aspect ratio channels. For both constant viscosity, highly elastic polymer solutions,59 and shear-thinning, viscoelastic wormlike micellar solutions,60 the elastic instability results in the formation of a stagnant vortex region attached to the upstream pole of the cylinder. A recent numerical study61 of the two-dimensional flow of a viscoelastic fluid modelled by the finitely extensible nonlinear elastic model with the Peterlin closure (FENE-P) past cylinders with BR ≥ 0.5 has also revealed similar upstream vortices attached to the cylinder. It is clear that the rheology of the test fluid, and the channel aspect and blockage ratios can significantly affect the nature of the elastic flow instability. In these studies on flow past BR ≥ 0.5 cylinders,59–61 there are potential signs of upstream wall vortices, however they are not explicitly mentioned in the papers and they appear intermittently or together with the upstream cylinder vortex.
In this work, we present microfluidic flow experiments using micro-particle image velocimetry on the flow of a viscoelastic, shear-thinning wormlike micellar solution past a microcylinder with BR = 0.5 in a high-aspect-ratio microchannel (α ≈ 5). We observe a novel flow instability that manifests upstream of the cylinder. With increasing Wi, it begins with bending streamlines near the upstream pole, followed by the formation of wall-attached vortices (steady and time dependent), and finally the formation of a vortex attached to the upstream pole of the cylinder. We perform a detailed quantitative analysis of the different stages of the flow instability, and analyze the time-dependent behaviour of the flow. The time dependence is discussed in the context of the complex stress-relaxation dynamics of the wormlike micelles.
2 Experimental methods
2.1 Microfluidic device
The microfluidic channel used in this work was fabricated from fused silica using the subtractive three-dimensional (3D) printing technique of selective laser-induced etching.6,62 A schematic diagram of the geometry is shown in Fig. 1(a), and brightfield micrographs are shown in Fig. 1(b) and (c). The channel has width W = 408 μm in the y direction, and height H = 2030 μm in the z direction. The length of the channel in the flow (x) direction is 25 mm. A single microcylinder is situated in the center of the channel. The diameter of the microcylinder is 2R = 204 μm. These dimensions yield a channel blockage ratio BR = 0.5, and channel aspect ratio α ≈ 5. The coordinate system is indicated in Fig. 1 with the origin situated at the geometric center of the microcylinder.2.2 Wormlike micellar test solution
The fluid used in this study is a well-characterized wormlike micellar solution comprised of 100 mM cetylpyridinium chloride (CpyCl) and 60 mM sodium salicylate (NaSal) (both acquired from Sigma-Aldrich and used without further purification) dissolved in milli-Q water. The mixture of surfactant and counterion at these concentrations is known to form giant wormlike micelles in solution.63,64 The solution was prepared by adding weighed quantities of the surfactant and counterion to the appropriate volume of milli-Q water. The solution was stirred vigorously for three days at room temperature and then allowed to rest for two weeks in a dark space prior to use in the experiments.The shear rheology of the wormlike micellar solution was measured at T = 24 °C (the same temperature as the subsequent flow experiments) using a DHR3 stress-controlled rotational rheometer (TA Instruments Inc.) fitted with the 40 mm, 1° angle stainless steel cone-and-plate geometry. Fig. 2(a) shows the steady shear viscosity η and shear stress σ versus the applied shear rate . The solution exhibits a constant plateau viscosity η0 ≈ 27.5 Pa s at low shear rates. With increasing shear rate, the viscosity transitions to a strongly shear-thinning regime spanning approximately 3 decades in shear rate from 100 ≲ ≲ 103 s−1. Over this range of , the shear stress is approximately constant, indicating shear banding.65–67 However, we note here that shear banding is not a rheological feature necessary for the flow instability observed in this work to occur. This will be discussed more in Section 4. The shear stress starts to increases again for ≲ 103 s−1, and the shear viscosity approaches a high shear-rate plateau viscosity. The shear rheology is well-described by the Carreau–Yasuda generalized Newtonian fluid model:68
 | (1) |
* = 0.62 s−1 is the characteristic shear rate for the transition to shear thinning, n = 0 is the power-law index in the shear-thinning region, and a = 1.93 is a dimensionless fitting parameter that controls the rate of the transition between the low shear-rate constant viscosity plateau and the intermediate shear-thinning regions. These parameters were determined by fitting eqn (1) to the measured shear viscosity. The fit parameters are listed in Table 1.
 | ||
| Fig. 2 (a) Shear viscosity η and shear stress σ, and (b) first normal stress difference N1 and first normal stress coefficient Ψ1, plotted versus shear rate for the 100 mM:60 mM CpyCl:NaSal solution. The black curves in (a) are fits of the Carreau–Yasuda model (eqn (1)). The black curves in (b) are fits of a power-law model (eqn (2)). (c) The elastic G′ and viscous G′′ moduli as a function of angular frequency ω under small-amplitude oscillatory shear with strain amplitude γ = 5%. The red curve is the fit of the single-mode Maxwell model (eqn (3)) to the data. The inset shows the moduli normalized by the plateau modulus G0 presented in a Cole–Cole plot. The black curve is a fit of a circle with a diameter of 0.87. | ||
:60 mM CpyCl:NaSal wormlike micellar test solution at T = 24 °C
| η 0 [Pa s] | η ∞ [mPa s] |
* [s−1] |
a | n | b [Pa sm] | m | G 0 [Pa] | λ [s] | λ break [s] | λ rep [s] |
|---|---|---|---|---|---|---|---|---|---|---|
| 27.5 | 2 | 0.62 | 1.93 | 0 | 35.6 | 0.67 | 24.8 | 1.54 | 0.53 | 4.48 |
The first normal stress difference N1 and first normal stress coefficient Ψ1 were measured using an ARES G2 strain-controlled rotational rheometer (TA Instruments Inc.) fitted with the 50 mm, 1° angle stainless steel cone-and-plate geometry. Fig. 2(b) shows N1 and Ψ1versus . With increasing , N1 is well-described by the increasing power law function
| N1 () = bm, | (2) |
2, therefore Ψ1 = bm−2, where b and m are the same as above. These parameters are included in Table 1. The shear stress and viscosity were also measured using the ARES G2 rheometer and agree well with the data shown in Fig. 2(a) measured with the DHR3 rheometer.
The elastic and viscous moduli, G′ and G′′, were measured by small-amplitude oscillatory shear with a strain amplitude γ = 5%, which is within the linear viscoelastic regime. The results are shown in Fig. 2(c). The moduli are well-described by the single mode Maxwell model given by:
 | (3) |
 .
.
2.3 Flow control and dimensionless parameters
The wormlike micellar test solution was pumped through the microfluidic channel using two syringe pumps (Cetoni GmbH). One pump was used to inject, and the other to withdraw fluid at the same volumetric flow rate Q; with average flow velocity U = Q/WH. Two 25 ml Hamilton Gastight syringes were used with polyether ether ketone (PEEK) fingertight fittings and polytetrafluoroethylene (PTFE) tubing. The range of flow rate Q imposed in this study was 0.0007 ≤ Q ≤ 3.1 ml min−1, hence average flow velocity 0.014 ≤ U ≤ 62.2 mm s−1. In the dimensionless Weissenberg and Reynolds numbers, we use the cylinder radius as the characteristic length-scale and the average flow velocity as the characteristic velocity. Hence, the Weissenberg number is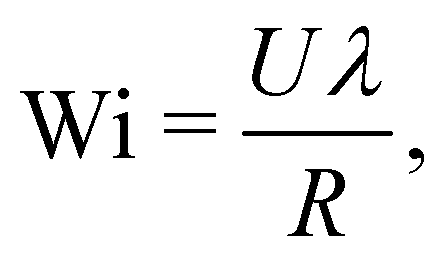 | (4) |
To account for the shear-thinning viscosity of the test fluid in the Reynolds number, we define it in two different ways using the zero-shear-rate and infinite-shear-rate viscosities:
 | (5) |
The density of the fluid ρ = 997 kg m−3 is assumed to be equal to the density of the DI water solvent.
To quantify the relative strength of elastic to inertial forces in the flow, we use the elasticity numbers
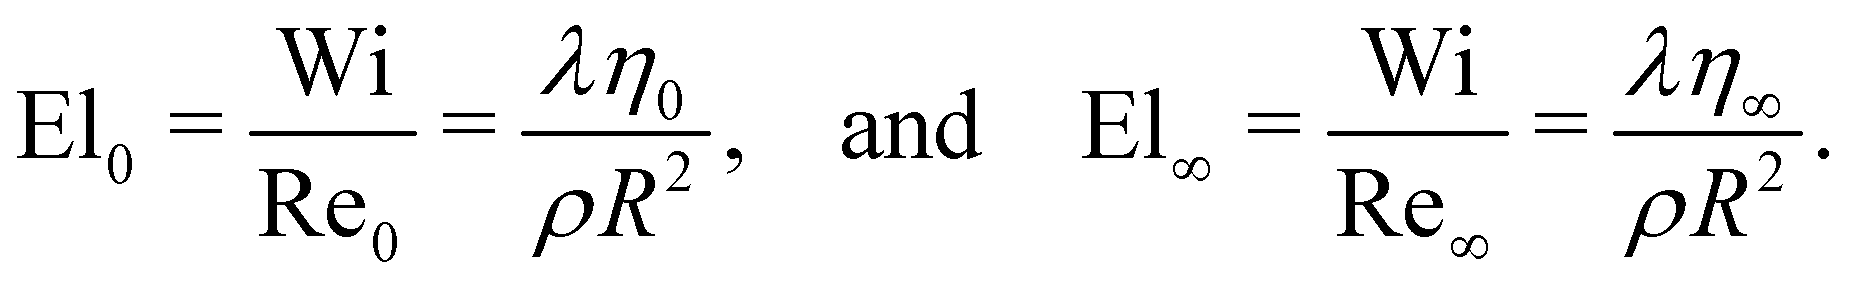 | (6) |
Over the range of Q imposed in this work, 0.5 ≲ Wi ≲ 900, Re0 ≲ 2.3 × 10⁻⁴, and Re∞ ≲ 3.1, which yield El0 ≈ 4.1 × 10⁶ and El∞ ≈ 300. Therefore, we conclude that elastic force is the dominant force in the flow, and even under the highest flow rate imposed in this work, Re is small. We note that due to shear localization of the wormlike micellar solution at the channel walls,69–73 the flow is plug-like far from the cylinder (Fig. 3), so the fluid is under negligible shear as it approaches the cylinder. Therefore the dimensionless parameters calculated using η0 may be more representative of the relative strengths of the forces in the flow for this work, and so inertia may be assumed to be negligible and we will not discuss it further.
 | ||
| Fig. 3 Time-averaged velocity fields measured for flow of the wormlike micellar solution past a BR = 0.5 cylinder at (a) Wi = 2.5, (b) Wi = 38, (c) Wi = 100, (d) Wi = 180, (e) Wi = 897. The velocity fields are normalized by the maximum velocity in each respective case. Upstream and downstream velocity fields were measured in separate non-coincident experiments and are thus presented separately. | ||
2.4 Flow visualization
Quantitative and spatially resolved two-dimensional (2D) flow fields were obtained using micro-particle image velocimetry (μPIV, TSI Inc.).74,75 The fluid was seeded with a low concentration of 2 μm-diameter fluorescent tracer microparticles (Fluoromax red, Thermo Scientific Inc.). The μPIV measurements were recorded at the mid-plane (z = 0) of the channel using an inverted microscope (Nikon Ti) with a 4× Plan Fluor, NA = 0.13 numerical aperture objective lens and a high speed camera (Phantom Miro) working in frame-straddling mode. With this camera and microscope objective, the field of view was 2.56 mm × 1.60 mm with a measurement depth of 159 μm, approximately 8% of the height of the channel. At each imposed flow rate, the flow was held for at least 60 seconds, i.e., ≳30λ, before recording the μPIV data. For time-steady flows, μPIV frame pairs were recorded at 25 pairs per second for 10 seconds. For time-dependent flows, μPIV frame pairs were recorded at 50 pairs per second for 30 seconds. Frame pairs were processed both individually and by ensemble-averaging. The velocity field u = [u, v], where u is the x-component of the velocity and v is the y-component of the velocity, was determined via cross-correlation between frame pairs using OpenPIV, an open-source Python package.763 Results
3.1 Flow behaviour
Fig. 3 shows a selection of time-averaged velocity fields normalized by the maximum velocity that capture the evolution of the instability observed for increasing Wi. Note that the velocity fields upstream and downstream of the cylinder are plotted separately because they were measured in non-coincident experiments and therefore do not match precisely. For some Wi, the flow is laterally asymmetric downstream of the cylinder, e.g., Fig. 3(b) and (c). However, these effects are extremely weak compared with the downstream asymmetries observed for viscoelastic flow past low-BR cylinders,20,51–58 and the flow regains symmetry beyond the distance of approximately 10R. In the present case, by far the most significant phenomena are observed upstream of the cylinder, so we will focus on the instability that forms upstream for the remainder of this work.For sufficiently low Wi = 2.5, the flow upstream of the cylinder is steady and symmetric (Fig. 3(a)). As Wi is increased beyond a critical value Wic1 ≈ 19.5, the streamlines bend near the upstream pole of the cylinder due to the elastic compressional stress at the stagnation point (Fig. 3(b)). In the case shown, fluid approaching the cylinder initially along the line y = 0 follows the bent streamline so that it turns to go below [y < 0] the cylinder before changing direction to go above [y > 0] the cylinder. The volume of fluid initially extending below the cylinder causes a reduction in the gap available for the remaining fluid to pass the cylinder. Therefore, that fluid attains a higher flow velocity than on the opposite side of the cylinder (apparent in Fig. 3(b) and (c)). This causes a small lateral asymmetry in the flow velocities on either side of the cylinder similar to that seen in viscoelastic flow past cylinders with a smaller BR,20,52–56 however the mechanism that generates it is fundamentally different. Note that although both cases shown in Fig. 3(b) and (c) display a bending of the streamlines towards the bottom of the cylinder, the direction of the instability is random, and bending in the opposite direction was also observed. To further demonstrate the flow behaviour along the bending streamlines, Movie S1 included in the ESI† shows a time-dependent, magnified view of the particle images and velocity field near the upstream stagnation point for the Wi = 38 case shown in Fig. 3(b).
For Wi beyond a second critical value Wic2 ≈ 60, vortices form that are attached to the walls upstream of the cylinder at x ≈ − 2.5R (Fig. 3(c)). With increasing Wi, the vortices extend upstream. The flow becomes strongly time dependent beyond a third critical value Wic3 ≈ 125. This coincides with a divergence in the size of the vortices to yield one vortex that is significantly larger than the other (Fig. 3(d)). In addition, a small vortex forms intermittently that is attached to the upstream stagnation point of the cylinder. However, it does not exist for very long because the wall-attached vortices dominate the flow until higher Wi. This will be discussed more in Section 3.4 and 3.5. Note that because the velocity fields shown are time-averaged, the re-circulation structure within the vortices is smoothed out for all but the largest vortex on the bottom wall in Fig. 3(d). The vortices can be seen more clearly in Movies S2–S5 (ESI†) showing the time-dependent velocity fields at Wi = 90, 148, 190 and 507, respectively. A fully 3-dimensional characterization of these vortices is beyond the scope of this work. However, Fig. S1 in the ESI† shows time-averaged velocity fields imaged in the x–z plane at y ≈ 1.8R and y ≈ −1.8R at Wi = 97, 145, and 175, and accompanying time-dependent velocity fields in Movies S6–S8 (ESI†). Fig. S1 (ESI†) indicates that along the height of the channel (z direction), the smaller vortices present in Fig. 3(c) and (d) are in fact comprised of several small vortices stacked along the height of the channel. It is also evident that the larger vortex in Fig. 3(d) spans the full height of the channel, and merges with two more large vortices on the top and bottom walls of the channel (z = ± H/2).
Finally, for Wi beyond a fourth critical value Wic4 ≈ 255, the vortex that forms attached to the upstream stagnation point of the cylinder grows substantially in length and persists in time (Fig. 3(e)). As will be discussed later, this flow state is highly time dependent. The cylinder vortex fluctuates in length and competes dynamically with the wall vortices for time and space in the channel, see Movie S5 included in the ESI.†
3.2 Characterization of the Bending Streamline Instability
The four stages in the evolution of the flow state with increasing Wi will now be analyzed separately. We start with an analysis of the bending of the streamlines near the upstream pole of the cylinder by looking at the spatial dependence of the y-component of the fluid velocity, v(x, y) (Fig. 4). The y-component of the fluid velocity along the symmetry line y = 0 normalized by the average fluid velocity, v(x, 0)/U, is plotted in Fig. 4(a) for select values of Wi. Note that the bending is always in the same direction in Fig. 4(a), and that the cases shown in Fig. 3(a)–(d) are also plotted in Fig. 4(a). For low Wi = 2.5, v(x, 0)/U does not deviate significantly from 0. At the other Wi shown, all greater than Wic1, v(x, 0)/U initially decreases below 0 as it approaches the cylinder, before increasing to a maximum slightly upstream of the cylinder. The precise position of the maximum depends on Wi, however for simplicity we select an arbitrary position near the maxima, x = −1.4R, to record the velocity for analysis. We define vp = v(−1.4R, 0) as a probe velocity to quantify the degree to which the transverse flow velocity deviates from zero upstream of the cylinder. The normalized magnitude of the probe velocity |![[v with combining macron]](https://www.rsc.org/images/entities/i_char_0076_0304.gif) p/U| is plotted versus Wi in Fig. 4(b) for four independent experiments. For low Wi, |p/U| ≈ 0. As Wi is increased beyond the first critical value Wic1, the streamlines bend upstream of the cylinder and vp acquires a non-zero value, hence |p/U| increases. The growth of |p/U| with Wi is well described by the phenomenological Landau-type quartic potential that is minimized as:
p/U| is plotted versus Wi in Fig. 4(b) for four independent experiments. For low Wi, |p/U| ≈ 0. As Wi is increased beyond the first critical value Wic1, the streamlines bend upstream of the cylinder and vp acquires a non-zero value, hence |p/U| increases. The growth of |p/U| with Wi is well described by the phenomenological Landau-type quartic potential that is minimized as:| Wi = Wic1 (g|p/U|2 + h|p/U|−1 + 1), | (7) |
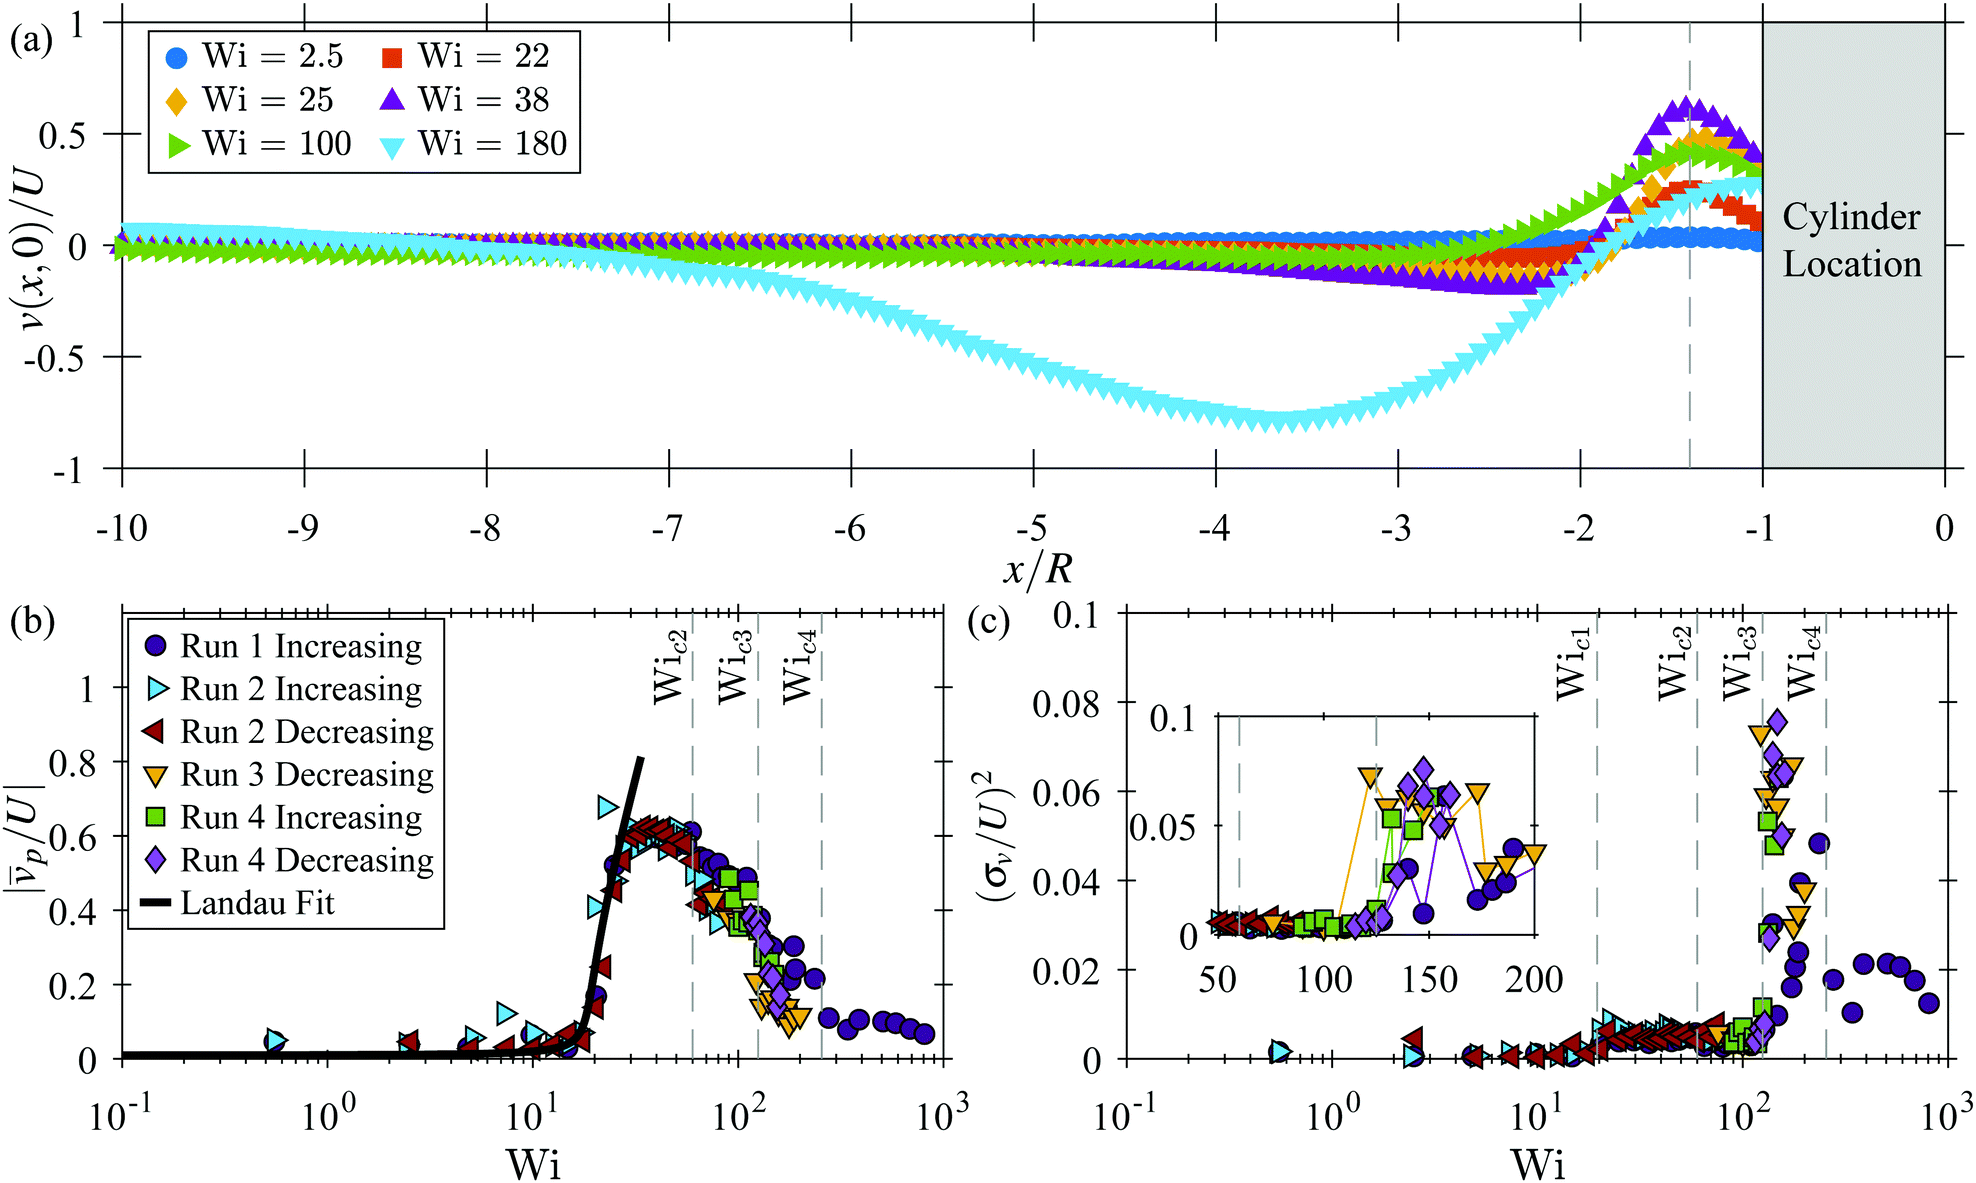 | ||
| Fig. 4 (a) The y-component of the fluid velocity v plotted versus the normalized x coordinate x/R along the line y = 0 for a selection of Wi. The dashed gray line is located at x = −1.4R. (b) The magnitude of v evaluated at x = −1.4R and y = 0, vp, time-averaged and normalized by the average fluid velocity U plotted versus Wi for all of the independent runs performed. The solid black curve is a fit of the Landau model (eqn (7)) to |vp/U| near the transition. (c) The normalized variance of |vp|, (σv/U)2, plotted versus Wi for all of the independent runs performed. The inset plot shows a magnified view of the data over a range of Wi near the onset of time dependent behaviour. The solid colored lines in the inset connect the data to aid the eye. The gray dashed lines in (b) and (c) indicate the different critical Wi as described in the text. | ||
Further increasing Wi beyond Wic1, |p/U| increases to a plateau value of |p/U| ≈ 0.6, which remains approximately constant until the second critical Weissenberg number Wic2, when wall-attached vortices form upstream of the cylinder. Subsequently, |p/U| starts to decrease, and continues to decrease over the rest of the Wi range studied. For Wi > Wic4, the probe location is within the upstream cylinder vortex, so vp no longer provides an accurate description of the bending streamline instability in this range.
As a cursory study of the time dependent flow behaviour, we analyze the amplitude of the time dependent fluctuations by plotting the normalized variance of the probe velocity, (σv/U)2, versus Wi in Fig. 4(c). For Wi < Wic1, (σv/U)2 ≈ 0. For Wic1 < Wi < Wic3, i.e., within the regime where the streamlines are bent upstream, and the regime where the vortices have formed on the walls, (σv/U)2 gains a slight positive value, indicating vp fluctuates with a relatively low amplitude. However, the fluctuations are random and there is no clear difference in (σv/U)2 in the regimes with or without the upstream wall vortices. The onset of time dependence is marked by a dramatic increase in (σv/U)2 when Wi is increased beyond Wic3, where Wic3 ≈ 125. Following the abrupt increase, there is a general trend for the variance to decrease with increasing Wi, however there is a fair amount of scatter in the data between the separate runs. In addition, no clear hysteresis is observed between runs when increasing or decreasing Wi quasistatically in steps of size δWi ≈ 5, as highlighted in the inset plot in Fig. 4(c). A more detailed analysis of the time dependent behaviour of the flow will be presented in Section 3.5.
3.3 Characterization of the upstream wall vortices
Here we analyze the properties of the vortices that form attached to the walls upstream of the cylinder. An example time-averaged velocity field obtained at Wi = 148 is shown in Fig. 5(a). In Fig. 5(b), the normalized x-component of the fluid velocity, u/U, is plotted along the lines y/R = ±1.9, near the top and bottom walls. Far upstream of the cylinder, u/U ≈ 1. At positions within each vortex, u/U decreases to near 0. To quantify the width of the vortices, , we select an arbitrary threshold value for the velocity u/U = 0.5, below which we define to be ‘inside’ the vortex. Therefore, the width of each vortex is the span of x/R where u/U ≤ 0.5. The normalized position of each vortex, χ, is the midpoint of this range. The downstream edge of the vortices is at x/R ≈ −1.75 and it is approximately constant when the flow is time-steady, i.e., for Wi < Wic3, and therefore χ and
  are coupled. However, for Wi > Wic3, when the flow is time dependent, χ and
  decouple, and the vortices can maintain constant
  with varying χ by sliding along the walls, or they can maintain constant χ with varying
  by changing size symmetrically about their center-point. Since the two vortices tend to be asymmetric in size, we distinguish between them based on which is larger or smaller and use the subscript ‘large’ or ‘small’ on χ and
  when necessary. Note that χ and
  are quantities normalized by R.
 | ||
Fig. 5 (a) A representative time-averaged velocity field normalized by U at a value of Wi such that two asymmetric vortices are present upstream of the cylinder. (b) u/U plotted vs. x/R along the lines y = ±1.9R, near the top and bottom walls. The gray dashed line indicates u/U = 0.5. The width of the large and small vortices,  and and  are indicated in the plot and defined in the text. (c) The Wi-dependence of the center-position of the vortices, χ, and (d) their width are indicated in the plot and defined in the text. (c) The Wi-dependence of the center-position of the vortices, χ, and (d) their width  grouped by which vortex is larger or smaller, and averaged over time and each independent run as described in the text. The gray dashed lines in (c) and (d) indicate the different critical Wi as described in the text. grouped by which vortex is larger or smaller, and averaged over time and each independent run as described in the text. The gray dashed lines in (c) and (d) indicate the different critical Wi as described in the text. | ||
We established in Section 3.2 that this system does not exhibit hysteresis in the instabilities observed, and independent runs agree reasonably well with each other. Therefore, to simplify the presentation of the data, hereafter we have averaged the separate runs together into a single data set. The error bars in the plots that follow account for both the time dependence of the quantities at each Wi for each run, and the variation between runs.
Fig. 5(c) and (d) show plots of χ and  , respectively, versus Wi. The second critical Weissenberg number Wic2 = 60 is defined as the Wi at which upstream wall vortices first appear. With increasing Wi beyond Wic2, the vortices gradually extend upstream, i.e., χ becomes more negative, and
  increases. As Wi is increased beyond Wic3, when the flow becomes strongly time dependent, the position and size of the vortices diverge. One vortex becomes substantially larger than the other, while the smaller vortex does not change significantly in size. The growth of χlarge and
  with Wi over the range Wic2< Wi < Wic4 is approximately quadratic. For Wi > Wic4, the flow is dominated by the vortex that is attached to the upstream pole of the cylinder, and the wall vortices exist intermittently. The data shown in Fig. 5(c) and (d) within this regime account only for the moments in time when the wall vortices exist. This will be discussed in more detail in Section 3.5.
3.4 Characterization of the upstream cylinder vortex
We characterize the upstream cylinder vortex in a similar manner to the upstream wall vortices. An example time-averaged velocity field at Wi = 897, when the flow is dominated by the upstream cylinder vortex, is plotted in Fig. 6(a). We define the length of the vortex using the same threshold procedure as for the wall vortices. Fig. 6(b) shows u/U plotted along the symmetry line y = 0. In the case shown, u/U is small close to the cylinder, and u/U ≈ 2 far from the cylinder. We define ‘inside’ the vortex to be the length over which u/U ≤ 0.5.
 | ||
Fig. 6 (a) A representative time-averaged velocity field normalized by U at a value of Wi such that the upstream cylinder vortex is the dominant feature in the flow. (b) u/U plotted versus x/R along the line y = 0. The gray dashed line indicates u/U = 0.5. The length of the vortex  is indicated in the plot and defined in the text. (c) The Wi-dependence of is indicated in the plot and defined in the text. (c) The Wi-dependence of  averaged over time and over each independent run. The gray dashed lines in (c) indicate the different critical Wi as described in the text. averaged over time and over each independent run. The gray dashed lines in (c) indicate the different critical Wi as described in the text. | ||
Fig. 6(c) shows the length  of the upstream cylinder vortex plotted versus Wi. The fourth critical Weissenberg number Wic4 = 255 is defined as the Wi above which the upstream cylinder vortex grows significantly and persists over time. As Wi is increased beyond Wic4, the vortex grows in length and fluctuates significantly in time, with its mean length increasing approximately linearly with Wi.
At Wi within the time-steady regimes, i.e., Wi < Wic3,  ≈1 across the full range of Wi. This does not indicate the presence of a vortex of length
  = 1, but rather is an artefact of the threshold method for measuring
  , since the flow velocity always drops below the threshold value close enough (within ≈1R) to the cylinder. For Wic3< Wi < Wic4, the time dependent pulsing of the flow results in a periodic lengthening of the low-velocity region near the upstream stagnation point of the cylinder, and thus an increase in the mean and standard deviation of
  . This will be discussed more in Section 3.5.
3.5 Time dependence
The discussion of the results presented above was almost exclusively on the general trends in the time-averaged quantities. Here, we explore in more detail the time-dependent behaviour of the transverse component of velocity near the upstream pole of the cylinder, and the quantities describing the wall and cylinder vortices.Time series of |p/U|, χ,  , and
, and  at select values of Wi are plotted in Fig. 7 (note that the scale of the axes for
  , χ, and
  vary between the columns). Fig. 7(a) shows time series for Wi = 90, i.e., for Wic2 < Wi < Wic3. This Wi is less than the value for significant time dependence, but is within the regime where there are small wall vortices. All plots at this Wi show that there are underlying low-amplitude random fluctuations but no periodicity to the time dependence. In addition, χ and
  show that the vortices are at slightly different positions and vary slightly over time, but are similar in size. The distinction between which vortex is labelled as larger or smaller is made at t = 0 s, but for this case the two vortices are very similar in size, and which vortex is larger changes over time. A video of the velocity field at this Wi over the same time-range is included in the Movie S2 (ESI†).
 | ||
Fig. 7 A selection of time series of the normalized probe velocity |vp/U| (first row), center-position of the vortices χ (second row), the width of the vortices  (third row), and the length of the upstream cylinder vortex (third row), and the length of the upstream cylinder vortex  (fourth row) as defined in the text. The columns distinguish the data by Wi, (a) Wi = 90, (b) Wi = 148, (c) Wi = 190 and (d) Wi = 507. In (d), the small and large vortices are only intermittently present in the experiment, so χsmall and χlarge are discontinuous, as discussed in the text. The blue dashed boxes highlight two moments of interest described in the text. Note the different scales of the y-axes between the plots. (fourth row) as defined in the text. The columns distinguish the data by Wi, (a) Wi = 90, (b) Wi = 148, (c) Wi = 190 and (d) Wi = 507. In (d), the small and large vortices are only intermittently present in the experiment, so χsmall and χlarge are discontinuous, as discussed in the text. The blue dashed boxes highlight two moments of interest described in the text. Note the different scales of the y-axes between the plots. | ||
Fig. 7(b) shows time series at Wi = 148, i.e., for Wic3 < Wi < Wic4. Over this range of Wi, all quantities show quasi-periodic pulsing time dependence. The pulses in |p/U| vary in amplitude, but their spacing in time is fairly regular. χ and  also undergo long-time variation that does not exhibit any clear periodicity over longer time scales (>30 s) than that shown here. At t = 0 s, the two vortices have similar size and position, but χ and
  diverge as time increases. Over the time range shown one vortex shrinks, and thus χsmall moves closer to the cylinder, while the larger vortex remains approximately constant in size. This long-time behaviour is likely due to movement of the vortices along the height of the channel (z direction) and variation in their 3-dimensional structure. See the ESI† and Movies S6–S8 (ESI†). Overlaid on the long-time variation are quasi-periodic pulses of similar frequency to those observed in |p/U|. The pulses in |p/U| and
  occur coincidentally, however the pulse in χlarge towards the cylinder occurs a short time (≈40 ms) later. These pulses are also apparent in χsmall, however they do not occur in
  . Inverse pulses in
  also occur coincidentally with the pulses in |p/U|, i.e.,
  is at a minimum when |p/U| is at a maximum. The pulses in |p/U| are due to an increase in the velocity of the fluid moving around the vortices and past the cylinder. This is accompanied by a reduction in the size of the low-velocity region of fluid near the upstream pole of the cylinder. This also causes the larger vortex to be stretched slightly towards the cylinder, shifting the downstream edge of the vortex closer to the cylinder, while the smaller vortex slides along the wall towards the cylinder without changing size. This is followed by a shift in the position of the large vortex towards the cylinder that lags the pulse in time possibly due to the inertia of the vortex. A video of the velocity field at Wi = 148 over the same time-range is included in the Movie S3 (ESI†).
Fig. 7(c) shows time series at Wi = 190, i.e., within the same time-dependent regime as in Fig. 7(b), Wic3 < Wi < Wic4, but at a higher Wi. At this Wi, all quantities show similar behaviour to that at Wi = 148 with a few key differences. First, there is a more clear disparity in the size of the wall vortices; one of the vortices is approximately three times larger than the other (note the different scales of the χ and  plots compared to those at lower Wi). Second, the time dependence follows the same general behaviour as discussed above but the frequency of the pulsing is higher. This will be discussed further in Section 3.6 in the context of the frequency spectra of the time dependence. Finally, short bursts of irregularity in the time-series for
  and |p/U| start to appear, for example at around t = 2 s. This is due to the upstream cylinder-attached vortex starting to form. However, the vortex cannot grow substantially in size because the wall vortices occupy significant space in the channel and are presumably more stable at this Wi. A video of the velocity field at Wi = 190 over the same time-range is included in the Movie S4 (ESI†).
Fig. 7(d) shows time series at Wi = 507, i.e., for Wi > Wic4. This is within the regime where the cylinder vortex is present, and it competes for time and space in the channel with the wall vortices. The time series are much less regular in this case than at lower Wi. The probe velocity vp is located within the cylinder vortex and no longer accurately quantifies the velocity of the fluid following the bent streamlines. The wall vortices are only intermittently present, so the plots of χ and  are discontinuous. However, there is a key interplay between the length of the cylinder vortex
  and the variables describing the wall vortices. As t approaches 1 s,
  increases gradually and then decreases sharply. The sharp decrease is accompanied by an abrupt increase in
  from 0 to a relatively large value. However, the smaller vortex does not appear.
  then decreases gradually to zero over approximately 2.5 s while
  gradually grows, and then the process is repeated. Two occurrences of the abrupt decrease in
  and increase in
  are highlighted in Fig. 7(d) by blue dashed boxes. This process describes a large vortex forming at the upstream pole of the cylinder that fluctuates and grows in size until, at its largest, it sheds from the cylinder and migrates towards one of the side walls. The vortex then stays on the wall for a short time until it is squeezed out of existence by the formation of another cylinder vortex. In this case, the vortex always sheds towards the positive side of the channel, however both directions were observed in the experiments. The ‘smaller’ vortex is also intermittently detectable, or very small for the duration of the experiment, so in Fig. 7(d)
 ≈ 0, and χsmall is only sometimes present. A video of the velocity field at Wi = 507 over the same time-range is included in the Movie S5 (ESI†).
3.6 Power spectra
Since the periodicity of the time dependence is most evident in the time series of |p/U| and  , and they both exhibit similar pulsation time dependence, here we will focus only on the frequency spectra of
  . The power spectral density function of
  with its mean subtracted (PSD{
 }) is plotted in Fig. 8(a) for the same time series as shown in Fig. 7. Note that the PSD for the Wi = 507 case has been multiplied by 10 to separate it from the spectra at lower Wi, but the other spectra have not been shifted.
 | ||
Fig. 8 (a) Power spectral density functions of the time series of  for the same Wi as shown in Fig. 7. The data for Wi = 507 have been shifted up by a factor of 10 for clarity. The other data have not been shifted. (b) The primary frequency peak in the power spectra fpeak, plotted versus Wi. The error bars indicate the width of the peaks and are mostly smaller than the size of the data points. The red curve is a fit of eqn (8) to the data. for the same Wi as shown in Fig. 7. The data for Wi = 507 have been shifted up by a factor of 10 for clarity. The other data have not been shifted. (b) The primary frequency peak in the power spectra fpeak, plotted versus Wi. The error bars indicate the width of the peaks and are mostly smaller than the size of the data points. The red curve is a fit of eqn (8) to the data. | ||
The PSD for the Wi = 90 case shows no distinct features. For Wi = 148 there is a strong peak in the spectrum at fpeak ≈ 5.7 Hz, and higher harmonics can be discerned up to 4fpeak. This is accompanied by a broad spectrum increase in the power. For Wi = 190, the dominant peak in PSD{ } is more broad and is shifted to fpeak ≈ 8.6 Hz. Finally, for Wi = 507, factoring in the ×10 shift in the spectrum, there is a further increase in the broad spectrum amplitude of the power spectrum compared to a lower Wi. No clear peak can be discerned in the spectrum, and at high frequency it decays with a power-law slope approximately equal to −2. A common feature of elastic turbulence is the power-law decay of the velocity power spectra with slope ≈−3.5, with the precise slope value depending on geometry.9,10,14 Despite the high Wi, the signature of elastic turbulence is not observed in this system, which suggests that the kinematics in the flow past the microcylinder may serve to limit the elastic stress. For the flow of the same wormlike micellar solution past a rigid, BR = 0.1 microcylinder, elastic turbulence was not observed at high Wi.53 However, if the BR = 0.1 cylinder was cantilevered and therefore flexible, the signature of elastic turbulence was observed in its flow-induced vibrations at high Wi.20 In the flow past the cantilevered cylinder, elastic stress (flow-induced birefringence) was found to be most intense at the free tip of the cylinder. The deflection of the cylinder may therefore alter the kinematics in the flow to permit the growth of elastic stress into the turbulent regime. We note that although the power spectra shown in Fig. 8 are of the vortex length, power spectra of the velocity of the fluid both upstream and downstream of the cylinder show the same slope of −2 at the highest Wi probed (Wi ≈ 900, not shown).
The trend for the dominant frequency to shift higher with increasing Wi is observed across all of the experiments (Fig. 7(b)). Note the narrow range of Wi plotted. We fit a power-law function of the form given by eqn (8) to the data. The fit yielded f0 = 2.8 Hz, a = 9.4 × 10⁻⁵, and b = 2.1. The constant term f0 can be interpreted as the apparent pulsation frequency at zero Wi, i.e., zero stress, and is similar to the inverse of the breakage timescale 1/λbreak ≈ 2 Hz. For Wi > 235, a dominant frequency can no longer be identified in the spectra.
| fpeak = f0 + aWib | (8) |
4 Discussion and conclusions
We have presented a detailed characterization of a new viscoelastic flow instability for creeping flow past a microcylinder with blockage ratio BR = 0.5 and aspect ratio α ≈ 5. The way the instability modifies the flow resembles the elastic instabilities in several other systems including bending streamlines and an upstream vortex attached to the cylinder reported in viscoelastic flow past more confined microcylinders,59,60 upstream lip vortices seen in L-bend30–33,45 and cross-slot34–38 geometries, and corner vortices in contraction geometries.39–44 However, this work is the first to explicitly report the observation of upstream wall vortices in viscoelastic flow past a cylinder. We note that although the wormlike micellar solution used in this work has shear banding properties, shear banding is not a requirement for the instability to occur. In Fig. S2 through S5 in the ESI† we present cursory flow experiments using three viscoelastic fluids with contrasting rheological properties: a weakly elastic, shear-thinning fluid; an elastic, constant viscosity Boger fluid; and a shear-thinning but non-shear-banding polymer solution. We demonstrate that neither shear-thinning viscosity nor elasticity alone are sufficient for the upstream bending streamline instability to occur, nor for upstream wall-attached or cylinder-attached vortices to form. However, flow of the shear-thinning but non-shear-banding polymer solution yielded flow behaviour analogous to the wormlike micellar solution. The requirement for the test fluid to be both shear thinning and sufficiently elastic is consistent with the rheological requirements for a lip vortex to form upstream of a 90-degree bend31,45 or cross-slot geometry,34,35 and for the lateral flow asymmetry to occur in the flow of viscoelastic, shear-thinning fluids past a cylinder with smaller BR.55The initial destabilization of the flow from steady and symmetric to steady with bent streamlines near the upstream stagnation point is likely due to the compression of the wormlike micelles as they approach the cylinder. The micelles are subsequently stretched by the contraction flow through the gaps between the cylinder and walls. This instability is well-described by a supercritical pitchfork bifurcation. This flow state persists until two vortices form on the walls upstream of the cylinder, which is accompanied by a reduction in the normalized velocity of the fluid moving laterally near the upstream stagnation point. The wall vortices are reminiscent of upstream lip vortices seen in L-bend30–33 and cross-slot34–38 geometries. In those systems, the mechanism behind the formation of the lip vortices is a combination of streamline curvature and elastic tensile stress along the streamlines that satisfy the Pakdel–McKinley criterion for elastic instability.7,8 In addition, shear thinning was also required to reduce stress gradients near the corners in the geometry. Although there is no geometric corner in the cylinder geometry in the present work, the bent streamlines near the upstream pole may yield similar conditions to those in the aforementioned studies. The formation of the wall vortices therefore seems to limit the curvature of the streamlines near the stagnation point, and thus reduce the elastic stress in the flow. The growth of the vortices with increasing Wi may also serve to reduce the extensional rate of the fluid by increasing the distance over which the fluid must accelerate to squeeze between the cylinder and walls. The fact that the fingerprint of elastic turbulence was not observed in the power spectra even at the highest Wi probed in this study may further support this supposition.
Over a limited range of Wi when the flow was time dependent, the flow pulsed quasi-periodically with a frequency slightly higher than the inverse of the time scale associated with the breakage and reformation of the micelles 1/λbreak ≈ 2 Hz. The pulsation frequency increased from fpeak ≈ 5 Hz at the onset of time dependence to fpeak ≈ 12 Hz at the highest Wi where quasi-periodic pulsations were still observed. A fit of a power-law function with an constant offset term yielded an apparent zero-Wi frequency of f0 = 2.8 Hz, which is similar to the inverse of the breakage timescale, λbreak, which was calculated from the small-amplitude oscillatory shear rheology of the wormlike micellar solution by using the model of Turner and Cates.2,3 Their model makes the assumption that the micelles are under equilibrium conditions, and the micelles dynamically break and reform to relieve stress accumulated from a step-increase in strain. These conditions do not accurately describe the state of the micelles flowing past the cylinder in this work. The micelles are subject to a complex combination of shear, compression, and extension. These complex kinematics may explain why the pulsation frequency is higher than 1/λbreak, and why it increases with increasing Wi; the more stress the micelles are under, the more frequently the micelles can break.
Interestingly, the time dependent behaviour differs from that observed in flow of the same wormlike micellar solution past a cylinder with a smaller BR.20,53 In those studies, for similar Wi, the fluid pulsed with time dependence that was governed by the terminal relaxation time λ, rather than λbreak. This may be because that instability originates at the downstream stagnation point of the cylinder, and develops into a state where shear-thinning of the fluid and extension of the micelles govern the behaviour of the system. Compression is less significant, both at the upstream stagnation point due to the lateral asymmetry in the flow, and because the gaps between the cylinder and walls are relatively large, thus limiting the contraction flow in the gaps. This suggests that the contraction flow through the cylinder-wall gaps in flow past a higher-BR cylinder may contribute to the difference in the dynamics of the flow. In addition, the quasi-periodic pulsing dynamics are reminiscent of the pulse-like time dependence observed in the shearing flow of wormlike micellar fluids in a Couette cell,77 and the pressure-driven flow of wormlike micellar fluids in a capillary channel,78 where the dynamics are attributed to the breakdown of the micelle structure due to the strong shear or extensional stresses in the flow. Similarly, here the stress accumulated by the micelles from the rapid acceleration and extension into the gaps of the contraction flow may be more readily relaxed via micellar breakage, thus also limiting the extensional stress of the micelles. The different time-dependent behaviour in flow of a wormlike micellar solution past low-BR, and high-BR microcylinders may provide a novel way to measure the terminal relaxation time and breakage timescale, respectively, of wormlike micellar solutions under stress.
The novel flow instability presented in this work offers an additional result for the benchmark test of viscoelastic flow past a cylinder. The results discussed were entirely two-dimensional, focused on the mid-plane of the channel. Due to the stark difference in the behaviour of this instability with increasing Wi compared to viscoelastic flow past microcylinders in low-aspect ratio microchannels,59,60 the aspect ratio of the channel likely plays a significant role in the flow dynamics. In addition, a recent numerical study of two-dimensional viscoelastic flow past a cylinder reproduced the upstream cylinder vortex, but no clear sign of wall vortices was reported.61 A complete understanding of the complex dynamics responsible for the instability will therefore likely require a fully 3D investigation of this flow. 3D numerical simulations of viscoelastic flow past a cylinder, and a systematic experimental study that varies the channel blockage and aspect ratios, and the rheology of the test fluid will be instructive. Our results contribute to the rapidly growing understanding viscoelastic flow instabilities in microfluidic geometries,15,24,57 and should be considered in the design of microfluidic devices and lab-on-a-chip systems that utilize viscoelastic fluids.
Conflicts of interest
There are no conflicts to declare.Acknowledgements
We gratefully acknowledge the support of the Okinawa Institute of Science and Technology Graduate University (OIST) with subsidy funding from the Cabinet Office, Government of Japan. We also acknowledge funding from the Japan Society for the Promotion of Science (JSPS, Grant No. 20K14656 and 21K03884) and the Joint Research Projects (JRPs) supported by the JSPS and the Swiss National Science Foundation (SNSF). We are grateful for the help and support provided by the Engineering Section of the Research Support Division at Okinawa Institute of Science and Technology Graduate University.Notes and references
- C. W. Macosko, Rheology: Principles, Measurements, and Applications, Wiley, 1996 Search PubMed.
- M. E. Cates, Macromolecules, 1987, 20, 2289–2296 CrossRef CAS.
- M. S. Turner and M. E. Cates, Langmuir, 1991, 7, 1590–1594 CrossRef CAS.
- R. G. Larson, Rheol. Acta, 1992, 31, 213–263 CrossRef CAS.
- T. M. Squires and S. R. Quake, Rev. Mod. Phys., 2005, 77, 977–1026 CrossRef CAS.
- N. Burshtein, S. T. Chan, K. Toda-Peters, A. Q. Shen and S. J. Haward, Curr. Opin. Colloid Interface Sci., 2019, 43, 1–14 CrossRef CAS.
- P. Pakdel and G. H. McKinley, Phys. Rev. Lett., 1996, 77, 2459–2462 CrossRef CAS PubMed.
- G. H. McKinley, P. Pakdel and A. Öztekin, J. Non-Newtonian Fluid Mech., 1996, 67, 19–47 CrossRef CAS.
- A. Groisman and V. Steinberg, Nature, 2000, 405, 53–55 CrossRef CAS PubMed.
- A. Groisman and V. Steinberg, Nature, 2001, 410, 905–908 CrossRef CAS PubMed.
- A. Groisman and V. Steinberg, New J. Phys., 2004, 6, 29 CrossRef.
- L. Pan, A. Morozov, C. Wagner and P. E. Arratia, Phys. Rev. Lett., 2013, 110, 174502 CrossRef CAS PubMed.
- A. Varshney and V. Steinberg, Nat. Commun., 2019, 10, 652 CrossRef CAS PubMed.
- V. Steinberg, Annu. Rev. Fluid Mech., 2021, 53, 27–58 CrossRef.
- S. S. Datta, A. M. Ardekani, P. E. Arratia, A. N. Beris, I. Bischofberger, J. G. Eggers, J. E. López-Aguilar, S. M. Fielding, A. Frishman, M. D. Graham, J. S. Guasto, S. J. Haward, S. Hormozi, G. H. McKinley, R. J. Poole, A. Morozov, V. Shankar, E. S. G. Shaqfeh, A. Q. Shen, H. Stark, V. Steinberg, G. Subramanian and H. A. Stone, Perspectives on viscoelastic flow instabilities and elastic turbulence, 2021, https://arxiv.org/abs/2108.09841.
- S. De, J. van der Schaaf, N. G. Deen, J. A. M. Kuipers, E. A. J. F. Peters and J. T. Padding, Phys. Fluids, 2017, 29, 113102 CrossRef.
- D. Kawale, E. Marques, P. L. J. Zitha, M. T. Kreutzer, W. R. Rossen and P. E. Boukany, Soft Matter, 2017, 13, 765–775 RSC.
- M. Carrel, V. L. Morales, M. A. Beltran, N. Derlon, R. Kaufmann, E. Morgenroth and M. Holzner, Water Res., 2018, 134, 280–291 CrossRef CAS PubMed.
- U. Eberhard, H. J. Seybold, E. Secchi, J. Jiménez-Martínez, P. A. Rühs, A. Ofner, J. S. A. Jr. and M. Holzner, Sci. Rep., 2020, 10, 11733 CrossRef CAS PubMed.
- C. C. Hopkins, S. J. Haward and A. Q. Shen, Small, 2020, 16, 1903872 CrossRef CAS PubMed.
- C. A. Browne, A. Shih and S. S. Datta, Small, 2020, 16, 1903944 CrossRef CAS PubMed.
- D. M. Walkama, N. Waisbord and J. S. Guasto, Phys. Rev. Lett., 2020, 124, 164501 CrossRef CAS PubMed.
- S. J. Haward, C. C. Hopkins and A. Q. Shen, Proc. Natl. Acad. Sci. U. S. A., 2021, 118, e2111651118 CrossRef CAS PubMed.
- M. Kumar, J. S. Guasto and A. M. Ardekani, J. Rheol., 2022, 66, 375 CrossRef CAS.
- M. Brust, C. Schaefer, R. Doerr, L. Pan, M. Garcia, P. E. Arratia and C. Wagner, Phys. Rev. Lett., 2013, 110, 078305 CrossRef CAS PubMed.
- M. Thiébaud, Z. Shen, J. Harting and C. Misbah, Phys. Rev. Lett., 2014, 112, 238304 CrossRef PubMed.
- T. Rodrigues, F. J. Galindo-Rosales and L. Campo-Deaño, J. Non-Newtonian Fluid Mech., 2020, 286, 104406 CrossRef CAS.
- M.-H. Wei, B. Li, R. L. A. David, S. C. Jones, V. Sarohia, J. A. Schmitigal and J. A. Kornfield, Science, 2015, 350, 72–75 CrossRef CAS PubMed.
- B. Keshavarz, E. C. Houze, J. R. Moore, M. R. Koerner and G. H. McKinley, Phys. Rev. Lett., 2016, 117, 154502 CrossRef PubMed.
- S. Gulati, D. Liepmann and S. J. Muller, Phys. Rev. E: Stat., Nonlinear, Soft Matter Phys., 2008, 78, 036314 CrossRef PubMed.
- S. Gulati, C. S. Dutcher, D. Liepmann and S. J. Muller, J. Rheol., 2010, 54, 375–392 CrossRef CAS.
- M. Y. Hwang, H. Mohammadigoushki and S. J. Muller, Phys. Rev. Fluids, 2017, 2, 043303 CrossRef.
- Y. Zhang, H. Mohammadigoushki, M. Y. Hwang and S. J. Muller, Phys. Rev. Fluids, 2018, 3, 093301 CrossRef.
- N. Dubash, P. Cheung and A. Q. Shen, Soft Matter, 2012, 8, 5847–5856 RSC.
- S. J. Haward, T. J. Ober, M. S. Oliveira, M. A. Alves and G. H. McKinley, Soft Matter, 2012, 8, 536–555 RSC.
- P. C. Sousa, F. T. Pinho, M. S. N. Oliveira and M. A. Alves, Soft Matter, 2015, 11, 8856–8862 RSC.
- A. Kalb, L. A. Villasmil-Urdaneta and M. Cromer, Phys. Rev. Fluids, 2017, 2, 071301 CrossRef.
- A. Kalb, L. A. Villasmil-Urdaneta and M. Cromer, J. Non-Newtonian Fluid Mech., 2018, 262, 79–91 CrossRef CAS.
- D. V. Boger, Annu. Rev. Fluid Mech., 1987, 19, 157–182 CrossRef.
- S. White, A. Gotsis and D. Baird, J. Non-Newtonian Fluid Mech., 1987, 24, 121–160 CrossRef CAS.
- G. H. McKinley, W. P. Raiford, R. A. Brown and R. C. Armstrong, J. Fluid Mech., 1991, 223, 411–456 CrossRef CAS.
- J. P. Rothstein and G. H. McKinley, J. Non-Newtonian Fluid Mech., 1999, 86, 61–88 CrossRef CAS.
- D. W. Carlson, A. Q. Shen and S. J. Haward, J. Fluid Mech., 2021, 923, R6 CrossRef CAS.
- F. Khalkhal and S. Muller, Phys. Rev. Fluids, 2022, 7, 023303 CrossRef.
- S. Chono and Y. Iemoto, J. Rheol., 1992, 36, 335 CrossRef CAS.
- R. C. Armstrong, R. A. Brown and B. Caswell, J. Non-Newtonian Fluid Mech., 1984, 16, 1–2 CrossRef.
- M. Chilcott and J. Rallison, J. Non-Newtonian Fluid Mech., 1988, 29, 381–432 CrossRef CAS.
- G. H. McKinley, R. C. Armstrong and R. A. Brown, Philos. Trans. R. Soc., A, 1993, 344, 265–304 CrossRef.
- M. Alves, P. Oliveira and F. Pinho, Annu. Rev. Fluid Mech., 2021, 53, 509–541 CrossRef.
- K. Walters and R. I. Tanner, in The motion of a sphere through an elastic liquid, ed. R. P. Chhabra and D. De Kee, CRC Press, 1992, pp. 73–86 Search PubMed.
- S. J. Haward, K. Toda-Peters and A. Q. Shen, J. Non-Newtonian Fluid Mech., 2018, 254, 23–35 CrossRef CAS.
- A. A. Dey, Y. Modarres-Sadeghi and J. P. Rothstein, Phys. Rev. Fluids, 2018, 3, 063301 CrossRef.
- S. J. Haward, N. Kitajima, K. Toda-Peters, T. Takahashi and A. Q. Shen, Soft Matter, 2019, 15, 1927–1941 RSC.
- S. J. Haward, C. C. Hopkins and A. Q. Shen, J. Non-Newtonian Fluid Mech., 2020, 278, 104250 CrossRef CAS.
- S. Varchanis, C. C. Hopkins, A. Q. Shen, J. Tsamopoulos and S. J. Haward, Phys. Fluids, 2020, 32, 053103 CrossRef CAS.
- C. C. Hopkins, S. J. Haward and A. Q. Shen, Phys. Rev. Lett., 2021, 126, 054501 CrossRef CAS PubMed.
- S. J. Haward, C. C. Hopkins, S. Varchanis and A. Q. Shen, Lab Chip, 2021, 21, 4041–4059 RSC.
- M. B. Khan and C. Sasmal, Phys. Fluids, 2021, 33, 033109 CrossRef CAS.
- B. Qin, P. F. Salipante, S. D. Hudson and P. E. Arratia, J. Fluid Mech., 2019, 864, R2 CrossRef CAS PubMed.
- Y. Zhao, A. Q. Shen and S. J. Haward, Soft Matter, 2016, 12, 8666–8681 RSC.
- S. Peng, T. Tang, J. Li, M. Zhang and P. Yu, Numerical Study of Viscoelastic Upstream Instability, 2022, https://arxiv.org/abs/2203.09239.
- J. Gottmann, M. Hermans and J. Ortmann, Phys. Procedia, 2012, 39, 534–541 CrossRef.
- H. Rehage and H. Hoffmann, J. Phys. Chem., 1988, 92, 4712–4719 CrossRef CAS.
- H. Rehage and H. Hoffmann, Mol. Phys., 1991, 74, 933–973 CrossRef CAS.
- S. Lerouge, M. Argentina and J. P. Decruppe, Phys. Rev. Lett., 2006, 96, 088301 CrossRef CAS PubMed.
- S. Lerouge, M. A. Fardin, M. Argentina, G. Grégoire and O. Cardoso, Soft Matter, 2008, 4, 1808–1819 RSC.
- M.-A. Fardin, L. Casanellas, B. Saint-Michel, S. Manneville and S. Lerouge, J. Rheol., 2016, 60, 917–926 CrossRef CAS.
- R. B. Bird, R. C. Armstrong and O. Hassager, Dynamics of Polymeric Liquids, Wiley, 1987 Search PubMed.
- P. A. Vasquez, G. H. McKinley and L. Pamela Cook, J. Non-Newtonian Fluid Mech., 2007, 144, 122–139 CrossRef CAS.
- T. J. Ober, J. Soulages and G. H. McKinley, J. Rheol., 2011, 55, 1127–1159 CrossRef CAS.
- C. Masselon, J.-B. Salmon and A. Colin, Phys. Rev. Lett., 2008, 100, 038301 CrossRef PubMed.
- C. Masselon, A. Colin and P. D. Olmsted, Phys. Rev. E: Stat., Nonlinear, Soft Matter Phys., 2010, 81, 021502 CrossRef PubMed.
- V. Lutz-Bueno, R. Pasquino, S. J. Haward, A. Q. Shen and P. Fischer, J. Rheol., 2017, 61, 769–783 CrossRef CAS.
- S. Wereley and C. Meinhart, in Micron-Resolution Particle Image Velocimetry, ed. K. S. Breuer, Springer Berlin Heidelberg, Berlin, Heidelberg, 2005, pp. 51–112 Search PubMed.
- S. T. Wereley and C. D. Meinhart, Annu. Rev. Fluid Mech., 2010, 42, 557–576 CrossRef.
- A. Liberzon, T. Käufer, A. Bauer, P. Vennemann and E. Zimmer, OpenPIV/openpiv-python: OpenPIV-Python v0.23.4 (0.23.4), Zenodo, 2021 DOI:10.5281/zenodo.4409178.
- R. Ganapathy and A. K. Sood, Phys. Rev. Lett., 2006, 96, 108301 CrossRef PubMed.
- S. E. M. P. F. Salipante and S. D. Hudson, Soft Matter, 2018, 14, 9020 RSC.
Footnote |
| † Electronic supplementary information (ESI) available: Videos of the time-dependent velocity fields at five different Weissenberg numbers, characterization of the structure of the wall vortices along the height of the channel (in the z direction), and cursory flow experiments using a weakly-elastic shear-thinning fluid, an elastic constant viscosity Boger fluid, and a viscoelastic shear-thinning but non-shear-banding polymer solution. See DOI: https://doi.org/10.1039/d2sm00418f |
| This journal is © The Royal Society of Chemistry 2022 |