
 Open Access Article
 This Open Access Article is licensed under a
 Creative Commons Attribution 3.0 Unported Licence
Effects of the structure of lipid-based agents in their complexation with a single stranded mRNA fragment: a computational study†
Anastassia N.
Rissanou
 *ab and
Kostas
Karatasos
*a
*ab and
Kostas
Karatasos
*a
aDepartment of Chemical Engineering, University of Thessaloniki, P.O. BOX 420, 54124 Thessaloniki, Greece. E-mail: risanou@uoc.gr; Fax: +30 2810393701; Tel: +30 2810393746
bDepartment of Mathematics and Applied Mathematics, University of Crete, GR-71409, Heraklion, Crete, Greece. E-mail: karatas@eng.auth.gr; Fax: +30-2310996222; Tel: +30-2310995850
First published on 25th July 2022
Abstract
In this work we employed fully atomistic molecular dynamics simulations, aiming towards a better understanding of the mechanisms associated with the formation and the stability of lipid-based RNA nanoassemblies, in an aqueous environment. We examined two groups of lipid-based complexation agents, differing in the degree of hydrophobicity and in the overall charge. The first group was comprised of cationic ionizable agents while the second included electrically neutral amphoteric phosphatidylcholine lipids. It was found that the overall charge of the complexation agents played the most decisive role in the energetics of the lipid/RNA association, while their degree of hydrophobicity affected their self-assembly and their complexation kinetics. The latter also affected the structural stability of the formed complexes since the water entrapped within the clusters of the less hydrophobic agents appeared to reduce the coherence of the lipid–RNA nanoassemblies. The combined effects of the aforementioned attributes dictated also the RNA conformation after complexation. The results from the present study provide thus new insight towards controlling the morphology, the energetic stability and the structural integrity of the formed complexes.
1. Introduction
During the worldwide pandemic situation a new class of vaccine products emerged, based on mRNA strands encapsulated in lipid nanoparticles (LNPs).1 The design of mRNA-based vaccines is flexible and fast, especially when lipid nanoparticles are used as protective agents.2 The structure and morphology of LNPs play a critical role in their chemical stability as well as in the stability of their complexes with mRNA.3 The composition of an mRNA–LNP complex is also of fundamental importance. Despite the remarkable progress that has been made in this direction, a detailed exploration of the characteristics of mRNA–LNP complexes and their influence on their efficiency is still under investigation. Contradictory findings concerning the optimal composition of the mRNA–LNP shell4–7 indicate the possibility of multiple types of mRNA–LNP structures that should be considered. The observed discrepancies can be attributed to the structure of the lipids used and to the nature of their interactions with mRNA. Various unresolved issues still remain, concerning their storage stability3 or the location of RNA within the lipid nanoparticle. Experimental evidence indicates that the nucleotide sequence plays also an important role in this arrangement, suggesting mRNA to be placed at the core of the LNP, whereas siRNA at its surface.8 However, various studies have demonstrated that mRNA can be exposed to an aqueous environment even when it is encapsulated within LNPs, because water molecules can be present within the formed vesicles.4,9–11 Furthermore, interest has been expressed also for short RNA fragments (i.e. 20–30 bases), which are believed to be able to help in both up and down regulation of transcription and translation.12–14 The target is to utilize them for the development of promising new anticancer micro-RNA (miRNA) drugs.15Several categories of lipid nanoparticles, such as solid lipid nanoparticles, nanostructured lipid carriers, nucleic acid complexes with permanently charged cationic lipids and lipid-like materials (lipidoids), used in formulations for the stabilization of mRNA and its safe delivery into the target cells, has been described in recent review articles.16–22 Among them, pH-responsive ionizable cationic lipids, for which the surface charge can be modulated in a controllable manner, promote both the efficient binding with oppositely charged RNA strands and the internalization of the LNPs by the target cells.23–29 In formulations based on these ionizable lipids, several other components, such as helper phospholipids, cholesterol and polyethylene glycol (PEG)-lipids are usually present, affecting the physicochemical milieu relevant to the lipid–RNA complexation. Apart from optimizing the relative proportions of these components,11,20 improvement of the overall efficiency of the complexation and the delivery process can also be promoted by appropriate modification of the structural characteristics of the ionizable lipids. Subtle changes to their acid-dissociation constants (pKa) and/or to their chemical structure were found to profoundly impact the overall delivery properties of the LNPs.17,25,30–32
Another typical class of lipid molecules involved in the fabrication of LNPs for nucleic-acid delivery is the phosphatidylcholines (PCs), which includes saturated and symmetric phospholipids with a similar molecular structure of the hydrophilic part but different alkyl chain lengths.22,33,34 Phosphatidylcholine molecules are generally the most abundant lipids in animal cell membranes, providing structural stability. These lipids have been used in the very first attempts for nucleic-acid delivery formulations.35,36 Two of the most common such lipid membranes are those formed by the 1,2-dilauroyl-sn-glycero-3-phosphocholine (DLPC) lipid, which has 12 carbon atoms and the dipalmitoyl-sn-glycero-3-phosphocholine (DPPC) lipid with 16 carbon atoms in their alkyl chains. These molecules are amphoteric, bearing two charged groups of different sizes. The anionic part involves phosphates and the cationic part is located on the ammonium group.37
Experimental studies examining the affinity of such lipids with RNA showed that the interaction involved in the association is rather weak, and cannot be explained by considering only electrostatic forces.38 Comparison of the adsorption of single- and double-stranded nucleic acids onto lipid-based zwitterionic membranes and cationic surfactant monolayers highlighted the role of hydrophobic interactions between the exposed hydrophobic bases of RNA and the hydrocarbon parts of the phospholipids.34 Characteristics of the RNA fragment (single, or double stranded, short or longer sequences) were also found to affect the adsorption behavior onto such monolayers. In the case of single stranded short RNA sequences interacting with zwitterionic phospholipids, it was demonstrated that the presence of RNA resulted in fractal-like interconnecting domains.34
From these and several other studies,25,28,39–41 it has been made clear that a rational approach for the design of lipid-based nanocarriers for gene therapy applications requires a fundamental understanding of the physicochemical processes relevant to the association of these molecules with the nucleic acid sequences. To this end, computer simulations may offer a detailed description of the structural and conformational characteristics as well as the thermodynamic stability of such lipid/nucleic acid complexes, shedding light to the mechanisms involved in the complexation process. All-atom MD simulations,42,43 coarse-grained models44–46 as well as multiscale approaches42 have been utilized for the study of the structure and the function of lipid-based carriers used for RNA delivery. However, the complexity and the size of these models present difficulties towards a comprehensive description of long nucleic acid sequences in the all-atom representation. For that reason, only a limited number of such studies have been attempted so far.
In the present work, all-atom molecular dynamics simulations have been utilized for the detailed investigation of the self-assembly and the efficacy of lipid-based molecules (i.e., the complexation agents) in forming stable complexes with RNA, are examined in detail. Ionizable lipids, similar to those examined in the present study for the construction of LNPs which successfully delivered the mRNA cargo and led to the expression of the targeted antibody, have been used in a recent experimental study.41 We focus on the role of characteristics such as the charge they bear (polar but overall neutral, or permanently charged) and their degree of hydrophobicity (smaller or larger hydrophobic parts). Our main goal is a detailed investigation on the role of these characteristics in the structural, conformational and thermodynamic stability of the formed clusters and of their complexes with RNA. We also perform kinetic studies for the determination of the timescales relevant to the complexation process.
Our findings indicate that the structural and the thermodynamic stability of the complexes formed in an aqueous environment, as well as key morphological features of the nanoassemblies, such as the average size, the conformation of the RNA sequence after complexation and its location with respect to the surface of the complex, can be controlled by the overall charge of the lipid-based agents, and by their degree of hydrophobicity.
2. Systems and simulation details
2.1. Description of the systems
We have examined two different groups of lipids or lipid-derived mRNA complexation agents. The agents of the first group bear a cationic diketopiperazine core, with varying end-groups (i.e., X1, X2, X3, X4), as described in Fig. 1a. The second group is comprised of two amphoteric phosphatidylcholine lipids differing in the size of the aliphatic part, DPPC (C40H80NO8P) and DLPC (C32H64NO8P), as depicted in Fig. 1b and c respectively. In the first group, one complexation agent bears four methyl end groups, i.e., X1, X2, X3, X4 in Fig. 1a are methyls (it will be referred to as DM henceforth), a second agent bears two methyl end-groups, i.e., X1 and X3 in Fig. 1a and two linoleic ethyl ester end-groups (with 17 carbon atoms), i.e., X2 and X4 in Fig. 1a (it will be referred to as DML47 from now on), and the third member bears four linoleic ethyl ester end-groups (with 17 carbon atoms), i.e., X1, X2, X3 and X4 in Fig. 1a, and will be referred to as OfDegLin, as was reported in ref. 39 All systems contain a single mRNA nucleotide sequence comprised of 30 nucleotides, which is part of an mRNA sequence of 642 nucleotides that is based on the fragment of the Herceptin antibody (light chain),48,49 (see ESI†). Such short RNA sequences have been considered for more than a decade in nucleic-acid-based therapeutics.14 It should be noted here that the short mRNA fragment simulated in the present study, exhibits similar physicochemical behavior with a much longer RNA sequence, as far as it concerns the mechanisms of complexation with DML, at timescales of the order of 100 ns.47 On these grounds, it appears that examination of the interactions between the short mRNA fragment and the complexation agents is able to capture the main characteristics of their associative behavior, while providing a computationally affordable route for a comparative study involving several of such molecules.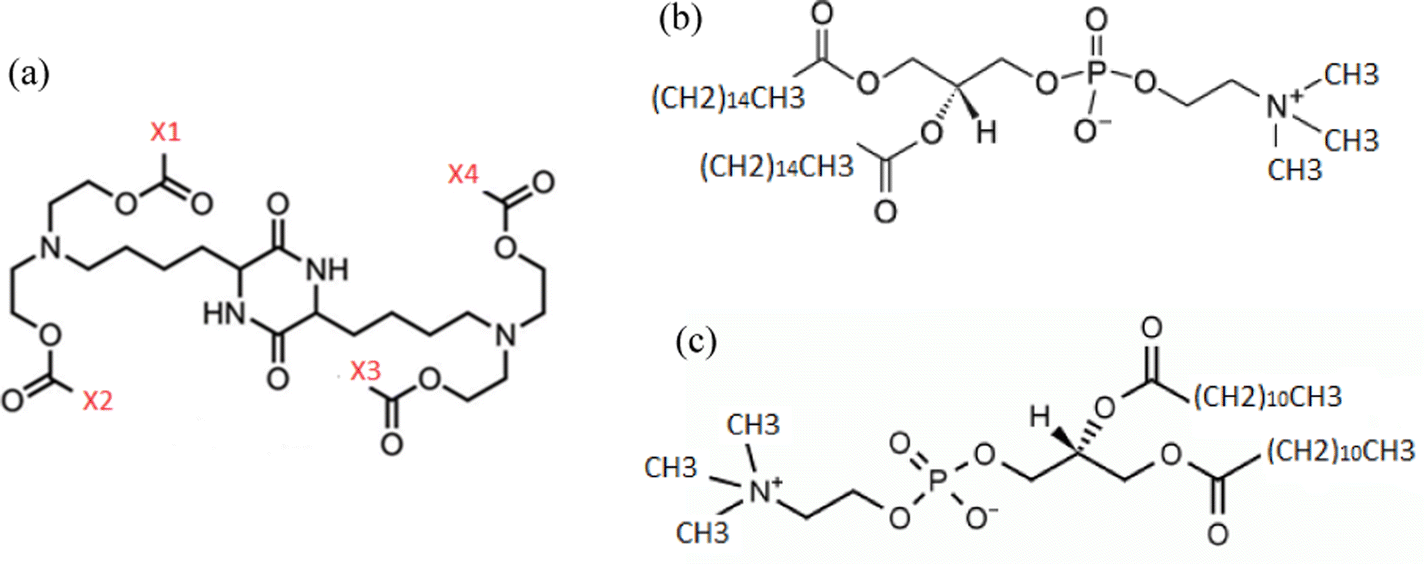 | ||
| Fig. 1 Chemical structures of all complexation agents examined in the present study. (a) Diketopiperazine-core agents. X1, X2, X3 and X4 are different end-groups characterizing these agents (see text). (b) DPPC lipid (c) DLPC lipid. | ||
In the systems containing molecules of the first group (DM, DML and OfDegLin), three kinds of molecules, in terms of the protonation state of the two ionizable nitrogens, were considered in each one of them: electrically neutral (denoted as Lipids0), single protonated (denoted as Lipids1) and double protonated (denoted as Lipids2). This setup is based on the protonation state of diketopiperazine core at neutral pH conditions. An estimation of the pKa of the ionizable nitrogen atoms in these agents, renders a value close to 7, based on calculations performed using the OPERA suite50,51 and the Marvin module from ChemAxon.52 This value corresponds to a degree of ionization53 close to 0.5 for each ionizable nitrogen atom, hence the three states of ionization of the diketopiperazine-based molecules. In the systems containing the molecules of the first group, the negative charge of the mRNA nucleotides is counterbalanced by the positive charge of the protonated agents. In the systems comprised of the electrically neutral DPPC and DLPC lipids, an appropriate amount of sodium counterions were added to maintain the overall electrical neutrality. Details regarding the composition of the examined systems are provided in Table 1. The weight percentage of water is kept between 92–96% in all systems. At such levels of water content, it is expected that the timescales associated with the self-assembly of the lipid-based agents, as well as with their complexation with RNA, is essentially related to the behavior corresponding to a high dilution limit. At different conditions (e.g., at lower water content, different pH, very high ionic strength), these timescales may vary significantly compared to those discussed in the present study and different equilibration/simulation protocols might be more appropriate than those presented here.
| mRNA (30 nucleotides) | |||||||
|---|---|---|---|---|---|---|---|
| System | # Lipids0 | # Lipids1 | # Lipids2 | # Water molec. | Water (wt%) | # Na ions | # Atoms |
| DM | 29 | 5 | 12 | 51637 | 96.1 | — | 160047 |
| DML | 29 | 5 | 12 | 54387 | 94.5 | — | 172345 |
| OfDegLin | 29 | 5 | 12 | 104204 | 96.0 | — | 325844 |
| DPPC | 45 | — | — | 55256 | 95.8 | 29 | 172614 |
| DLPC | 45 | — | — | 55500 | 96.3 | 29 | 172266 |
2.2. Simulation details
All-atom Molecular Dynamics simulations of aqueous solutions of lipid molecules and one mRNA chain were performed using the GROMACS package.54 All components (i.e., both mRNA55 and the complexation agents56,57) were modeled through the CHARMM3658,59 all atom force field.60 The SPC/E explicit solvent model61,62 was used. The particle-mesh Ewald (PME) algorithm with cutoff distance of 1 nm was used for the evaluation of the electrostatic interactions, whereas non-bonded interactions were parameterized through a spherically truncated 6–12 Lennard-Jones potential, with cutoff distance of 1 nm and standard Lorentz-Berthelot mixing rules. We adopted the SPC/E model for water, using a VDW cutoff of 1 nm and PME-based electrostatics, on accounts of a previous study,63 where it was shown that this combination rendered reliable results for systems interacting with Lennard-Jones pairwise potentials. This rigid-water model is known to provide transport and dielectric properties of water much closer to experimental findings compared to those of the water model which was originally optimized with the CHARMM potential (i.e. the TIP3P).64–66 Similar SPC-based water models combined with the CHARMM forcefield were found to provide comparable static/structural properties with the TIP3P/CHARMM combination (in agreement with our own tests), while improving significantly in the description of dynamic and dielectric properties.67–69The charge distribution of the diketopiperazine-based and the phospholipid molecules was assigned by the Gasteiger method.70 This method allows for the assignment of partial charges without dependence on the molecular conformation,71 while it has also been used for charge assignment of lipids and ligands in combination with the use of the CHARMM and the AMBER forcefields families, for their binding hosts.72,73 The time step for the integration of the equations of motion was 1 fs. Simulation runs were executed in the NPT statistical ensemble keeping constant pressure of 1 atm, using the Berendsen barostat,74 and constant temperature at 300 K using velocity rescaling thermostat.75 The simulation box size ranged between 11.60 and 11.97 nm. The initial geometry of the mRNA sequence was based on a Monte Carlo procedure76 (selected as the minimum energy configuration among 10![[thin space (1/6-em)]](https://www.rsc.org/images/entities/char_2009.gif) 000 generated), whereas the molecules used as complexation agents were uniformly distributed in the simulation box (see Fig. S1 in the ESI†). This starting configuration was preferred against the condensed monolayer or double-layer arrangement of the lipids, on one hand because both of the examined phospholipids were found to form micelle-like aggregates in water and in the absence of RNA under the examined conditions, and on the other hand to facilitate the comparison with the behavior of the diketopiperazine-core molecules which do not form layered phases.47,77 Although amphiphiles with two hydrocarbon chains per head group are expected to form extended bilayers78 or vesicles79 rather than spherical or ellipsoidal micelles in an aquatic environment, micellization is the first stage involved in the relevant self-assembly kinetics.80,81 In order for the association process to develop towards the formation of these morphologies, a much larger number of lipids than the one used here, would be required. Solvation in water followed by energy minimization in order to produce the initial configuration of the examined systems. Short equilibration runs of ∼30 ns were also performed prior to production runs, which extended to about 200 ns. The length of the trajectory after the systems have reached a steady state (i.e., after all kinetics related to the self-assembly of the lipids and their complexation with RNA have been completed), sufficed for a complete relaxation of the autocorrelation functions of the end-to-end distance of the RNA chain and of the radius of gyration of the complexation agents (see Fig. S2 in the ESI†).
000 generated), whereas the molecules used as complexation agents were uniformly distributed in the simulation box (see Fig. S1 in the ESI†). This starting configuration was preferred against the condensed monolayer or double-layer arrangement of the lipids, on one hand because both of the examined phospholipids were found to form micelle-like aggregates in water and in the absence of RNA under the examined conditions, and on the other hand to facilitate the comparison with the behavior of the diketopiperazine-core molecules which do not form layered phases.47,77 Although amphiphiles with two hydrocarbon chains per head group are expected to form extended bilayers78 or vesicles79 rather than spherical or ellipsoidal micelles in an aquatic environment, micellization is the first stage involved in the relevant self-assembly kinetics.80,81 In order for the association process to develop towards the formation of these morphologies, a much larger number of lipids than the one used here, would be required. Solvation in water followed by energy minimization in order to produce the initial configuration of the examined systems. Short equilibration runs of ∼30 ns were also performed prior to production runs, which extended to about 200 ns. The length of the trajectory after the systems have reached a steady state (i.e., after all kinetics related to the self-assembly of the lipids and their complexation with RNA have been completed), sufficed for a complete relaxation of the autocorrelation functions of the end-to-end distance of the RNA chain and of the radius of gyration of the complexation agents (see Fig. S2 in the ESI†).
Energetic calculations related to the estimation of the enthalpy of association were performed using the Molecular Mechanics/Poisson Boltzmann Surface Area method (MM/PBSA) method, as implemented in the g_mmpbsa GROMACS utility tool,82 which uses the APBS solver83 for computing the polar part of the solvation free-energy. The parameters used were based on recent relevant works.84,85 Namely, the dielectric constants of the solute and solvent were set to 2 and 80 respectively. The surface tension parameter for the surface area calculations was set to 0.0226778 kJ mol−1 Å−2, the offset to 3.84928 kJ mol−1 and the solvent probe radius to 1.4 Å. The entropic contributions were estimated through an in-home script, based on the procedure described by Duan et al.86
3. Results
3.1 Structural properties
Elucidation of the structural organization of the molecules involved, is highly desired for a rational design of nanoparticle-based vehicles for nucleic-acid therapeutics.87 Therefore, the present section provides information regarding the morphology of the self-assembled structures (formed either by the complexation agents, or by the complexation agents and RNA). To this end, we have examined the relative spatial arrangement of the complexation agents and their location with respect to mRNA. In addition, we have explored important morphological characteristics of the formed clusters, such as their average size and composition, as well as their charge distribution profiles.All the results concerning static/structural properties, originate from the analysis of the part of the trajectory in which the systems have reached a steady conformational state, as it will be further discussed in Section 3.3.
The self-arrangement of the complexation agents as well as their association with mRNA can be examined through the calculation of pair radial distribution functions (rdf). The pair radial distribution function is proportional to the conditional probability to find particles at a specific distance (r) from one to another.90 Since mRNA chain is rather elongated, rdfs have been calculated between the centers of mass of the nucleotides and the centers of mass of the respective lipid molecules and then averaged.
Fig. 2a shows rdfs between the complexation agents in each system (note that all diketopiperazine-core molecules were included in this analysis, irrespective of their charge). Spectral characteristics such as the peak location, its sharpness, its intensity as well as the width of each curve, denote structural attributes associated with the relative arrangement of the molecules and the extent of spatial correlations between them (for molecules that tend to self-assemble as the ones examined here, the sharper the peak and the narrower the distribution of the particle separations, the lower the spatial extent of the self-assembled structures). Amongst all the molecules, the highest peak is exhibited by DM, at a characteristic distance of about 1 nm. The curves describing the two phospholipids are immediately lower in intensity, with a most probable distance somewhat shorter than 1 nm. The other two ionizable lipids (i.e., DML and OfDegLin) show peaks with lower intensities and wider distributions. This order reflects the self-assembly propensity of the molecules, which depends on various factors, such as their average size, their structural details, their degree of hydrophobicity and their protonation state. In particular, the width of the peaks (being wider for DML and OfDegLin), already provides useful information regarding the spatial extent of the aggregates formed.
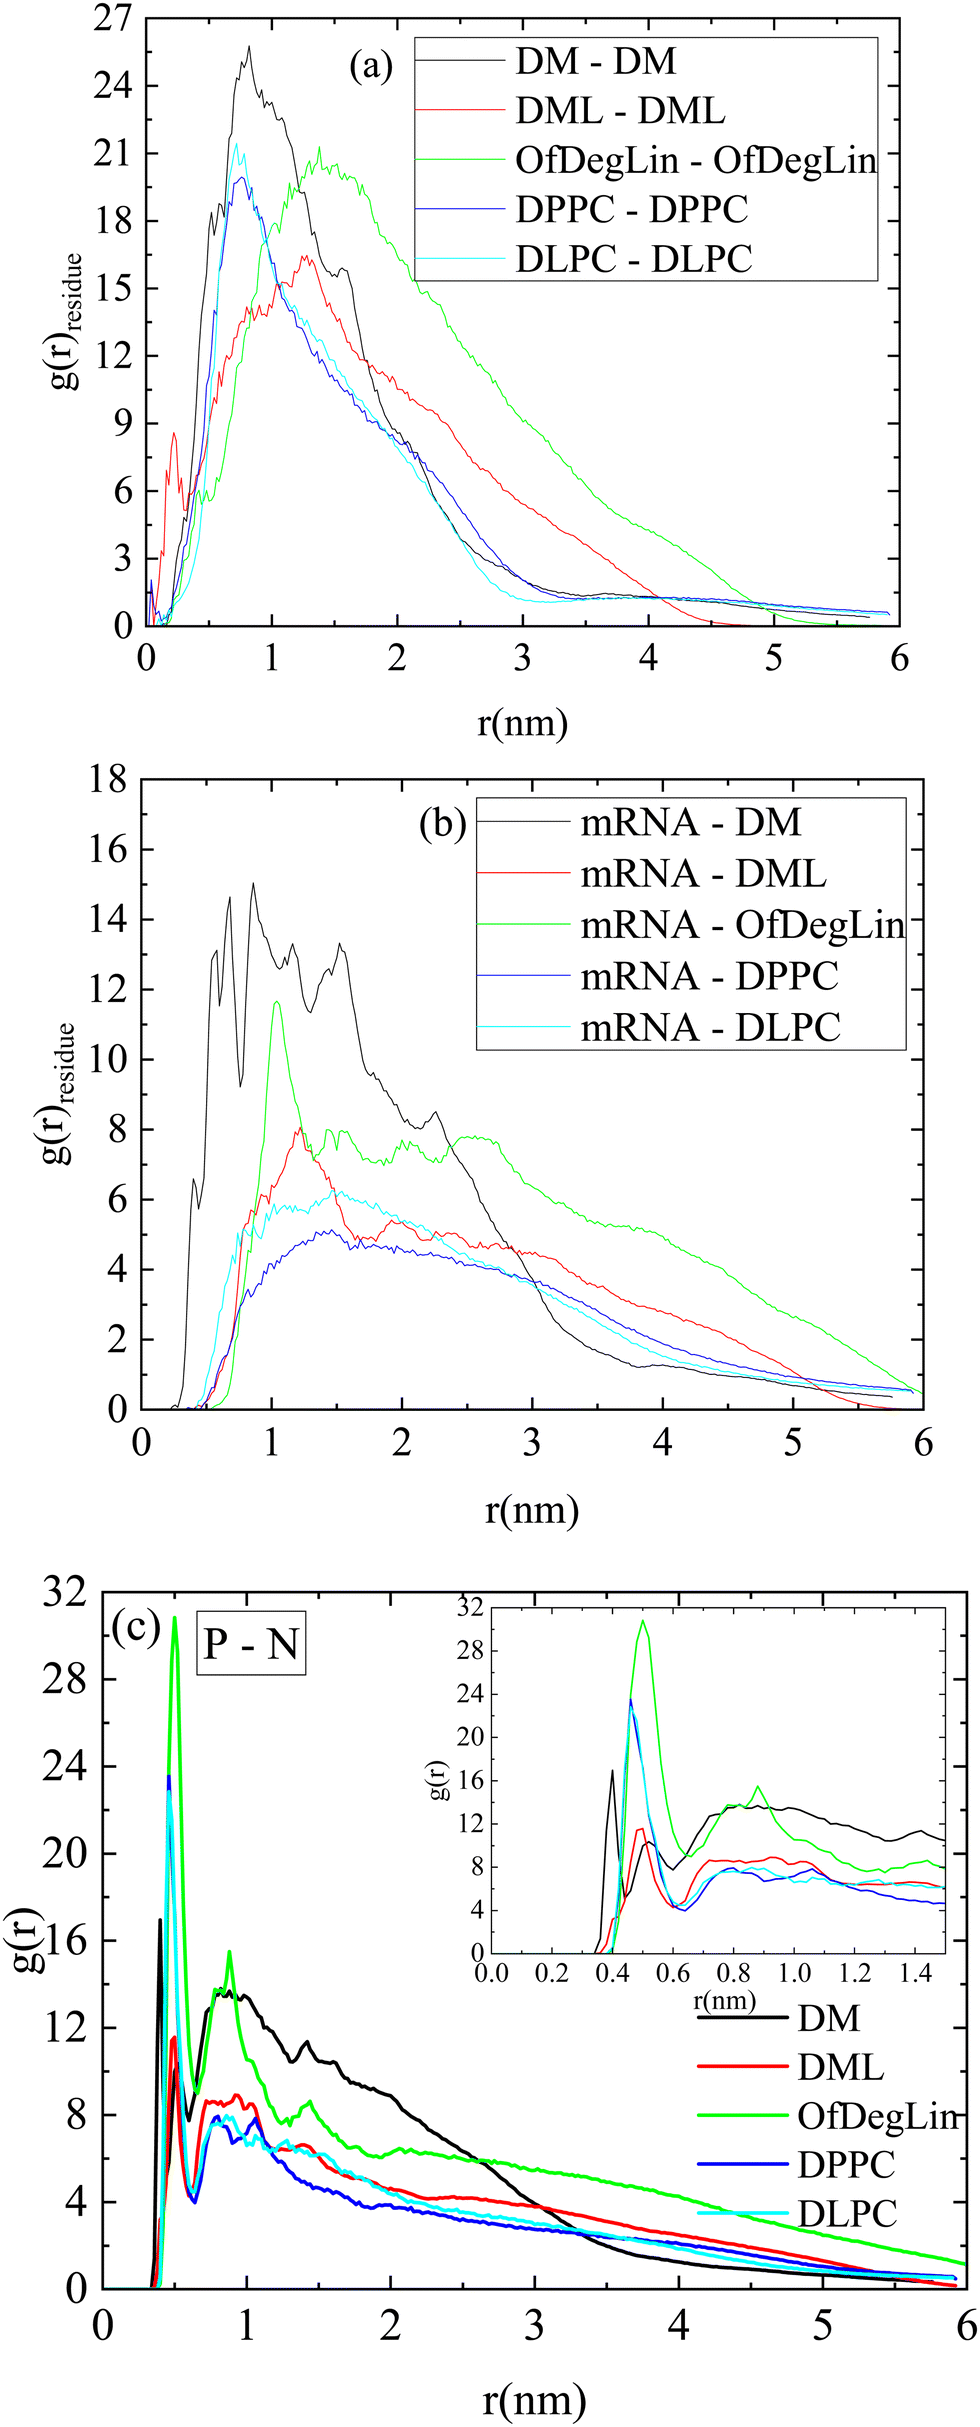 | ||
| Fig. 2 Pair radial distribution function between (a) the centers of mass of the complexation agents (b) the centers of mass of the mRNA bases and those of the complexation agents and (c) the phosphorus atoms of the RNA nucleotides and the nitrogen atoms of the complexation agents. The inset is a zoomed-in view of the main plot. | ||
The corresponding rdfs between lipids and mRNA are presented in Fig. 2b. Visual inspection of the intensity of the peaks at short separations implies that amongst the examined complexation agents, the most favorable interactions are those between DM molecules and mRNA. The distributions describing DML and OfDegLin (which bear 2 and 4 linoleic ethyl ester end-groups respectively) exhibit a low intensity peak at distances between 1 nm and 1.5 nm, while those of the amphoteric lipids (DPPC and DLPC) exhibit a rather smooth maximum at the same range of separations. The higher intensity of the peaks characterizing the spectra of Fig. 2a when compared to those in Fig. 2b, indicate more favorable interactions between the complexation agents than between them and mRNA. The tendency of these molecules to self-assemble, is consistent with the formation of clusters, but at the same time the behavior observed in their rdfs with mRNA, implies complexation between these molecules and the nucleic acid sequence, as well.
Fig. 2c shows the atomic pair rdfs between the nitrogen atoms of the complexation agents (N) and the phosphorous atoms (P) of the RNA bases. It is observed that in the presence of the hydrophobic tails (i.e., for all agents except DM), the closest separation between the N (lipids) and P (RNA) atoms is larger compared to that of the DM (see inset), while for larger separations (i.e., between 1–2.5 nm), the degree of “shielding” of the nitrogen atoms that do not interact directly with RNA, is higher for the agents bearing hydrophobic tails, as implied by the lower amplitude of the respective rdfs.
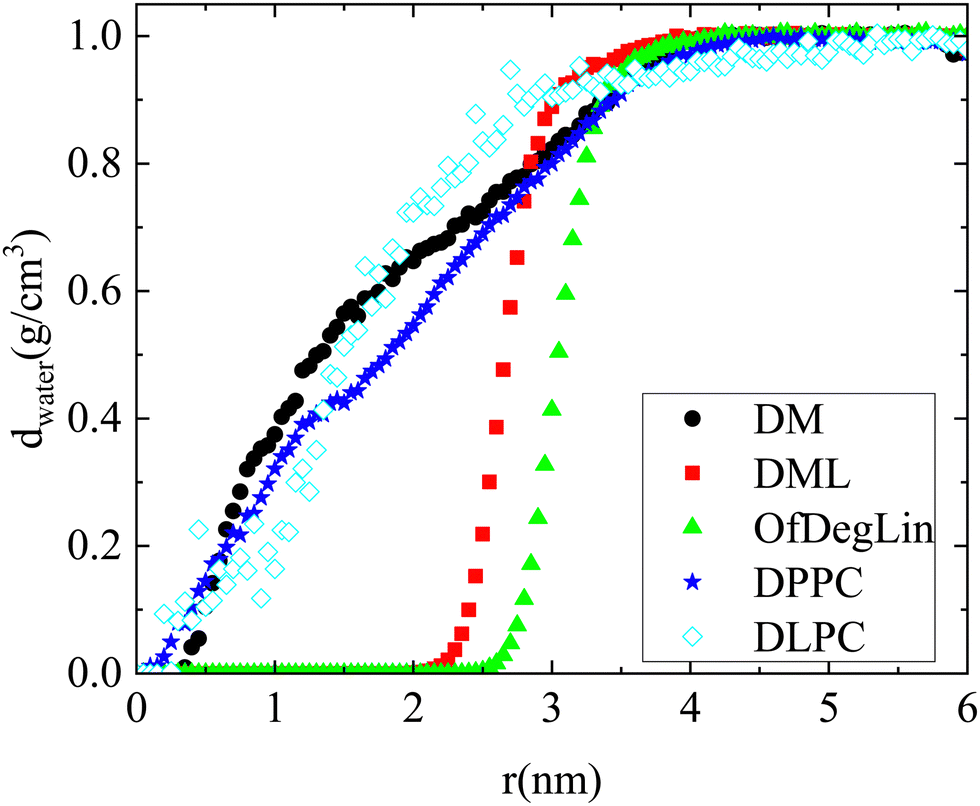
The rdfs between water molecules and lipids as well as between water molecules and nucleotides, provide information regarding the hydrophobicity of both components. The corresponding curves for all systems are presented in Fig. 3a. The presence of water molecules near either mRNA or lipid molecules is of low probability at short distances (i.e., the rdf curves attain values considerably lower than 1). All the complexation agents are found to be more hydrophobic compared to the nucleotides, which implies that their self-assembly precedes their complexation with mRNA. Since rdfs are calculated on the part of the trajectory where the association between mRNA and lipid has already been completed, differences among the various mRNA–water curves are most probably a result of the structural differences between the formed complexes, which allow a different degree of exposure of mRNA to the aqueous environment. Fig. 3b compares the rdfs between the complexation agents and water molecules. From the group of the cationic agents, DML and OfDegLin appear as more hydrophobic compared to the phospholipids; this should essentially be ascribed to the presence of the hydrophobic linoleic arms. The absence of these end-groups in DM, leads to a rather similar behavior with that observed in DLPC and DPPC.
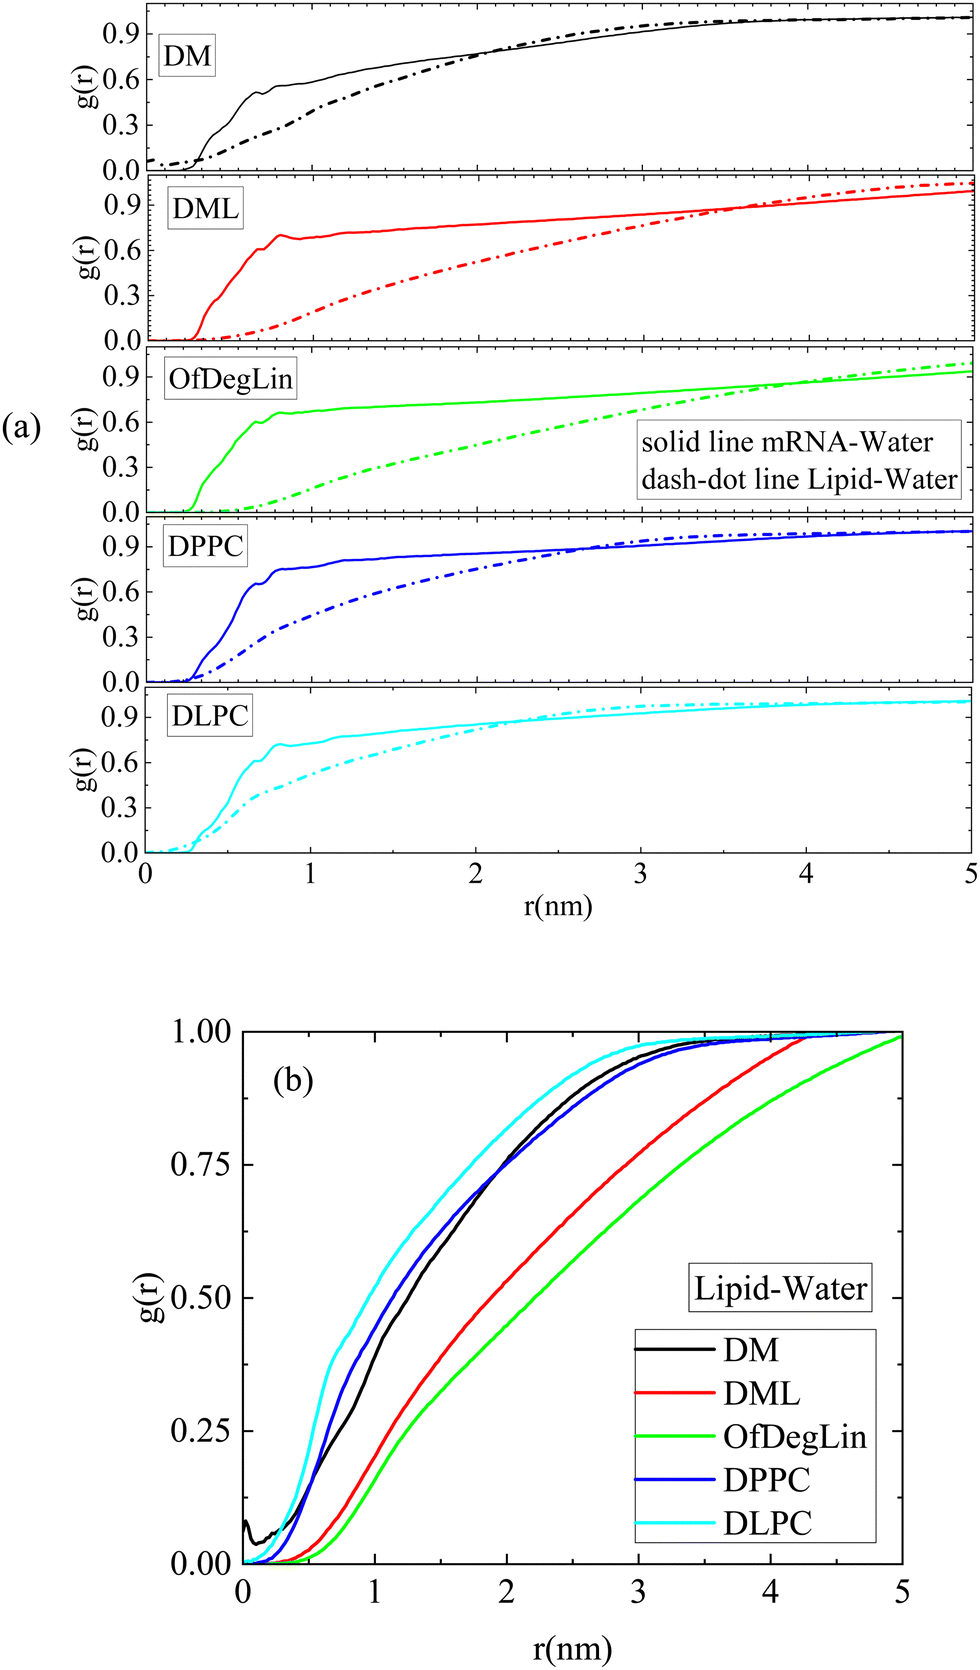 | ||
| Fig. 3 Pair radial distribution function between the centers of mass of (a) lipids and water molecules and between mRNA nucleotides and water molecules and (b) between the centers of mass of the lipids and the water molecules. | ||
Characteristic snapshots for the examined systems are presented in Fig. 4a–e, providing a visual impression of the preferable arrangement of the different molecules at stabilized conditions (i.e., any kinetics of self-assembly of the lipids and/or their complexation with mRNA has already been completed). In all cases, clusters of the complexation agents have been formed. The morphological features of the clusters and the manner that mRNA is complexed with these clusters differ depending on the nature of the complexation agent. A single, almost spherical cluster is formed by the ionizable molecules which bear linoleic ethyl ester end-groups, i.e., OfDegLin and DML and, (Fig. 3a and b). mRNA appears to be wrapped around this cluster. In the DM-based system, the mRNA sequence is interdigitated among the formed aggregate (note that for the purposes of the analysis that will follow, this aggregate will be considered as a single cluster). In the systems comprised of the amphoteric phospholipid molecules, rather asymmetric and smaller in size clusters are formed, with the mRNA chain being partially complexed with them. This clustering/complexation behavior emerging from the snapshots corroborates the qualitative picture as described in Fig. 2 and 3 earlier.
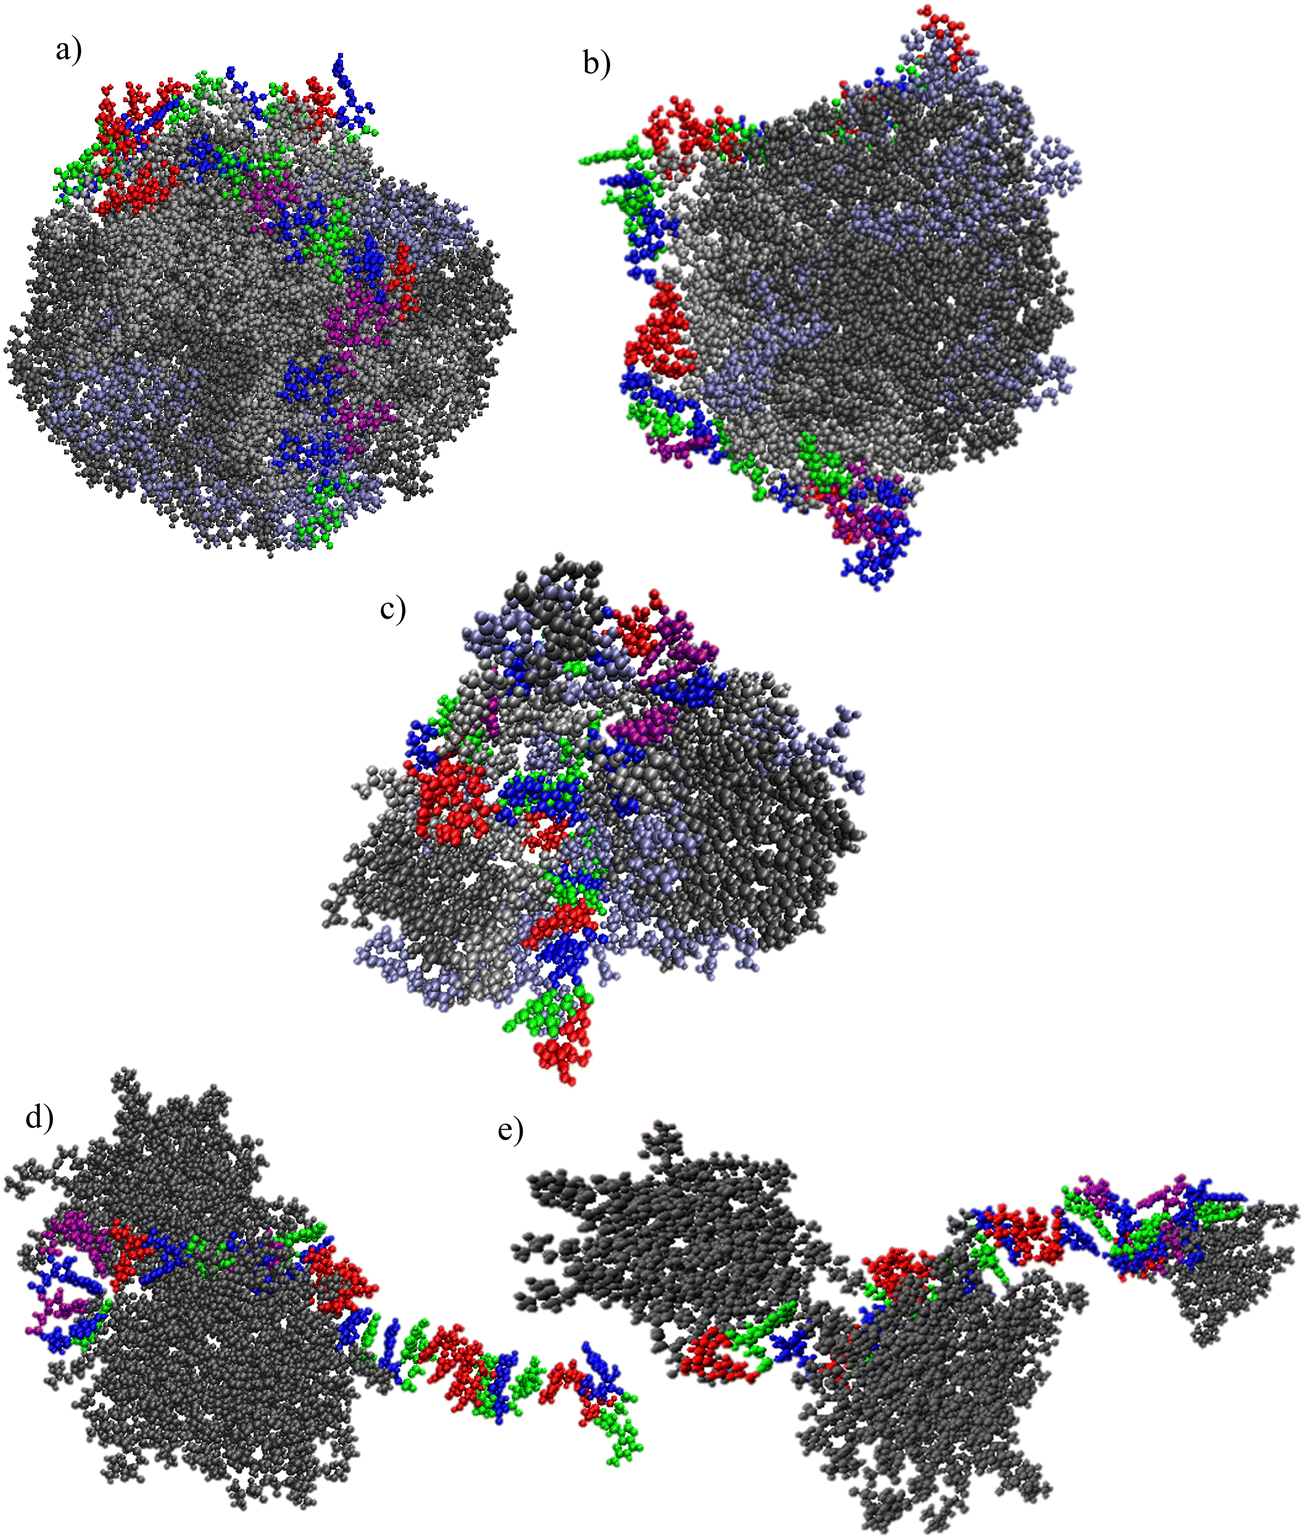 | ||
| Fig. 4 Clusters of (a) OfDegLin, (b) DML; (c) DM; (d) DPPC; (e) DLPC molecules complexed with the oligonucleotide mRNA. Water molecules are omitted for clarity. In (a)–(c), Lipids0 are represented as gray, Lipids1 in iceblue and Lipids2 in silver. In (d) and (e), lipid atoms are represented in gray. Atoms with different than the aforementioned colors, represent the mRNA bases. | ||
To better characterize the different self-assembled lipid structures and to gain more information regarding their complexation propensity with mRNA, we can quantify pertinent morphological features of the formed clusters and elaborate more on the energetics of the association with mRNA and on the driving forces which lead to the observed associative behavior.
Following this method, clusters of lipids are classified according to their size, in terms of the number of lipids (s) that they contain. A histogram of the number of the formed clusters as a function of the percentage of the lipid molecules involved in their formation is presented in Fig. 5. Values equal to 1 in the x-axis indicate the formation of a single cluster from all molecules. This is on average the case for the ionizable molecules, DM, DML and OfDegLin. Some off-cluster molecules can occasionally be recorded in the DML case, which indicates instances of a dynamic attaching/detaching of lipids to the formed clusters (at least to the degree that the cluster-detection algorithm used, can identify these cases as different clusters). For DPPC and DLPC there is a wider distribution of cluster sizes (including also the single cluster case, mostly for the DPPC lipid). The smallest aggregates contain 4 and 8 molecules for the DPPC and DLPC lipids respectively, while isolated molecules are not detected in the examined part of the trajectory.
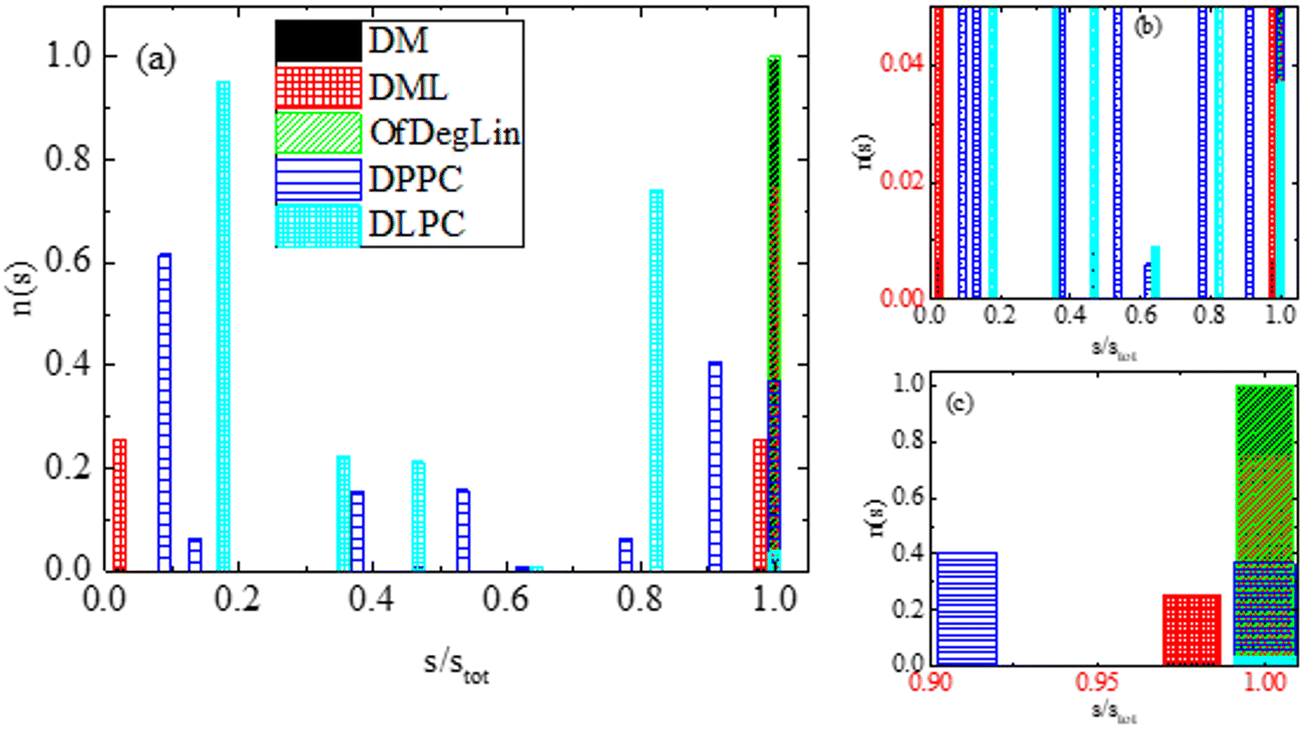 | ||
| Fig. 5 (a) Average number of clusters, n(s) formed by the complexation agents, as a function of the percentage (s/stot) of the molecules each one contains, where stot is the total number of lipid molecules in the system. (b) A zoomed-in part of the histogram in the y-axis. (c) A zoomed-in part of the histogram in the x-axis. This analysis was performed at the part of the trajectory where the self-assembly of the lipid-based agents and their association with RNA, had been completed. | ||
Furthermore, an estimation of the dimensions of a cluster, can be performed by calculating the average radius of gyration 〈Rg〉, defined by: 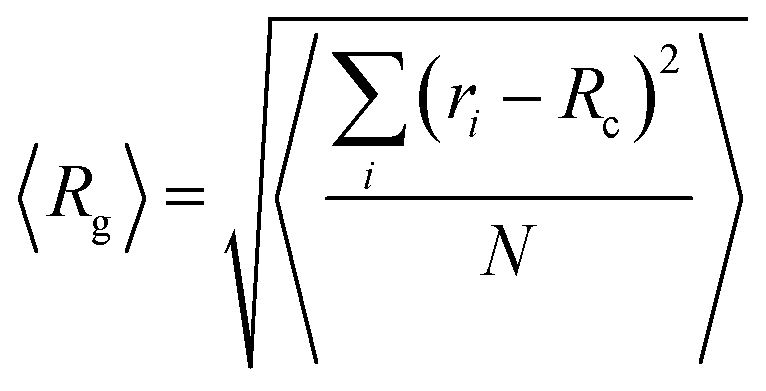 , where ri is the position of the ith atom belonging to a molecule within the cluster, RC is the position of the geometric center of the cluster and N is the total number of atoms within the cluster. This calculation has been performed for the larger in size cluster. These results, together with the radii of gyration of the individual molecules and the end-to-end distance of mRNA are presented in Table 2.
| R g (nm) | RNA Ree (nm) | ||||
|---|---|---|---|---|---|
| System | Lipids0 | Lipids1 | Lipids2 | Cluster | |
| DM | 0.58 ± 0.01 | 0.61 ± 0.01 | 0.68 ± 0.01 | 2.51 ± 0.12 | 6.23 ± 0.40 |
| DML | 0.82 ± 0.02 | 0.79 ± 0.02 | 0.84 ± 0.01 | 2.10 ± 0.07 | 6.56 ± 0.43 |
| OfDegLin | 0.97 ± 0.03 | 0.88 ± 0.04 | 0.87 ± 0.02 | 2.39 ± 0.16 | 6.95 ± 0.41 |
| DPPC | 0.74 ± 0.01 | — | — | 2.55 ± 0.20 | 7.18 ± 0.76 |
| DLPC | 0.63 ± 0.01 | — | — | 3.18 ± 0.30 | 7.78 ± 0.48 |
The size of the largest clusters in the diketopiperazine-based agents (i.e. DM, DML and OfDegLin,) which assume approximately a spherical geometry, is rather similar, ranging between 2.1 and 2.5 nm. The average size of the largest DLPC and DPPC formed clusters, although it appears to be comparable to that formed by the ionizable agents, it has been calculated with a larger uncertainty due to the larger deviation of its shape from the spherical geometry. Nevertheless, their average size and their aggregation number is consistent with previous estimations based on experimental data93 and theoretical predictions.94
Examination of the degree of orientation between the complexation agents within the formed clusters (see Fig. S3 in the ESI†), showed that there is no long range order (e.g., a parallel arrangement) between them. The somewhat increased mRNA end-to-end distances, as implied by the average values, in the presence of the amphoteric molecules, could be correlated to the weaker interactions between these lipids and mRNA. In all systems, the average dimensions of the RNA fragment are found to be smaller by about 20% compared to its dimensions in a water/RNA system without the presence of the lipids (see Fig. S4 in the ESI†).
Further characterization of the formed clusters can be provided by additional analysis which involves the charge distribution with respect to the geometric center of the cluster. Charge profiles, calculated for single clusters, are presented in Fig. 6 for all systems. Differences can be noted between the two classes of lipids (phospholipids and ionizable molecules) with respect to the distribution of their charge. Phospholipids are overall electrically neutral, thus small fluctuations in charge values are present throughout the cluster. Of interest is the case of the cationic lipids, where it appears that the presence (or absence) of the hydrophobic end groups affects the overall charge distribution. For the DML and the OfDeglin cases, the excess charge is located close to the cluster's periphery. This is not however the case for the DM agents. For the DM cluster, the distribution is broader and with more intense variations, consistent with a looser (and thus more deformable) structure. Examination of the partial charge profiles arising from the different types of lipids (i.e., those bearing different charge), as shown in Fig. S5 in the ESI,† reveals that in the case of the DM molecules, the doubly charged agents (denoted as Lipid2) are located closer to the center of the cluster. These variations in the charge profiles, appear to correlate strongly with the location of the mRNA chain with respect to the clusters geometric center (see Fig. 4). In the case of the OfDeglin and DML agents, where RNA is wrapped around the clusters exterior, the excess charge is preferably located close to the cluster's surface. In the case of DM, where RNA is practically interdigitated within the cluster, the excess charge is distributed in a manner which favors a closer interaction with the oppositely charged groups of RNA. This behavior emphasizes the role of the electrostatic interactions in the lipid–RNA association.
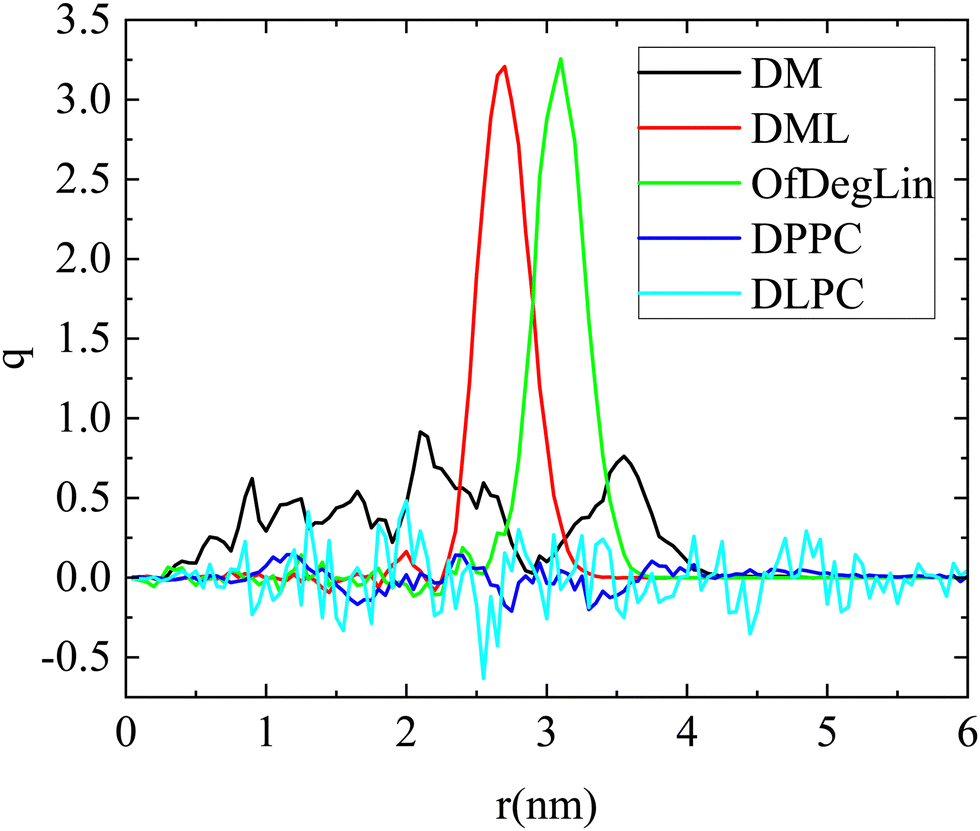 | ||
| Fig. 6 Radial charge profiles of the lipid clusters as a function of the distance from the geometric center of the corresponding aggregate. The charge is expressed in electron charge units. | ||
The packing of molecules that form a cluster is explored through the calculation of the respective density profiles. Mass density profiles of clusters, for configurations where a single cluster is formed from the lipid molecules, are presented in Fig. 7. Both diketopiperazine-based ionizable lipids bearing the linoleic ethyl ester end-groups (i.e., DML and OfDegLin), form clusters with an almost uniform profile throughout their volume, indicating a rather compact interior. In the third molecule of the same group, DM, the density is very low close to the center of mass of the cluster, while the overall density is lower compared to that of the DLM and the OfDegLin analogues. This observation is consistent with the fact that mRNA appears to be incorporated within the formed cluster (see Fig. 3a and 4c), affecting thus the density profile of the DM molecules. The rest of the density profile shows a peak followed by a gradual drop towards the periphery of the cluster. This profile indicates a rather loose internal structure for the DM clusters. For the phosphatidylcholine lipids, dense-core and loose-periphery density profiles are observed, at the instances where they form a large cluster (it should be noted that since such instances are not frequent, statistics in these systems is rather poor). A comparison of the density profile of RNA with that of the respective complexed agent in each system, is shown in Fig. S6 in the ESI.† In line also with the snapshots shown in Fig. 4, RNA appears to be located preferably at the exterior of the cluster in the more hydrophobic DML and OfDeglin lipids, while its density profile overlaps to a large extent with that of the DM, the DPPC and the DLPC lipids.
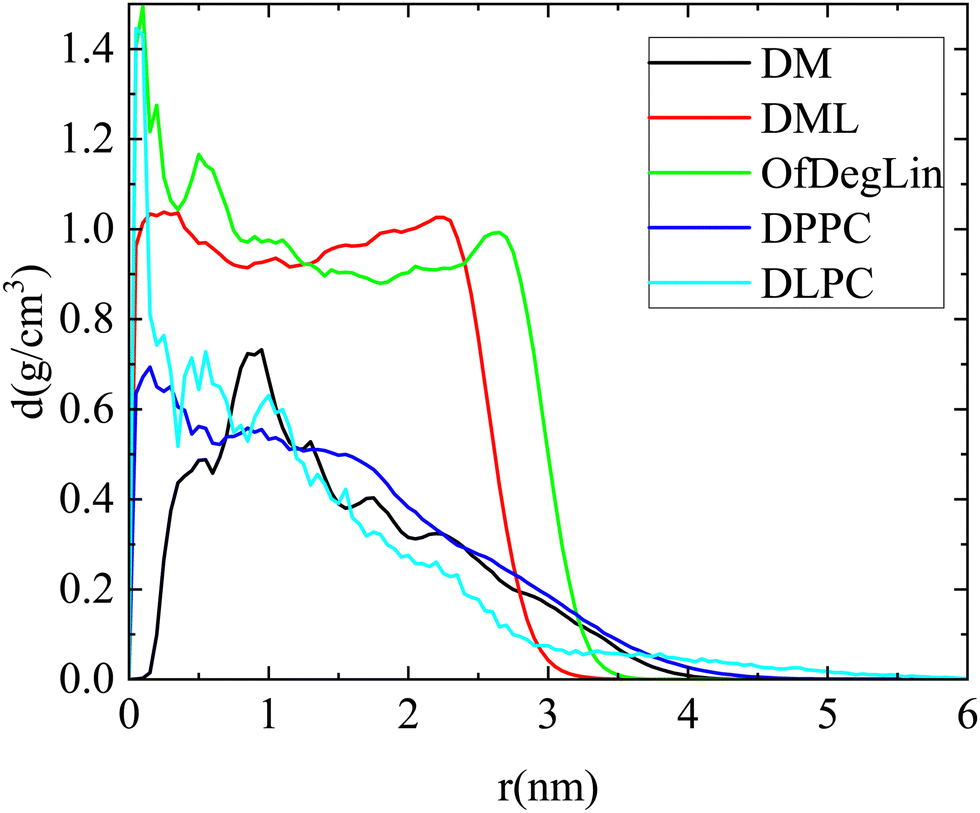 | ||
| Fig. 7 Mass density profiles of clusters formed by the complexation agents (single cluster formation) in the examined systems. Distance 0 corresponds to the geometric center of the cluster. | ||
Examination of the partial density profiles of the ionizable agents with respect to the charge they bear (Fig. S7 in the ESI†), shows that the mass density of the electrically neutral lipids (Lipids0) of the DML and the OfdegLin agents, peaks close to the geometric center of the cluster while for lipids bearing an excess charge (Lipids1 and Lipids2) peaks closer to the clusters periphery. For the DM agent, there is a lower density at the cluster's geometric center, which should be attributed to the location of the RNA fragment with respect to the this center (see Fig. 4c).
In all cases, the mass distribution of the agents bearing different charge, is closely correlated with the location of RNA with respect to the geometric center of the respective cluster. In addition, for those lipids bearing long hydrophobic parts (i.e., for all but the DM complexation agents), the density distribution of these tails was found to depend on whether the lipids are ionized (i.e. DML, OfDeglin) or electrically neutral (i.e., DLPC and DPPC), as shown in Fig. S8 in the ESI.† Namely, these tails were found to be preferably located close to the cluster's geometric center for the zwitterionic lipids, whereas for the ionizable complexation agents, their mass is almost uniformly distributed within the cluster's volume.
 | ||
| Fig. 8 Water density as a function of the distance from the geometric center of the maximum in size cluster formed. | ||
3.2 Quantification of the interactions between the complexation agents and mRNA
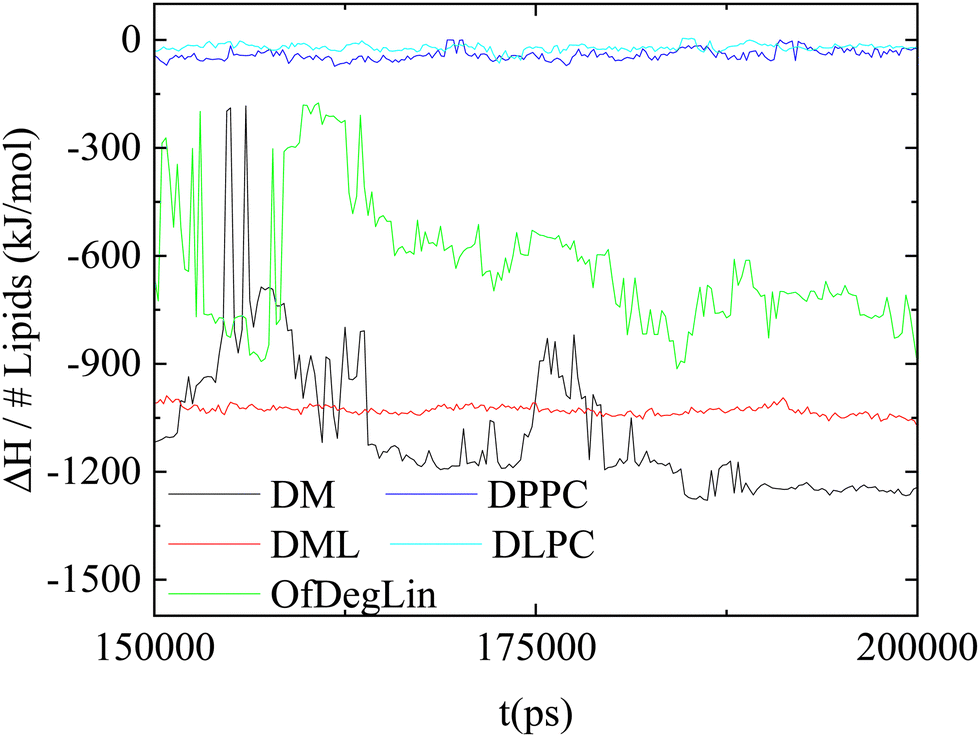
In this section, we provide information regarding the relative contribution of the different kinds of interactions in the lipids/RNA association phenomena.Fig. 9 maps the variation of the enthalpic part (ΔH) of the association free energy between mRNA and the complexation agents, as a function of time. The lowest energy indicates the energetically most stable association (i.e., stronger attraction). Comparing the behavior of the two groups of the complexation agents, it appears that those based on the ionizable diketopiperazine core associate more favorably with mRNA than those based on the amphoteric phospholipids. Among the former, larger fluctuations are observed in the system with the four mehtyl end-groups (DM), indicating a conformationally more volatile structure of the formed complex (since such a structure would involve frequent changes regarding the distance between the mRNA bases and the DM atoms). Combining the information regarding the average value of the association enthalpy and the degree of its fluctuation with time, it appears that DML molecules form the more stable complexes with mRNA.
 | ||
| Fig. 9 Temporal variation of the association enthalpy per lipid molecule, between the complexation agents and mRNA. | ||
To further elaborate on the origin of the enthalpic affinity between the complexation agents and mRNA, we examined separately the different energetic components involved. These are presented in Table 3, together with the estimated entropic contributions in the association free energy. A cursory glance in the values listed, shows that the entropic part increases the free energy of association (due to the loss of configurational entropy of the molecules upon association), but its contribution is rather small compared to the enthalpic part. In the latter, both, van der Waals and electrostatic interactions act favorably towards the association, but the higher contribution arises from the electrostatic part. Furthermore, the ionizable molecules of the first group (i.e., DM, DML and OfDegLin), exhibit considerably higher energetic affinity with mRNA, when compared to the amphoteric phosphatidylcholine lipids (i.e., DPPC and DLPC). Given the key role of the electrostatic interactions in the association, it appears that the overall electrical neutrality of the DPPC and DLPC lipids (and thus the weak electrostatic interactions with mRNA) diminishes the energetic affinity between the latter and the charged mRNA sequence. Between the diketopiperazine-core molecules, DM and DML show similar (within the error margins), but higher binding affinities compared to the fully capped with ethyl ester linoleic end groups, OfDegLin lipids. The observed difference arises mainly from the contribution of the electrostatic interactions. Given that on average all of the diketopiperazine-core molecules bear essentially the same effective charge, it follows that the presence of a larger number of the linoleic end-groups (probably via steric interactions which affect the ability of opposite charges to approach at shorter distances) lead to less favorable electrostatic interactions with mRNA.
| System | 〈EVdW〉 | 〈Eelec〉 | 〈Etotal〉 | −TΔS |
|---|---|---|---|---|
| DM | −1588.6 ± 370 | −48414.6 ± 8511 | −50003.1 ± 8874 | 431.2 ± 53.9 |
| DML | −1196.5 ± 71 | −46153.6 ± 561 | −47350.1 ± 595 | 564.5 ± 243.3 |
| OfDegLin | −682.1 ± 290 | −27765.5 ± 7872 | −28447.6 ± 8154 | 405.7 ± 44.1 |
| DPPC | −323.4 ± 130 | −1540.6 ± 604 | −1864.0 ± 675 | 500.3 ± 104.5 |
| DLPC | −226.3 ± 63 | −713.3 ± 394 | −939.6 ± 440 | 399.8 ± 22.9 |
| System | H-bonds between complexation agents | H-bonds between mRNA and the complexation agents |
|---|---|---|
| DM | 0.246 ± 0.06 | 0.244 ± 0.06 |
| DML | 0.183 ± 0.06 | 0.116 ± 0.04 |
| OfDegLin | 0.09 ± 0.04 | 0.053 ± 0.03 |
| DPPC | — | 0.152 ± 0.06 |
| DLPC | — | 0.155 ± 0.05 |
For the phosphatidycholine lipids at a non-layer (i.e., not in a monolayer or bilayer) phase, as it is in our case, hydrogen bonding between the lipids is very scarce. The lower degree of lipid–lipid hydrogen bonding, combined with their lower hydrophobicity (Fig. 3b) which favors a larger degree of water interpenetration, contributes to the formation of less stable clusters. Practically, this is also the case for the fully-capped with linoleic end-groups, OfDegLin molecule, where the detected number of hydrogen bonds between the lipids, lies marginally above the statistical error. A differentiation, however, is observed in the propensity for hydrogen bonding between the two remaining ionizable agents, i.e., DM and DML. The former, bearing no linoleic end-groups, appears to form hydrogen bonds more frequently compared to the latter. This should be attributed to the fact that in DM molecules, the hydrogen-bonding-capable nitrogen atoms are more exposed and thus more likely to participate in hydrogen bonding. The same reasoning can also account for the different propensity of the DM, DML and OfDegLin molecules to form hydrogen-bonds with mRNA. The ethyl ester linoleic groups, in their arrangement to form a cluster, may partially shield the diketopiperazine core of the DML and OfDegLin molecules, keeping it at longer distances from the mRNA nucleotides and thus reducing the probability for lipid-mRNA hydrogen-bond formation (see also the respective density profiles of the hydrophobic tails in Fig. S4 (ESI†) and the amplitude of the longer-separation peaks in the P–N rdfs in Fig. 2c). In the DPPC and DLPC systems a similar level of hydrogen bonding is observed between the lipids and mRNA, which is somewhat higher than that observed in the DML and OfDegLin-based systems. The latter observation is consistent with the fact that the DLPC and DPPC lipids, form on average smaller in size clusters (see Fig. 4), thus allowing a larger percentage of these lipids to access the mRNA hydrogen-bonding-capable sites.
3.3 Kinetics of association/dynamics
In this section we address issues regarding the timescales relevant to the association kinetics and the diffusive behavior of the systems’ constituents.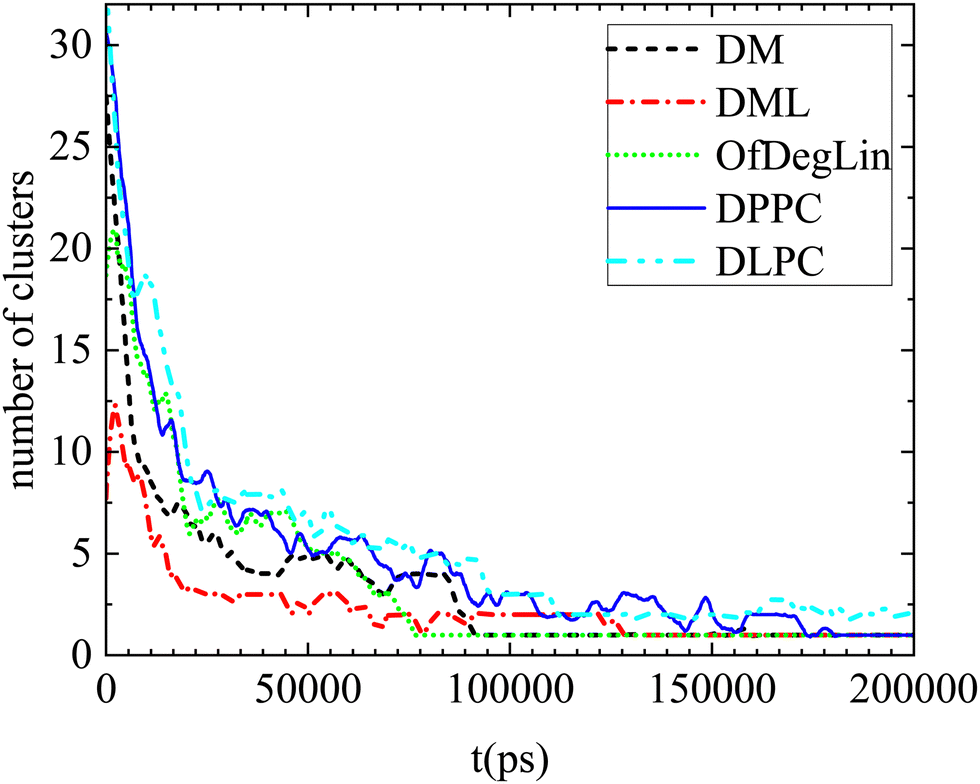 | ||
| Fig. 10 Number of clusters formed by the complexation agents as a function of time, in the examined systems. Smoothing of the data has been performed for better visualization. | ||
Apparently, the evolution of the clustering process in the presence of mRNA differs depending on the complexation agent. This procedure is expected to be affected by several competing factors, such as the hydrophobicity of each agent, its tendency to form hydrogen bonds, its size and its propensity to aggregate close to mRNA. Focusing on the first group of molecules based on the diketopiperazine core, DM is smaller in size and thus easier to diffuse, but less hydrophobic than DML and OfDegLin since it does not bear the linoleic end-groups. In addition, hydrogen bonding is more frequent among the DM molecules (see Table 4). On the other hand, DML and OfDegLin, are more hydrophobic than DM due to their end-groups but larger in size (see Table 2) and with a lower probability of forming hydrogen bonds between their molecules. These competing factors seem to result in faster clustering kinetics towards the equilibrium size in the DML and OfDegLin molecules (they reach equilibrium at a timescale close to 50 ns), indicating that the degree of hydrophobicity plays the most significant role in this process. The lower hydrophobicity of DM, DPPC and DLPC lipids, results in slower clustering kinetics, reaching stabilization at a timescale somewhat longer than 100 ns.
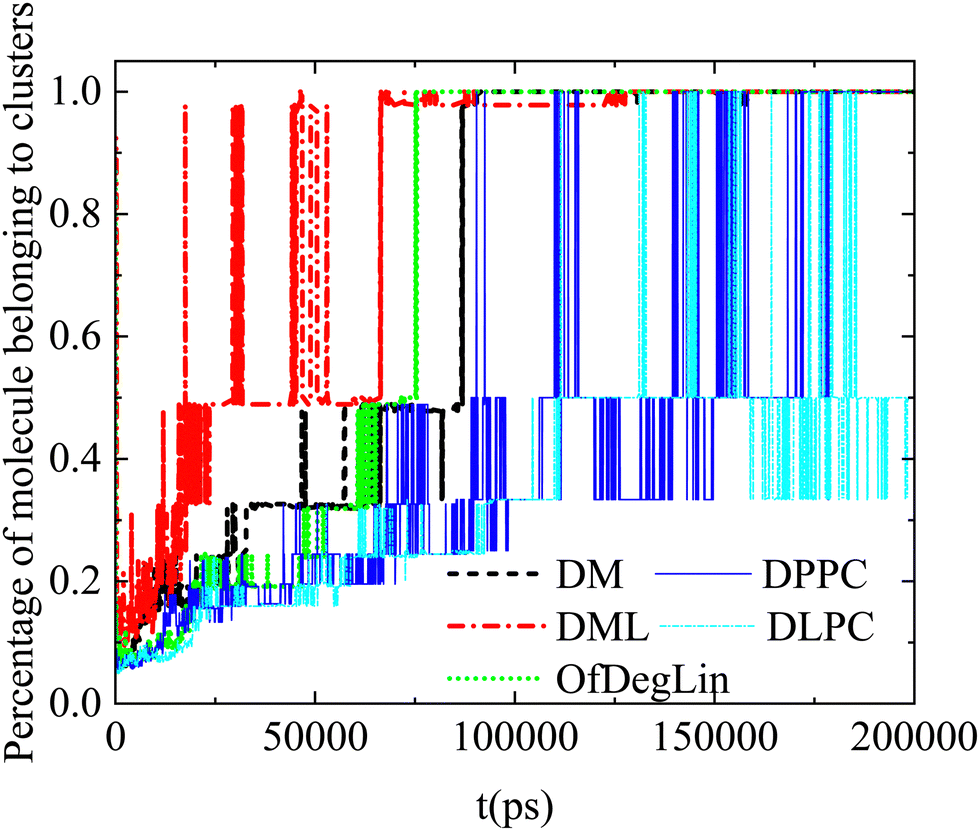
Complementary information regarding the kinetics of cluster formation is provided in Fig. 11, where the percentage of complexation agents belonging to clusters, is presented as a function of time. In the case of the ionizable DM, DML and OfDegLin molecules, the single cluster state remains stable at the last part of the trajectory. This state is reached somewhat earlier for the DML and OfDegLin clusters, i.e., at a timescale close to 50 ns and for the DM clusters at a timescale close to 100 ns. In contrast, the fluctuating values for the DLPC- and DPPC-based clusters, even at the last part of the trajectory, imply a dynamic equilibrium between the formation and the dissociation of a single cluster, attesting to the unstable nature of these aggregations.
 | ||
| Fig. 11 Percentage of the molecules belonging to clusters as a function of time (starting from an out-of-equilibrium state). | ||
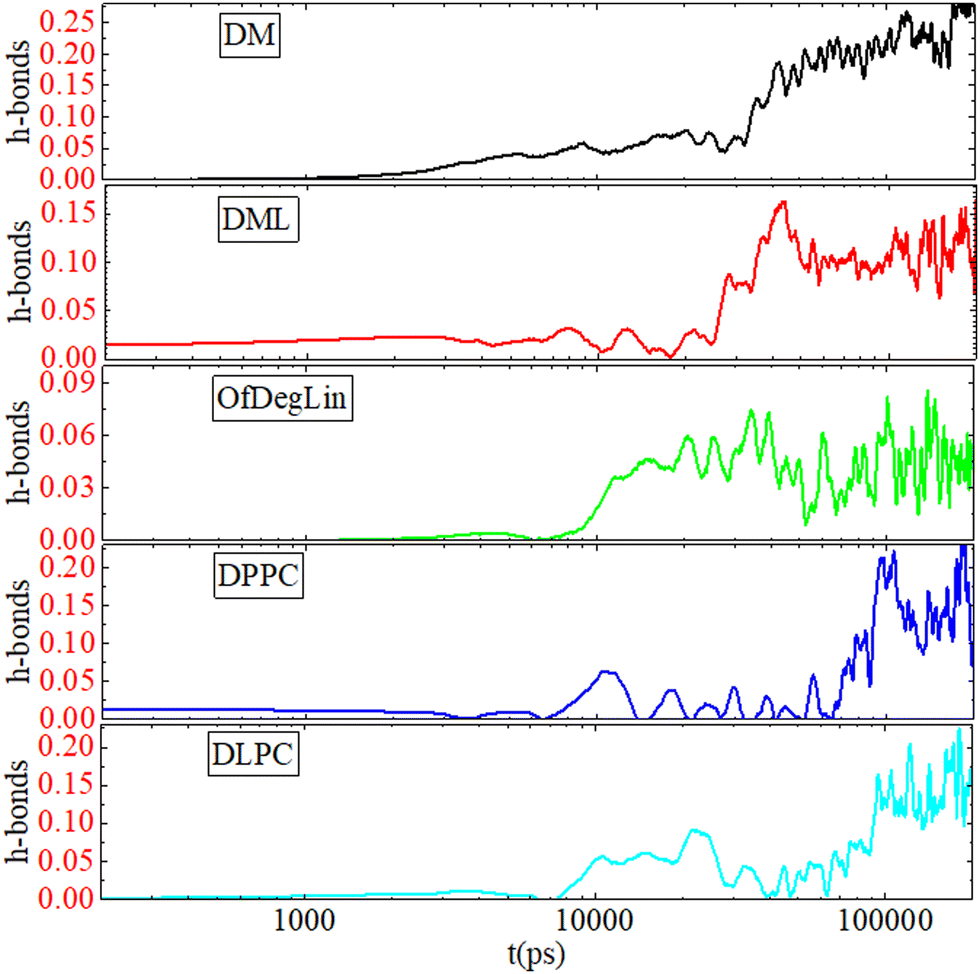 | ||
| Fig. 12 Average number of hydrogen bonds per lipid molecule, between the complexation agents and mRNA, as a function of time. Smoothing of data has been performed for better visualization. | ||
To demonstrate the different degrees of confinement experienced by the various lipids, we have calculated the distinct part of the Van Hove correlation functions, Gd(r, t), given by the expression  . In this expression δ represents the Dirac's function, while ri(t) is the position vector of the ith particle at time t (here each lipid is considered as a particle represented by its center of mass). This function is proportional to the probability that a particle i is at distance r from the origin at time t, provided that a different particle j was located at the origin (r = 0) at t = 0. The distinct Van Hove function probes collective dynamics arising from the evolution of the local environment (i.e., of the relative location of neighbors) around a molecule. This information is of special interest, because of its relationship with the dynamic rearrangements of the lipid molecules within the formed clusters.
At t = 0 (i.e., at a time which is taken as the time origin), Gd(r, 0) = ρg(r), where ρ is the number density of the probed particles and g(r) corresponds to the rdf of the centers of mass of each particle. Since the first peak of the rdf denotes the most probable distance of the first neighbors, its amplitude is proportional to the probability of finding close neighbors at the separation corresponding to that peak's location. If we take the peak's height as a measure of the coherence of the local environment, the rate of change of its height (i.e., the rate at which the local arrangement of neighboring molecules loses its structural coherence with respect to an initial configuration), is indicative of the time scale characterizing the rearrangement of the local environment.
The analysis has been performed in the part of the trajectory where the kinetics of the lipids’ self-assembly and of their association with RNA, has been completed. Fig. S10a–e (ESI†) show such correlation functions. The curves shown for each lipid, correspond to timescales at which the first-neighbor peak remains discernible (i.e., at longer timescales, the peak is smeared out). As can be seen by a visual comparison of the plots, the first-neighbor peak is smeared out at different timescales depending on the complexation agent. In addition, the rate of change of the height of the first-neighbor peak also varies with the kind of molecule examined.
Fig. 13 plots the height of this peak, normalized by the height of the peak at the t = 0. The rate of change of this height, is considerably lower in the OfDegLin and the DML, indicating a slower change of the relative spatial arrangement of their neighbors, or in other words, a more confined environment experienced by these molecules. The environments experienced by the DLPC and DPPC molecules are shown to loose coherence at a considerably faster rate, while the DM molecules exhibit a rate of local rearrangement, intermediate between those characterizing the hydrophobic ionizable agents and the zwitterionic lipids.
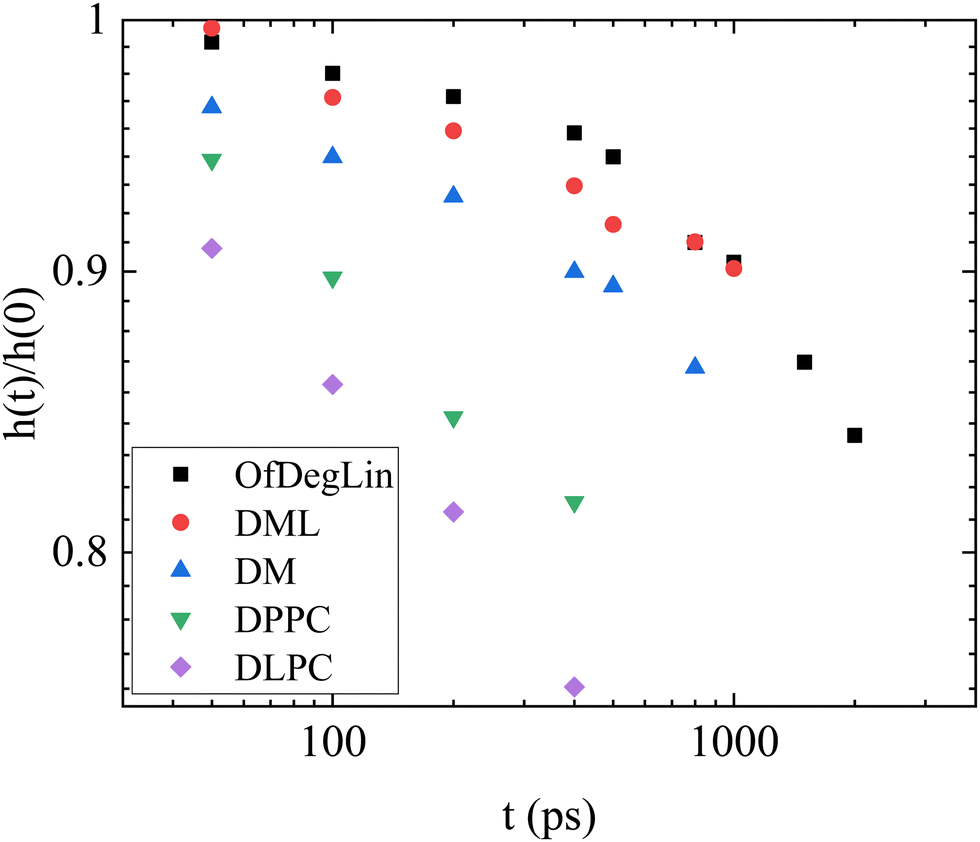 | ||
| Fig. 13 Time dependence of the height of the first-neighbor peak shown in Fig. S10a–e, with respect to its value at t = 0. The determination of the peak height was performed after smoothing the data shown in Fig. S10a–e (ESI†). | ||
4. Discussion
In this work we have compared by means of fully atomistic molecular dynamics simulations, the propensity of two groups of lipid-based molecules to self-assemble and to complex with a short mRNA fragment, in a dilute aqueous solution. The first group included three diketopiperazine-core ionized molecules (DM, DML and OfDegLin) bearing a different number of hydrophobic end-groups. The second group was comprised by amphoteric but overall neutral phosphatidylcholine lipids, bearing hydrophobic parts of different length (DLPC and DPPC). We focused on the elucidation of the role of parameters related to their structure, their association free energies and to other physicochemical features (size, charge, degree of hydrophobicity), in their ability to form structurally and energetically stable complexes with mRNA.Structural analysis of the formed clusters revealed that the more hydrophobic charged lipids of the first group (i.e., DML and OfDegLin) formed almost spherical in shape and more compact clusters, compared to the rather loose interior of the clusters formed by their less hydrophobic counterpart (i.e., DM) and by the amphoteric DLPC and DPPC lipids. The interior of the DML and OfDegLin clusters was found to be practically impenetrable by water while in the case of the less hydrophobic DM, DLPC and DPPC molecules, water was found to penetrate their interior to a large extent. The presence or absence of water in the interior of the clusters, in combination with the charge distribution within the clusters, appears to affect the chain conformation of mRNA in the formed complexes.
The presence of water molecules seems to increase the probability of mRNA hydrogen-bonding within the cluster. However, energetic analysis of this association revealed that the stronger driving force for complex formation is the electrostatic interaction. Therefore, given the charged state of the diketopiperazine-based agents, these molecules exhibit higher affinity with mRNA compared to the electrically neutral DLPC and DPPC lipids. Among the ionized lipids, the free energy of association between the DM molecules and mRNA appears to fluctuate strongly, most probably due to the loose structure of the formed cluster which affects the distances between the charges. Between the DML and OfDegLin lipids, the larger number of the linoleic acid end-groups in the latter, appears to affect the intensity of the electrostatic interactions with mRNA by sterically obstructing the oppositely charged groups to come at closer distances.
The different characteristics of the complexation agents have a direct impact on the kinetics of their self-assembly and their complexation with mRNA. Among the diketopiperazine-based molecules, the more hydrophobic (i.e., DML and OfDegLin) assume faster clustering kinetics. DM, DPPC and DLPC, which show a similar degree of hydrophobicity, exhibit slower aggregation kinetics. However, the number of the formed clusters continues to fluctuate for the DLPC and DPPC, whereas it remains stable at the last part of the trajectory for the diketopiperazine-based molecules. Kinetics of hydrogen bonding between the complexation agents and mRNA shows that this is realized at a shorter timescale in the diketopiperzine-based molecules, while the timescale for the attainment of a plateau in the hydrogen bond number, follows the same temporal order for the formation of a single cluster by the different agents.
From the VanHove analysis it is shown that the ionizable lipids experience a more confined environment compared to the phosphatidylcholine amphoteric molecules, resulting in longer periods for their structural rearrangement. This prompts to more stable complexes, in accordance with the results obtained from the other measures mentioned above. Among the three ionized agents, the less hydrophobic DM molecules exhibited a shorter restructuring timescale, implying more deformable clusters.
5. Conclusions
Considering all the above findings, it appears that an appropriate balance between the effective charge and the hydrophobicity of a potential complexation agent should be present, for the formation of structurally and thermodynamically stable complexes with mRNA fragments. Variation of these attributes appears also to affect the average size of the lipid-based assemblies and the RNA conformation (i.e., more extended and surrounded by the lipid molecules, or wrapped around the formed clusters). Since the present study has been performed in the absence of organic solvents, the information obtained would be of particular relevance to organic-solvent-free fabrication processes of lipid based LNPs, designed for the entrapment of nucleic-acids. In the case where ethanol or other organic solvents are used in the mixing process, we expect that several of the mechanisms described, which are related to the association between RNA and lipid molecules, will still be at work in the interior of the LNPs where an aqueous environment is formed.Although the extent of the RNA chain and the sequence of the bases, are also anticipated to play a significant role in the complexation with such lipid-based compounds, it is also expected that the main features of the complexation process would remain the same. These features concern (a) the timescales related to self-assembly and the association with RNA, (b) the nature and the relative importance of the interactions driving the complexation and (c) parameters that may affect the structural and thermodynamic stability of the lipid clusters and of their complexes with RNA.
Despite the fact that no detailed-information regarding the association of such lipids with mRNA is as yet available from relevant experiments, so that a direct comparison could be made, insight from the present work may serve as a first step towards the comprehension of the microscopic mechanisms involved in the lipid/mRNA complexation process. This information could lead to better practices as far as it concerns the design of lipid-based RNA complexes, where RNA can be incorporated in LNPs for a more efficient nucleic acid delivery.
Conflicts of interest
The authors declare that there is no conflict of interests regarding the publication of this article.Acknowledgements
This work was supported by a computational time granted from the Greek Research & Technology Network (GRNET) in the National HPC facility – ARIS – under project ID RNA_COMPLEX. This research has been co-financed by the European Union and Greek national funds through the Operational Program Competitiveness, Entrepreneurship and Innovation, under the call RESEARCH – CREATE – INNOVATE (project code:T1EDK-02775). A. Ouranidis is acknowledged for project administration.References
- L. Schoenmaker, D. Witzigmann, J. A. Kulkarni, R. Verbeke, G. Kersten, W. Jiskoot and D. J. A. Crommelin, Int. J. Pharm., 2021, 601, 120586 CrossRef CAS PubMed.
- N. A. C. Jackson, K. E. Kester, D. Casimiro, S. Gurunathan and F. DeRosa, npj Vaccines, 2020, 5, 11 CrossRef PubMed.
- D. J. A. Crommelin, T. J. Anchordoquy, D. B. Volkin, W. Jiskoot and E. Mastrobattista, J. Pharm. Sci., 2021, 110, 997–1001 CrossRef CAS PubMed.
- M. Yanez Arteta, T. Kjellman, S. Bartesaghi, S. Wallin, X. Wu, A. J. Kvist, A. Dabkowska, N. Székely, A. Radulescu and J. Bergenholtz, Proc. Natl. Acad. Sci. U.S.A., 2018, 115, E3351–E3360 CrossRef PubMed.
- R. Verbeke, I. Lentacker, S. C. De Smedt and H. Dewitte, Nano Today, 2019, 28, 100766 CrossRef CAS.
- H. Tanaka, T. Takahashi, M. Konishi, N. Takata, M. Gomi, D. Shirane, R. Miyama, S. Hagiwara, Y. Yamasaki, Y. Sakurai, K. Ueda, K. Higashi, K. Moribe, E. Shinsho, R. Nishida, K. Fukuzawa, E. Yonemochi, K. Okuwaki, Y. Mochizuki, Y. Nakai, K. Tange, H. Yoshioka, S. Tamagawa and H. Akita, Adv. Funct. Mater., 2020, 30, 1910575 CrossRef CAS.
- F. Sebastiani, M. Yanez Arteta, M. Lerche, L. Porcar, C. Lang, R. A. Bragg, C. S. Elmore, V. R. Krishnamurthy, R. A. Russell, T. Darwish, H. Pichler, S. Waldie, M. Moulin, M. Haertlein, V. T. Forsyth, L. Lindfors and M. Cárdenas, ACS Nano, 2021, 15, 6709–6722 CrossRef CAS PubMed.
- J. Viger-Gravel, A. Schantz, A. C. Pinon and A. J. Rossini, J. Phys. Chem. B, 2018, 122, 2073–2081 CrossRef CAS PubMed.
- J. A. Kulkarni, M. M. Darjuan, J. E. Mercer and S. Chen, ACS Nano, 2018, 12, 4787–4795 CrossRef CAS PubMed.
- M. L. Brader, S. J. Williams, J. M. Banks, W. H. Hui, Z. H. Zhou and L. Jin, Biophys. J., 2021, 120, 2766–2770 CrossRef CAS PubMed.
- J. A. Kulkarni, D. Witzigmann, J. Leung, Y. Y. C. Tam and P. R. Cullis, Nanoscale, 2019, 11, 21733–21739 RSC.
- V. Ambros and X. Chen, Development, 2007, 134, 1635–1641 CrossRef CAS PubMed.
- B. Bartel, Nat. Struct. Mol. Biol., 2005, 12, 569–571 CrossRef CAS PubMed.
- R. Juliano, M. R. Alam, V. Dixit and H. Kang, Nucleic Acids Res., 2008, 36, 4158–4171 CrossRef CAS PubMed.
- T. Zheng, J. Wang, X. Chen and L. Liu, Int. J. Cancer, 2010, 126, 2–10 CrossRef CAS PubMed.
- N. Pardi, S. Tuyishime, H. Muramatsu, K. Kariko, B. L. Mui, Y. K. Tam, T. D. Madden, M. J. Hope and D. Weissman, J. Control. Release, 2015, 217, 345–351 CrossRef CAS PubMed.
- J. A. Kulkarni, P. R. Cullis and R. van der Meel, Nucleic Acid Ther., 2018, 28, 146–157 CrossRef CAS PubMed.
- K. H. Moss, P. Popova, S. R. Hadrup, K. Astakhova and M. Taskova, Mol. Pharm., 2019, 16, 2265–2277 CrossRef CAS PubMed.
- M. L. Guevara, F. Persano and S. Persano, Advances in Lipid Nanoparticles for mRNA-Based Cancer Immunotherapy, Front. Chem., 2020, 8, 589959, DOI:10.3389/fchem.2020.589959 , https://www.frontiersin.org/articles/10.3389/fchem.2020.589959/full.
- D. Witzigmann, J. A. Kulkarni, J. Leung, S. Chen, P. R. Cullis and R. van der Meel, Adv. Drug Delivery Rev., 2020, 159, 344–363 CrossRef CAS PubMed.
- R. Tenchov, R. Bird, A. E. Curtze and Q. Zhou, ACS Nano, 2021, 15, 16982–17015 CrossRef CAS PubMed.
- X. Hou, T. Zaks, R. Langer and Y. Dong, Nat. Rev. Mater., 2021, 6(1094), 1078, DOI:10.1038/s41578-021-00358-0.
- K. J. Kauffman, J. R. Dorkin, J. H. Yang, M. W. Heartlein, F. DeRosa, F. F. Mir, O. S. Fenton and D. G. Anderson, Nano Lett., 2015, 15, 7300–7306 CrossRef CAS PubMed.
- J. Heyes, L. Palmer, K. Bremner and I. MacLachlan, J. Control. Release, 2005, 107, 276–287 CrossRef CAS PubMed.
- S. C. Semple, A. Akinc, J. Chen, A. P. Sandhu, B. L. Mui, C. K. Cho, D. W. Y. Sah, D. Stebbing, E. J. Crosley, E. Yaworski, I. M. Hafez, J. R. Dorkin, J. Qin, K. Lam, K. G. Rajeev, K. F. Wong, L. B. Jeffs, L. Nechev, M. L. Eisenhardt, M. Jayaraman, M. Kazem, M. A. Maier, M. Srinivasulu, M. J. Weinstein, Q. Chen, R. Alvarez, S. A. Barros, S. De, S. K. Klimuk, T. Borland, V. Kosovrasti, W. L. Cantley, Y. K. Tam, M. Manoharan, M. A. Ciufolini, M. A. Tracy, A. de Fougerolles, I. MacLachlan, P. R. Cullis, T. D. Madden and M. J. Hope, Nat. Biotechnol., 2010, 28, 172–176 CrossRef CAS PubMed.
- A. J. Geall, A. Verma, G. R. Otten, C. A. Shaw, A. Hekele, K. Banerjee, Y. Cu, C. W. Beard, L. A. Brito, T. Krucker, D. T. O'Hagan, M. Singh, P. W. Mason, N. M. Valiante, P. R. Dormitzer, S. W. Barnett, R. Rappuoli, J. B. Ulmer and C. W. Mandl, Proc. Natl. Acad. Sci. U. S. A., 2012, 109, 14604–14609 CrossRef CAS PubMed.
- A. Thess, S. Grund, B. L. Mui, M. J. Hope, P. Baumhof, M. Fotin-Mleczek and T. Schlake, Mol. Ther., 2015, 23, S55 CrossRef.
- O. S. Fenton, K. J. Kauffman, R. L. McClellan, E. A. Appel, J. R. Dorkin, M. W. Tibbitt, M. W. Heartlein, F. DeRosa, R. Langer and D. G. Anderson, Adv. Mater., 2016, 28, 2939–2943 CrossRef CAS PubMed.
- N. Pardi, M. J. Hogan, F. W. Porter and D. Weissman, Nat. Rev. Drug Discovery, 2018, 17, 261–279 CrossRef CAS PubMed.
- O. S. Fenton, K. J. Kauffman, R. L. McClellan, E. A. Appel, J. R. Dorkin, M. W. Tibbitt, M. W. Heartlein, F. DeRosa, R. Langer and D. G. Anderson, Adv. Mater., 2016, 28, 2939–2943 CrossRef CAS PubMed.
- Y. Dong, A. A. Eltoukhy, C. A. Alabi, O. F. Khan, O. Veiseh, J. R. Dorkin, S. Sirirungruang, H. Yin, B. C. Tang, J. M. Pelet, D. Chen, Z. Gu, Y. Xue, R. Langer and D. G. Anderson, Adv. Healthc. Mater., 2014, 3, 1392–1397 CrossRef CAS PubMed.
- K. A. Hajj, R. L. Ball, S. B. Deluty, S. R. Singh, D. Strelkova, C. M. Knapp and K. A. Whitehead, Small, 2019, 15, 1805097 CrossRef PubMed.
- R. A. Walker, J. C. Conboy and G. L. Richmond, Langmuir, 1997, 13, 3070–3073 CrossRef CAS.
- A. Michanek, M. Yanez, H. Wacklin, A. Hughes, T. Nylander and E. Sparr, Langmuir, 2012, 28, 9621–9633 CrossRef CAS PubMed.
- R. Fraley, S. Subramani, P. Berg and D. Papahadjopoulos, J. Biol. Chem., 1980, 255, 10431–10435 CrossRef CAS PubMed.
- R. T. Fraley, C. S. Fornari and S. Kaplan, Proc. Natl. Acad. Sci. U.S.A., 1979, 76, 3348–3352 CrossRef CAS PubMed.
- M. A. H. M. A. Malik, F. Nabi, S. A. AL-Thabaiti and Z. Khan, Int. J. Electrochem. Sci., 2011, 6, 1927–1948 CAS.
- A. Michanek, N. Kristen, F. Höök, T. Nylander and E. Sparr, Biochim. Biophys. Acta, Biomembr., 2010, 1798, 829–838 CrossRef CAS PubMed.
- O. S. Fenton, K. J. Kauffman, J. C. Kaczmarek, R. L. McClellan, S. Jhunjhunwala, M. W. Tibbitt, M. D. Zeng, E. A. Appel, J. R. Dorkin, F. F. Mir, J. H. Yang, M. A. Oberli, M. W. Heartlein, F. DeRosa, R. Langer and D. G. Anderson, Adv. Mater., 2017, 29, 1606944 CrossRef PubMed.
- P. P. G. Guimaraes, R. Zhang, R. Spektor, M. Tan, A. Chung, M. M. Billingsley, R. El-Mayta, R. S. Riley, L. Wang, J. M. Wilson and M. J. Mitchell, J. Control. Release, 2019, 316, 404–417 CrossRef CAS PubMed.
- Y. Rybakova, P. S. Kowalski, Y. Huang, J. T. Gonzalez, M. W. Heartlein, F. DeRosa, D. Delcassian and D. G. Anderson, Mol. Ther., 2019, 27, 1415–1423 CrossRef CAS PubMed.
- J. Li, Y. Ouyang, X. Kong, J. Zhu, D. Lu and Z. Liu, RSC Adv., 2015, 5, 68227–68233 RSC.
- M. Paloncýová, P. Čechová, M. Šrejber, P. Kührová and M. Otyepka, J. Phys. Chem. Lett., 2021, 11199–11205, DOI:10.1021/acs.jpclett.1c03109.
- C. De Michele, L. Rovigatti, T. Bellini and F. Sciortino, Soft Matter, 2012, 8, 8388 RSC.
- Z. Wei and E. Luijten, J. Chem. Phys., 2015, 143, 243146 CrossRef PubMed.
- Y. A. G. Fosado, D. Michieletto, J. Allan, C. A. Brackley, O. Henrich and D. Marenduzzo, Soft Matter, 2016, 12, 9458–9470 RSC.
- A. N. Rissanou, A. Ouranidis and K. Karatasos, Soft Matter, 2020, 16, 6993–7005 RSC.
- https://www.ebi.ac.uk/pdbe/entry/pdb/5tdn/protein/1, accessed 19 July 2022.
- C. Eigenbrot, M. Randal, L. Presta, P. Carter and A. A. Kossiakoff, J. Mol. Biol., 1993, 229, 969–995 CrossRef CAS PubMed.
- K. Mansouri, N. F. Cariello, A. Korotcov, V. Tkachenko, C. M. Grulke, C. S. Sprankle, D. Allen, W. M. Casey, N. C. Kleinstreuer and A. J. Williams, J. Cheminf., 2019, 11, 60 Search PubMed.
- K. Mansouri, C. M. Grulke, R. S. Judson and A. J. Williams, J. Cheminf., 2018, 10, 10 Search PubMed.
- https://chemaxon.com/products/Marvin accessed 19 Juy 2022.
- H. N. Po and N. M. Senozan, J. Chem. Educ., 2001, 78, 1499 CrossRef CAS.
- B. Hess, C. Kutzner, D. van der Spoel and E. Lindahl, J. Chem. Theory Comput., 2008, 4, 435–447 CrossRef CAS PubMed.
- J. Šponer, G. Bussi, M. Krepl, P. Banáš, S. Bottaro, R. A. Cunha, A. Gil-Ley, G. Pinamonti, S. Poblete, P. Jurečka, N. G. Walter and M. Otyepka, Chem. Rev., 2018, 118, 4177–4338 CrossRef PubMed.
- T. Malaspina, G. Colherinhas, F. de Oliveira Outi and E. E. Fileti, RSC Adv., 2017, 7, 35973–35981 RSC.
- L. Zhang, Z. Zhang, J. Jasa, D. Li, R. O. Cleveland, M. Negahban and A. Jérusalem, Sci. Rep., 2017, 7, 8316, DOI:10.1038/s41598-017-06827-3.
- J. Huang and A. D. MacKerell, Jr., J. Comput. Chem., 2013, 34, 2135–2145 CrossRef CAS PubMed.
- J. Huang, S. Rauscher, G. Nawrocki, T. Ran, M. Feig, B. L. de Groot, H. Grubmüller and A. D. MacKerell, Jr., Nat. Methods, 2017, 14, 71–73 CrossRef CAS PubMed.
- E. J. Denning, U. D. Priyakumar, L. Nilsson and A. D. Mackerell, J. Comput. Chem., 2011, 32, 1929–1943 CrossRef CAS PubMed.
- H. J. C. Berendsen, J. R. Grigera and T. P. Straatsma, J. Phys. Chem., 1987, 91, 6269–6271 CrossRef CAS.
- S. Chatterjee, P. G. Debenedetti, F. H. Stillinger and R. M. Lynden-Bell, J. Chem. Phys., 2008, 128, 124511 CrossRef PubMed.
- R. E. Isele-Holder, W. Mitchell and A. E. Ismail, J. Chem. Phys., 2012, 137, 174107 CrossRef PubMed.
- R. M. Venable, E. Hatcher, O. Guvench, A. D. Mackerell, Jr. and R. W. Pastor, J. Phys. Chem. B, 2010, 114, 12501–12507 CrossRef CAS PubMed.
- M. A. González and J. L. F. Abascal, J. Chem. Phys., 2010, 132, 096101 CrossRef PubMed.
- P. Höchtl, S. Boresch, W. Bitomsky and O. Steinhauser, J. Chem. Phys., 1998, 109, 4927–4937 CrossRef.
- J. L. Desmond, P. M. Rodger and T. R. Walsh, Mol. Simul., 2014, 40, 912–921 CrossRef CAS.
- C.-J. Högberg, A. M. Nikitin and A. P. Lyubartsev, J. Comput. Chem., 2008, 29, 2359–2369 CrossRef PubMed.
- Y. J. Wu, H. L. Tepper and G. A. Voth, J. Chem. Phys., 2006, 124, 024503, DOI:10.1063/1.2136877.
- J. Gasteiger and M. Marsili, Tetrahcdron, 1980, 36, 3219–3228 CrossRef CAS.
- R. Galvelis, S. Doerr, J. M. Damas, M. J. Harvey and G. De Fabritiis, J. Chem. Inf. Model., 2019, 59, 3485–3493 CrossRef CAS PubMed.
- G. Brannigan, J. Henin, R. Law, R. Eckenhoff and M. L. Klein, Biophys. J., 2009, 96, 168a CrossRef.
- Y. Pu, X. Zhang, Q. Zhang, B. Wang, Y. Chen, C. Zang, Y. Wang, T. T.-X. Dong and T. Zhang, Molecules, 2016, 21, 1396 CrossRef PubMed.
- H. J. C. Berendsen, J. P. M. Postma, W. F. van Gunsteren, A. DiNola and J. R. Haak, J. Chem. Phys., 1984, 81, 3684–3690 CrossRef CAS.
- G. Bussi, D. Donadio and M. Parrinello, J. Chem. Phys., 2007, 126, 014101 CrossRef PubMed.
- M. J. Boniecki, G. Lach, W. K. Dawson, K. Tomala, P. Lukasz, T. Soltysinski, K. M. Rother and J. M. Bujnicki, Nucleic Acids Res., 2016, 44, e63 CrossRef PubMed.
- E. Pantatosaki and G. K. Papadopoulos, J. Chem. Theory Comput., 2020, 16, 3842–3855 CrossRef CAS PubMed.
- J. N. Israelachvili, D. J. Mitchell and B. W. Ninham, J. Chem. Soc., Faraday Trans. 2, 1976, 72, 1525 RSC.
- R. Smith and C. Tanford, J. Mol. Biol., 1972, 67, 75–83 CrossRef CAS.
- T. M. Weiss, T. Narayanan, C. Wolf, M. Gradzielski, P. Panine, S. Finet and W. I. Helsby, Phys. Rev. Lett., 2005, 94, 038303 CrossRef CAS PubMed.
- C. Huang, D. Quinn, Y. Sadovsky, S. Suresh and K. J. Hsia, Proc. Natl. Acad. Sci. U. S. A., 2017, 114, 2910–2915 CrossRef CAS PubMed.
- R. Kumari, R. Kumar and A. Lynn, J. Chem. Inf. Model., 2014, 54, 1951–1962 CrossRef CAS PubMed.
- N. A. Baker, D. Sept, S. Joseph, M. J. Holst and J. A. McCammon, Proc. Natl. Acad. Sci. U. S. A., 2001, 98, 10037–10041 CrossRef CAS PubMed.
- V. Binette, S. Côté, M. Haddad, P. T. Nguyen, S. Bélanger, S. Bourgault, C. Ramassamy, R. Gaudreault and N. Mousseau, Phys. Chem. Chem. Phys., 2021, 23, 14873–14888 RSC.
- M. O. Rafi, G. Bhattacharje, K. Al-Khafaji, T. Taskin-Tok, M. A. Alfasane, A. K. Das, M. A. K. Parvez and M. S. Rahman, J. Biomol. Struct. Dyn., 2020, 1–20, DOI:10.1080/07391102.2020.1850355.
- L. Duan, X. Liu and J. Z. H. Zhang, J. Am. Chem. Soc., 2016, 138, 5722–5728 CrossRef CAS PubMed.
- M. A. Mintzer and E. E. Simanek, Chem. Rev., 2008, 109, 259–302 CrossRef PubMed.
- A. Michanek, N. Kristen, F. Höök, T. Nylander and E. Sparr, Biochim Biophys Acta Biomembr., 2010, 1798(4), 829–838, DOI:10.1016/j.bbamem.2009.12.009.
- A. Ewe, O. Panchal, S. R. Pinnapireddy, U. Bakowsky, S. Przybylski, A. Temme and A. Aigner, Nanomedicine, 2017, 13, 209–218 CrossRef CAS PubMed.
- D. A. McQuarrie and C. E. Reid, Phys. Today, 1977, 30, 58–59 CrossRef.
- T. F. Headen, E. S. Boek, G. Jackson, T. S. Totton and E. A. Müller, Energy Fuels, 2017, 31, 1108–1125 CrossRef CAS.
- S. Landau, B. S. Everitt, M. Leese and D. Stahl, Cluster Analysis, Wiley, Chichester, West Sussex, U.K., 2011 Search PubMed.
- C. Tanford, J. Phys. Chem., 1972, 76, 3020–3024 CrossRef CAS.
- J. N. Israelachvili, in Intermolecular and Surface Forces, ed. J. N. Israelachvili, Academic Press, Boston, 3rd edn, 2011, pp. 535–576 DOI:10.1016/B978-0-12-391927-4.10020-9.
- J. A. Kulkarni, M. M. Darjuan, J. E. Mercer and S. Chen, ACS Nano, 2018, 12, 4787–4795, DOI:10.1021/acsnano.8b01516.
- N. Foloppe and R. Hubbard, Curr. Med. Chem., 2006, 13, 3583–3608 CrossRef CAS PubMed.
- H. Gohlke, C. Kiel and D. A. Case, J. Mol. Biol., 2003, 330, 891–913 CrossRef CAS PubMed.
- N. Homeyer and H. Gohlke, Mol. Inform., 2012, 31, 114–122 CrossRef CAS PubMed.
- P. A. Kollman, I. Massova, C. Reyes, B. Kuhn, S. Huo, L. Chong, M. Lee, T. Lee, Y. Duan, W. Wang, O. Donini, P. Cieplak, J. Srinivasan, D. A. Case and T. E. Cheatham, Acc. Chem. Res., 2000, 33, 889–897 CrossRef CAS PubMed.
- H. Meirovitch, Curr. Opin. Struct. Biol., 2007, 17, 181–186 CrossRef CAS PubMed.
- M. D. Parenti and G. Rastelli, Biotechnol. Adv., 2012, 30, 244–250 CrossRef CAS PubMed.
- C. Wang, D. A. Greene, L. Xiao, R. Qi and R. Luo, Front. Mol. Biosci., 2018, 4, 87 CrossRef PubMed.
- K. Huang, S. Luo, Y. Cong, S. Zhong, J. Z. H. Zhang and L. Duan, Nanoscale, 2020, 12, 10737–10750 RSC.
- K. Karatasos, P. Posocco, E. Laurini and S. Pricl, Macromol. Biosci., 2011, 12, 225–240 CrossRef PubMed.
- D. Chen, N. Oezguen, P. Urvil, C. Ferguson, S. M. Dann and T. C. Savidge, Aci. Adv., 2016, 2, e1501240 Search PubMed.
- E. Pantatosaki and G. K. Papadopoulos, J. Chem. Theory Comput., 2020, 16, 3842–3855 CrossRef CAS PubMed.
- W. K. Ridgeway, E. Seitaridou, R. Phillips and J. R. Williamson, Nucleic Acids Res., 2009, 37, e142 CrossRef PubMed.
- M. J. W. Evers, J. A. Kulkarni, R. van der Meel, P. R. Cullis, P. Vader and R. M. Schiffelers, Small Methods, 2018, 2, 1700375 CrossRef.
- E. Quagliarini, S. Renzi, L. Digiacomo, F. Giulimondi, B. Sartori, H. Amenitsch, V. Tassinari, L. Masuelli, R. Bei, L. Cui, J. Wang, A. Amici, C. Marchini, D. Pozzi and G. Caracciolo, Pharmaceutics, 2021, 13, 1292 CrossRef CAS PubMed.
Footnote |
| † Electronic supplementary information (ESI) available. See DOI: https://doi.org/10.1039/d2sm00403h |
| This journal is © The Royal Society of Chemistry 2022 |