
 Open Access Article
 This Open Access Article is licensed under a
 Creative Commons Attribution 3.0 Unported Licence
The effect of high relative humidity on a network of water-sensitive particles (couscous) as revealed by in situ X-ray tomography
Ilija
Vego
 *a,
Alessandro
Tengattini
ab,
Edward
Andò
c,
Nicolas
Lenoir
a and
Gioacchino
Viggiani
a
*a,
Alessandro
Tengattini
ab,
Edward
Andò
c,
Nicolas
Lenoir
a and
Gioacchino
Viggiani
a
aUniv. Grenoble Alpes, Grenoble INP, CNRS, 3SR, F-38000 Grenoble, France. E-mail: ilija.vego@univ-grenoble-alpes.fr
bInstitut Laue-Langevin (ILL), 71 Avenue des Martyrs, 38000 Grenoble, France
cEPFL Center for Imaging, École Polytechnique Fédérale de Lausanne (EPFL), Lausanne, Switzerland
First published on 30th May 2022
Abstract
Water significantly influences the mechanical behaviour of all granular materials but none as much as hygroscopic amorphous particles. With sufficiently high water content, particles can swell, agglomerate and their mechanical properties can be reduced, having direct effects on the macroscopic response of the material. In the food and pharmaceutical industry this can cause loss of product functionality. Despite their relevance, very little is known about the microscopic processes that induce these phenomena. Previous studies focused on single particle behaviour, the strength of agglomerated particles and the material flowability, leaving unexplored the link connecting the particle behaviour and the bulk response. This experimental study aims to investigate this aspect with quantitative measurements at both particle and macroscopic scales. A sample of fine couscous is exposed to a high relative humidity (RH) air flow, while being subjected to oedometric conditions, in order to reproduce the storage-silo conditions. In the meantime, X-ray tomographies are acquired continuously and the resulting images are analysed. The designed spatial resolution allows each particle of the sample to be identified and tracked, allowing volumetric evolution to be compared to the properties of the whole sample. The analysis reveals a dilation–compaction macroscopic behaviour, a result of the competition between the particle swelling and the higher deformability as the water content increases. The number, orientations and inter-particle contacts are computed. Their area is related to the applied boundary conditions, and is found to be consistent with the particle swelling and dependent on the applied stress direction.
1 Introduction
Chemo-hydro-mechanical couplings strongly affect the behaviour of granular materials. While the role played by water in the assembly of impermeable particles has been exhaustively studied (e.g., partially saturated soil mechanics1), the behaviour of many materials is severely affected by water, either in the liquid or gaseous state. Such materials can be defined as water-sensitive, and are very common, notably in the food or pharmaceutical industry (e.g., cereals, sugar, salt, excipients). When they are exposed to variations in humidity or moisture their properties can drastically change.2–6This variation of properties is driven by a variety of particle-scale phenomena, several of which have been investigated in dedicated studies. For example, the volume of individual lentil seeds has been observed to increase with the water content.7 Similar responses were observed for rice and wheat grains8,9 or even smaller particles, such as microcrystalline cellulose granules.10 Their stiffness and strength are also significantly affected by the water content. Compression tests on a cylindrical specimen extracted from wheat kernels highlighted a reduction of both Young's modulus and bearing capacity up to 12%.11,12 A similar behaviour was also observed for individual rice particles.13 Different water contents of microcrystalline cellulose granules can also alter the final tensile strength of pharmaceutical tablets.10 Another process often occurring in water-sensitive materials is the release of starch or mucilage,14,15 which can bridge particles or seeds, thus adding cohesion. Experimental evidence from humidity cycles reveals the non-reversibility of some of these processes,3 leading to the creation of particle fissures, lowering their strength and thus their functionality or customer appeal.16 Most of the aforementioned studies focus on the behaviour of individual water-sensitive particles but do not explore the effect that these particle-scale processes have on an assembly. However, in ordinary circumstances, these particles are stored and processed, and interact with many others. The focus of this work is to study the response of a particle assembly. Notably, one of the key industrial challenges is caking, a deleterious phenomenon caused by the agglomeration of particles. When caking occurs, the particles stop behaving discretely and start exhibiting a solid-like response, critically reducing the flowability and thus functionality.2,6,17,18
At the molecular level, the reduction of mechanical properties is driven by the evolution of the glass transition temperature, i.e., the transition from a brittle, glassy response to a more viscous one. This is typical in amorphous materials, to which water-sensitive materials generally belong. An increase in the water content lowers this glass transition temperature, which can go below the environmental one.2,6 At the particle contact scale this induces inter- and intra-granular plastic deformation, and an increase in the contact area and cohesion.2,6 When this occurs, the assembly transitions from a granular to a ‘solid-like’ response, leading to major engineering challenges,2,5,6 and reduction in its quality.5,16
The aforementioned studies have focused either on the single particle response,7–9,11–13 on the macroscopic effect of caking on material flowability properties4,17–20 or on the hydro-mechanical processes caused by caking over a powder assembly,3,6,21 for numerous materials and under different environmental and mechanical conditions. As highlighted in a recent comprehensive review, one of the key missing elements is the link between the single particle and bulk behaviour,6 which is exactly the main focus of the current contribution.
This study particularly explores the particle-scale processes that lead to caking, by observing an assembly of 2200 couscous particles in 4D (3D + time) through X-ray tomography. This non-destructive technique allowed the tracking of each particle and the corresponding contacts while the sample is subjected to a significant increase of humidity (>90%) under a constant axial load and zero radial strain deformation (the so-called oedometric conditions) with operando imaging for 103 hours. These conditions are chosen as an analogue to a real-life industrial scenario such as in a silo storage, where the decrease of the glass transition temperature triggers the phenomena that entail caking.
Section 2 presents the chosen material, the experimental setup and the imaging acquisition settings. Section 3 presents the main results of the study. At the sample level (macroscopic), porosity and volumetric strain are quantified. Next, the particle tracking technique is introduced, together with the sample kinematics. Finally, the inter-particle contacts number, orientation and size during the test is presented. The conclusions are summarised in Section 4, together with possible future developments.
2 Experimental section
2.1 Material
The material selected for this experimental study is fine couscous. Couscous is specifically selected because it presents several interesting micro-mechanical phenomena at the particle scale; notably its particles can swell, they can develop agglomeration (contact adhesion), and their mechanical properties (stiffness and strength) depend on the water content. While these features are common in several other materials, additional processes (e.g., peeling, highly concave shapes, and flat inter-particle contacts) can make the analysis of the images cumbersome. Additionally, the size of fine couscous (about 0.9 mm equivalent diameter) is well within the spatial and temporal resolution of the imaging system used, allowing grain scale analyses.2.2 Experimental conditions
Oedometric conditions are selected to represent in fact the natural conditions in a storage silo; 1.3 g of particles are added to a rigid (PEEK) cylindrical cell of 16 mm diameter, to give a 8 mm tall sample, with an initial porosity of 50%. To mimic the stress state that could be found in a silo, a dead load applies 25 kPa by means of a metallic ram (corresponding to a depth of approximately 4 meters), with displacement allowed on only one side of the cell (see Fig. 1).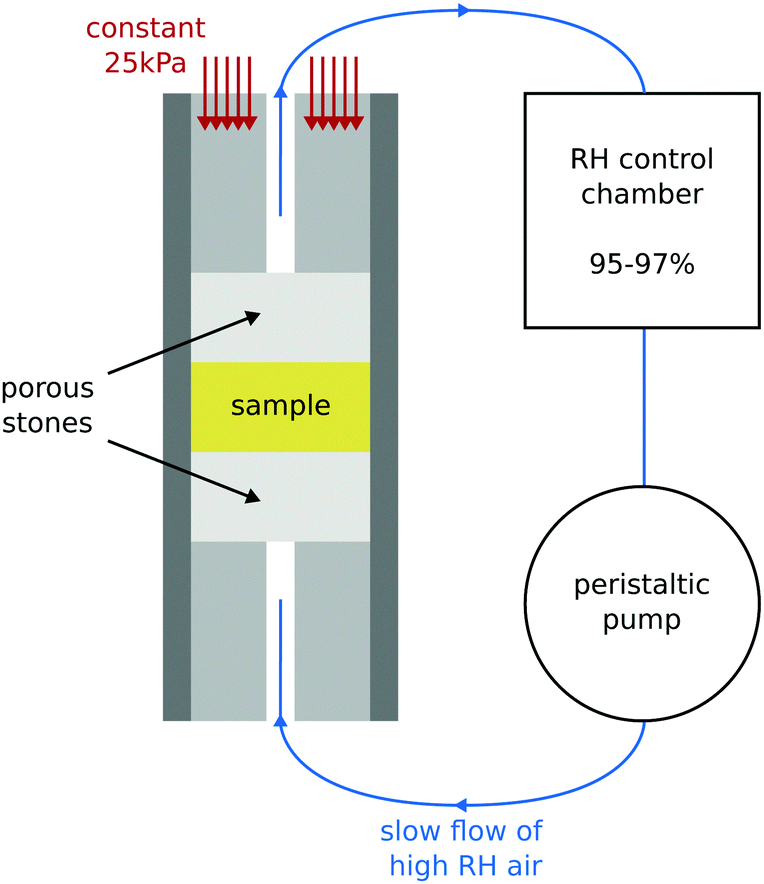 | ||
| Fig. 1 Sketch of the experimental set-up used to test couscous particles exposed to high levels of RH. The sample is placed in an oedometric cell, subjected to a constant stress of 25 kPa. Meanwhile, a slow flow of high RH air is injected by means of a peristaltic pump from the bottom. | ||
The sample is subjected to a constant flow of air at 15 mL min−1 and a relative humidity (RH) in between 95 and 97% depending on room temperature. The temperature is servo-controlled within the experimental room to 24 ± 1 °C. The humidity is imposed via a peristaltic pump connected to a RH chamber, which contains a saturated saline solution of potassium sulphate, prepared by mixing 115 g of salt in 1 L of demineralised water (K2SO4 + H2O), generating an environment at 97 ± 1% RH at 20–25 °C.22 This relatively high humidity (when compared to the site conditions) is chosen to accelerate the inherent rate of the processes characterising the material, since X-ray scanning time is limited in practice.
In order to allow the flow of the humid air through the sample and prevent particles falling into the air tubes, two high porosity ceramic stones are placed at the boundaries. The diameter of the upper one is slightly lower than the one of the PEEK cell, so as not to obstruct the action of the ram.
2.3 Imaging setup
While the sample is being exposed to this high relative humidity air, X-ray tomographies are acquired for about 4 days (103 h) using a tomograph in Laboratoire 3SR (Grenoble, France).A first tomography is acquired before starting the injection as a reference dry state for the following analyses. Then, the peristaltic pump is turned on and the tomographies are acquired continuously.
Each tomography comprises 1440 projections, each of which is the result of the average of 7 individual acquisitions lasting 0.37 s each, making one single tomography last 1 h. The duration of the acquisition is the result of a compromise spatial and temporal resolution. The voxel-size is of 14 μm, in order to have about 64 voxels across a particle.
Each tomography is reconstructed through Feldkamp filtered back projection23 as implemented in the X-Act reconstruction software by RX-Solutions (Annecy, France), and analysed as detailed in the next sections.
3 Image analysis: results and discussion
3.1 Raw grey-scale images
A qualitative understanding of the overall process can already be obtained from the reconstructed X-ray tomographies. Fig. 2 shows a few representative vertical slices of a sequence of 3D images clearly showing a reduction of the porosity, induced by an increase in the volume of the individual particles as well as by an overall compaction of the sample.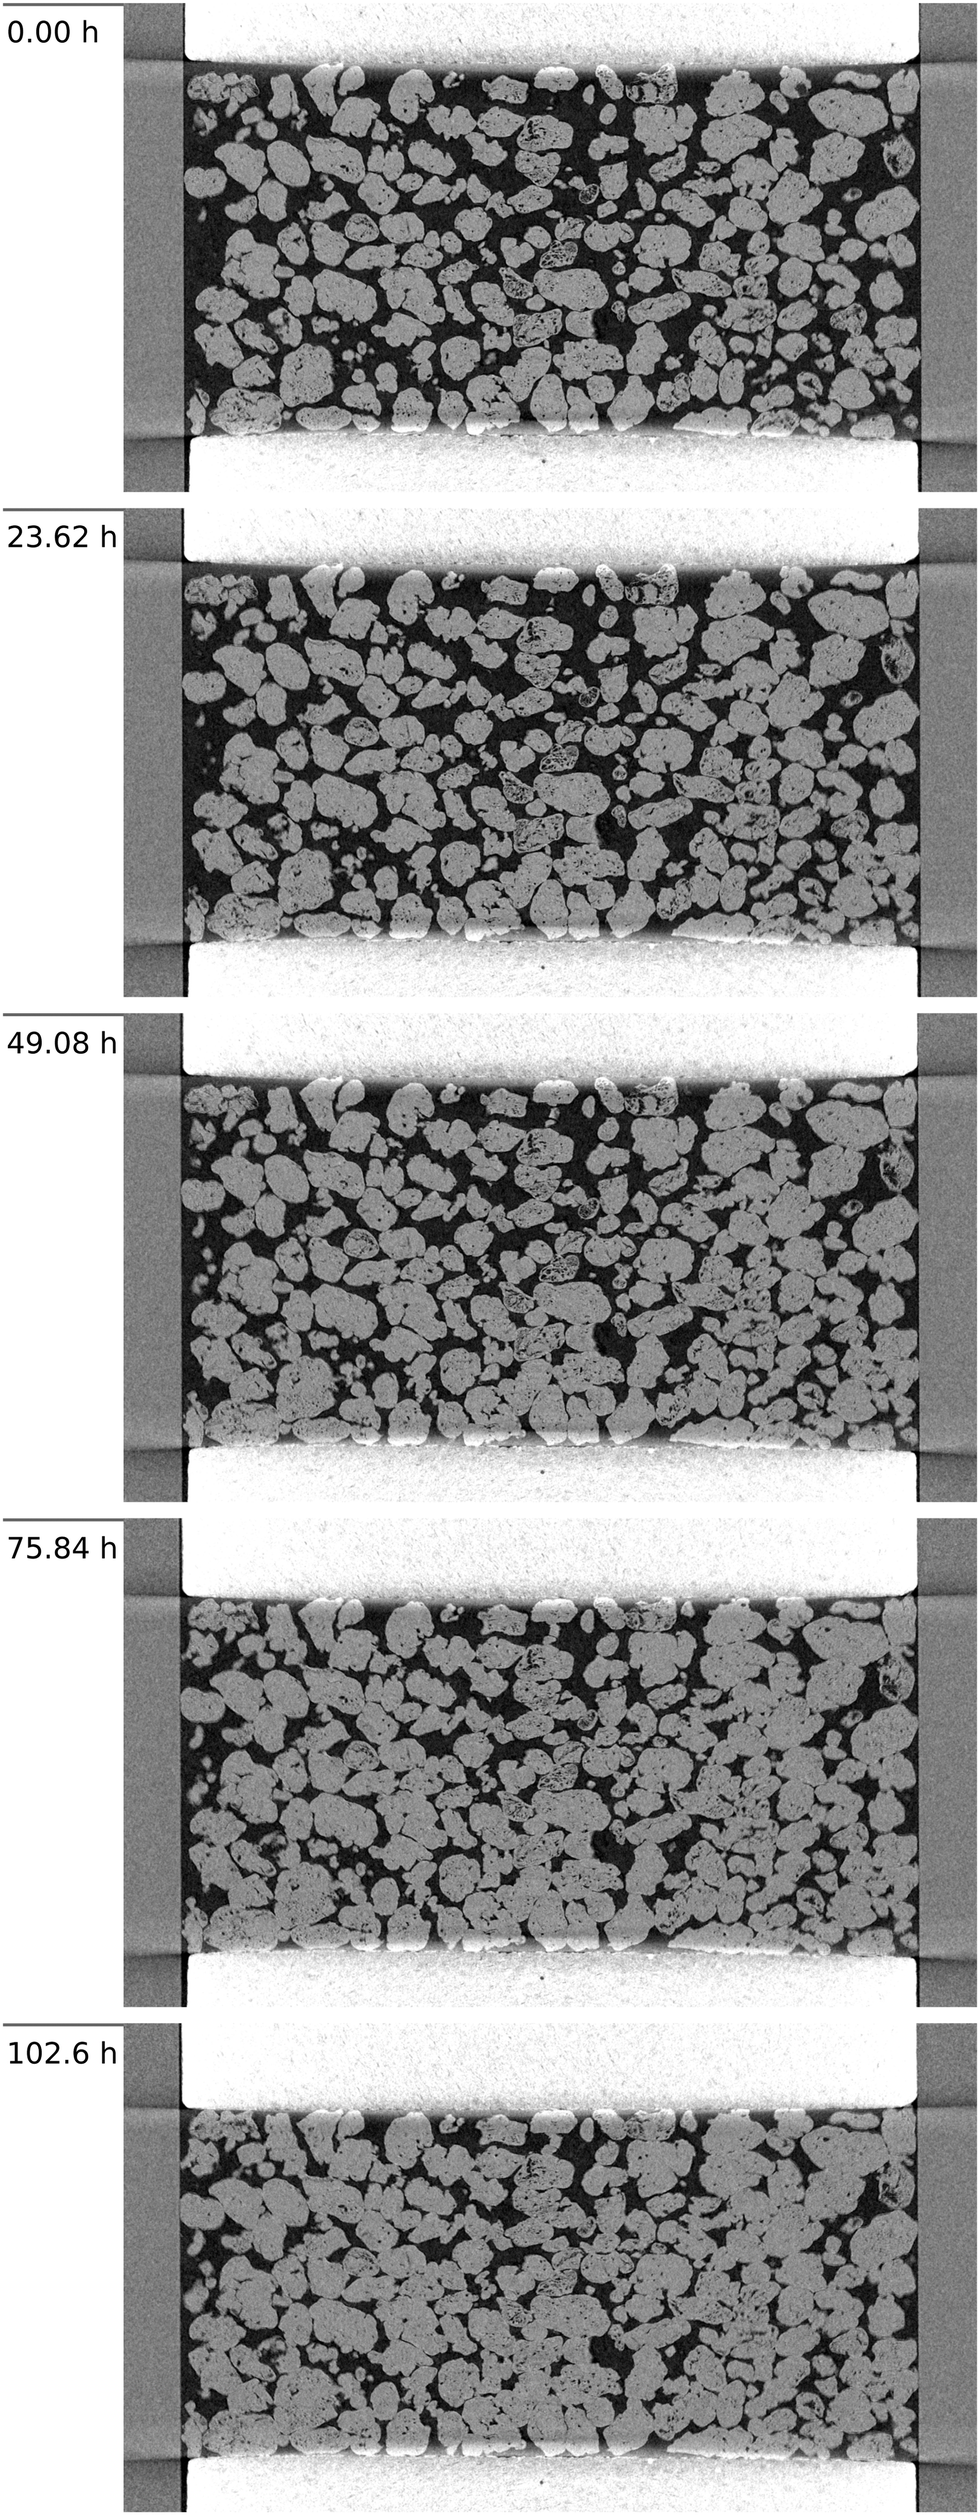 | ||
| Fig. 2 Vertical slices of 3D grey-scale images of the couscous sample at (from top) 0, 23.62, 49.76, 75.84 and 102.60 hours. The sample porosity decreases as the water adsorption makes the particles swell and become more deformable. | ||
These reconstructions are simply 3D matrices of attenuation coefficients re-scaled to a 16-bit range. Brighter grey-values are associated with higher attenuation.
The intensity of the X-rays can slightly fluctuate during an experiment, because of minor variations in the X-ray setup. This can be easily compensated assuming that the attenuation of air and of PEEK is constant across the test.
Fig. 3 shows the histograms of grey-values of the images at different time steps. Each distribution is characterised by two main peaks, corresponding to air and the granular phase, at low and high attenuation/grey-values, respectively. Along the test, the particle swelling and overall sample compaction correspond to a reduction of the counts probability of grey-values typical of voids, matched by a corresponding increase of the solid phase. The peak corresponding to the solid can also be observed to drift to lower values, indicating a progressive decrease in particle density. Nonetheless, the overall sample mass increases by 15% along the test (as measured on a scale before and after the test), due to an increase in water content. This should lead to an increase in its grey-values, albeit of modest extent given the very low attenuation of water to X-rays. It can be deduced that the particle dilation is large enough to compensate for this expected increase, resulting in an overall reduction in attenuation. The particle swelling can also be directly measured from the images, as detailed later.
 | ||
| Fig. 3 Probability distribution of grey values of few sequential scans (at 0, 23.62, 49.08, 75.84, and 102.6 h). The probability of finding a voxel belonging to the solid/granular phase increases along the test, while the opposite happens for the void phase. It is noted that low grey-values correspond to dark voxels in Fig. 2, and vice versa for the high grey-values, which correspond to particles/porous stones. | ||
3.2 Macroscopic sample response
To study the volumetric response of the sample two aspects are of interest, the evolving porosity and the overall sample compaction/dilation. To study the former it is first necessary to identify the granular phases i.e., to “binarise” the sample into void and solid phase. In this case the grey-values of the two phases are sufficiently different from each other so that histogram-based techniques are sufficient for this operation. To determine the threshold distinguishing them, Otsu's method (an approach that minimises the variance between the two classes of voxels) can be applied for the first volume at t = 0 h and then maintained throughout the test, since X-ray fluctuations are compensated – see Section 3.1. Once these two phases are differentiated, it is relatively straightforward to measure several properties of the sample, such as the inter-particle porosity, defined as the ratio between the number of “void” voxels outside the grains and the total number of voxels. The evolution of the porosity along the test is reported in blue in Fig. 4, and can be observed to decrease monotonically with time. | ||
| Fig. 4 Sample porosity and volumetric strain evaluations plotted with time. A comparison is made between the average particle and the sample dilation. Despite the monotonic swelling of single particles the sample compacts under the constant stress applied as the increasing water content makes couscous more deformable. | ||
Digital volume correlation (DVC) can be used to measure the displacement field in the sample and thus its deformation gradient F. In this work the non-rigid registration implemented in spam24 is employed to compute the deformation at each time step with respect to the initial state. Notably, the volumetric strain εv is measured as det(F) − 1, and is also shown (plain red line) in Fig. 4.
Unlike porosity, the volumetric strain does not change monotonically during the test. At first, in fact, the sample expands by up to 2.7%, followed by a compaction phase resulting in an overall 5.3% volume reduction, i.e., an 8% compaction from the maximum volume. A possible interpretation of this behaviour is that, while particles with a similar chemo-hydro-mechanical response have a natural tendency to immediately swell in contact with humidity as observed in single-particle studies7,8,9 the variation of their mechanical properties is delayed (as suggested by ref. 12). This induces a competition between the particles’ natural tendency to swell, which causes the observed initial expansion, and progressive loss of stiffness and strength which yields an overall compaction under the constant applied load.
3.3 Particle-scale response
The spatial resolution of the images is specifically designed to allow the measurement of the kinematics of the individual particles, their deformation, as well as the evolution of the inter-granular contacts. The latter will be discusses in the following Section 3.4.To follow the kinematics of the individual particles it is first necessary to distinguish and assign them a unique label (in this case, an incremental number). This process is sometimes referred to as labelling.†
Starting from the binary image a distance map can be computed. To each peak of this map is assigned a “seed point”, corresponding to the centre of a particle, which acts as the flooding point of a watershed algorithm25 as implemented in ref. 24. Ultimately the result of this chain of operations is a matrix where each of the 2230 particles comprising the image is individually labelled. A 3D rendering of the final result is shown in Fig. 5.
 | ||
| Fig. 5 3D illustration of the labelled couscous sample. Every single particle has its own label and its kinematics is followed throughout the experiment. | ||
The labelled image of the initial configuration of the sample (dry conditions) is essential to track all particles and measure their kinematics throughout the 4 days of testing. Particle kinematics is measured through discrete digital volume correlation (dDVC), a technique used in granular media for the first time by Hall et al.26 in 2010 and now implemented in spam.27 This technique uses the labelled image to create sub-volumes of the reference image and independently performs DIC of each one of these subsets (corresponding to individual particles), measuring for each the displacement vector and interpolating neighbouring nodes to deduce the gradient tensor of each sub-volume. The operation is always performed between the initial reference state and the current one. To accelerate and guide this process, the kinematics measured in the previous step is used as a first guess. In the test presented herein, convergence is reached for all of the 2230 particles, quantifying the displacement, rotation, as well as the internal deformation of each one of them. This information can also be used to guide the labelling process of subsequent scans. The underlying watershed operation can in fact become more cumbersome as the surface of contact between particles increases and the particles start to merge. The moved particles are here instead used as “seeds” to start the watershed algorithms, under the assumption of quasi-staticity of the process.
From these sequentially labelled images the volume of each labelled particle can be measured by simply counting the number of voxels comprising it at a given time, thus allowing the computation of the grain-scale volumetric strain. Its evolution can then be compared to the macroscopic volumetric evolution discussed in Section 3.2. Fig. 4 shows how all particles dilate monotonically throughout the test (dashed red line), prompting the initial expansion of the sample, and keep dilating even while the sample macroscopically compacts. The particles dilate by about 20%, significantly less than that in free-swelling conditions (where particles can increase by up to 400% under fully submerged conditions, for example De Richter (2022)28).
Finally, the spatial distribution of particle swelling and volumetric strain across the sample can be investigated. By “colouring” each particle with a value proportional to its volumetric strain at a given time the spatial fluctuations of grain-scale dilation can be observed – see Fig. 6. Specifically, the particles closer to the bottom (i.e., closer to the point of injection of high RH air) swell earlier than the rest, highlighting a gradient of dilation that could be associated with a gradient of water-content. This heterogeneity appears to fade towards the end of the test.
 | ||
| Fig. 6 Maps of the volumetric strain of individual particles throughout the test. A vertical gradient in particle swelling is apparent, with the particles closer to the high RH air injection point dilating earlier than others. | ||
3.4 Inter-particle contacts analysis
Particle dilatation and higher deformability are key underlying particle-scale processes driving macroscopic agglomeration. Together they induce the macroscopic response detailed in Section 3.2. This also corresponds to larger contact areas between particles, which in turn increase the adhesion between the particles. This likely contributes to the observed increase of overall cohesion of the assembly as well as of the overall cake strength, depending also on the water content of the material.2,6Given that each individual particle can be tracked throughout the test, the presented dataset also allows the analysis of the evolution of the number of contacts and their areas along the test. A first rough estimate of the contact of a particle to its neighbours can be obtained by simply dilating once (thus adding a 1-voxel thick layer) the labelled particle and verifying which other particles it is intersecting. However, it was observed that a simple use of labelled images as a reference results in an overestimation of the number of actual contacts.29 Specifically, it was observed that when thresholding particles, the threshold chosen is generally slightly overestimated, thus spuriously increasing their volume and thus their contacts. While the effect on particle volumes is generally negligible, the effect on the contact area can be more significant. To compensate this, and to reduce erroneously attributed contacts, the local grey-value threshold in the normalised histogram is here increased from 0.55 to 0.65 (where the void peak is set to 0.25 and the solid to 0.75), close to the value optimised for spheres.29
Fig. 7 reveals a monotonic increase of the number of contacts in the assembly along the test.
 | ||
| Fig. 7 Number of contacts detected during the 103 hours of testing. | ||
It should be noted that all contacts between particles both belonging to horizontal layers at the ends of the sample are not taken into account for the following analysis, because of the artefacts caused by interaction of the conic beam with the highly attenuating porous stones (compared to the particles or the PEEK cell, see Fig. 2).
Beside counting the number of contacts, it is of interest to study the evolution of the contact areas. To determine the number of voxels belonging to the detected contacts, the reference label can be dilated once to determine the number of voxels now intersecting the neighbouring particle. This can of course be then converted into mm2 considering the voxel size.
Fig. 8 presents the measured evolution of the contact areas throughout the test. The median area of contact increases monotonically with time, and so does also the variance. The area of existing contacts generally always increases, but at the same time new contacts are established and they generally start as small contacts (≈1 voxel).
 | ||
| Fig. 8 Box and whisker plots representing the increase of contact areas of the particle network along time as well as their standard deviation. The black line indicates the median measured value at different time-steps. | ||
The contact area growth is influenced by several factors, such as the water-content of the particle as well as its boundary conditions, and may vary depending on the particle position inside the sample. To analyse possible inhomogeneities a new variable Ai is here proposed. For each subset i of the sample, Ai(t) can be calculated as the ratio between the median area within the region at time t and the median across the sample at the same time:
 | (1) |
 | ||
| Fig. 9 Evolution of the median area ratio Ai in concentric radial rings. This reveals a modest influence of the radial position in the sample. | ||
Another geometrical factor that could influence the contact area growth is the vertical position of the contact, i.e., its distance from the injection point. Fig. 10 shows the evolution of Ai at five different elevations, indicating that there are significant differences in the way the contact area evolves, depending on the vertical position, and notably the injection point, highlighted in Fig. 10. Here the variation of Ai is far more significant. While starting with comparable values, the contact areas in the bottom region (blue and light blue) increase more rapidly than elsewhere in the sample. This is consistent with the more pronounced dilation measure in the bottom of the sample, see section 3.3. This suggests that particles closer to the injection point swell earlier, showing a faster increase of contact area. However, later in the test, and specifically during the compaction stage, this tendency is inverted and the top subsets (red and pink lines) Ai exhibit an increase of contact areas. The central subset Ai (grey) remains essentially constant along the test, due to its longer distance from the injection point and presumably a lower stress as the upper particles partially unload on the walls of the outer PEEK cell.
 | ||
| Fig. 10 Evolution of the median area ratio Ai along the height of the sample. Contact areas closer to the high RH air injection point initially increase faster than the rest of the sample. The tendency is then inverted during the macroscopic compression stage. | ||
Once the contacts have been detected, it is possible also to study their orientation adopting the random walker algorithm, as implemented in spam.30 This orientation can be described by the unit normal vector to the plane interpolating the contact surface. For example an horizontal contact would have an orientation vector coaxial to the vertical axis.
The frequency of contact orientation vectors can be represented using a spherical histogram.24 This simply represents the frequency of contact orientations falling within a solid angle, represented as a pyramid pointing towards the centre of the plot and whose height is proportional to their occurrence. The histograms in Fig. 11 show that under dry conditions there is a higher occurrence of horizontal contact (i.e., vertical vectors). This anisotropy progressively fades as new contacts are generated, up to an essentially isotropic distribution.
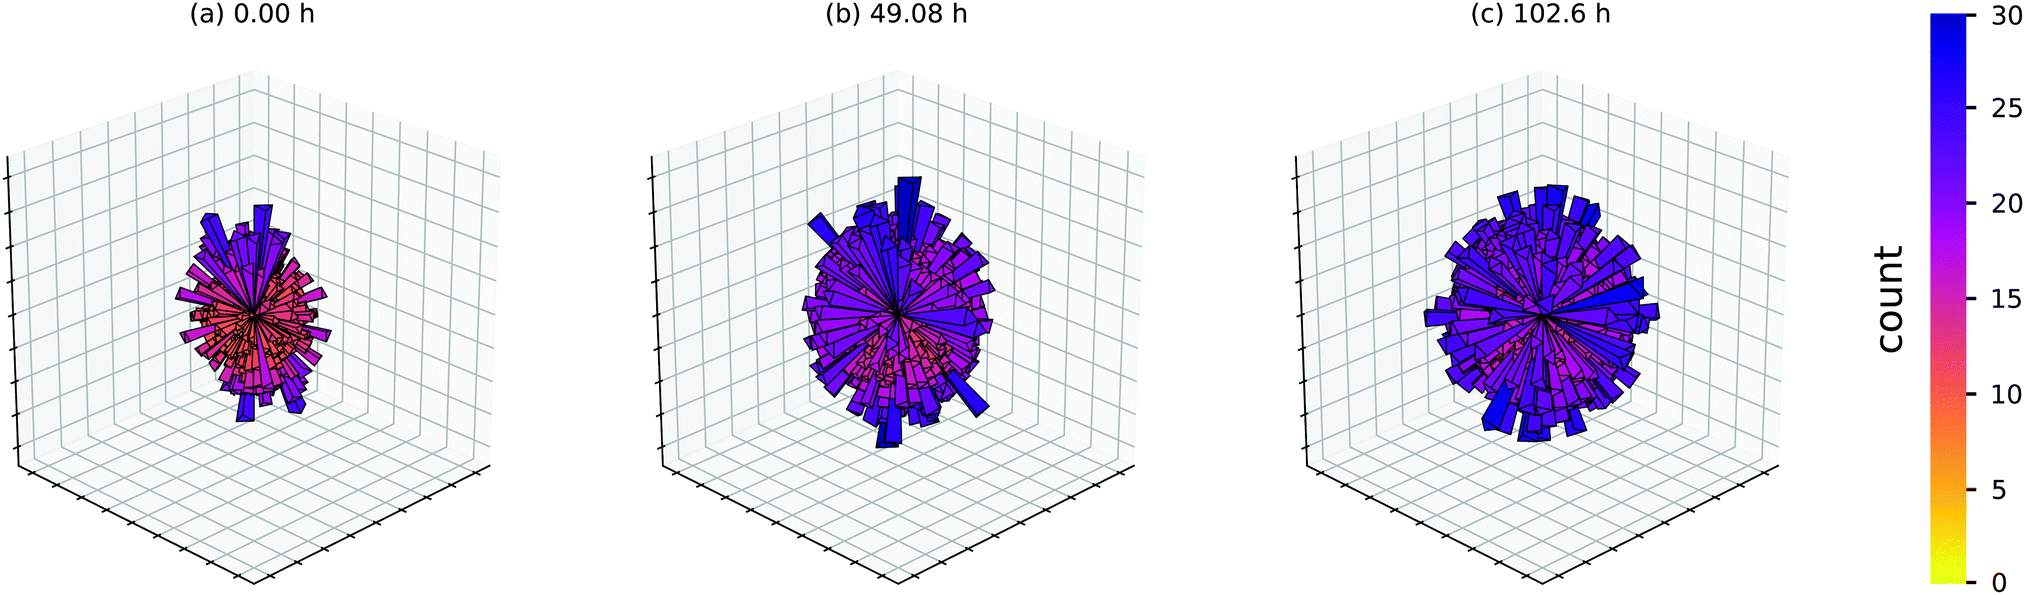 | ||
| Fig. 11 Spherical histogram of inter-particle contacts under dry conditions (0.0 hours) and after high RH injection at 49.08 and 102.60 hours. The slight contact orientation anisotropy at the beginning of the test disappears as new contacts are generated. | ||
It is also interesting to observe that contact orientation affects the contact area growth. To study this, contacts are classified into three groups based on their acute angle θ with respect to the vertical axis. Each group covers 30° as sketched in Fig. 12.
 | ||
| Fig. 12 2D sketches of the contact orientation angles with respect to the vertical axis, grouped here in three: 0° ≤ θ ≤ 30°, 30° < θ ≤ 60° and 60° < θ ≤ 90°. | ||
Fig. 13 shows that initially sub-horizontal contacts have larger areas, which combined with the higher frequency of this subgroup (Fig. 11) suggests an influence of the boundary conditions and ensuing stress transmission. However, while the sample is expanding (i.e., before the particles become more deformable), the difference in total number of contacts between the subgroups does not influence their trend, as their Ai values remain rather constant. However, as soon as the sample starts compacting, sub-horizontal contacts make up a progressively larger fraction of the overall contact area. This indicates how the areas of the contacts coaxial to the loading direction tend to grow more than others. Sub-vertical contacts progressively make up a smaller fraction of the total, while the intermediate ones tend to increase once the sub-vertical ones level off.
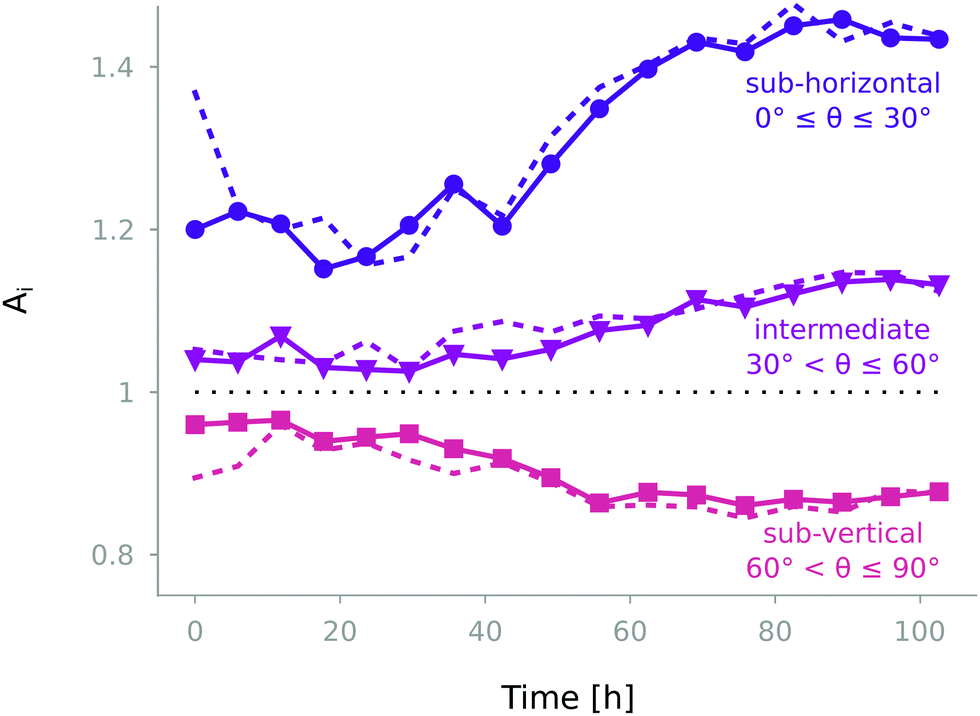 | ||
| Fig. 13 Evolution of the median area ratio Ai for the three chosen contact orientation subsets. Sub-horizontal contacts are the largest and tend to increase during compaction, while the opposite behaviour is observed for sub-vertical contacts. The same analysis is also performed only for persistent contacts (dashed lines). The evolution of Ai does not vary significantly, except for the initial values under dry conditions, proving that the initial contact anisotropy does not affect the load-dependent increase of contact areas. | ||
The analysis is then repeated only for the persistent contacts (i.e., contacts that persist throughout the whole test). As shown in Fig. 13 with dashed lines, the evolution of the median ratio of each orientation sub-group does not differ from the non-persistent ones. Moreover, under dry conditions, sub-horizontal contacts have a larger total area (as discussed earlier, Fig. 11). The difference mitigates during macroscopic dilation and it emerges again with the following compaction. This again suggests how the increase of sub-horizontal contact areas is induced by the direction of the applied stress, but only during the compaction stage.
4 Conclusions and perspectives
This experimental study attempts to study the panoply of complex particle-scale processes occurring in water-sensitive materials exposed to relatively high humidity, and to connect them to volumetric response at the macro level, i.e., at the scale of a particle assembly. To the best of authors’ knowledge this is the first attempt at following a particle assembly and connecting a particle-scale non-trivial macroscopic response.Macroscopically, the sample gains mass through water adsorption. Overall, the samples undergo an initial dilation followed by compaction, as the couscous particles become more deformable with higher water content. The individual particles agglomerate into a caked pellet, thus losing their discrete granular nature which drives their response under dry conditions.
The particle-scale measurements presented herein provide a unique insight into the particle-scale processes thanks to the use of X-ray micro tomography. Bespoke algorithms are adapted or developed to quantify two key aspects: inter and intra-granular volumetric responses and contact fabric evolution.
Couscous particles swell throughout the entire test. Nonetheless, after a certain humidity is adsorbed, they become more deformable. This competition is at the root of the aforementioned inversion in macroscopic volumetric response. The sample compaction adds to the particle swelling to induce a monotonic decrease of porosity. The particle volumetric strain is found to be heterogeneous, perhaps induced by the imposed slow air flow, yielding a vertical swelling gradient from the injection point. The inter-particle contact network is one of the main factors influencing the final agglomeration of the sample. Coherently with the particle expansion and macroscopic volumetric response, the total number of contacts increases during the test, as does their area. The radial position of the contacts is found to play a minor role, while their vertical position is observed to influence the speed of contact area expansion.
The contact network is slightly anisotropic at the beginning of the test, albeit it transitioned to isotropic along the test. Nonetheless, the area of sub-horizontal contacts, aligned transversely to the loading direction, is systematically larger than those of the rest and increases along the test. Future research will investigate the relationship between particle swelling and the water-content, by means of neutron tomography or magnetic resonance imaging (MRI). Furthermore, to better understand the caking phenomenon of the material, it is necessary to quantify its mechanical properties at both the particle and macroscopic scales. Compression tests will be run to assess the effective agglomeration/cohesion of the sample, together with particle-to-particle tests to determine the individual bond strength. These measurements, besides the kinematics presented in this article, will give essential information to implement and calibrate numerical models, so as to investigate other features of caking and hopefully predict its occurrence.
Author contributions
I. Vego: writing – original draft, visualization, methodology, investigation, conceptualization, data curation, and software. A. Tengattini: writing – original draft, validation, supervision, methodology, investigation, conceptualization, and data curation. E. Andò: writing – review and editing, software, and funding acquisition. N. Lenoir: investigation, methodology, and resources. G. Viggiani: writing – review and editing, validation, supervision, conceptualization, methodology, and funding acquisition.Conflicts of interest
There are no conflicts to declare.Acknowledgements
Laboratoire 3SR is part of the LabEx Tec 21 (Investissements dAvenir – grant agreement n-11-LABX-0030). This project has received funding from the European Unions Horizon 2020 research and innovation program under the Marie Skłodowska-Curie grant agreement no. 812638 (CALIPER).References
- D. G. Fredlund and H. Rahardjo, Soil mechanics for unsaturated soils, John Wiley & Sons, 1993 Search PubMed.
- J. Aguilera, J. del Valle and M. Karel, Trends Food Sci. Technol., 1995, 6, 149–155 CrossRef CAS.
- K. Brockbank, B. Armstrong and J. Clayton, Particuology, 2021, 56, 75–83 CrossRef CAS.
- A. Crouter and L. Briens, AAPS PharmSciTech, 2014, 15, 65–74 CrossRef CAS PubMed.
- J. J. Fitzpatrick and L. Ahrné, Chem. Eng. Process., 2005, 44, 209–214 CrossRef CAS.
- U. Zafar, V. Vivacqua, G. Calvert, M. Ghadiri and J. S. Cleaver, Powder Technol., 2017, 313, 389–401 CrossRef CAS.
- M. Amin, M. Hossain and K. Roy, J. Food Eng., 2004, 65, 83–87 CrossRef.
- T. Morita and R. P. Singh, Trans. ASAE, 1979, 22, 630–636 Search PubMed.
- A. Tabatabaeefar, Int. Agrophys., 2003, 17, 207–211 Search PubMed.
- L. Shi, Y. Feng and C. C. Sun, Int. J. Pharm., 2011, 416, 43–48 CrossRef CAS PubMed.
- J. Figueroa, Z. Hernández, M. Véles, P. Rayas-Duarte, H. Martnez-Flores and N. Ponce-Garca, Cereal Chem., 2011, 88, 12–18 CrossRef CAS.
- G. Glenn, F. Younce and M. Pitts, J. Cereal Sci., 1991, 13, 179–194 CrossRef.
- G. Kamst, C. Bonazzi, J. Vasseur and J. Bimbenet, Trans. ASAE, 2002, 45, 145 Search PubMed.
- T. Sasaki and J. Matsuki, Cereal Chem., 1998, 75, 525–529 CrossRef CAS.
- I. Siddiqui, S. Yiu, J. Jones and M. Kalab, Food Struct., 1986, 5, 17 Search PubMed.
- A. D. Sharma and O. R. Kunze, Trans. ASAE, 1982, 25, 465–468 Search PubMed.
- E. Emery, J. Oliver, T. Pugsley, J. Sharma and J. Zhou, Powder Technol., 2009, 189, 409–415 CrossRef CAS.
- E. Juarez-Enriquez, G. Olivas, P. Zamudio-Flores, E. Ortega-Rivas, S. Perez-Vega and D. Sepulveda, J. Food Eng., 2017, 205, 12–17 CrossRef CAS.
- J. Fitzpatrick, M. Hodnett, M. Twomey, P. Cerqueira, J. O’flynn and Y. Roos, Powder Technol., 2007, 178, 119–128 CrossRef CAS.
- G. Lumay, K. Traina, F. Boschini, V. Delaval, A. Rescaglio, R. Cloots and N. Vandewalle, J. Drug Delivery Sci. Technol., 2016, 35, 207–212 CrossRef CAS.
- N. Christakis, J. Wang, M. Patel, M. Bradley, M. C. Leaper and M. Cross, Adv. Powder Technol., 2006, 17, 543–565 CrossRef CAS.
- L. Greenspan, et al. , J. Res. Natl. Bur. Stand., 1977, 81, 89–96 CrossRef.
- L. A. Feldkamp, L. C. Davis and J. W. Kress, J. Opt. Soc. Am. A, 1984, 1, 612–619 CrossRef.
- O. Stamati, E. Andò, E. Roubin, R. Cailletaud, M. Wiebicke, G. Pinzon, C. Couture, R. C. Hurley, R. Caulk and D. Caillerie, et al. , J. Open Source Softw., 2020, 5, 2286 CrossRef.
- S. Beucher, Proceedings of the International Workshop on Image Processing, 1979.
- S. A. Hall, M. Bornert, J. Desrues, Y. Pannier, N. Lenoir, G. Viggiani and P. Bésuelle, Géotechnique, 2010, 60, 315–322 CrossRef.
- J. Dijkstra, E. Andò and C. Dano, E3S Web Conf., 2019, 01001 CrossRef.
- S. K. De Richter, N. Gaudel, C. Gaiani, A. Pascot, M. Ferrari and M. Jenny, J. Food Eng., 2022, 319, 110910 CrossRef.
- M. Wiebicke, E. Andò, I. Herle and G. Viggiani, Meas. Sci. Technol., 2017, 28, 124007 CrossRef.
- C. Jaquet, E. Andó, G. Viggiani and H. Talbot, International Symposium on Mathematical Morphology and Its Applications to Signal and Image Processing, 2013, pp. 452–463.
Footnote |
| † It should be noted that, while the ‘labelling’ naming convention is widespread, it is not universally accepted. This procedure, together with the aforementioned segmentation are at times collectively referred to as segmentation. |
| This journal is © The Royal Society of Chemistry 2022 |