 Open Access Article
Creative Commons Attribution 3.0 Unported Licence
Finite-size scaling and thermodynamics of model supercooled liquids: long-range concentration fluctuations and the role of attractive interactions†
Atreyee
Banerjee‡
 *,
Mauricio
Sevilla‡
 ,
Joseph F.
Rudzinski
 and
Robinson
Cortes-Huerto
 *
*
Max Planck Institute for Polymer Research, Ackermannweg 10, 55128 Mainz, Germany. E-mail: banerjeea@mpip-mainz.mpg.de; corteshu@mpip-mainz.mpg.de
First published on 2nd March 2022
Abstract
We compute partial structure factors, Kirkwood–Buff integrals (KBIs) and chemical potentials of model supercooled liquids with and without attractive interactions. We aim at investigating whether relatively small differences in the tail of the radial distribution functions result in contrasting thermodynamic properties. Our results suggest that the attractive potential favours the nucleation of long-range structures. Indeed, upon decreasing temperature, Bathia-Thornton structure factors display anomalous behaviour in the k→0 limit. KBIs extrapolated to the thermodynamic limit confirm this picture, and excess coordination numbers identify the anomaly with long-range concentration fluctuations. By contrast, the purely repulsive system remains perfectly miscible for the same temperature interval and only reveals qualitatively similar concentration fluctuations in the crystalline state. Furthermore, differences in both isothermal compressibilities and chemical potentials show that thermodynamics is not entirely governed by the short-range repulsive part of the interaction potential, emphasising the nonperturbative role of attractive interactions. Finally, at higher density, where both systems display nearly identical dynamical properties and repulsive interactions become dominant, the anomaly disappears, and both systems also exhibit similar thermodynamic properties.
1 Introduction
The supercooled state challenges our understanding of the theory of liquids. In particular, the connection between dynamics, which varies considerably upon supercooling, and structure, which appears to remain essentially unchanged, is the subject of intense research.1–7 Model systems with reduced complexity, still retaining essential physical features, provide a direct route to investigate this problem. For example, Kob–Andersen mixtures8 with purely repulsive Weeks-Chandler-Andersen interactions (KAWCA)9 exhibit substantially different dynamics compared to their Lennard-Jones counterpart (KALJ).8 By contrast, their structure, investigated from the point of view of radial distribution functions, is somewhat similar.7,10The connection between pair correlations and dynamical properties has been extensively investigated.10,11 On the one hand, a variety of studies conclude that two-body contributions are not enough to account for the difference in dynamics between the KAWCA and KALJ systems. Perhaps the most well-known example is mode-coupling theory, based on pair correlation functions, which underestimates these dynamical differences.10 Additionally, deviations in many-body structural descriptors such as triplet12 and point-to-set correlations,13 as well as bond-order distributions14 and the packing capabilities of local particle arrangements,2 have been observed between the KALJ and KAWCA systems. These results indicate that higher-order features may be necessary to resolve the difference in their dynamical properties.15
On the other hand, several studies indicate that two-body structure is enough to describe particular aspects of the dynamics of model supercooled liquids. For example, features based on the pair structure have been used to predict diffusion constants from short-time trajectories of the KALJ model.16–18 Concerning the comparison between models, Bhattacharyya and coworkers19,20 directly explored structure-dynamics relationships in KALJ and KAWCA systems. In particular, they used the Adam–Gibbs relation,21 to connect relaxation time to the configurational entropy. Their results demonstrated that the two-body contribution to the entropy plays a significant role in distinguishing the dynamics of the two systems.
To further contribute to the discussion, recent research efforts have focused on the detailed characterization of the liquid's two-body structure. In particular, softness parameters, defined via weighted integrals of pair-correlation functions4,22 or multi-dimensional integrals of partial structure factors,23 respond to minor structural changes and can accurately describe dynamical differences. However, either non-trivial reweighting procedures or combinations of local and nonlocal terms prevents an unambiguous identification of the dominant, short- versus long-range, contributions to the resulting structure-dynamics relationship.
The potentially dominant role of short-range pair correlations brings with it yet another dilemma. According to perturbation theory, short-range repulsive interactions mostly dominate the liquid's structure.9 By contrast, based on Kirkwood–Buff theory,24 long-range fluctuations in the tail of the pair correlation function have a significant effect on the system's solvation thermodynamics.25–29 The studies mentioned above investigating KALJ and KAWCA dynamics have mainly focused on short-range contributions. Nevertheless, evidence for the nucleation of long-range structures in glassy systems at low temperatures30–33 highlights the necessity to carefully address this point. Finite-size effects present in computer simulations dramatically affect the tail of the pair correlation function and the k→0 limit of the structure factor, i.e., the long-range structure properties, which in turn sensitively impact thermodynamic quantities. Consequently, a careful evaluation of finite-size effects becomes critical for investigating these properties in the supercooled regime.
In this paper, we investigate various thermodynamic properties of KALJ and KAWCA a–b mixtures in the supercooled liquid state. We calculate structure factors of density, Sρρ(k), and concentration, Scc(k), while highlighting the k→0 limit. The KALJ liquid exhibits anomalous behaviour reflected in a major increase in concentration fluctuations. This anomaly closely resembles the nucleation of nanometric clusters reported by Fischer in low-temperature ortho-terphenyl,30,31 and it has been recently identified as a general feature present in polydisperse colloidal models.5 By contrast, the purely repulsive KAWCA system remains perfectly miscible in the supercooled state. A finite-size Kirkwood–Buff analysis confirms this picture by enabling the precise identification of the k→0 limit. Furthermore, we show that the isothermal compressibility and chemical potential of the two models exhibit similar trends with temperature, apart from constant shifts. These differences highlight the nonperturbative role of attractive interactions in the system. To sum up, we demonstrate that seemingly small differences in the tail of the radial distribution function result in significantly different structural and thermodynamic properties for supercooled systems with and without attractive interactions.
The paper is organised as follows: we provide the computational details in Section 2, present the results in Section 3 and conclude in Section 4.
2 Computational details
We have simulated the Kob–Andersen model, which is a binary mixture (80![[thin space (1/6-em)]](https://www.rsc.org/images/entities/char_2009.gif) :
:![[thin space (1/6-em)]](https://www.rsc.org/images/entities/char_2009.gif) 20) of Lennard-Jones (KALJ) particles.8 The inter-atomic pair potential between species α and β, Uαβ(r), with α,β = a,b is described by a shifted and truncated Lennard–Jones potential,34 as given by:
20) of Lennard-Jones (KALJ) particles.8 The inter-atomic pair potential between species α and β, Uαβ(r), with α,β = a,b is described by a shifted and truncated Lennard–Jones potential,34 as given by: | (1) |
We have performed two different sets of simulations: the first for the calculation of structural properties, and the second for the calculation of chemical potentials, which employed a different box geometry and number of particles. All simulations have been carried out using the LAMMPS molecular dynamics software.35 We have performed the first set of simulations in a cubic box with periodic boundary conditions in the canonical ensemble (NVT), using the Nosé–Hoover thermostat36 with an integration timestep of 0.005τ and a time constant of 100 timesteps. The system is composed of N = 23![[thin space (1/6-em)]](https://www.rsc.org/images/entities/char_2009.gif) 328 particles, with Na = 18
328 particles, with Na = 18![[thin space (1/6-em)]](https://www.rsc.org/images/entities/char_2009.gif) 664 particles of type a. We have simulated this system at two different densities, ρ = 1.2/σ3 and 1.6/σ3 for different temperatures. Starting from the high temperature case, the final configuration of the simulation has been used as an initial configuration for the simulation one (temperature) step below. The same procedure has been followed for the KALJ and KAWCA systems. For all state points, three to five independent simulations with run lengths >100τα (τα is the α-relaxation time estimated from ref. 20) have been performed.
664 particles of type a. We have simulated this system at two different densities, ρ = 1.2/σ3 and 1.6/σ3 for different temperatures. Starting from the high temperature case, the final configuration of the simulation has been used as an initial configuration for the simulation one (temperature) step below. The same procedure has been followed for the KALJ and KAWCA systems. For all state points, three to five independent simulations with run lengths >100τα (τα is the α-relaxation time estimated from ref. 20) have been performed.
To calculate the excess chemical potential, we have used the LAMMPS35 implementation of SPARTIAN already described in ref. 37. The SPARTIAN method, a variant of the adaptive resolution method,38–43 simulates the coexistence of an atomistic system to its ideal gas representation at a constant density and temperature. We have computed the excess chemical potential of the system as the external potential required to balance the density across the simulation box. To guarantee enough statistics, we have used a slab geometry (An anisotropic box with Lx = 36σ, Ly = 578σ and Lz = 10σ), also with periodic boundary conditions and at density ρ = 1.2/σ3, resulting in a system with N = 2![[thin space (1/6-em)]](https://www.rsc.org/images/entities/char_2009.gif) 50
50![[thin space (1/6-em)]](https://www.rsc.org/images/entities/char_2009.gif) 000 and Na = 2
000 and Na = 2![[thin space (1/6-em)]](https://www.rsc.org/images/entities/char_2009.gif) 00
00![[thin space (1/6-em)]](https://www.rsc.org/images/entities/char_2009.gif) 000. The same protocol as described above has been used to quench the system before performing the SPARTIAN calculation. For the SPARTIAN method calculation, we have considered an slab geometry with atomistic region of length of 10σ and hybrid regions of linear size 10σ aligned along the x direction.
000. The same protocol as described above has been used to quench the system before performing the SPARTIAN calculation. For the SPARTIAN method calculation, we have considered an slab geometry with atomistic region of length of 10σ and hybrid regions of linear size 10σ aligned along the x direction.
After equilibration, we have performed the SPARTIAN calculations in the canonical ensemble (NVT), using a Langevin thermostat with dt = 0.001τ and damping parameter of 10τ. In order to get the correct density profiles and therefore, chemical potential, we have simulated for 3 × 10⁶ simulation steps.
3 Results and discussions
3.1 Kirkwood Buff analysis
We consider temperatures in the range 0.45ε/kB ≤ T ≤ 6ε/kB for KALJ system and 0.3ε/kB ≤ T ≤ 6ε/kB for KAWCA system (see Section 2). Visual inspection of the radial distribution functions (RDFs) for both systems reveals that they are almost indistinguishable (Fig. S1, ESI†), and only the RDF gbb(r) for the minor component shows relatively small differences, visible at r <3σ (Fig. 1(a)).20,44 However, this direct comparison is misleading: a few thermodynamic quantities are quite sensitive to small fluctuations in the tail of the RDFs.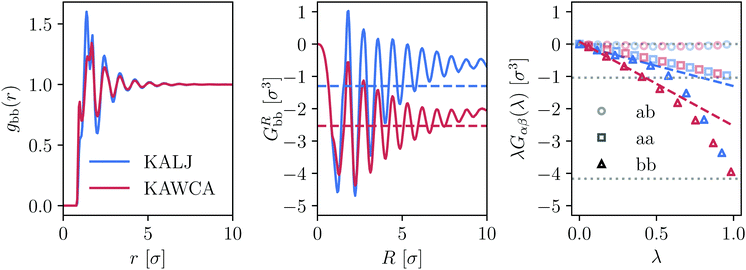 | ||
| Fig. 1 Differences between KALJ and KAWCA systems in terms of the gbb(r) component and the KBIs at T = 0.45ε/kB. (a) Differences between the RDF for the low-concentration b-component of the mixture seem to be small and mostly coming from the local structure of the fluid. (b) GRbb as obtained from eqn (3) shows a different short-range behaviour and, more importantly, the tails do not converge due to finite-size effects. (c) KBIs obtained using the method described in ref. 29 (eqn (4)). The KBIs in the thermodynamic limit G∞αβ are obtained from the slope of a linear fitting of the region 0 < λ < 0.3. This straight line is indicated for the bb case. Horizontal, dark lines correspond to the asymptotic limit −δαβ/ρα with δαβ the Kronecker delta and ρα the number density of the α-species. The G∞αβ values obtained in this way are plotted in panel (b) as horizontal lines. | ||
One such quantities are the Kirkwood–Buff integrals (KBIs),24 which relate the microscopic structure of a liquid mixture to its solvation thermodynamics. For a multi-component system of species α and β, in equilibrium at temperature T, the KBIs in the thermodynamic limit (TL) take the form
 | (2) |
 | (3) |
By explicitly including finite-size effects due to the thermodynamic ensemble and the finite integration domains, we compute the KBIs as29
 | (4) |
 , G∞αβ being the value of the KBIs in the thermodynamic limit, cαβ a constant with units of length, δαβ the Kronecker delta and ρα the number density of the α-species. We can compute Gαβ(λ), the KBIs for a subdomain of volume V inside a simulation box of volume V0, in terms of fluctuations of the number of particles25–29,45,46
 | (5) |
3.2 Density and concentration structure factors
As anticipated, fluctuations in the tail of the radial distribution function affect the long-range structure of the fluid. Hence, to investigate these effects, we compute partial structure factors | (6) |
 | (7) |
Partial structure factors are difficult to interpret for liquid mixtures. Hence, we focus on density, Sρρ(k), and concentration, Scc(k), structure factors48 which carry a direct physical meaning.49Sρρ(k) and Scc(k) describe the correlation of density and concentration fluctuations in the liquid mixture. They are defined as
 | (8) |
For large k-values, the behaviour of Sρρ and Scc is rather similar for both systems (see Fig. 2). This includes a first peak at k0 ≈ 7.13/σ, followed by a second peak at approximately 1.7k0 that develops at low temperatures. This second peak is associated with the nucleation of structural motifs that precede the complete crystallisation of the system. As it has been reported for various metallic glasses, the splitting of this second peak50 results from the optimal facet-sharing configurations of such structural (icosahedral and tetrahedral) motifs that grow upon decreasing temperature.51,52 In our particular case, we do not observe this feature down to T = 0.45ε/kB, thus confirming that both systems remain liquid-like. Concerning the difference between the KALJ and the KAWCA systems, the first and second peaks in the Scc show slightly more structure for the KALJ system at T = 0.45ε/kB, as expected from the RDF (see Fig. 1(a)).
 | ||
| Fig. 2 Density, Sρρ (top), and concentration, Scc (bottom), structure factors for both KALJ (blue) and KAWCA (red) systems for the temperatures considered here. | ||
Perhaps more interesting, it is apparent from the inset in Fig. 2 that the KALJ and KAWCA systems show substantially different behaviour in the region of small k (large r). On the one hand, the KAWCA liquid behaves like a normal liquid with monotonically decreasing density fluctuations upon decreasing temperature. On the other hand, the KALJ system exhibits anomalous behaviour, similar to SAXS curves obtained for ortho-terphenyl31 and supercooled water,53 with clear density fluctuations starting around k ∼ 2/σ (r ∼ 3σ) appearing at temperatures lower than the onset temperature of glassy dynamics T = 1ε/kB (see Fig. S2, ESI†).54 These results indicate that the two systems display stark structural differences in the supercooled regime, with clear long-range density domains (r >3σ) induced by the presence of attractive interactions in the KALJ mixture.
The extrapolation to the k→0 limit by using eqn (6) or (7) is not trivial because finite-size effects in the simulation affect the precision in computing structure factors as we approach the linear size of the simulation box. In the next subsection, we use the relation between the structure factor in the limit k→0 and the KBIs to investigate this limiting case in more detail.
3.3 KBIs and the k→0 limit
Similar to the single component case, the extrapolation to the k→0 limit provides useful physical information.50 Here, we use the relation between the limit k→0 in the structure factor, evaluated in eqn (6), and the KBIs in the thermodynamic limit, eqn (2). We obtain | (9) |
 | (10) |
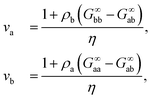
The last relation in eqn (10) gives two contributions that allows us to connect long-range density fluctuations to both the isothermal compressibility κT of the system and to concentration fluctuations modulated by the difference in partial molar volumes va − vb, with δ = ρ(va − vb).50 The isothermal compressibility and the partial molar volumes can also be written in terms of the KBIs, namely:
 | (11) |
 | (12) |
We use the definition in eqn (7) and (8) to compute Sρρ(k), and compare with the  obtained from the KBIs (eqn (10)). The results, presented in Fig. 3 (top panel), confirm the information given by the partial structure factors (see Fig. S2, ESI† for a comparison between the values obtained from the structure factor and the KBIs). Namely, in contrast to the KAWCA system, the KALJ system exhibits increasingly large density fluctuations upon decreasing temperature. To investigate the origin of the anomaly, we investigate the contributions to Sρρ separately as given by the r.h.s. of eqn (10). The middle and lower panels of Fig. 3 splits Sρρ into isothermal compressibility and concentration fluctuation terms, respectively. There, it is apparent that the anomalous behaviour exhibited by the KALJ system at low k values is due to the formation of long-range concentration domains (red and blue triangles). By contrast, the isothermal compressibility contribution remains nearly the same for both systems (red and blue circles).
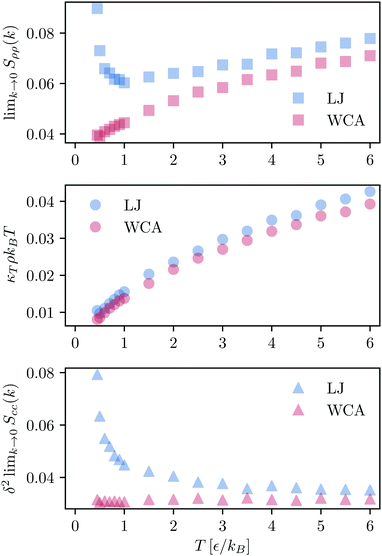 | ||
Fig. 3 Density–density correlation function Sρρ(k). (Upper panel)  obtained from the KBIs (eqn (10)). At high temperature, both systems present a similar monotonically decreasing behaviour upon decreasing temperature. At the onset temperature of glassy dynamics (T = 1ε/kB),54 the data for the KALJ system shows an inflexion point which signals density–density correlations visible for distances longer than r = 2.5σ. Individual components of obtained from the KBIs (eqn (10)). At high temperature, both systems present a similar monotonically decreasing behaviour upon decreasing temperature. At the onset temperature of glassy dynamics (T = 1ε/kB),54 the data for the KALJ system shows an inflexion point which signals density–density correlations visible for distances longer than r = 2.5σ. Individual components of  : (middle panel) κTρkBT and (lower panel) : (middle panel) κTρkBT and (lower panel)  with δ = ρ(va − vb) the product of the total density with the difference in partial molar volumes. It is apparent that the contrast in Sρρ originates from major concentration fluctuations present in the KALJ system, as indicated by Scc(k). with δ = ρ(va − vb) the product of the total density with the difference in partial molar volumes. It is apparent that the contrast in Sρρ originates from major concentration fluctuations present in the KALJ system, as indicated by Scc(k). | ||
The anomaly observed in the limit k→0 in Fig. 2 has also been reported in ref. 55. The authors suggest a plausible explanation involving the gas–liquid phase separation of the KALJ system. However, we note that the gas–liquid coexistence region for the KALJ system is still far from the point ρ = 1.2/σ3, T = 0.45ε/kB56,57 (see also the discussion in Section IV in ref. 55). Moreover, we observe the non-monotonic behaviour starting just below the onset temperature of glassy dynamics T = 1ε/kB, which is even farther away from the coexistence region. Moreover, the virial part of the pressure remains positive even at the lowest temperature considered for the KALJ model (see Fig. 1 in ref. 58 and Fig. S3, ESI†). For the KAWCA model, as expected, the system's pressure is systematically higher than the KALJ pressure due to the absence of attractive interactions. In general, the positive pressure of our simulated state points already suggests that the anomalous behaviour is not due to gas–liquid coexistence.
Plots of the excess coordination number (Nαβ = ρβG∞αβ), which gives the change in the number of α particles when one β particle is removed from the system, as a function of temperature provide a clear insight (see Fig. 4). As expected from the model, the effective interaction between a and b particles is favoured in both systems at all temperatures: excess coordination numbers are close to zero. Below the onset temperature of glassy dynamics, the excess coordination number shows a collective tendency for the KALJ mixtures to increase b–b effective interactions upon cooling. This tendency is not apparent for the a particles because they are the majority component in the mixture. More importantly, this demixing propensity is not observed in the KAWCA case. We underline here that these concentration domains for the KALJ system resemble the behaviour discovered by Fischer30 for supercooled ortho-terphenyl. Namely, anomalies in the structure factor at low k-values, which are not commensurate with the isothermal compressibility, are connected to the nucleation of nanometric structures.59 Furthermore, our results agree with recent theoretical efforts demonstrating that the low k portion of the structure factor for polydisperse colloidal systems can be separated into a compressibility contribution and a term related to composition fluctuations.5
We now focus on the isothermal compressibility (eqn (11)). In Fig. 5, we present a log–log plot of κTvs. T, where it is apparent that the KALJ system is systematically more compressible than the KAWCA system at all temperatures considered here. Hence, it is again clear that small differences in the tail of the RDFs result in sizeable differences in their thermodynamic properties. Furthermore, a power-law behaviour κT = κT0T−γ is apparent with γ = 0.46 ± 0.01 for the KALJ system and γ = 0.45 ± 0.01 for the KAWCA system. Below the onset temperature of glassy dynamics, both systems deviate from this power law and become comparatively less compressible in the deeply supercooled region. One would expect that, for a system undergoing a gas–liquid separation, compressibility substantially increases upon approaching the gas–liquid region. By contrast, the behaviour observed in Fig. 5 suggests that this is not the case. Finally, the existence of this power law, including the low-temperature deviations,53 is somewhat similar (γ = 0.40 ± 0.01)60 to the one observed experimentally in supercooled water.
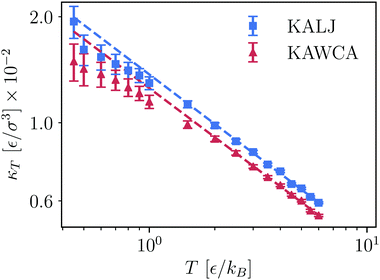 | ||
| Fig. 5 Bulk isothermal compressibility κT, calculated from eqn (11), as a function of temperature for KALJ and KAWCA systems (log–log representation). We observe that a power law relationship holds as κT = κT0T−γ with γ = 0.46 ± 0.01 and 0.45 ± 0.01 for KALJ and KAWCA, respectively. The dashed lines are the corresponding power law fitting. | ||
3.4 Chemical potential
Finally, we compute the excess chemical potential for both systems (Fig. 6) using the SPARTIAN method.37 Recent calculations of the chemical potential for the KALJ system in the range of temperature 0.5ε/kB < T < 1.0ε/kB are in excellent agreement with our results.61 At the onset temperature of glassy dynamics, there is a transition between two regimes, reflecting the tendency for the system to minimise its free energy. The fact that the curves for the KALJ and the KAWCA systems are identical up to a constant factor is a consequence of writing the LJ potential energy as ULJ ≈ UWCA + UAttractive. This expression lies at the foundation of perturbation theory that assumes that UAttractive is very small compared to UWCA. However, the sizeable difference in chemical potential (≈5ε) indicates that this approximation does not hold in this case.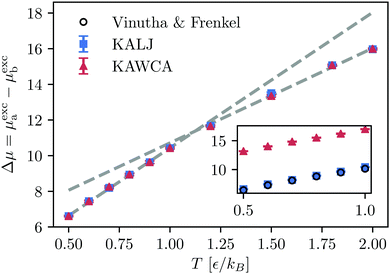 | ||
| Fig. 6 Difference of excess chemical potentials between species a and b for both, KALJ and KAWCA systems. The KAWCA system results were shifted by a constant in order to mach the lowest temperature T = 0.5ε/kB, indicating that the potential energy can be approximated to ULJ ≈ UWCA + UAttractive. A change in the behaviour with T, indicated by the dashed-grey lines, is apparent at the onset temperature of glassy dynamics. The inner plot shows the difference of chemical potential for KALJ and KAWCA (without shifting). Results for the KALJ system in the temperature range 0.5–1.0ε/kB well compare with results available in the literature.61 | ||
Similarly to other thermodynamic properties like excess20 and configurational entropy,19 isothermal compressibility and chemical potential results confirm that perturbation theory is not valid for the KALJ and KAWCA systems at ρ = 1.2/σ3 since attractive interactions induce non-perturbative structural effects. In the following section, we investigate these systems at higher density, namely ρ = 1.6/σ3, where we expect that repulsive interactions play an increasingly dominant role.7,10
3.5 KALJ and KAWCA mixtures at ρ = 1.6/σ3
We perform a similar thermodynamic analysis for KALJ and KAWCA systems at ρ = 1.6/σ3. Our results show that density and concentration structure factors (Fig. 7) are nearly identical for both systems in the range of temperature considered. Structure factors in the limit k→0, in particular, show no evidence for the nucleation of long-range structures. Dynamical properties for these mixtures available in the literature20,58,62 reveal that both systems exhibit similar structural and dynamical properties at this density. Therefore, we conclude that long-range concentration fluctuations might be closely connected to the significant mismatch between dynamical properties of the two systems at ρ = 1.2/σ3.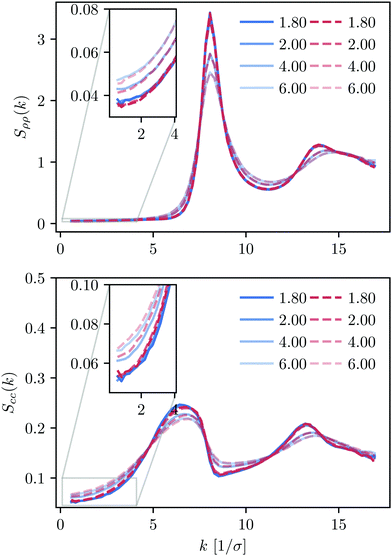 | ||
| Fig. 7 Density and concentration structure factors, Sρρ and Scc, for the KALJ and KAWCA systems at a higher density (ρ = 1.6), in the range of temperature considered here. | ||
Concerning the isothermal compressibility (Fig. 8), the two systems are essentially indistinguishable in the whole temperature range. As a reference, the onset temperature of glassy dynamics for KALJ and KAWCA systems at this density is close to 2.80ε/kB.54 The two systems hence behave similarly well below the onset temperature of glassy dynamics. This result highlights the dominant role played by attractive interactions in determining thermodynamic properties of high-density liquids.
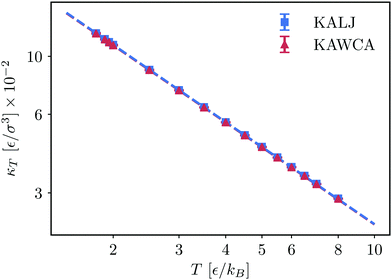 | ||
| Fig. 8 Bulk isothermal compressibility κT for the KALJ and KAWCA systems at a higher density (ρ = 1.6/σ3). | ||
3.6 Crystallisation of the KAWCA system
In the last section, we investigate the crystallisation of the KAWCA system at ρ = 1.2/σ3. We further decrease the temperature down to T = 0.35ε/kB. Fig. 9 shows snapshots of the system at T = 0.45ε/kB (top) and T = 0.35ε/kB (bottom). It is apparent from the figure that the system at T = 0.45ε/kB appears like a miscible liquid. Conversely, the system at T = 0.35ε/kB shows crystalline domains with a clear tendency for phase-segregation.Density and concentration structure factors (Fig. 10) enable us to validate this crystallisation-demixing scenario. In particular, we observe the splitting of the second peak of Sρρ(k) at 1.7k0 with k0 ≈ 7.13/σ that indicates the presence of facet-sharing domains between neighbouring crystalline regions. Perhaps more interesting, the structure factors at k < 2/σ show a marked formation of long-range domains qualitatively similar to the ones present for the KALJ case below onset temperature.
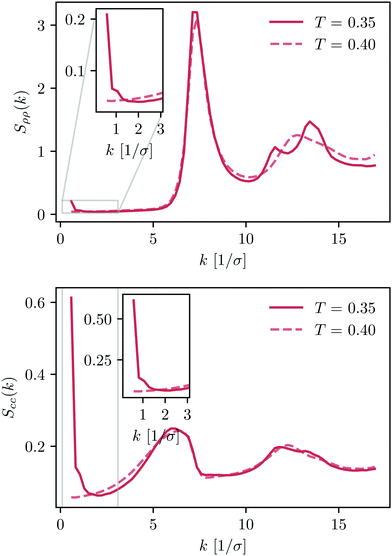 | ||
| Fig. 10 Density and concentration structure factors, Sρρ and Scc, for the KAWCA system in the temperature range 0.3ε/kB < T < 0.45ε/kB. | ||
These results indicate that the crystallisation of the KAWCA system is a process driven by phase segregation. We note that similar behaviour to that observed for the low-temperature density and concentration structure factors for KAWCA has also been observed in polydisperse glass-forming systems.63 Furthermore, recent GPU simulations report the crystallisation of the KALJ system55 due to composition fluctuations similar to the ones investigated in this work. Indeed, our results also support previous claims pointing out demixing as a precursor for crystalisation in the modified KA model64 and in liquid metals.65
We conclude here that the presence of long-range concentration fluctuations is a qualitatively common feature for both KALJ and KAWCA systems. Perhaps more important, it is not directly related to gas–liquid coexistence present in the KALJ system. Indeed, in the crystalline state (T = 0.35ε/kB), the KAWCA system exhibits a significant growth of concentration fluctuations, apparent in the lower panel in Fig. 10. The attractive interactions present in the KALJ system favour the nucleation of concentration fluctuations starting at relatively high temperatures (T = 1.00ε/kB). Although the KAWCA system crystallises in our simulation timescale as its dynamics are considerably faster than for the KALJ system, our results suggest that both systems crystallise upon demixing by following a similar pathway.
4 Conclusions
We compute various thermodynamic properties of model supercooled liquids, with (KALJ) and without (KAWCA) attractive interactions at density ρ = 1.2/σ3. We aim at studying whether fluctuations in the tail of the two-body correlation function induce significant thermodynamic differences between the two systems. Density and concentration structure factors in the limit k→0 indicate that the KALJ system exhibits anomalous structural behaviour that we identify as the nucleation of long-range concentration domains. Conversely, the KAWCA system behaves like a normal liquid, with density and concentration structure factors decreasing monotonically. A finite-size Kirkwood–Buff analysis used to extrapolate to the k→0 limit confirms this picture. Differences in isothermal compressibilities and chemical potentials highlight the non-perturbative role of attractive interactions. Results of the crystallisation of the KAWCA system suggest that the anomaly, enhanced by the presence of attractive interactions, is a common feature of both models. All our results indicate that these long-range concentration fluctuations are not connected to gas–liquid coexistence, implying that demixing precedes crystallisation in both systems. Finally, upon increasing density (ρ = 1.6/σ3), where KALJ and KAWCA systems show similar dynamical properties, the KALJ anomaly disappears, and both systems exhibit nearly identical thermodynamic properties. Hence, we speculate that there might be a connection between large-scale concentration fluctuations and the significant dynamical slow down of the KALJ system in the deeply supercooled regime.Author contributions
Atreyee Banerjee: conceptualization, methodology, formal analysis, writing – original draft Mauricio Sevilla: methodology, software, formal analysis, visualisation Joseph F. Rudzinski: investigation, writing – review & editing Robinson Cortes-Huerto: conceptualisation, methodology, writing – original draft, review & editing.Conflicts of interest
There are no conflicts to declare.Acknowledgements
The authors thank Kurt Kremer for his insightful discussions and his critical reading of the manuscript. They are also grateful to Pietro Ballone, Burkhard Dünweg, Smarajit Karmakar and Werner Steffen for their valuable feedback and suggestions. R. C.-H. thankfully acknowledge funding from SFB-TRR146 of the German Research Foundation (DFG). Open Access funding provided by the Max Planck Society.References
- E. Boattini, S. Marn-Aguilar, S. Mitra, G. Foffi, F. Smallenburg and L. Filion, Nat. Commun., 2020, 11, 5479 CrossRef CAS PubMed.
- H. Tong and H. Tanaka, Phys. Rev. Lett., 2020, 124, 225501 CrossRef CAS PubMed.
- J. Chattoraj and M. P. Ciamarra, Phys. Rev. Lett., 2020, 124, 028001 CrossRef CAS PubMed.
- F. P. Landes, G. Biroli, O. Dauchot, A. J. Liu and D. R. Reichman, Phys. Rev. E, 2020, 101, 010602 CrossRef CAS.
- L. Klochko, J. Baschnagel, J. P. Wittmer, O. Benzerara, C. Ruscher and A. N. Semenov, Phys. Rev. E, 2020, 102, 042611 CrossRef CAS PubMed.
- M. Leocmach and H. Tanaka, Nat. Commun., 2012, 3, 974 CrossRef PubMed.
- L. Berthier and G. Tarjus, Phys. Rev. Lett., 2009, 103, 170601 CrossRef PubMed.
- W. Kob and H. C. Andersen, Phys. Rev. E: Stat. Phys., Plasmas, Fluids, Relat. Interdiscip. Top., 1995, 52, 4134 CrossRef CAS PubMed.
- J. D. Weeks, D. Chandler and H. C. Andersen, J. Chem. Phys., 1971, 54, 5237–5247 CrossRef CAS.
- L. Berthier and G. Tarjus, Phys. Rev. E: Stat., Nonlinear, Soft Matter Phys., 2010, 82, 031502 CrossRef PubMed.
- W. Götze and L. Sjögren, Z. Phys. B: Condens. Matter, 1987, 65, 415–427 CrossRef.
- D. Coslovich, J. Chem. Phys., 2013, 138, 12A539 CrossRef PubMed.
- G. M. Hocky, T. E. Markland and D. R. Reichman, Phys. Rev. Lett., 2012, 108, 225506 CrossRef PubMed.
- S. Toxvaerd, Phys. Rev. E, 2021, 103, 022611 CrossRef CAS PubMed.
- F. Sciortino and W. Kob, Phys. Rev. Lett., 2001, 86, 648 CrossRef CAS PubMed.
- V. K. de Souza and D. J. Wales, J. Chem. Phys., 2008, 129, 164507 CrossRef PubMed.
- M. P. Ciamarra, R. Pastore and A. Coniglio, Soft Matter, 2016, 12, 358–366 RSC.
- J. F. Rudzinski, M. Radu and T. Bereau, J. Chem. Phys., 2019, 150, 024102 CrossRef.
- A. Banerjee, S. Sengupta, S. Sastry and S. M. Bhattacharyya, Phys. Rev. Lett., 2014, 113, 225701 CrossRef PubMed.
- A. Banerjee, M. K. Nandi, S. Sastry and S. M. Bhattacharyya, J. Chem. Phys., 2016, 145, 034502 CrossRef PubMed.
- G. Adam and J. H. Gibbs, J. Chem. Phys., 1965, 43, 139–146 CrossRef CAS.
- E. D. Cubuk, S. S. Schoenholz, J. M. Rieser, B. D. Malone, J. Rottler, D. J. Durian, E. Kaxiras and A. J. Liu, Phys. Rev. Lett., 2015, 114, 108001 CrossRef CAS PubMed.
- M. K. Nandi and S. M. Bhattacharyya, Phys. Rev. Lett., 2021, 126, 208001 CrossRef CAS PubMed.
- J. G. Kirkwood and F. P. Buff, J. Chem. Phys., 1951, 19, 774–777 CrossRef CAS.
- M. Rovere, D. W. Heermann and K. Binder, J. Phys.: Condens. Matter, 1990, 2, 7009 CrossRef.
- F. L. Román, J. A. White and S. Velasco, J. Chem. Phys., 1997, 107, 4635 CrossRef.
- S. K. Schnell, T. J. Vlugt, J.-M. Simon, D. Bedeaux and S. Kjelstrup, Chem. Phys. Lett., 2011, 504, 199–201 CrossRef CAS.
- P. Krüger, S. K. Schnell, D. Bedeaux, S. Kjelstrup, T. J. Vlugt and J.-M. Simon, J. Phys. Chem. Lett., 2013, 4, 235–238 CrossRef PubMed.
- R. Cortes-Huerto, K. Kremer and R. Potestio, J. Chem. Phys., 2016, 145, 141103 CrossRef CAS PubMed.
- E. Fischer, Phys. A, 1993, 201, 183–206 CrossRef CAS.
- A. Patkowski, T. Thurn-Albrecht, E. Banachowicz, W. Steffen, P. Bösecke, T. Narayanan and E. W. Fischer, Phys. Rev. E: Stat. Phys., Plasmas, Fluids, Relat. Interdiscip. Top., 2000, 61, 6909–6913 CrossRef CAS PubMed.
- P. S. Salmon, R. A. Martin, P. E. Mason and G. J. Cuello, Nature, 2005, 435, 75–78 CrossRef CAS PubMed.
- Z. Zhang and W. Kob, Proc. Natl. Acad. Sci. U. S. A., 2020, 117, 14032–14037 CrossRef CAS PubMed.
- S. Toxvaerd and J. C. Dyre, J. Chem. Phys., 2011, 134, 081102 CrossRef PubMed.
- S. J. Plimpton, J. Comput. Phys., 1995, 117, 1 CrossRef CAS.
- D. J. Evans and B. L. Holian, J. Chem. Phys., 1985, 83, 4069–4074 CrossRef CAS.
- M. Heidari, K. Kremer, R. Cortes-Huerto and R. Potestio, J. Chem. Theory Comput., 2018, 14, 3409–3417 CrossRef CAS PubMed.
- M. Praprotnik, L. Delle Site and K. Kremer, J. Chem. Phys., 2005, 123, 224106–224114 CrossRef PubMed.
- M. Praprotnik, L. Delle Site and K. Kremer, Phys. Rev. E: Stat., Nonlinear, Soft Matter Phys., 2006, 73, 066701 CrossRef PubMed.
- M. Praprotnik, L. Delle Site and K. Kremer, J. Chem. Phys., 2007, 126, 134902 CrossRef PubMed.
- M. Praprotnik, L. Delle Site and K. Kremer, Annu. Rev. Phys. Chem., 2008, 59, 545–571 CrossRef CAS PubMed.
- R. Potestio, S. Fritsch, P. Español, R. Delgado-Buscalioni, K. Kremer, R. Everaers and D. Donadio, Phys. Rev. Lett., 2013, 110, 108301 CrossRef PubMed.
- R. Potestio, P. Español, R. Delgado-Buscalioni, R. Everaers, K. Kremer and D. Donadio, Phys. Rev. Lett., 2013, 111, 060601 CrossRef PubMed.
- U. R. Pedersen, T. B. Schrøder and J. C. Dyre, Phys. Rev. Lett., 2010, 105, 157801 CrossRef PubMed.
- M. Heidari, K. Kremer, R. Potestio and R. Cortes-Huerto, Mol. Phys., 2018, 116, 3301–3310 CrossRef CAS.
- M. Heidari, K. Kremer, R. Potestio and R. Cortes-Huerto, Entropy, 2018, 20, 222 CrossRef PubMed.
- F. Sedlmeier, D. Horinek and R. R. Netz, J. Am. Chem. Soc., 2011, 133, 1391–1398 CrossRef CAS PubMed.
- A. B. Bhatia and D. E. Thornton, Phys. Rev. B: Solid State, 1970, 2, 3004–3012 CrossRef.
- P. Kumari, V. V. S. Pillai, D. Gobbo, P. Ballone and A. Benedetto, Phys. Chem. Chem. Phys., 2021, 23, 944–959 RSC.
- W. Knoll and S. Steeb, Z. Naturforsch., 1978, 33a, 472–479 CrossRef CAS.
- B. W. van de Waal, J. Non-Cryst. Solids, 1995, 189, 118–128 CrossRef CAS.
- C. Desgranges and J. Delhommelle, Phys. Rev. Lett., 2018, 120, 115701 CrossRef CAS PubMed.
- K. H. Kim, A. Späh, H. Pathak, F. Perakis, D. Mariedahl, K. Amann-Winkel, J. A. Sellberg, J. H. Lee, S. Kim and J. Park, et al. , Science, 2017, 358, 1589–1593 CrossRef CAS PubMed.
- A. Banerjee, M. K. Nandi, S. Sastry and S. Maitra Bhattacharyya, J. Chem. Phys., 2017, 147, 024504 CrossRef PubMed.
- T. S. Ingebrigtsen, J. C. Dyre, T. B. Schrøder and C. P. Royall, Phys. Rev. X, 2019, 9, 031016 CAS.
- S. Sastry, Phys. Rev. Lett., 2000, 85, 590 CrossRef CAS PubMed.
- V. Testard, L. Berthier and W. Kob, Phys. Rev. Lett., 2011, 106, 125702 CrossRef PubMed.
- L. Berthier and G. Tarjus, J. Chem. Phys., 2011, 134, 214503 CrossRef PubMed.
- J. D. Stevenson and P. G. Wolynes, J. Phys. Chem. A, 2011, 115, 3713–3719 CrossRef CAS PubMed.
- A. Späh, H. Pathak, K. H. Kim, F. Perakis, D. Mariedahl, K. Amann-Winkel, J. A. Sellberg, J. H. Lee, S. Kim, J. Park, K. H. Nam, T. Katayama and A. Nilsson, Phys. Chem. Chem. Phys., 2019, 21, 26–31 RSC.
- H. Vinutha and D. Frenkel, J. Chem. Phys., 2021, 154, 124502 CrossRef CAS PubMed.
- A. Banerjee and D. J. Wales, J. Chem. Phys., 2020, 153, 124501 CrossRef CAS PubMed.
- A. Ninarello, L. Berthier and D. Coslovich, Phys. Rev. X, 2017, 7, 021039 Search PubMed.
- U. K. Nandi, A. Banerjee, S. Chakrabarty and S. M. Bhattacharyya, J. Chem. Phys., 2016, 145, 034503 CrossRef PubMed.
- C. Desgranges and J. Delhommelle, J. Am. Chem. Soc., 2014, 136, 8145–8148 CrossRef CAS PubMed.
Footnotes |
| † Electronic supplementary information (ESI) available. See DOI: 10.1039/d2sm00089j |
| ‡ These authors contributed equally to this work. |
| This journal is © The Royal Society of Chemistry 2022 |


