
 Open Access Article
 This Open Access Article is licensed under a
 Creative Commons Attribution 3.0 Unported Licence
Diffuse scattering from lamellar structures
Ian W.
Hamley

Department of Chemistry, University of Reading, Reading RG6 6AD, UK. E-mail: I.W.Hamley@reading.ac.uk
First published on 30th December 2021
Abstract
Lamellar structures are formed in a variety of soft materials including lipids, surfactants, block polymers, clays, colloids, semicrystalline polymers and others. Lamellar phases are characterized by scattering patterns containing pseudo-Bragg peaks from the layer ordering. However, fluctuations of the lamellae give rise to diffuse scattering in addition. This diffuse scattering can provide valuable information on the elastic properties of lamellae which control their fluctuations. A number of models to account for this are described in this Tutorial Review, along with examples from the literature. In addition, diffuse scattering from in-plane fluctuations or structures such as perforations or patterned nanoparticles is considered. This type of diffuse scattering can give unique information on the nature of, and positional (and bond orientational) ordering within, correlated structures within the lamellar plane. Anisotropic diffuse scattering features from thermotropic smectic phases is also briefly discussed.
 Ian W. Hamley | Professor Ian W. Hamley is Diamond Professor of Physical Chemistry at the University of Reading. He has more than 30 years’ experience of research on different types of soft materials, including peptides, polymers, liquid crystals and surfactants. He received a Royal Society-Wolfson Research Merit Award in 2011, the RSC Peter Day Award for Materials Chemistry (2016) and the MacroGroup UK Medal (2017) and is currently an EPSRC Established Career Fellow. His research programme currently focuses on the self-assembly of peptide materials and its relationship to bioactivity. He has supervised more than fifty postdoctoral and postgraduate researchers and has published over 400 papers, several edited texts and five authored books. |
Introduction
Lamellar structures are layered phases formed by a range of soft materials including lipids and surfactants (lyotropic liquid crystals), block polymers, clays, colloids, crystallized polymers and others.1–5 Lamellar phases have the same symmetries as smectic phases formed by thermotropic liquid crystals, which are solvent-free phases of mesogenic molecules, in the sense of having the same one-dimensional order of layers of molecules.6 In particular, the simple lamellar phase (e.g. termed Lα for lipids) has the same one-dimensional ordering as the smectic A phase.Lamellar phases are characterized by pseudo-Bragg peaks. Due to the Landau-Peierls instability,7–9 one-dimensional structures lack true crystalline order and so the peak shape is modified to one that depends on the fluctuations of the lamellae which depends on their elasticity.6 The pseudo-Bragg peaks have a power-law shape in the tails (I(q) ∼ q−2+η in a scan along qz for an oriented sample, where η is the Caillé exponent, eqn (6) below) which has been extensively analysed by high resolution diffraction and SAXS experiments.10–17 Further discussion of this topic is outside the scope of the current review.
In addition to the pseudo-Bragg peaks due to elastic fluctuations of the lamellae, diffuse scattering features may be present in certain lamellar phases such as those that exhibit in-plane fluctuations that are pre-transitional to the formation of mesh or perforated lamellar phases, or from quenched in-plane structure which may result, for example, from crystallization in block polymers, or from the presence of nanoparticles decorating the membrane (lamellar interface). Diffuse scattering results from aperiodic or imperfectly periodic ordering in a material and produces broad features in measured scattering patterns. This review discusses such scattering and includes examples from experimental observations, along with descriptions and examples of calculations using a selection of models. These include several used to describe the structure factors of fluctuating lamellae as well as those for one-dimensional in-plane structures (Markov and Ising models) and those computed for two-dimensional hexagonal or hexatic ordering. Hexatic refers to a phase in which there is at most partial long-range translational order but there is long-range orientation of hexagonal net bond vectors.
The diffuse scattering has been observed to give significant contributions to small-angle scattering (SAS) patterns measured by both small-angle X-ray scattering (SAXS) and small-angle neutron scattering (SANS). It gives significant broad scattering features that have been reported for lamellar phases formed by surfactants and lipids in aqueous solution, block polymer melts and semicrystalline block polymers. This Tutorial Review is organized as follows. Diffuse scattering caused by out-of-plane fluctuations of the lamellae is first considered and equations for the structure factor that have been derived under various approximations are provided. Then diffuse scattering that arises from in-plane fluctuations (or structures, e.g. perforations in the layers or patterned nanoparticles or crystallites) is discussed, in particular in terms of analysis using one-dimensional Markov or Ising chains to describe one-dimensional in-plane correlations/structures. Hexagonal in-plane structures/fluctuations are considered along with a model for the ordering that can be used to describe the diffuse scattering observed for certain surfactants and block polymers in solution close to the lamellar-bicontinuous gyroid phase transition. Fluctuations of lamellae that produce diffuse scattering may also be observed near other phase transition boundaries, for example for transitions between different lamellar phases of lipids. Finally, the (wide-angle) diffuse scattering that arises from inter-molecular correlations within the layers of smectic phases is briefly outlined.
The modelling and experimental data include examples of scattering patterns from both aligned and unaligned samples. Alignment is a useful method to increase the information content from oriented scattering patterns and may be achieved in lamellar phases using shear, or magnetic or electric fields. This is highlighted by an example whereby a structure factor for aligned lipids is used to obtain unique information on the layer fluctuations and elasticity. Diffuse scattering is also manifest in one-dimensional small-angle intensity profiles from unaligned samples and this is also discussed.
This tutorial review discusses diffuse scattering that arises from fluctuations of lamellae, or within lamellae, i.e. it is concerned with diffuse scattering around or between Bragg peaks in the structure factor. It does not consider diffuse scattering that arises from form factor effects, for example lipid membrane form factors.18,19
Results and discussion
Fluctuations of layer positions (out-of-plane fluctuations)
A number of structure factors have been proposed for lamellar structures, based on the fluctuations of the layers. Fig. 1 illustrates the thermal fluctuations that arise from the flexibility of the layers in a lamellar system. These fluctuations destroy true long-range order in all one-dimensional systems according to the Landau–Peierls instability.1,7–9 | ||
| Fig. 1 Fluctuations in the layer positions in a lamellar structure that are characterised by the membrane stiffness. | ||
For a stack of perfectly and evenly spaced layers the structure factor S(q) is written20
 | (1) |
Different models have been proposed to describe the thermal fluctuations and hence the structure factor, and three of the most widely used are discussed in the following.
In the thermal disorder model, each layer k (Fig. 1) fluctuates with an amplitude Δ = (dk − d)2, where d is the average lamellar spacing. The structure factor is that of an ideal one-dimensional crystal multiplied by a Debye–Waller factor:
 | (2) |
 | (3) |
The second main model that has been used to describe lamellar structure factor is the paracrystalline model. Here, small fluctuations of layer spacing are considered, this is so-called stacking disorder corresponding to a paracrystal of the second kind.24,25 The position of an individual fluctuating layer in the paracrystal is determined solely by its nearest neighbours, and the structure factor in this case is written as20,25
 | (4) |
 | (5) |
 | (6) |
The extent of long-range lamellar order is always finite and to model this a distribution of stack sizes around N may be considered. In this case the structure factor can be written as20,30
 | (7) |
 | (8) |
 for a sufficiently large N.
Fig. 2 shows examples of structure factors calculated using the thermal diffuse scattering model (eqn (2)), the paracrystalline model (eqn (4)) or the modified Caillé model (eqn (5)) with allowance for dispersity in lamellar stack size viaeqn (7). These examples have been calculated using the software SASfit.30 SAS data analysis software such as SASView can also be used to model lamellar structure factors.31 Other useful SAS analysis software has recently been summarized, including several programs that can be used to compute lamellar structure factors.24
 | ||
| Fig. 2 Examples of structure factors calculated using the thermal diffuse scattering model (eqn (2)), the paracrystalline model (eqn (4)) or the modified Caillé model (eqn (5)) with allowance for dispersity in lamellar stack size viaeqn (7) and (8). The following parameters were used: N = 10, d = 50 Å, Δ = 5Å, η = 0.1. The data for the thermal diffuse model has been scaled by a factor of 100 and that for the modified Caillé model by a factor of 1/100. | ||
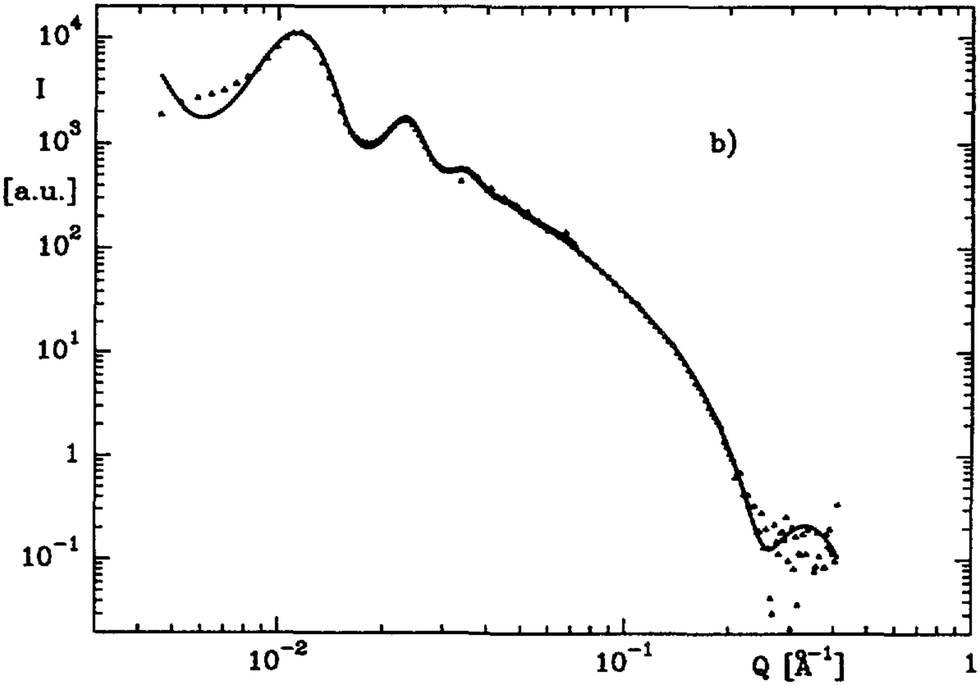
These structure factors can be used to account for the influence of diffuse scattering on the intensities and widths of Bragg reflections from lamellar structures. These models (in particular the modified Caillé or paracrystal models) have been used for example to fit SAXS data from lipid lamellar phases, using suitable form factors described elsewhere.20,28Fig. 3 shows an example of experimental data fitted with the modified Caillé structure factor and the form factor of a lamellar bilayer.28 Other examples are available in reviews on analysis of SAS data from lipid membrane systems.32,33
 | ||
| Fig. 3 SAXS data obtained from a multilamellar vesicular dispersion of lipid 1-palmitoyl-2-oleoyl-sn-glycero-3-phosphocholine (POPC) at 50 °C with modified Caillé structure factor and form factor of a lamellar bilayer (the solid line shows the electron density profile across the bilayer shown in the inset, the dashed line was obtained from Fourier synthesis). Reprinted from ref. 28. Copyright (2000) by the American Physical Society. | ||
Fig. 4 shows an example of a fit using the equation of Nallet et al. (eqn (3)) to SANS data from a cationic surfactant. The presence of significant diffuse scattering at high q beyond the broad Bragg peaks at low q is evident.
 | ||
| Fig. 4 Model fit (solid line), using eqn (5) and a form factor based on a square scattering density profile, to SANS data (points) for the cationic surfactant DDAB (didodecyl dimethyl ammonium bromide) in D2O with a surfactant volume fraction ϕ = 0.04 and η = 0.5 (η defined in eqn (6)).23 | ||
A structure factor that is based on a theoretical analysis which goes beyond the approximation used for the fluctuation correlation function used by Caillé (which uses a limiting correlation function for large separations r) has been developed.34 The anisotropic structure factor is written as34
 | (9) |
| G(r, n, qz) = exp[−qz2δun(r)/2] | (10) |
 | (11) |
This expression leads to broad structure factor peaks with significant diffuse scattering between the peaks, depending on the fluctuation correlation length and the size of the lamellar stacks.34
This equation can be used to derive the individual lamellar elastic constants K and B (rather than the parameter η in eqn (6) which depends on the product of both parameters) from SAXS data from aligned stacks of lipid lamellae, by analysing the q dependence of the diffuse scattering perpendicular to the layer stacking direction. Fig. 5 shows examples of SAXS data analysed in this way for stacks of bilayers of the lipid DMPC (dimyristyl-phosphocholine) aligned by shear during evaporation of solvent used to deposit the lipid onto a silicon substrate.36 The method has been employed by the same group for other lipids and membranes with inclusions etc.18,32,37,38 This analysis is an example where SAS from aligned samples provides more information than one-dimensional isotropic SAS since in the latter case the modified Caillé structure factor (eqn (5)) only gives η which contains the product BK rather than K and B individually. Other examples of the analysis of SAS patterns from aligned samples are provided in the following sections, for the cases where there are in-plane structural features.
 | ||
| Fig. 5 (a) SAXS pattern from aligned multilayer stack of DMPC bilayers. The first two strong meridional Bragg peaks are attenuated. The boxes show regions of diffuse scattering used to analyse the qr dependence of the structure factor (eqn (9)), (b) the intensity along qr fitted using eqn (9) for different values of h = qzd/2π from which values of the lamellar elastic constants K and B were obtained. Normalization factors are denoted N. Reprinted from ref. 36. Copyright (2005) by the American Physical Society. | ||
Related analysis has been applied to determine the fluctuation correlation function (and elastic properties) of aligned lipid membranes from X-ray reflectivity experiments.39,40 Diffuse scattering from thin smectic films has been analyzed by explicitly calculating the fluctuations un(r) for each of the individual the small finite number of layers (using a continuum elastic theory following de Gennes, Caillé and others), then using this discrete distribution to evaluate the structure factor.41–43 This can be compared to measured specular X-ray reflectivity profiles from smectic films, lamellar block polymer films etc, although further discussion of this is outside the scope of this review.
One-dimensional in-plane order
In this section, Markov and Ising models are discussed. These are simple models to describe one-dimensional lattices with variable site occupancy. Models such as paracrystal structures (mentioned in the preceding section) or other stochastic models could also be used to describe one-dimensional ordering in the case that the lattice has a lower degree of translational ordering and/or site occupancy models are not relevant.| P(xj,k = 1|xj−1,k) = α + βxj−1,k | (12) |
Examples of diffraction patterns computed from stacks of Markov chains are shown in Fig. 7. The diffraction patterns were simply computed using the definition24
| I(q) = F(q)F*(q) | (13) |
 | (14) |
Stacks of one-dimensional Markov chains such as those shown in Fig. 6 have been used to model SAXS from an oriented semicrystalline block polymer that contain one glassy block and one crystallisable block, in particular a nearly symmetric poly(vinylcyclohexane) – polyethylene (PVCH-PE) diblock.45,46 This crystallises into a lamellar structure with glassy PVCH and semicrystalline PE (the glass transition temperature for PVCH Tg = 140 °C45 exceeds the melting temperature of PE, around Tm = 110 °C). Constrained crystallization may lead to correlation of the position of crystal stems in the stack of Markov chains.45,46 An example of a measured SAXS pattern is shown in Fig. 8 along with a schematic of the proposed structure.
 | ||
| Fig. 6 Stacks of Markov Chains for (a) α = 0.8, β = −0.2, (b) α = 0.8, β = 0. | ||
 | ||
| Fig. 7 Representative diffraction patterns calculated for stacks of Markov chains (dx = 1, dz = 1) with (a) α = 0.8, β = −0.6, (b) α = 0.8, β = −0.3. | ||
 | ||
| Fig. 8 (a) SAXS pattern from a sample aligned (by shear) of a nearly symmetric PE-PVCH [polyethyelene-poly(vinylcyclohexane)] semicrystalline diblock polymer showing diffuse scattering bars running parallel to the meridional Bragg peaks, (b) proposed model for the structure showing the PE crystal domains which give rise to the diffuse scattering described by a Markov chain model. Adapted from ref. 46. Republished with permission of Elsevier, Copyright 1996. | ||
The diffuse scattering from a one-dimensional Markov chain (lattice spacing dx) is given by44
 | (15) |
Fig. 9 shows an example of the intensity calculated according to eqn (15) with β = −0.6, compared to the intensity calculated from an equatorial cross-section of a simulated diffraction pattern for α = 0.8, β = −0.6 (Fig. 7a). The agreement is good, although not exact since eqn (15) applies to a single chain and not a stack (also finite size effects will influence the simulated cross-section).
 | ||
| Fig. 9 Equatorial cross-section of simulated diffraction pattern for Markov chain stack (dx = 1, dz = 3) with α = 0.8, β = −0.6 (solid squares) along with calculated line using eqn (15). | ||
The previous discussion is based on analysis of diffuse structure factor scattering, and neglects the effects of form factor, which could be present for example in the case of Markov lattices of nanoparticle inclusions in lamellar phases.
Models like the Markov chain model are also expected to be relevant to analyse the diffuse scattering from systems such as nanoparticle-decorated lamellar phases of block polymers. Fig. 10 shows a transmission electron micrograph of a PEO-PMMA diblock copolymer with a crystalline lamellar structure containing PMMA-grafted SiO2 particles, which can be seen to segregate to layer interfaces.47 A highly ordered and aligned lamellar sample may exhibit Markov-like chains of nanoparticles at the interface if there is a preferred particle spacing, potentially giving rise to diffuse scattering. This was not considered in a recent analysis of SAXS data from such systems which considered only one-dimensional correlation function analysis along the lamellar normal direction.48
 | ||
| Fig. 10 Transmission electron micrographs of a PEO-PMMA diblock copolymer with a crystalline lamellar structure (isothermally crystallized at 58 °C) containing PMMA-grafted SiO2 particles (5.8 wt%), which can be seen to segregate to interfaces.47 Scale bars: 100 nm. Reprinted (adapted) with permission from ref. 47. Copyright (2019) American Chemical Society. | ||
For the case considering second-nearest neighbour interactions, the conditional probability that a site is occupied can be written44
| P(xj = 1|xj−1, xj−2) = α + βxj−1 + γxj−2 + δxj−1xj−2 | (16) |
| P(xj = 1|xj−1, xj−2) = α + βxj−1 + γxj−2 | (17) |
 | ||
| Fig. 11 Stacks of Ising lattices for (a) α = 0.8, β = 0, γ = 0.1, (b) α = 0.5, β = 0.25, γ = −0.25. | ||
Examples of diffraction patterns that were calculated for Ising model stacks are presented in Fig. 12. The diffuse scattering bars running parallel to the (pseudo-)Bragg peaks along the meridian are clear. Other examples of calculated diffraction patterns are provided by Welberry.44 These types of SAS pattern may be observed for aligned lamellar phases with in-plane defects of the Ising chain type.
 | ||
| Fig. 12 Examples of calculated diffraction patterns for Ising model stacks with same parameters as Fig. 9 and lattice parameters dx = 1, dz = 3. (a) α = 0.8, β = 0, γ = 0.1, (b) α = 0.5, β = 0.25, γ = −0.25. | ||
Two-dimensional in-plane order
Here we consider the case of hexagonal order, the most commonly observed two-dimensional in-plane order. Similar considerations will apply to other types of two-dimensional packings (less often observed in soft matter lamellae). This section does not consider out-of-plane hexagonal or rectangular columnar arrangements of DNA intercalated within lipid bilayers, that produces diffuse scattering peaks from the DNA packings.49–51The in-plane ordering can be modelled using Monte Carlo simulations of hexagonal lattice points, based on varying degrees of hexatic ordering, following a previously described method.52 The degree of orientational order is controlled through the use of a parameter to specify the angle between bond vectors of neighboring hexagonal lattice points, which is biased to nπ/3 + Δϕ (n is a whole number), where Δϕ changes from π/6 for random orientation to 0 for a completely ordered structure. An additional parameter is related to translational order- the minimal spacing between lattice points, Rmin, which is set along with a positional fluctuation parameter. Fig. 13 shows examples of structures calculated.
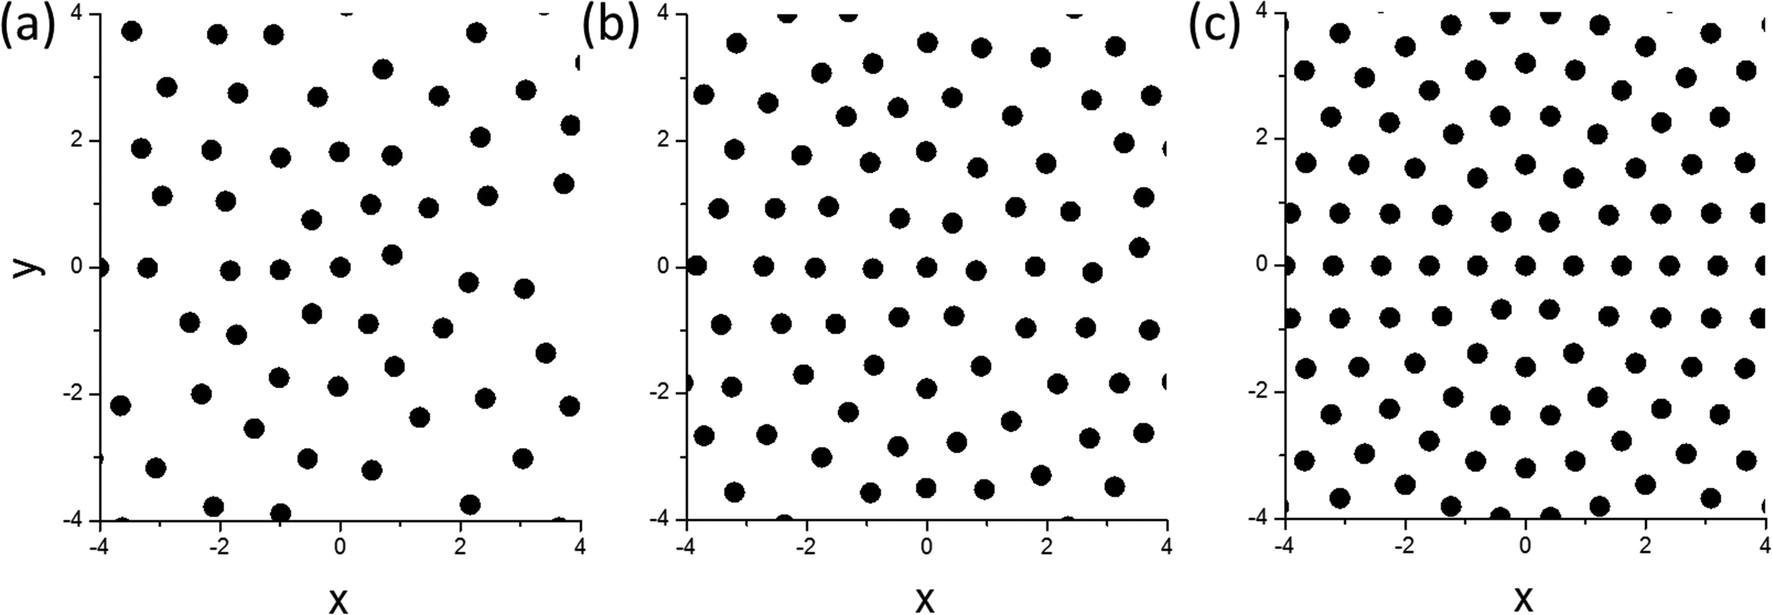 | ||
| Fig. 13 Monte Carlo simulated structures for in-plane ordering of various degrees (Rmin = 0.8), (a) Δϕ = π/6, (b) Δϕ = 0.2 rad, (c) Δϕ = 0. | ||
In-plane diffraction patterns computed (using eqn (13) and (14)) from structures in Fig. 13 are shown in Fig. 14.
 | ||
| Fig. 14 Monte Carlo simulated diffraction patterns corresponding to the structures in Fig. 13, (a) Δϕ = π/6, (b) Δϕ = 0.2 rad, (c) Δϕ = 0. | ||
The simulated in-plane diffraction patterns are related to those observed within the layer plane for aligned samples, for example block polymer melts such as those in the hexagonal modulated layer phases (similar patterns are observed in a hexagonal perforated layer HPL phase).53,54 An example is shown in Fig. 15 which compares SANS patterns in two planes for a shear-aligned sample of a PEP-PEE [poly(ethylenepropylene)-poly(ethylethylene)] diblock polymer in lamellar and HPL phases.
 | ||
| Fig. 15 SANS patterns for a PEP-PEE diblock (volume fraction fPEP = 0.65) in two planes for lamellar phase (left) and hexagonally modulated lamellar phase (right). Reprinted (adapted) with permission from ref. 53 Copyright (1993) American Chemical Society. | ||
It is also possible to simulate one-dimensional integrated patterns for unoriented systems of multilayer stacks with in-plane order, by combining an integrated in–plane scattering profile with a model profile containing Bragg peaks representing the layer ordering. This represents a type of “powder averaging”, an example of which is shown in Fig. 16.
The lamellar-gyroid transition observed in block polymer and surfactant systems can be characterized by pre-transitional fluctuations in the lamellar phase and/or the presence of an intermediate mesh or perforated lamellar structure. In one example, this transition was studied in aqueous solutions of the ethylene oxide (E) – butylene oxide (B) diblock oligomer CH3OE2(dE)18B10 (d denotes a deuterated sequence) which is also a non-ionic surfactant. The transition is observed on cooling. Fig. 16 shows a SAXS frame obtained in the high temperature lamellar phase and on cooling to 25 °C where a gyroid structure forms after 2 min, but a transient PL phase is observed first (a corresponding SAXS frame in this phase is also shown in Fig. 16). Also shown is a one-dimensionally averaged profile based on a superposition of an integrated one-dimensional profile from a distorted hexagonal lattice (as described above) and a model lamellar profile of (pseudo-) Bragg peaks.52
 | ||
| Fig. 16 SAXS profiles for an aqueous solution (63 wt% in H2O) of diblock oligomer CH3OE2(dE)18B10 which (a) Measured data in the lamellar phase at 65 °C, (b) Model for scattering profile in PL phase at 25 °C (c) Measured data for transient PL phase at 25 °C, 90 s after quench. Diffuse scattering shoulders on the low q side of the first (pseudo-)Bragg peak in the PL phase are highlighted. Reprinted (adapted) with permission from ref. 52 Copyright (2004) American Chemical Society. | ||
Related diffuse scattering on the low q side of the first order lamellar reflection was observed by Imai et al. in SAXS patterns of the fluctuating lamellar phase of the non-ionic surfactant C16E7 (and similar alkyl ethoxyether compounds) approaching the lamellar-gyroid phase transition (on cooling).55–57 The diffuse scattering was assigned to a rhombohedral mesh phase (i.e. a structure with hexagonal in-plane structure with an ABC stacking).
Diffuse scattering from thermotropic smectic phases
Although the main focus here is on lamellar structures, smectic phases are briefly mentioned for completeness in this section. The smectic A phase has the same layer structure symmetry (i.e. one-dimensional order) as the simple lamellar phase (Lα for lipids). However, thermotropic smectic phases are characterized by bands of diffuse scattering centred on the equator, as shown schematically in Fig. 17. This arises from the preferred separation and orientation of molecules in the layer plane. The diffuse scattering is observed in the wide-angle region because the inter-molecular spacing that causes the scattering arcs is typically around 5 Å for rod-like mesogens.1 | ||
| Fig. 17 Schematic diffraction pattern of a smectic A phase. | ||
The extent of the diffuse scattering arcs can be used to measure the orientational ordering of the liquid crystal molecules (mesogens) using a variety of analyses. The orientational distribution function can be obtained by ‘inversion’ of the scattering intensity as a function of the azimuthal angle around the arc and orientational order parameters can be determined. This is reviewed in more detail elsewhere.10,58,59
Concluding remarks
In this Tutorial Review, diffuse scattering from lamellar phases formed by different types of soft material such as lipids, surfactants, clays, colloids, block polymers or semicrystalline polymers has been considered, with selected examples of published experiments. In addition, the basic underpinning theory has been outlined. The key features that can be obtained from analysis of the structure factor of fluctuating lamellar phases have been considered within a number of different models. The ability to obtain additional information on the lamellar elastic constants by experiments on aligned membranes has been highlighted. Recent developments in SAXS detector technology including pixel array detectors with high spatial resolution and high dynamic range, should enable further quantitative examination of the shape of the pseudo-Bragg peaks from lamellar structures as well as other diffuse scattering features. Here, we have also considered one-dimensional and two-dimensional in-plane ordering in lamellar phases that can result from in-plane structures, patterning of nanoparticles at the interface or (partially) ordered pre-transitional fluctuations or perforations. This is relatively less appreciated, and one aim of the present Tutorial Review is to draw attention to the application of Markov, Ising and hexatic models to describe in-plane diffuse scattering from lamellar phases such as those containing layers of nanoparticles, where such effects have not been considered.48 The analysis of such scattering should be considered in analysing data from other types of layered soft materials including those for which examples have been presented in this review and others (clays, colloids etc.), especially from well-ordered and/or aligned samples.Conflicts of interest
There are no conflicts to declare.References
- I. W. Hamley, Introduction to Soft Matter. Revised Edition, Wiley, Chichester, 2007 Search PubMed.
- R. A. L. Jones, Soft Condensed Matter, Oxford University Press, Oxford, 2002 Search PubMed.
- M. Doi, Soft Matter Physics, Oxford University Press, Oxford, 2013 Search PubMed.
- H. Frielinghaus and W. Pyckhout-Hintzen, in Clay-Polymer Nanocomposites, ed. K. Jlassi, M. M. Chehimi and S. Thomas, Elsevier, New York, 2017, ch. 10, pp. 327–361 Search PubMed.
- P. Davidson, C. Penisson, D. Constantin and J. C. P. Gabriel, Proc. Natl. Acad. Sci U. S. A., 2018, 115, 6662–6667 CrossRef CAS PubMed.
- P. G. de Gennes and J. Prost, The Physics of Liquid Crystals, 2nd edn, Oxford University Press, Oxford, 1993 Search PubMed.
- R. E. Peierls, Annales de l'Institut Henri Poincare, 1935, 5, 177–222 Search PubMed.
- L. D. Landau, Zh. Eksp. Teor. Fiz., 1937, 7, 19–32 CAS.
- L. D. Landau, Phys. Z. Sowjetunion, 1937, 11, 26–35 CAS.
- G. Vertogen and W. H. de Jeu, Thermotropic Liquid Crystals, Fundamentals, Springer-Verlag, Berlin, 1988 Search PubMed.
- J. Als-Nielsen, J. D. Litster, R. J. Birgeneau, M. Kaplan and C. R. Safinya, in Ordering in Strongly Fluctuating Condensed Matter, ed. T. Riste, Plenum, 1980 Search PubMed.
- J. Als-Nielsen, R. J. Birgeneau, M. Kaplan, J. D. Litster and C. R. Safinya, Phys. Rev. Lett., 1977, 39, 352–355 CrossRef CAS.
- C. R. Safinya, D. Roux, G. S. Smith, S. K. Sinha, P. Dimon, N. A. Clark and A. M. Bellocq, Phys. Rev. Lett., 1986, 57, 2718–2721 CrossRef CAS PubMed.
- G. S. Smith, C. R. Safinya, D. Roux and N. A. Clark, Molec. Cryst. Liq. Cryst., 1987, 144, 235–255 CrossRef CAS.
- V. M. Kaganer, B. I. Ostrovskii and W. H. Dejeu, Phys. Re. A, 1991, 44, 8158–8166 CrossRef CAS PubMed.
- J. Als-Nielsen and D. McMorrow, Elements of Modern X-ray Physics, Wiley, Chichester, 2001 Search PubMed.
- W. H. de Jeu, Basic X-ray Scattering for Soft Matter, Oxford University Press, Oxford, 2016 Search PubMed.
- N. Kucerka, Y. F. Liu, N. J. Chu, H. I. Petrache, S. T. Tristram-Nagle and J. F. Nagle, Biophys. J., 2005, 88, 2626–2637 CrossRef CAS PubMed.
- J. Pan, S. Tristram-Nagle, N. Kucerka and J. F. Nagle, Biophys. J., 2008, 94, 117–124 CrossRef CAS PubMed.
- G. Pabst, R. Koschuch, B. Pozo-Navas, M. Rappolt, K. Lohner and P. Laggner, J. Appl. Cryst., 2003, 36, 1378–1388 CrossRef CAS.
- C. Giacovazzo, H. L. Monaco, D. Viterbo, F. Scordari, G. Gilli, G. Zanotti and M. Catti, Fundamentals of Crystallography, International Union of Crystallography/Oxford University Press, Oxford, 1992 Search PubMed.
- B. D. Cullity and S. R. Stock, Elements of X-ray Diffraction, Prentice Hall, Upper Saddle River, New Jersey, 2001 Search PubMed.
- F. Nallet, R. Laversanne and D. Roux, J. Phys. (France) II, 1993, 3, 487–502 CrossRef CAS.
- I. W. Hamley, Small-Angle Scattering: Theory, Instrumentation, Data and Applications, Wiley, Chichester, 2021 Search PubMed.
- R. Hosemann and S. N. Bagchi, Direct Analysis of Diffraction by Matter, North-Holland, Amsterdam, 1962 Search PubMed.
- A. Caillé, C. R. Hebdo. Seances de l’Academie Sci. Ser. B, 1972, 274, 891–893 Search PubMed.
- R. T. Zhang, R. M. Suter and J. F. Nagle, Phys. Rev. E, 1994, 50, 5047–5060 CrossRef CAS PubMed.
- G. Pabst, M. Rappolt, H. Amenitsch and P. Laggner, Phys. Rev. E, 2000, 62, 4000–4009 CrossRef CAS PubMed.
- N. Lei, C. R. Safinya and R. F. Bruinsma, J. Phys. (France) II, 1995, 5, 1155–1163 CrossRef CAS.
- I. Bressler, J. Kohlbrecher and A. F. Thünemann, J. Appl. Crystallogr., 2015, 48, 1587–1598 CrossRef CAS PubMed.
- L. X. Tan, J. G. Elkins, B. H. Davison, E. G. Kelley and J. Nickels, J. Appl. Crystallogr., 2021, 54, 363–370 CrossRef CAS.
- N. Kucerka, M. P. Nieh, J. Pencer, T. Harroun and J. Katsaras, Curr. Opin. Colloid Interface Sci., 2007, 12, 17–22 CrossRef CAS.
- G. Pabst, N. Kucerka, M. P. Nieh, M. C. Rheinstadter and J. Katsaras, Chem. Phys. Lipids, 2010, 163, 460–479 CrossRef CAS PubMed.
- Y. Lyatskaya, Y. F. Liu, S. Tristram-Nagle, J. Katsaras and J. F. Nagle, Phys. Rev. E, 2001, 63, 011907 CrossRef CAS PubMed.
- H. I. Petrache, N. Gouliaev, S. Tristram-Nagle, R. T. Zhang, R. M. Suter and J. F. Nagle, Phys. Rev. E, 1998, 57, 7014–7024 CrossRef CAS.
- N. Chu, N. Kucerka, Y. F. Liu, S. Tristram-Nagle and J. F. Nagle, Phys. Rev. E, 2005, 71, 041904 CrossRef PubMed.
- Y. F. Liu and J. F. Nagle, Phys. Rev. E, 2004, 69, 040901 CrossRef PubMed.
- J. J. Pan, D. P. Tieleman, J. F. Nagle, N. Kucerka and S. Tristram-Nagle, Biochim. Biophys. Acta-Biomembr., 2009, 1788, 1387–1397 CrossRef CAS PubMed.
- T. Salditt, C. Munster, J. Lu, M. Vogel, W. Fenzl and A. Souvorov, Phys. Rev. E, 1999, 60, 7285–7289 CrossRef CAS PubMed.
- T. Salditt, M. Vogel and W. Fenzl, Phys. Rev. Lett., 2003, 90, 178101 CrossRef CAS PubMed.
- R. Holyst, D. J. Tweet and L. B. Sorensen, Phys. Rev. Lett., 1990, 65, 2153–2156 CrossRef PubMed.
- R. Holyst, Phys. Rev. A, 1990, 42, 7511–7514 CrossRef CAS PubMed.
- R. Holyst, Phys. Rev. A, 1991, 44, 3692–3709 CrossRef.
- T. R. Welberry, Rep. Prog. Phys., 1985, 48, 1543–1593 CrossRef CAS.
- I. W. Hamley, J. P. A. Fairclough, N. J. Terrill, A. J. Ryan, P. M. Lipic, F. S. Bates and E. Towns-Andrews, Macromolecules, 1996, 29, 8835–8843 CrossRef CAS.
- I. W. Hamley, J. P. A. Fairclough, A. J. Ryan, F. S. Bates and E. Towns-Andrews, Polymer, 1996, 37, 4425–4429 CrossRef CAS.
- A. M. Jimenez, A. A. Krauskopf, R. A. Perez-Camargo, D. Zhao, J. Pribyl, J. Jestin, B. C. Benicewicz, A. J. Muller and S. K. Kumar, Macromolecules, 2019, 52, 9186–9198 CrossRef CAS PubMed.
- A. A. Krauskopf, A. M. Jimenez, A. S. Altorbaq, A. J. Muller and S. K. Kumar, ACS Nano, 2021, 15, 14430–14443 CrossRef CAS PubMed.
- J. O. Rädler, I. Koltover, T. Salditt and C. R. Safinya, Science, 1997, 275, 810–814 CrossRef PubMed.
- I. Koltover, T. Salditt, J. O. Rädler and C. R. Safinya, Science, 1998, 281, 78–81 CrossRef CAS PubMed.
- F. Artzner, R. Zantl, G. Rapp and J. O. Rädler, Phys. Rev. Lett., 1998, 81, 5015–5018 CrossRef CAS.
- I. W. Hamley, V. Castelletto, O. O. Mykhaylyk, Z. Yang, R. P. May, K. S. Lyakhova, G. J. A. Sevink and A. V. Zvelindovsky, Langmuir, 2004, 20, 10785–10790 CrossRef CAS PubMed.
- I. W. Hamley, K. A. Koppi, J. H. Rosedale, F. S. Bates, K. Almdal and K. Mortensen, Macromolecules, 1993, 26, 5959–5970 CrossRef CAS.
- I. W. Hamley, M. D. Gehlsen, A. K. Khandpur, K. A. Koppi, J. H. Rosedale, M. F. Schulz, F. S. Bates, K. Almdal and K. Mortensen, J. Phys. (France) II, 1994, 4, 2161–2186 CrossRef CAS.
- M. Imai, A. Kawaguchi, A. Saeki, K. Nakaya, T. Kato, K. Ito and Y. Amemiya, Phys. Rev. E, 2000, 62, 6865–6874 CrossRef CAS PubMed.
- M. Imai, A. Saeki, T. Teramoto, A. Kawaguchi, K. Nakaya, T. Kato and K. Ito, J. Chem. Phys., 2001, 115, 10525–10531 CrossRef CAS.
- M. Imai, K. Sakai, M. Kikuchi, K. Nakaya, A. Saeki and T. Teramoto, J. Chem. Phys., 2005, 122, 214906 CrossRef CAS PubMed.
- M. Deutsch, Phys. Rev. A, 1991, 44, 8264–8270 CrossRef PubMed.
- P. Davidson, Prog. Polym. Sci., 1996, 21, 893–950 CrossRef CAS.
| This journal is © The Royal Society of Chemistry 2022 |