 Open Access Article
Aqueous phase hydrogenation of maleic acid to succinic acid mediated by formic acid: the robustness of the Pd/C catalytic system†
Ana
Orozco-Saumell
a,
R.
Mariscal
 a,
J.
Iglesias
 b,
P.
Maireles-Torres
 c and
M.
López Granados
 *a
*a
aEQS Group (Sustainable and Chemistry Group), Institute of Catalysis and Petrochemistry (CSIC), C/Marie Curie 2, 28049 Madrid, Spain. E-mail: mlgranados@icp.csic.es
bChemical & Environmental Engineering Group, Universidad Rey Juan Carlos, C/Tulipan s/n, Móstoles, 28933 Madrid, Spain
cUniversity of Málaga, Department of Inorganic Chemistry, Crystallography and Mineralogy. (Associated Unit to ICP-CSIC), Facultad de Ciencias, Campus de Teatinos, 29071 Málaga, Spain
First published on 13th October 2022
Abstract
Long-term liquid phase studies of the activity in the formic acid-mediated hydrogenation of MAc to SAc were conducted in a fixed bed continuous reactor for two relevant situations: neutralising maleic and formic acids with NaOH and at the pH determined by both acids. Deactivation could only be observed when the catalyst was subjected to a WHSV of MAc above 13 gMAc gcat−1 h−1. Despite this deactivation, the reaction conditions can be adjusted (lowering the reaction temperature and/or decreasing the WHSV) to compensate for the loss of activity. Thus, for the neutralisation case, the catalyst could present a yield of SAc close to 100% for at least 400 h at a WHSV-MAc of 13 gMAc gcat−1 h−1 by setting the temperature at 180 °C, corresponding to an overall productivity above 5300 g of SAc per gcat, equivalent to more than 107 kg of SAc per gPd. An in-depth study of the catalyst used under these severe conditions was also conducted using a number of physico-chemical techniques. The sintering of Pd particles, Pd leaching, reduction–carbidization of Pd2+ and/or Pd into Pd carbides (PdCx) and deposition of organic compounds were identified in the spent catalysts for both the neutralised and acid runs. The presence of Na+ and of CO chemisorbed at the surface of the catalyst were also detected in the neutralised and acid cases, respectively. The rinsing of the catalyst with aqueous H2SO4 or treating the catalyst at 200 °C with streams containing O2 or H2 did not reactivate the catalyst. We concluded that the relevant causes of deactivation are Pd leaching and deposits of organic compounds; CO poisoning is also likely in the acid case. This is in agreement with the fact that deactivation is detected under high MAc-WHSV: the rate of leaching, CO chemisorption and deposition accelerates upon increasing it.
Introduction
Succinic acid and its dehydrated anhydride form are used by the chemical industry in a number of applications, such as the production of γ-butyrolactone, 1,4-butanediol (BDO), tetrahydrofuran, pharmaceuticals, food and agrochemical products1,2 and in the production of polymers such as polybutylene succinate (the latter actually a biodegradable polyester from succinic acid and its derivative BDO).3–5 Until recently, the only available commercial route to produce succinic acid (SAc) was the hydrogenation of maleic acid (MAc) or maleic anhydride (MA) derived from fossil oil.1,2,6,7 However, a fermentative route using biomass resources (carbohydrates) has also been developed. Several companies have initiated the commercialization of the process and opened medium-scale plants to demonstrate the feasibility of the production of fermentative SAc. The price of SAc is claimed to be quite comparable with respect to fossil-derived SAc, $2860 vs. $2500 ton−1, respectively.6–10 The projections were that the fermentation process would have contributed to soaring SAc production above 700 kton by 2020. However, the fermentative process presents several drawbacks associated with the separation and purification of SAc from the fermentation broth that threaten its viability. In 2012, the world annual production was 40 kton,10 and in 2019, the production was 65 kton,11 encouraging the search for and the development of alternative renewable routes for SAc production.Interestingly, the fossil route can become fully renewable if MA is derived from biomass feedstock. Several chemical oxidation technologies have demonstrated feasibility at the laboratory scale to obtain MA or MAc from different biomass-derived platforms, namely, butanol, levulinic acid, hydroxymethylfufural and furfural.12 Furfural seems to be the best option because the rest of the biobased platforms are not yet commercialized, and furfural is currently a renewable commodity with a global production above 300 kton per year.13,14 The price between 2006 and 2016 was $800–1600 ton−1 and the price is expected to remain in the $1000–1100 ton−1 range in the future.15
Both liquid phase and gas phase oxidation of furfural to MA or MAc has previously been investigated with promising results.12 However, this is not the only requirement for producing sustainable succinic acid, since a second condition must be fulfilled, that is, MA/MAc must be hydrogenated with green H2. FAc can also be obtained from biomass16–18 and the utilisation of formic acid (FAc) to supply the H atoms required for the hydrogenation of C–C double bonds has widely been demonstrated.19 In addition, the utilisation of formic acid (FAc), a liquid at room temperature, prevents the safety issues associated with the handling and storage of H2 gas at high pressure. In summary, it is technically feasible that the fossil route to produce SAc via MAc hydrogenation can become a fully renewable route.
Hydrogen transfer from formic to maleic acid can be conducted either under the natural acid pH, resulting from the presence of the carboxylic acids, or by using the neutralised forms of maleic and formic acids.20 The former option presents the advantage of the spontaneous separation of SAc from the reaction medium due to the low solubility of SAc in water that facilitates the purification of SAc (overcoming one of the main problems of the fermentation route, the expensive separation of SAc from the fermentation broth). However, operating under natural pH at relatively high temperature requires the utilisation of expensive stainless steel equipment. In contrast, operating with neutralised acids presents the advantage of a faster reaction rate20 and less severe conditions, but unfortunately, succinate salts are much more soluble in water than SAc, and its separation from the reactor effluent would require approaches similar to those used in the fermentation route.
The formic acid-mediated hydrogenation of MAc to SAc is technically feasible using C-supported Pd catalysts.20 The reaction essentially proceeds via concerted transfer of the hydrogen atoms from the formic acid molecule to the maleic acid (CTH mechanism). Formyl H of formic acid is involved in the rate determining step of the reaction.20 Using this catalytic system, the reaction can proceed in aqueous medium with a stoichiometric amount of FAc and under quite mild operation conditions (423 K and 1–10 atm of inert gas). Using an aqueous solution with 15 wt% MAc under natural pH and an overall Weight Hourly Space Velocity (WHSV) of 12 h−1 (WHSV of MAc = 1.8 h−1) renders a succinic acid yield above 98%, equivalent to a productivity close to 1.8 gSAc gcat−1 h−1. No deactivation was observed during a durability test conducted in a fixed bed continuous flow reactor for more than 700 h, which evidenced that the causes of deactivation, if any, are not intense. Similar results were observed when MAc and FAc were previously neutralised with NaOH before feeding into the reactor.
Productivity and robustness are key properties of a catalyst when considering hypothetical commercialization. Economic viability requires high reactor productivity, and the latter implies operating at high reactant flow rates. Consequently, the catalyst is subjected to more demanding reaction conditions because higher temperatures are needed to cope with higher MAc concentrations at higher flow rates.
Previous long-term experiments on the stability of Pd/C in maleic acid hydrogenation with formic acid were carried out under conditions that rendered quantitative substrate conversion into succinic acid.20 Under these reaction conditions, medium to low impact deactivation phenomena could have been overlooked. Bearing this in mind, to obtain a higher productivity and better insight into both the stability of the catalyst and the true nature of deactivation phenomena, durability tests must be explored under more demanding conditions using high MAc-WHSV rates. Opportunely, these tests render medium MAc or FAc conversion that would make visible the medium to low impact deactivation causes. Besides, as the amount of reactants and products (or side-products) in contact with the catalyst bed is intensified, obviously also the deactivation phenomena caused by all the reaction components (by fouling, poisoning or leaching) are intensified. In summary, processing feed with high MAc flow rates is a key for a hypothetical commercialization of the process but, in practice, can also accelerate the deactivation processes.
This work aimed to deeply explore the robustness limits of Pd/C catalysts and their deactivation under highly demanding operating conditions. In addition to the deactivation study, the physicochemical properties of the spent catalysts were also investigated and compared to the physicochemical properties of the fresh catalyst, aiming at drawing conclusions regarding the likely causes of deactivation and their impact on the deterioration of the performance of the catalyst. Finally, the possibility of regeneration was also attempted after subjecting the spent catalysts to different treatments, including calcination, hydrogenation and rinsing with sulfuric acid solution. Although these treatments failed to reactivate the catalyst, they provided some clues about the main reasons behind the catalyst deactivation.
Materials and methods
Reagent and materials
Maleic acid (99 wt%), formic acid (98 wt%), malic acid (99 wt%), fumaric acid (99 wt%) and levulinic acid (99 wt%) and NaOH solution (50 wt%) were all supplied by Sigma-Aldrich. Commercial catalyst based on palladium (labelled as 5 wt%) supported on activated charcoal were supplied by Sigma Aldrich (reference 75992).Catalytic experiments
The catalyst was held firmly between silica chip beds and quartz wool inside ½” stainless steel tubing. The reactor tubing was jacketed by an aluminium block that was heated by an electric furnace. The temperature of the catalyst was measured by locating a thermocouple between the aluminium jacket and the reactor at the position where the catalyst bed was inside the reactor. The liquid flows from the bottom to the top. The catalyst was loaded at the bottom part of the reactor so that the liquid quickly contacted the catalyst bed and prevented the formation of undesirable byproducts (fumaric and malic acid). Pressure conditions were maintained by a backpressure regulator set at 10 bar. A total flow of 10 mL min−1 of N2 flushes the reactor downstream lines to rapidly restore the reaction pressure (that goes down) when sampling. Typically, the general reaction protocol consisted of the following: once at 10 bar and at the reaction temperature, an aqueous solution of formic acid and maleic acid was pumped through the fixed bed reaction using a high-performance liquid chromatography (HPLC) pump (Gilson) at a given flow rate (t0 of the experiment). In the case of flowing the nonneutralised feed, a NaOH solution was incorporated into the solution exiting the rector to neutralise the acid products, preventing the precipitation of fumaric acid and the consequent clogging of the reactor. This step is obviously not needed when flowing the neutralised feed. Samples were periodically withdrawn from a reservoir located upstream of the backpressure regulator that allows the gas/liquid separation and storage of the liquids. The liquid samples were accumulated for a given time and then collected by draining the reservoir. The actual liquid flow rate agreed with the flow rate set on the pump within ±3%.A known amount of the liquid sample (ca. 3 g) was aliquoted and analysed by HPLC following the procedure described. A known amount (approximately 0.3 g) of an aqueous levulinic acid (LAc) solution with a known concentration (approximately 0.16 g of LAc per g of solution) was incorporated into the aliquot as an internal standard (a few tenths of grams of NaOH (50 wt%) solution was also incorporated to prevent SAc, FumAc or MAc precipitation when needed). The resultant solution was filtered through a 0.22 μm syringe filter and analysed in an Agilent 1200 HPLC chromatograph equipped with a refraction index detector and a Bio-Rad Aminex HPX-87H column (300 mm × 7.8 mm). A 0.8 mL min−1 5 mM H2SO4 mobile phase was used for the analysis, and the temperature of the column was 353 K.
MAc conversion and product yields were calculated according to the following formula:
where c0MAc refers to the mol g−1 of the aliquot fed into the reactor, and cMAc and cprod refer to the number of mol g−1 of the aliquot of MAc and products, respectively, in the reaction mixture sampled at a given time.
Characterisation techniques
The chemical analysis of the content of Pd and Na in samples of the fresh and spent catalysts was performed by means of inductively coupled plasma–optical emission spectrometry (ICP–OES) using a Varian 720-ES ICP unit. Prior to the analysis, the samples were subjected to acid digestion by treating the samples in aqua regia for 2 h under reflux conditions, and the spectrophotometer was calibrated with standard stock solutions.X-ray diffraction patterns were recorded on a PANalytical X'Pert PRO MPD diffractometer working in reflection geometry (θ/2θ) and using the X'Celerator RTMS (Real Time Multiple Strip) detector with an active length of 2.122°. The patterns were collected with a long fine focus Cu tube working at 45 kV and 40 mA. The incident beam optic path contained a primary monochromator that yielded a strictly monochromatic, λ = 1.54059 Å radiation. A typical scan range was used, measuring from 4.0 to 90.0° 2θ with a step size of 0.0167° 2θ and a scan step time of ca. 500 s.
For the determination of the Pd dispersion and the mean particle size, a number of transmission electron microscopy (TEM) images were taken to obtain a representative collection of Pd particles (over 200) present over the C support. A TEM/scanning TEM (STEM) (JEOL 2100F) microscope operating at 200 kV with a field emission gun and a point resolution of 0.19 nm was used for the recording of the pictures. The mean dispersion was estimated from the relationship below, originally deduced by A. Borodziński et al.21
where V is the volume occupied by a metal atom in the unit cell (14.6984 Å3 for Pd), and A is the area occupied by a Pd atom (7.9343 nm2).
XPS analysis was conducted with a Physical Electronics PHI VersaProbe II spectrometer equipped with nonmonochromatic Al Kα radiation (53.6 W and 1486.6 eV) and a multichannel detector. Spectra were recorded using a 200 μm diameter analysis area. A PHI ACCESS ESCA-V6.0 F software was utilised for the acquisition, and the CasaXPS program was utilised for the fitting and deconvolution of the different XPS spectra. Gaussian–Lorentzian curves were used to fit the shape of the XPS core levels to accurately determine the binding energies and the area of the different element core levels. A Shirley-type background was used to simulate the XPS background curve.
Evolved gas analyses by mass spectrometry (EGA-MS) were performed by loading the samples (ca. 0.1 g) in a U-shaped quartz reactor heated by an electric furnace. The exit of the reactor was connected to a Balzer Prisma™ quadrupole mass spectrometer (QMS 200), and the gas lines from the reactor outlet to the MS inlet were heated to 393 K to prevent the condensation of H2O. The analysis was conducted while heating at a heating rate of 0.167 K min−1 and flowing 50 mL min−1 of either 20 vol% O2/Ar mixture (O2-EGA-MS experiments) or 20 vol% H2/Ar mixture (H2-EGA-MS experiment). The release of the following molecules was monitored by tracing the corresponding fragments: H2O (m/z = 18 and 17), CO (m/z = 28) and CO2 (m/z = 44 and 28). Besides, MAc, SAc, FAc, 1,4-butanediol, tetrahydrofuran (THF) and γ-butyrolactone representative fragments were also recorded but none of the latter were observed. The intensity of the Ar fragment (m/z = 40) was used as an internal standard.
Results and discussion
Deactivation studies with fully neutralised MAc and FAc acids
Together with the target product (SAc), the studied reaction system incorporates the formation of fumaric (FumAc) and malic (MAc) acids as side-products. Scheme 1 summarises the possible routes of formation of all the possible products:20 FumAc is produced by isomerization of MAc; SAc can be produced by hydrogenation either from MAc or FumAc acids; MalAc evolves by hydration of the C–C double bond at MAc or FumAc. SAc cannot be formed from MalAc.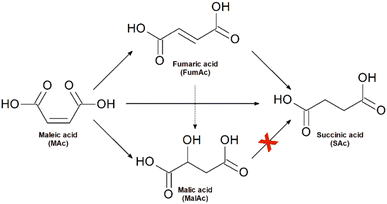 | ||
| Scheme 1 The reaction scheme takes place when treating maleic acid with formic acid in the presence of Pd/C catalysts. | ||
As explained above, the reaction can be conducted either under the natural pH caused by MAc and FAc deprotonation or using fully neutralised maleic and formic acids. Although each approach presents pros and cons, only after a thorough economic and environmental analysis can the more economic and sustainable option be determined. This is out of the goal of this study, and consequently, we conducted the study for both operating conditions.
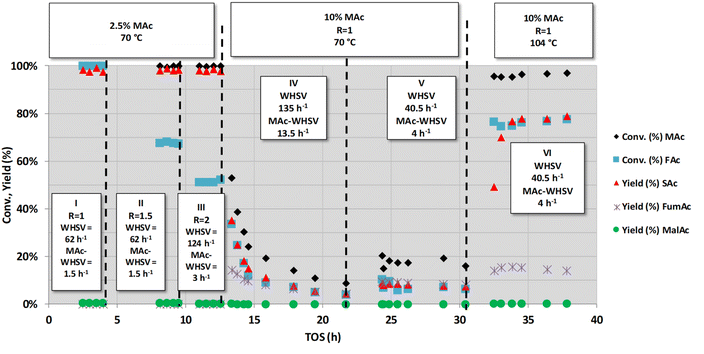
We first initiated the study neutralising both MAc and FAc with NaOH. These experiments are represented in Fig. 1. Sodium maleate and formate are fed into the reactor, and sodium succinate, malate and fumarate are formed, all along with sodium bicarbonate and carbonate, the latter two formed by the reaction of the CO2 released from formic acid. Acid neutralisation prevents the precipitation of the very insoluble fumaric acid which may occur at acidic pH while operating at low-mid substrate conversion, eventually resulting in clogging of the reactor (sodium fumarate is more soluble than fumaric acid23). For the sake of simplicity, in these experiments, we will still refer to the compounds in their acid acronym (MAc, SAc,…), although strictly speaking they occur as carboxylate species.
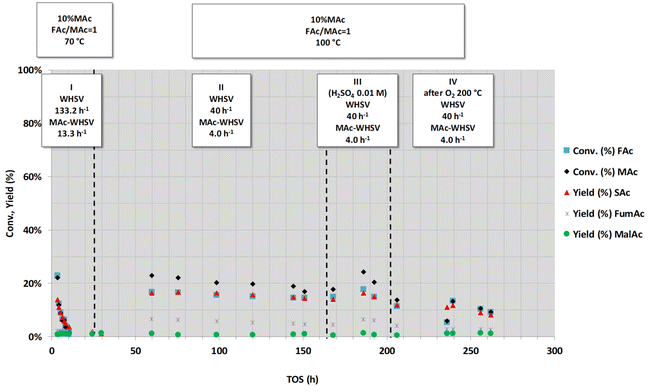
Fig. 1 shows a series of experiments conducted under selected conditions to obtain intermediate substrate conversion. At close to complete conversion, the causes of deactivation can be unnoticed. The other purpose was to use more demanding conditions: higher FAc concentration, higher flow rates of MAc (higher WHSV and/or MAc concentration) and higher temperatures, looking for a higher productivity and to visibilize any deactivation phenomenon with medium-low impact. Three main types of experiments were conducted, as indicated by the three headings in the figure. In the first series of experiments (periods I, II and III), the temperature (70 °C) and concentration of MAc (2.5 wt% MAc) were kept constant while the FAc/MAc ratio (R) was increased from 1 to 2. Experiments were conducted at lower temperatures than those previously used in the study published in ref. 20 (70 °C vs. 150 °C) with the intention of having mid- to low-conversions. The experiments of the periods I and II were both conducted at an overall WHSV = 62 h−1 (flow rate 0.5 mL min−1), equivalent to a WHSV of MAc = 1.5 h−1 whereas in period III, the flow rate was increased to 1 mL min−1, and consequently, the WHSV and MAc-WHSV were increased to 124 and 3 h−1, respectively. In period I, no deactivation was observed, with the MAc and FAc conversion and the yield of SAc close to 100%, which, as in,20 precludes a definitive conclusion about the possible deactivation. In the experiments of period II in which the concentration of FAc/MAc ratio increases from 1 to 1.5, MAc conversion is still close to 100%, but interestingly, formate conversion was close to 70%. This 70% FAc conversion was maintained for the six hours the period II lasted, indicating that the catalyst did not deactivate. The same can be concluded from period III (from 9 to 13 h on stream): MAc conversion was 100%, but the increase in both FAc concentration and WHSV resulted in lower but constant FAc conversion (approximately 50%) for over 4 h on stream.
In the next period (period IV, from 13 to ca. 22 h), the MAc-WHSV was quadrupled (13.5 h−1) by using a fourfold increase in MAc concentration (now 10 wt%), keeping the temperature at 70 °C, the overall WHSV (135 h−1) and the FAc/MAc ratio at 1. The overall WHSV, 135 h−1, was similar to the overall WHSV of period III because the same flow rate was pumped through the reactor, 1 mL min−1; however, the higher density of the solutions caused by the larger MAc concentration, 10 wt%, led to a slight increase in the overall WHSV compared to period III. Only two hours after switching from the previous period III (time on stream, TOS, = 14.5 h) MAc conversion had already dropped to ca. 22% and an SAc yield of ca. 12%. The drop continued for the duration of period IV. This continuous and persistent drop in the activity cannot be assigned to a flushing of the previous reaction solution of period III out of the dead volume downstream of the catalytic bed. A conservative estimation of the dead volume downstream of the catalytic bed, 10–15 mL, indicates that this dead volume represents less than 15 min of flowing. In this way, we concluded that the observed reduction in substrate conversion and target product yield is ascribed to the deactivation of the catalyst. Deactivation is also evident in the conversion of FAc and in the yield to side products such as FumAc. At TOS = 21.7 h, the MAc conversion continued to drop to ca. 8% and the yield of SAc to ca. 5%. At this TOS, the catalyst was still being deactivated, although at a much lower rate.
In the next period V, new conditions were set to increase the conversion of MAc to determine if the catalyst had been fully deactivated: the flow rate was decreased from 1 to 0.3 mL min−1 (3.3 times lower) while keeping the MAc concentration and the rest of the reaction conditions. Accordingly, the overall WHSV and MAc-WHSV were decreased to 40.5 and 4.05 h−1, respectively. This decrease in the flow rate resulted, as expected, in an increase in the conversion and yield. Interestingly, the catalyst does not experience any deactivation during period V (from 21.7 to 30.5 h on stream).
In the next set of experiments (period VI), the temperature was raised to 104 °C (the rest of the conditions were kept as in period V). The extension of the different reactions taking place was enhanced: the conversion of MAc rose above 95%, and the FAc conversion and SAc yield increased to approximately 80%. No deactivation was observed for more than 8 hours on stream, and the increase in the temperature did not result in the acceleration of the catalyst deactivation, meaning that the deactivation is not related to thermal effects.
In summary, from these first sets of experiments, we can conclude that the deactivation of the catalyst could only be accelerated and evidenced when MAc-WHSV is above 13 h−1; otherwise, the deactivation phenomena are so slow that they can hardly be detected. In other words, only when a large amount of reactants and/or products have contacted the catalyst, the deactivation is revealed. Once the catalyst is extensively deactivated, the deactivation of the catalyst is decelerated, and an increase of the temperature does not result in faster deactivation.
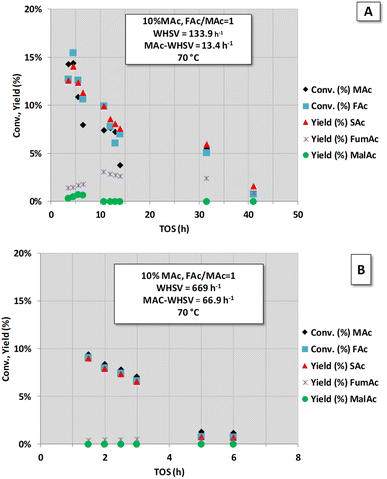
To obtain better insight into the influence of high MAc-WHSV on catalyst deactivation (period IV of Fig. 1), a new set of experiments was conducted with higher MAc-WHSV values. A fresh sample of the catalyst (now 0.1 g) was contacted from the very beginning (t = 0) with the same (Fig. 2A) and double (Fig. 2B) MAc-WHSV used in the period IV of Fig. 1 (0.2 and 1 mL min−1 of 10 wt% MAc solution are now respectively used). The results are displayed in Fig. 2. The reaction conditions applied for the results depicted in Fig. 2A were similar to the reaction conditions used in period IV of Fig. 1 (to obtain a similar WHSV value a lower flow rate, 0.2 mL min−1, compensates the lower catalyst loading in the reactor). Here, again, the catalyst rapidly deactivates, and after 40 h of time-on-stream, the activity is negligible. Subjecting a fresh catalyst to even higher MAc-flow rates (higher MAc-WHSV) by increasing the flow rate to 1 mL min−1 (Fig. 2B) led to faster catalyst deactivation, and only 6 h of time-on-stream was required to have negligible activity.
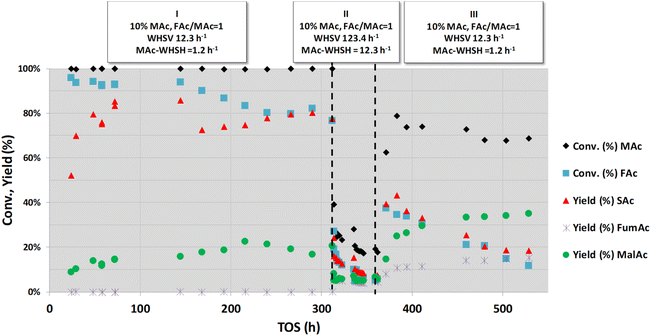
Fig. 3 shows another long-term set of experiments conducted after those conditions represented in Fig. 2B (actually, the very narrow period I in Fig. 3 corresponds with those experiments shown in Fig. 2B). This figure depicts the results from the experiments conducted for a very long time-on-stream (more than 800 h). Periods II and III of Fig. 3 were conducted at lower MAc-WHSV (lower flow rates) and higher temperatures (102 and 160 °C, respectively) than in period I. These experiments show that the increase in the reaction temperature and contact time (the latter accomplished by the decrease in the flow rate) resulted in an increase in the extension of all the reactions. These results show that the catalyst was not fully deactivated during the assay conducted in period I and that the active sites still possess catalytic activity. The catalyst apparently did not deactivate for the ca. 250 h periods II and III lasted. Substrate conversion and product yields are all well above those obtained under the same conditions for a blank reaction experiment (no catalyst, homogeneous contribution), which was found to be 0.9% of SAc yield and 1.0% of malic acid. These periods II and III results are in agreement with the results displayed in periods V and VI of Fig. 1, which also showed that after the intense deactivation period and once the deactivation rate is significantly slowed down, the catalytic activity can be enhanced by properly changing the reaction conditions.
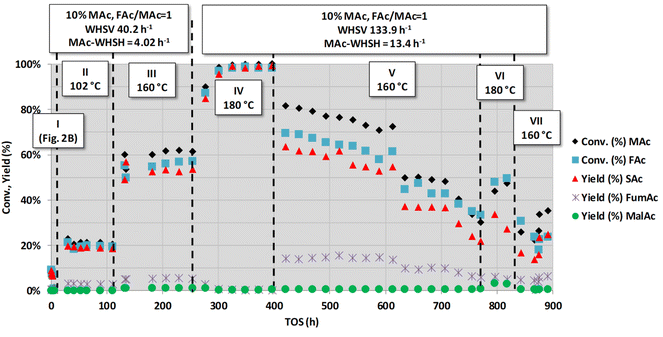 | ||
| Fig. 3 Catalytic activity obtained with fully neutralised acids at different reaction temperatures, flow rates (overall and MAc-WHSVs) and MAc concentrations. Common reaction conditions: catalyst loading = 0.1 g, pressure = 1.01 MPa and mol FAc/MAc = 1. The conditions of the period I were those of Fig. 2B. In the periods II and III the WHSV is decreased to 40.2 h−1 and the temperature increased to 102 °C and 160 °C, respectively. In the periods IV to VII the overall and MAc-WHSV were increased to 133.9 and 13.4 h−1, respectively, with respect to that of period III and temperatures set at 180, 160, 180 and 160 °C, respectively. | ||
A close to quantitative MAc conversion to SAc was accomplished in the next IV period. In this experiment, almost triple the flow rate was used (WHSV = 133.9 h−1 and MAc-WHSV = 13.4 h−1), but the higher temperature (180 °C) largely compensated for the shorter contact time. Interestingly, there is a transient period of ca. 70 h, from the beginning of period IV, up to 325 h on stream, leading to an increase in the activity of the catalyst. After this stage, in which the catalyst seems to undergo reconditioning, MAc conversion and SAc yield reached values close to 100% and remained stable for the rest of period IV (up to 397 h on stream). Deactivation would eventually be observed because MAc-WHSV >13 h−1 leads to a fast loss of catalytic activity, but the deactivation of the catalyst might be hidden behind the achieved full conversion. Actually, in the next period (period V), when the reaction temperature was cooled to 160 °C, keeping the MAc-WHSV unchanged, slow but continuous deactivation was detected. Thus, at the beginning of period V (421 h on stream), the MAc conversion and SAc yield were 83 and 62%, respectively, and at the end of period V (771 h on stream), the values dropped to 33 and 22%, respectively. The reaction rate of SAc formation at the beginning of this period V was 1.22 mmolSAc gcat−1 min−1 whereas at the end was 0.42 mmolSAc gcat−1 min−1. These latter results again confirm that the deactivation of the catalyst is fast when high MAc-flow rates are used.
After period V, the temperature was set again at 180 °C (period VI), keeping the overall previous conditions and MAc-WHSH values. The activity increases because of the higher temperature conditions, but the catalytic performance was not as high as in period IV because the catalyst was deactivated during period V, indicating that there is a saturation effect in the deactivation. The accumulation over time of the causes of deactivation, enhanced by the high MAc-WHSV, finally impacts the performance of the active sites, and the deactivation is revealed under conditions that previously did not make the deactivation visible.
Summarizing all the results discussed thus far, we can conclude that the Pd/C catalyst suffers from deactivation. The deactivation is not related to thermal effects but to prolonged and accumulated contact of the surface of the catalyst with the reactants (in our case, sodium maleate or formate), some of the derived products (succinate, fumarate, malate, hydrogen and CO2 or bicarbonate) or other minor and undetectable side-products. This strongly suggests that leaching, fouling or poisoning is involved in deactivation. The deactivation rate is low and hardly detectable using low MAc flow rates because the molar flow of the deactivating agent that is contacting the catalyst is low. However, when the catalyst surface is contacted with a large amount of the deactivating chemical agent(s), which is rapidly achieved using a high MAc-WHSV, the deactivation becomes visible.
Considering a practical application of this system, the results of period IV unambiguously demonstrate that the extension of productivity of the catalyst and, in practice, the extension of its working life can be accomplished by counteracting the loss of activity by increasing the temperature. Another remarkable conclusion is that although the catalyst deactivates at MAc-WHSV >13 h−1, the productivity of SAc is still very high. Thus, under the operating conditions using period IV of Fig. 3 and assuming that the catalyst was working for 400 h at an MAc yield of 99% conversion, the catalyst productivity would be higher than 5300 g of SAc per gcat, equivalent to more than 107 kg of SAc per gPd, assuming a content of Pd in the catalyst of 5 wt% (the nominal loading given by the supplier). This productivity is in practice higher than the productivity previously reported in ref. 20 for longer time on stream but with lower MAc-WHSV (134 g of SAc per gcat for 150 h using solutions with the non-neutralised acid or 950 g of SAc per gcat for 750 h using fully neutralised acids). In conclusion, although the catalyst deactivates, its capacity to produce SAc is remarkable.
Before discussing the long-term study with the non-neutralised acids, we would like to comment first on some of the results of Fig. 3. Although the catalyst is deactivated in period V, the catalytic properties were in the same range as those of period III, despite the larger WHSV values (three times faster flow rate) employed in this period V. Actually, the reaction rate of period III was ca. 0.31 mmolSAc gcat−1 min−1 whereas the reaction rate at the beginning of the period V was 1.22 mmolSAc gcat−1 min−1 and at the end was 0.42 mmolSAc gcat−1 min−1. In practice, within the whole period V, the reaction rate was above that found in the period III. This may support the hypothesis that during the initial transient period of the previous period IV, the catalyst was reactivated by the cleansing effect of the combination of high temperatures and high flow rate. The chemical reasons behind this reactivation were not clear, but it is clear that they took place.
Deactivation studies with non-neutralised MAc and FAc acids (acid medium)
As indicated in the Introduction section, hydrogen transfer between formic and maleic acid can be conducted in practice under natural pH conditions. Although this approach implies harsher operating conditions because of the low pH of the feed and because of a higher thermal demand (the reaction rate is slower at acidic pH than in the neutralised case, and higher temperatures are needed to compensate for the slower reaction rate), this strategy is advantageous because of the quite low solubility of SAc in water. SAc precipitates at room temperature, facilitating its separation from the reaction medium and its purification.20 Consequently, the robustness of the catalyst under this more demanding synthesis strategy also deserves to be investigated.Fig. 4 represents the study of the deactivation of the catalyst using an aqueous solution of the reactants in acid form (10 wt% of MAc and mol FAc/MAc = 1). Initially (period I), temperature, pressure and overall WHSV conditions similar to the conditions previously reported for similar FAc–MAc solutions20 (150 °C, 1.01 MPa and WHSV = 12.3 h−1, respectively) were used. These conditions were selected to have a moderate SAc yield. The presence of a relatively high malic acid (MalAc) yield is because MAc is not fully converted to SAc in the catalyst bed, and this unreacted MAc is then converted to MalAc (yield between 10–20%) in the dead volume downstream of the catalyst bed, still at 150 °C, and favoured by the acidic pH of the liquid.20 After an initial transient period of 50 h, the SAc yield was maintained between 70–80%, and no sign of intense deactivation was observed for 312 h on stream under this condition. After this period I, the flow rate was increased 10-fold to achieve similar overall WHSV and MAc-WHSV values (123.4 and 12.3 h−1) that previously resulted in the rapid deactivation of the catalyst for neutralised medium (see period II in Fig. 4). As expected, because the flow rate is now 10 times larger and consequently the contact time is 10 times smaller, the obtained MAc and FAc conversions and SAc yield were smaller. Moreover, continuous and persistent deactivation took place during the 50 h the period II lasted. Thus, the MAc conversion and SAc yield decreased from 39% and 23%, respectively, at the beginning of period II to 18% and 7% at the end of this period. Again, as when treating neutralised MAc–FAc solutions (Fig. 1 and 2), the catalyst is rapidly deactivated by the combination of a high MAc concentration and a high flow rate of the liquid-fed solution.
In period III, the reaction conditions are brought back to the initial conditions of period I. We clearly observed that the catalyst was deactivated during the previous step because the catalytic performance was much worse than the performance displayed by the fresh catalyst. The reaction rate at the beginning of the period III was 0.07 mmolSAc gcat−1 min−1 whereas the average reaction rate in the period I was 0.14 mmolSAc gcat−1 min−1. Moreover, the catalyst deactivates (at the end of period III the reaction rate was 0.03 mmolSAc gcat−1 min−1) although at a slower rate than that observed in period II.
The contact of the catalyst with the demanding conditions of period II challenges the resistance of the catalyst, and even conditions that earlier did not result in visible deactivation now do, indicating that a saturation effect is involved in the deactivation. This exhaustion of the catalyst was already observed for the experiments with fully neutralised acids. The accumulated effect of the causes of deactivation finally impacts the availability of active sites, and the deactivation is then revealed under conditions that previously did not result in the deactivation.
Characterisation of the fresh and spent Pd/C catalysts
Different characterisation techniques were used to identify changes in the chemical, structural, morphological and surface properties of the catalysts after being used as explained above. Both the catalyst used in neutralised and acid media were investigated. The catalyst used with the neutralised FAc and MAc feed corresponds to the catalyst downloaded from the reactor after the set of experiments described in Fig. 1, whereas the spent catalyst used under acidic conditions was obtained with an accelerated ageing process similar to the ageing process of period II of Fig. 4.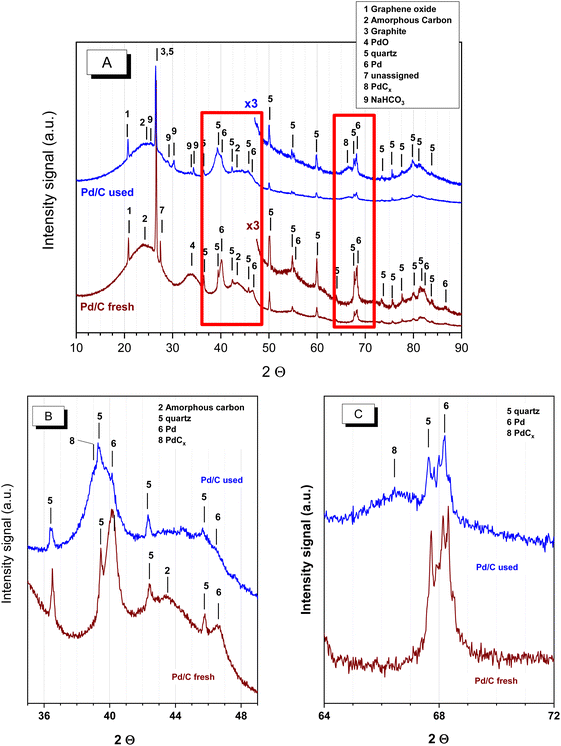 | ||
| Fig. 5 XRD patterns of the fresh and spent catalyst used with neutralised acids. (A) 2θ from 10° to 90°, (B) 2θ from 35°–49° and (C) 2θ from 64°–72°. | ||
Three relevant differences can be observed between the fresh and spent samples. The first difference is the disappearance of peak 4 assigned to PdO, indicating that PdO undertook a process of reduction in the reducing environment provided by the reaction medium (formic acid is a reducing agent that has already been used for the reduction of PdO particles in the liquid phase). The second modification, less evident in Fig. 5A, is better observed in the more detailed Fig. 5B and C: the lower intensity of the Pd peaks (marked as 6). This decrease in the intensity of peak 6 also comes with the presence of other features at lower 2θ angles, marked as 8 in the Fig. 5B and C, arising from the presence of Pd carbides (PdCx). The presence of Pd carbides has already been observed when treating several supported and nonsupported Pd systems with a broad variety of oxygenated and nonoxygenated organic molecules at moderate temperatures, even in the presence of O2:28–31 C atoms end up within the Pd crystal structure, forming Pd carbides. The intercalation of carbon within the Pd particles results in the expansion of the Pd crystal lattice and consequently in the shift of the cell parameters of Pd towards lower diffraction angles. This shift is larger at higher 2θ angles, which is why the shift is approximately 1° in Fig. 5A and approximately 2° in Fig. 5C. PdCx was also observed by XPS, as will be discussed below.
The third difference refers to the presence of some additional very weak peaks at 2θ ca. 25.2°, 29°, 30.1°, 30.3° and 34.3° (marked as 9) that come from NaHCO3. Other much weaker diffractions, not marked in figures, were also incipiently observed, but they could not be assigned to either NaCO3, Na formate or Na succinate. Regarding the spent catalyst in the acidic medium (Fig. SM-1†), the XRD study showed that, as in the neutralised solution case, the PdO reflection in the fresh catalyst disappeared due to the reducing environment provided by the reaction medium. Simultaneously, Pd carbide (PdCx) reflections become evident as a result of a carbidization process. In this case, the presence of Na bicarbonate peaks is not observed because no previous neutralisation with NaOH was conducted.
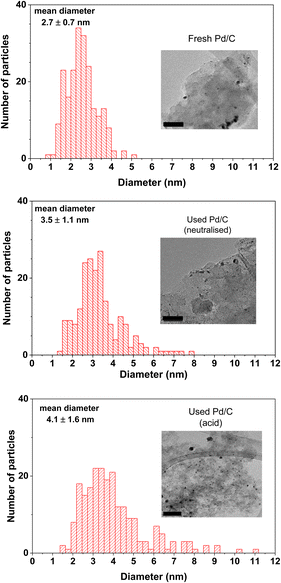
Concerning the catalyst aged under acidic conditions, the fresh catalyst underwent a slightly more intense sintering process than that of the neutralised case. This more intense sintering is obvious at the larger particle size region of the histogram. The average particle size value for the acidic aged catalyst was 4.1 nm. The dispersion calculated by the methodology of Borodziński et al.21 resulted in a value of 31.7%, lower than the value of the neutralised case (35.3%), also in agreement with a more intense sintering process. The previous dispersion value corresponds to an average particle size of 3.5 nm; this value is slightly larger than the value of the acid case (3.2 nm), again in line with a more intense sintering. The more intense sintering is very likely due to the higher temperatures used under acidic conditions. In any case, this sintering is also quite modest in comparison with the more severe decrease in the catalytic activity observed in period II of Fig. 4.
![[thin space (1/6-em)]](https://www.rsc.org/images/entities/char_2009.gif) 32,33 (their 3d3/2 components were located ca. 5.3 eV higher BE). A fourth contribution represented by the peak at 338.1 ± 0.1 eV (3d3/2 component at 343.3 ± 0.1 eV) was needed for a correct deconvolution, but this cannot be unambiguously assigned. The width of this last signal, between 3 and 4 eV, is much larger than that of the signals of Pd0, PdCx, and Pd2+, indicating that this contribution is, in fact, the result of more than one contribution. Pd4+ species (stabilised on PdO nanoparticles) and satellite peaks of the Pd2+ peak have been claimed to be present in these regions of the spectrum. Any attempt at deconvoluting the overall Pd 2p core level, including the satellites and the possible presence of Pd4+ species, resulted, in practice, in the merging of both contributions into only one peak. This indicates that the differentiation between the Pd2+ satellites and Pd4+ features is not straightforward. The statistics of this more complex 5-peak deconvolution did not substantially improve the fitting quality compared to the deconvolution represented in Fig. 7. Finally, a weak contribution is also visible at a very high BE (347.1 ± 0.2 eV) that has been assigned to the mixture of Pd2+ satellite and Pd0 plasmon contributions.34
32,33 (their 3d3/2 components were located ca. 5.3 eV higher BE). A fourth contribution represented by the peak at 338.1 ± 0.1 eV (3d3/2 component at 343.3 ± 0.1 eV) was needed for a correct deconvolution, but this cannot be unambiguously assigned. The width of this last signal, between 3 and 4 eV, is much larger than that of the signals of Pd0, PdCx, and Pd2+, indicating that this contribution is, in fact, the result of more than one contribution. Pd4+ species (stabilised on PdO nanoparticles) and satellite peaks of the Pd2+ peak have been claimed to be present in these regions of the spectrum. Any attempt at deconvoluting the overall Pd 2p core level, including the satellites and the possible presence of Pd4+ species, resulted, in practice, in the merging of both contributions into only one peak. This indicates that the differentiation between the Pd2+ satellites and Pd4+ features is not straightforward. The statistics of this more complex 5-peak deconvolution did not substantially improve the fitting quality compared to the deconvolution represented in Fig. 7. Finally, a weak contribution is also visible at a very high BE (347.1 ± 0.2 eV) that has been assigned to the mixture of Pd2+ satellite and Pd0 plasmon contributions.34
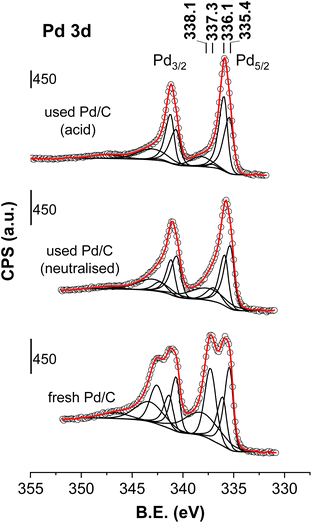 | ||
| Fig. 7 Pd 2p core level spectra of the fresh and spent catalysts (the neutralised case is that downloaded after the period VI of Fig. 1 and the acid case is that obtained with an accelerated ageing process similar to the ageing process of period II of Fig. 4). Circles are experimental data, black lines are the deconvoluted components and the red dotted line is the overall fit. | ||
The discussion is restricted to the peaks that have been unambiguously assigned: Pd0, PdCx and Pd2+ species. The presence of Pd4+ species are not ruled out but it would require a finer deconvolution protocol that is out of the scope of this work. Table 1 summarises the positions of the relevant Pd5/2 components and their percentage area. The XPS results of the fresh catalyst show the presence of similar amounts of Pd0 (38%), PdCx (25%) and Pd2+ species (38%). PdCx diffractions were not observed in the XRD patterns recorded for the fresh sample. However, the fact that XPS does detect the presence of PdCx species suggests that they are either restricted to the surface of the Pd particles or amorphous or small enough to display any diffraction. In the neutralised case, the Pd0 and PdCx species represent 86% of the Pd species (50 and 36%, respectively), whereas Pd2+ species only accounted for 15% of the total area, indicating that when the catalyst is subjected to the reaction conditions, a reduction and carbidization process occurs for the Pd2+ species: the Pd0 and PdCx concentrations significantly increase at the expense of the Pd2+ species. These results agree with the XRD results. The XPS chemical analysis raises the question of whether Pd0 and PdCx are covering a core of Pd oxide in a core–shell configuration or vice versa. This structure has implications for the involvement of Pd0, PdCx and/or Pd2+ in the mechanism of the reaction, but the XPS results cannot clarify this aspect.
| Catalyst | Pd 2p5/2 | BEa (eV) |
|---|---|---|
| a Percentage of area of the different contributions between brackets. | ||
| Fresh catalyst | Pd0 | 335.3 (38%) |
| PdCx | 336.1 (25%) | |
| Pd2+ | 337.3 (38%) | |
| Used catalyst (neutralised) | Pd0 | 335.3 (50%) |
| PdCx | 335.9 (36%) | |
| Pd2+ | 337.0 (15%) | |
| Used catalyst (neutralised) calcined in air at 200 °C | Pd0 | 335.4 (32%) |
| PdCx | 335.9 (19%) | |
| Pd2+ | 337.1 (48%) | |
| Used catalyst (neutralised) reduced in H2 at 200 °C | Pd0 | 335.3 (43%) |
| PdCx | 335.9 (57%) | |
| Pd2+ | — | |
| Used catalyst (acid) | Pd0 | 335.4 (45%) |
| PdCx | 336.0 (53%) | |
| Pd2+ | 337.1 (2%) | |
Fig. 8 compares the survey XPS spectrum of the catalyst used under the neutralised case with that of the fresh catalyst (from 0 to 1400 eV). The assignment of the peaks to the different core levels and Auger lines are indicated in the figure. The only extra peaks detected in the used catalyst compared to the fresh catalyst are the features located ca. 494 and 1070 eV, corresponding to the Na Auger line (KL23L23) and Na 1s core level, respectively. Na concentration (wt%) in the used catalysts as determined by ICP chemical analysis was 1.31 ± 0.01. The surface Na/Pd atomic ratio determined by integration of the respective Na 1s and Pd 2p levels was 0.33. Both results show that Na has been extensively deposited over the surface of the catalyst when the catalyst was used under neutralised conditions. Fig. SM-2† presents the Na 1s core level along with its deconvolution, which clearly shows the presence of two Na species at 1071.9 and 1073.9 ± 0.1 eV, suggesting the presence of at least two different types of Na species that must be related to two different Na environments. Unfortunately, we cannot assign these signals to different Na cations either if the Na is adsorbed over the surface sites of the carbon support or if this is related to carboxylate species (maleate, succinate, fumarate or malate) retained on the carbon surface. No XPS or Auger Si peaks were observed in the spectra of the fresh and used catalysts, indicating that quartz detected in the XRD studies is a minor component of the catalysts. Its high crystallinity vs. the more amorphous character of C and Pd phases makes the quartz XRD features apparently more intense than its real composition indicates, and we can conclude that quartz presence is not relevant for the surface properties of this Pd/C system.
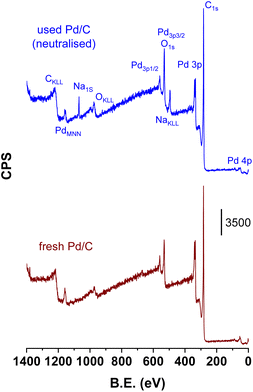 | ||
| Fig. 8 XPS survey spectrum of the fresh catalyst and the catalysts after being used with fully-neutralised acids (used catalyst corresponds to that downloaded after the period VI of Fig. 1). | ||
Going back to the Fig. 7 and regarding the acidic case, a simple look at the Pd 3d XPS results concludes that the intensity of the Pd2+ peak also decreases with respect to the intensity detected in the fresh catalyst, from 38% to 2%, indicating that the higher temperatures used for the acidic case results in a more intense reduction of the Pd2+ species. This decrease is parallel to the increase in Pd0 and PdCx signals, but the carbidization to form PdCx species is more intense in this acidic case, and the Pd carbide peak now represents more than half of the Pd species. Again, the XPS data are aligned with the XRD results that showed an increase in the PdCx presence.
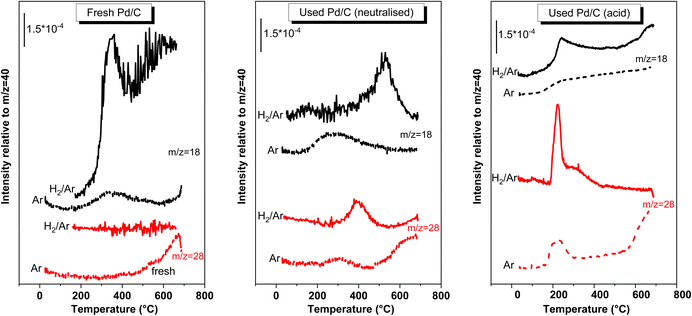 | ||
| Fig. 9 EGA-MS obtained from the fresh and used catalyst (neutralised and acid medium) while heating under 20% H2/Ar flow and under Ar flow. Only the fragments that were detected were represented. | ||
Regarding the fresh catalyst, the H2-EGA-MS of the fresh sample shows a signal for the ion m/z = 18, which peaked at 350 °C, and with an onset ca. 250 °C (the trace of the ion m/z = 17, not represented, was also observed simultaneously with 18, indicating that this trace corresponds to the evolution of water). No more relevant signals were detected for H2-EGA-MS. On the other hand, in the Ar-EGA-MS pattern a very weak H2O feature was only observed what indicates that the intense water signal observed in the H2-EGA-MS of fresh catalyst arose from the reduction of oxygen functionalities of the carbon surface. Actually, a m/z = 28 trace is observed for the Ar-EGA-MS at temperatures higher than 500 °C, that is interpreted as a CO evolution coming from the decarbonylation of the oxygen functionalities of carbon surface. These oxygen functions are being reduced in the H2-EGA-MS and explains the H2O released in the H2-EGA-MS.
The H2- or Ar-EGA-MS patterns of the used catalysts are totally different to those found in the fresh case, demonstrating that some molecules are deposited on the surface. The H2-EGA-MS of the spent catalyst used in the neutralised medium, only displays ions with m/z = 18, and 28, the rest of the signals from reactants, products or by-products were silent. The only C-containing fragment detected was m/z = 28. The possibility that this signal was due to the desorption of chemisorbed CO can be ruled out. If this was the case, a similar peak should have been observed in the Ar-EGA-MS and this is not the case: the only 28 peak was that observed at temperatures higher than 500 °C that was also seen in the fresh sample. These m/z = 28 signal in the H2-EGA-MS pattern must arise from decarbonylation of organic molecules left over the surface of the spent catalyst. It may also be possible that the m/z = 28 signal can also arise from the release of other organic molecules because 28 is a common low-intensity ion fragments of many organic molecules. If this were the case, then these signals represent a weak signal of a more intense phenomenon. In any case, the m/z = 28 peak is evidence of the presence of oxygenated organic deposits over the surface of the catalyst and not of CO desorption. The detection of the m/z = 18 peaking ca. 525 °C, with an onset ca. 400 °C, implies the release of water. This release of water cannot arise from the water bound to surface sites of the catalyst because the 18 trace for the H2-EGA-MS of the fresh sample is different. Besides, that observed in the Ar-EGA-MS of the same used catalyst is also different. This H2O evolution must have another origin: is the result of the hydrodeoxygenation of oxygenated functional groups of the organic molecules left over the surface, which proceeds with the release of water. Consequently, this water signal is also (an indirect) evidence of the presence of oxygenated organic molecules left over the surface of the used catalyst.
The deposition of organic molecules has been described for the direct hydrogenation of maleic anhydride to succinic anhydride with H2 gas, either in the gas phase35 or in the liquid phase (dissolved in an organic solvent).36,37 The chemical identity of these deposits requires more investigation, but a tentative possibility may be that MAc and SAc left over the catalyst surface can be hydrogenated to γ-butyrolactone, 1,4-butanediol and THF either during the reaction or while heating in the EGA-MS experiments (releasing water) and subsequently either hydrocracked to coke deposits. The possibility that MAc and SAc can polymerize with butanediol yielding polymers with quite high thermal stability, such as polybutylene succinate, has been proposed as the source of deposits.37 These polymers can be hydrodeoxygenated and/or hydrocracked during the H2-EGA-MS experiment. Regardless of the nature of the deposits, H2-EGA-MS experiment of the neutralised case show the presence of oxygenated organic molecules over the surface of the spent catalyst that have been deposited while on stream in the reactor and that are hardly gasified by H2 treatment. The presence of CO chemisorbed over the Pd particles can be ruled out (this conclusion must be bear in mind when discussing the modes of deactivation). When the EGA-MS was conducted using 20% O2–Ar gas mixtures (results not shown), these organic deposits were not removed at lower temperatures. At higher temperatures, the carbon support is also gasified, which prevents the use of O2-gasification treatments to remove the organic deposits.
Fig. 9 also includes the H2-EGA-MS experiment recorded for the catalyst used in the acid medium. Similar to the neutralised case, the presence of organic deposits on the surface of this used catalyst is also evidenced from the m/z = 18 and 28 traces. The nature of these deposits must be different from the nature of the deposits of the neutralised case, as deduced from the different shapes and temperature ranges of the peaks when compared the traces of both used catalysts. The peaks are, in this case, recorded at lower temperatures (ca. 225 °C for both CO and H2O peaks) than the peaks observed for the neutralised case (380 and 525 °C). The different reaction temperatures used for the acidic case may be the origin of this change. It must also be remarked that the Ar-EGA-MS displays a m/z = 28 peak, weaker although in the same range of temperatures than that in the H2-EGA-MS, what means that part of the 28 signal detected in the H2-EGA-MS may be due to the desorption of CO chemisorbed on Pd particles. The EGA-MS pattern also shows that, although peaking at lower temperatures, the complete removal of the deposits requires temperatures higher than 350 °C. A H2 treatment at these temperatures compromises the thermal stability of the Pd particle size, and removing these deposits by thermal treatments with H2 is not practical.
In summary, the characterisation data discussed above revealed five features of the catalyst used with the neutralised acids that were not present in the fresh catalyst: the presence of Na cations on the surface, the presence of organic deposits, the reduction-carbidization of Pd2+ species originally present in the fresh catalyst to PdCx species, the sintering of Pd particles, and finally Pd leaching. Similar effects are observed for the acid case, except for the presence of Na+ species. The sintering of Pd particles is ruled out as a relevant cause of deactivation because sintering is very limited and cannot be the major cause of extensive catalyst deactivation. In addition, previous investigation with another spent catalyst that showed no deactivation presented a similar degree of sintering.20 It is also worth mentioning that the deactivation is not specific of the CTH route: different noble and base metal catalysts suffers of deactivation in the reaction of hydrogenation of maleic acid with gas H2,35 either in the gas phase or liquid phase processes.36–38
The possibility that the used catalyst in acid medium can also be deactivated by CO poisoning cannot be fully ruled out. CO can be formed by the dehydration of formic acid yielding CO and H2O. This must be a minor route of formic acid transformation because the catalytic activity shows that FAc conversion is very similar to SAc yield, meaning that FAc is essentially used in the SAc formation and that the dehydration route, the one forming CO, is a very minor route. But, it is very well known that Pd is severely poisoned in the presence of ppm of CO.
The fact that Na+ is not present in the acid case although the catalyst is severely deactivated indicates that Na+ deposition seems not to be involved in the severe deactivation. These facts leave the deposition of organic compounds, metal leaching, and the extensive reduction-carbidization of Pd oxide as the most likely causes of deactivation, the CO poisoning cannot be ruled out for the acid case.
Attempts to regenerate the deactivated catalysts
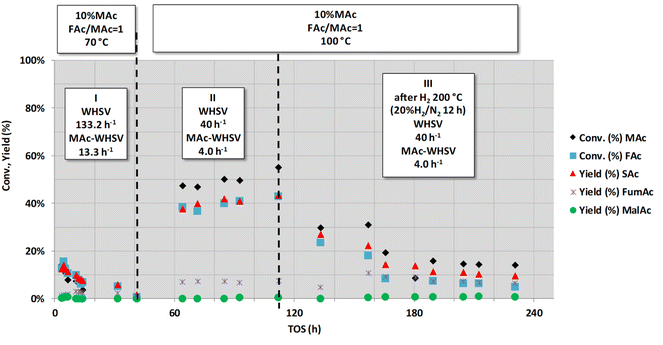
Next, we present the results obtained from our attempts to remove or reverse the deactivation of Pd/C catalysts. For this purpose, we have used different treatments, and their success or failure also provides information on the most likely causes of deactivation. First, the regeneration of catalysts aged under fully neutralised feedstock was studied. The results obtained with this treatment are represented in Fig. 10.In practice, the catalyst was first subjected to an intense deactivation step using the high flow rate conditions of period I of Fig. 10 (those previously used in period I of Fig. 3: 10 wt% MAc, FAc/MAc = 1, 1.0 MPa, 70 °C, WHSV = 133 h−1, and MAc-WHSV = 13.3 h−1). After the intense deactivation step, the temperature and the flow rate were set to the temperature and flow rate used for period II of Fig. 10 (again similar to the temperature and flow rate used in period II of Fig. 3: 10 wt% MAc, FAc/MAc = 1, 1.0 MPa, 100 °C and WHSV = 40 h−1 and MAc-WHSV = 4.0 h−1). Under these conditions, the catalyst displayed a substrate mid conversion. After several hours under the later conditions, the reactor was depressurized, and the catalyst was flushed with water at 100 °C (0.1 mL min−1) until a solution with neutral pH came out from the reactor. Then, the catalyst was dried overnight at 120 °C with a N2 flow (100 mL min−1), and subsequently, the catalyst was subjected to the reactivation treatments described below. Once the specific treatment was conducted, the reaction conditions were set back to previous operating conditions, and the results of the catalytic tests were compared to the results achieved before the reactivation treatment.
The same H2SO4, O2 and H2 treatments were also tried with the intention of reactivating the catalyst aged under acidic conditions (see Fig. SM-3 in the ESI section†). Similar to the neutralised case, none of the treatments resulted in successful catalyst regeneration.
The XRD patterns of the H2- and O2-treated spent catalyst are quite similar (see Fig. SM-4†): when compared with the used catalyst, the PdCx reflections clearly disappear and only very intense reflections from Pd0 can be observed, implying that the PdCx phase is substantially removed (gasified) when treated either with H2 or O2. Another worth-to-stress feature is that the O2-treated sample shows a peak at 2θ = 34° from the PdO phase, resulting from the oxidation of Pd and PdCx.
The XPS results of the Pd core level after the treatments are presented in Fig. 12. When discussing the spectra of Fig. 12, we will compare them with their counterpart, the spent neutralised case catalyst of Fig. 7 (XPS parameters are also collected in Table 1). Focusing on the catalysts treated with O2, the peak areas (in %) of the Pd0 (335.4 eV), PdCx (335.9 eV) and Pd2+ (337.1 eV) peaks were 32%, 19% and 48% whereas for the untreated spent sample they were 50%, 36% and 15%, respectively. Therefore, this O2 treatment results in the clear rise of the peak assigned to Pd2+ species at the expense of the Pd0 and PdCx species. The treatment with O2 partially gasifies carbidic C and oxidises Pd to Pd2+, in agreement with the conclusions deduced from XRD analysis. Regarding the spectrum of the used catalyst after the treatment with H2 at 200 °C, no Pd2+ contribution was required to fit the experimental data; the area % of PdCx and Pd0 peaks were 57% and 43%, respectively, meaning that hydrogenation mainly brings about an increase in the concentration of PdCx and Pd signals at the expense of Pd2+ species. The detection of PdCx by XPS in the H2-treated sample is apparently in contradiction with the XRD results, the latter showed that H2 treatment removed PdCx. Consequently, XPS can only be understood if also rearranges the presence of PdCx in the Pd particles, restricting its presence over the surface of the Pd particles as an amorphous phase.
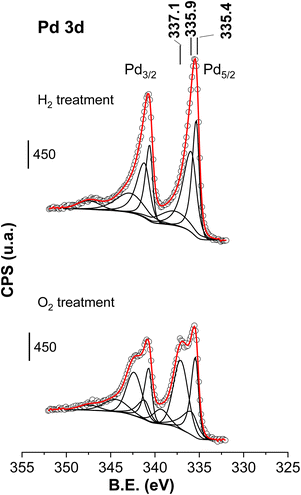 | ||
| Fig. 12 Pd 2p core level of the spent catalysts after being treated under H2 or O2 at 200 °C (used catalyst corresponds to the catalyst downloaded after the period VI of Fig. 1). Circles are experimental data, dotted lines are the deconvoluted components and the red dotted line is the overall fit. | ||
The fact that O2 and H2 treatments substantially modified the surface composition at the Pd surface without any parallel reactivation of the activity indicates that the deep deactivation of the catalyst is not related with any of the Pd phases (Pd, PdCx and PdO) but with other changes brought about during the working conditions.
The extensive rinsing with 0.1 M acid of the catalyst spent in neutralised medium (that must result in the dissolution of Na carbonates and in the removal of Na exchanged in the acid sites of the support) did not result in reactivation either, indicating that Na deposition is not related to the deactivation of the catalyst that leaves again the leaching of Pd species and the deposition of oxygenated species over the surface of the catalyst, as two causes of deactivation having a high impact. These two effects cannot be reversed, the leaching for obvious reason, and the deposition of organic molecules because their gasification with H2 or air requires very high temperatures that sinter the Pd particles; the treatment with air at high temperature would also gasify (burn off) the C support.
Conclusions
The Pd/C system is a very selective and robust catalyst for the aqueous phase catalytic transfer hydrogenation of maleic acid to succinic acid using formic acid as the H2 source. The catalyst is very stable, and deactivation could only be detected when the WHSV of MAc was larger than 13 gMAc gcat−1 h−1. A high WHSV of MAc can be achieved with high flow rates and/or concentrated MAc solutions.Na+ presence over the catalyst surface (neutral runs), sintering of Pd particles, reduction–carbidization of Pd2+ into Pd carbides (PdCx), Pd leaching, deposition of organic compounds and CO chemisorption (only for acid runs) were identified in the spent catalysts. The latter three effects are proposed as those with the highest impact on the deactivation. Consequently, future research must be directed at how to prevent or minimise the leaching of Pd, revealing the nature and location of the organic deposits and preventing the formation of deposits and the CO chemisorption.
Although the catalyst is deactivated, the deactivation can be compensated by increasing the temperature and/or the contact time (decreasing the flow rate) and still achieving very high SAc productivity. Thus, it was experimentally demonstrated that the productivity after 400 h on stream is above 5300 g of SAc per gcat for the neutralised run.
Author contributions
MLG, RM, PM-T and JI acquire the funding for the research. MLG and RM conceptualised the study and design the experiments. AO-S and MLG conducted the catalytic activity experiments, RM and AO-S took the TEM images and conducted the particle size analysis, PM-T recorded and conducted the deconvolution of the XPS spectra and JI conducted the chemical analysis. MLG, RM and JI supervised the work and all the authors contributed to the writing of the initial draft. All authors have approved the final version of the manuscript.Conflicts of interest
There are no conflicts to declare.Acknowledgements
This research was funded by the Spanish Ministry of Science, Innovation, and Universities (projects RTI2018-094918-B-C41, -C42 and -C44) and the Regional Government of Madrid (Project BIOTRES-CM S2018/EMT-4344). This project has also received funding from the Biobased Industries Joint Undertaking (JU) under the European Union's Horizon 2020 research and innovation programme under grant agreement no. 101023202. The JU receives support from the European Union's Horizon 2020 research and innovation programme and the Biobased Industries Consortium. AOS, due to the CSIC-UAM framework agreement, thanks to the PhD Program in Applied Chemistry of Doctoral School of Autonomous University of Madrid.Notes and references
- C. Delhomme, D. Weuster-Botz and F. E. Kühn, Green Chem., 2009, 11, 13–26 RSC.
- M. Verma, P. Mandyal, D. Singh and N. Gupta, ChemSusChem, 2020, 13, 4026–4034 CrossRef CAS PubMed.
- M. Gigli, M. Fabbri, N. Lotti, R. Gamberini, B. Rimini and A. Munari, Eur. Polym. J., 2016, 75, 431–460 CrossRef CAS.
- L. Aliotta, M. Seggiani, A. Lazzeri, V. Gigante and P. Cinelli, Polymers, 2022, 14, 844 CrossRef CAS PubMed.
- G. Q. Chen and M. K. Patel, Chem. Rev., 2012, 112, 2082–2099 CrossRef CAS PubMed.
- J. M. Pinazo, M. E. Domine, V. Parvulescu and F. Petru, Catal. Today, 2015, 239, 17–24 CrossRef CAS.
- L. T. Mika, E. Cséfalvay and Á. Németh, Chem. Rev., 2018, 118, 505–613 CrossRef CAS PubMed.
- H. Song and S. Y. Lee, Enzyme Microb. Technol., 2006, 39, 352–361 CrossRef CAS.
- A. Rey, D. H. Quiñones, P. M. Álvarez, F. J. Beltrán and P. K. Plucinski, Appl. Catal., B, 2012, 111–112, 246–253 CrossRef CAS.
- O. Rosales-Calderon and V. Arantes, Biotechnol. Biofuels, 2019, 12(240), 1–58 CAS.
- S. Bello, D. Ladakis, S. González-García, G. Feijoo, A. Koutinas and M. T. Moreira, Chem. Eng. J., 2022, 428, 132011–132024 CrossRef CAS.
- J. Iglesias, I. Martínez-Salazar, P. Maireles-Torres, D. Martin Alonso, R. Mariscal and M. López Granados, Chem. Soc. Rev., 2020, 49, 5704–5771 RSC.
- P. L. Arias, J. A. Cecilia, I. Gandarias, J. Iglesias, M. L. Granados, R. Mariscal and G. Morales, Catal. Sci. Technol., 2020, 10, 2721–2757 RSC.
- R. Mariscal, P. Maireles-Torres, M. Ojeda, I. Sádaba and M. López Granados, Energy Environ. Sci., 2016, 9, 1144–1189 RSC.
- S. H. Krishna, K. Huang, K. J. Barnett, J. He, C. T. Maravelias, J. A. Dumesic, G. W. Huber, M. De bruyn and B. M. Weckhuysen, AIChE J., 2018, 64, 1910–1922 CrossRef CAS.
- J. Albert and P. Wasserscheid, Green Chem., 2015, 17, 5164–5171 RSC.
- J. Albert, Faraday Discuss., 2017, 202, 99–109 RSC.
- J. Reichert, B. Brunner, A. Jess, P. Wasserscheid and J. Albert, Energy Environ. Sci., 2015, 8, 2985–2990 RSC.
- M. J. Gilkey and B. Xu, ACS Catal., 2016, 6, 1420–1436 CrossRef CAS.
- M. López Granados, J. Moreno, A. C. Alba-Rubio, J. Iglesias, D. Martín Alonso and R. Mariscal, Green Chem., 2020, 22, 1859–1872 RSC.
- A. Borodziński and M. Bonarowska, Langmuir, 1997, 13, 5613–5620 CrossRef.
- G. Bergeret and P. Gallezot, in Handbook of Heterogeneous Catalysis, ed. G. Ertl, H. Knözinger and J. Weitkamp, Wiley-VCH Verlag, 2008, pp. 439–467 Search PubMed.
- C. S. López-Garzón and A. J. J. Straathof, Biotechnol. Adv., 2014, 32, 873–904 CrossRef PubMed.
- Z. Q. Li, C. J. Lu, Z. P. Xia, Y. Zhou and Z. Luo, Carbon, 2007, 45, 1686–1695 CrossRef CAS.
- A. B. García, A. Martínez-Alonso, C. A. Leon Y Leon and J. M. D. Tascón, Fuel, 1998, 77, 613–624 CrossRef.
- M. Seredych and T. J. Bandosz, J. Phys. Chem. C, 2007, 111, 15596–15604 CrossRef CAS.
- M. Seredych, C. Petit, A. V. Tamashausky and T. J. Bandosz, Carbon, 2009, 47, 445–456 CrossRef CAS.
- W. Jones, P. P. Wells, E. K. Gibson, A. Chutia, I. P. Silverwood, C. R. A. Catlow and M. Bowker, ChemCatChem, 2019, 11, 4334–4339 CrossRef CAS.
- M. Maciejewski and A. Baiker, J. Phys. Chem., 1994, 98, 285–290 CrossRef CAS.
- Y. F. Han, D. Kumar, C. Sivadinarayana, A. Clearfield and D. W. Goodman, Catal. Lett., 2004, 94, 131–134 CrossRef CAS.
- R. Guo, Q. Chen, X. Li, Y. Liu, C. Wang, W. Bi, C. Zhao, Y. Guo and M. Jin, J. Mater. Chem. A, 2019, 7, 4714–4720 RSC.
- L. S. Kibis, A. I. Titkov, A. I. Stadnichenko, S. V. Koscheev and A. I. Boronin, Appl. Surf. Sci., 2009, 255, 9248–9254 CrossRef CAS.
- E. Vorobyeva, Z. Chen, S. Mitchell, R. K. Leary, P. Midgley, J. M. Thomas, R. Hauert, E. Fako, N. López and J. Pérez-Ramírez, J. Mater. Chem. A, 2017, 5, 16393–16403 RSC.
- L. S. Kibis, A. I. Stadnichenko, S. V. Koscheev, V. I. Zaikovskii and A. I. Boronin, J. Phys. Chem. C, 2012, 116, 19342–19348 CrossRef CAS.
- C. I. Meyer, A. J. Marchi, A. Monzon and T. F. Garetto, Appl. Catal., A, 2009, 367, 122–129 CrossRef CAS.
- Y. Yu, Y. Guo, W. Zhan, Y. Guo, Y. Wang, Y. Wang, Z. Zhang and G. Lu, J. Mol. Catal. A: Chem., 2011, 337, 77–81 CrossRef CAS.
- A. Küksal, E. Klemm and G. Emig, Stud. Surf. Sci. Catal., 2000, 130, 2111–2116 CrossRef.
- M. A. Tallon, in Handbook of Maleic Anhydride Based Materials. Syntheses, Properties and Applications, ed. O. M. Musa, Springer International Publishing Switzerland, 2016, pp. 59–149 Search PubMed.
Footnote |
| † Electronic supplementary information (ESI) available. See DOI: https://doi.org/10.1039/d2se01073a |
| This journal is © The Royal Society of Chemistry 2022 |


