
 Open Access Article
 This Open Access Article is licensed under a Creative Commons Attribution-Non Commercial 3.0 Unported Licence
Evaluation of the potential use of e-fuels in the European aviation sector: a comprehensive economic and environmental assessment including externalities†
Diego
Freire Ordóñez
 ab,
Thorsteinn
Halfdanarson
c,
Caroline
Ganzer
ac,
Nilay
Shah
a,
Niall Mac
Dowell
ac and
Gonzalo
Guillén-Gosálbez
*d
ab,
Thorsteinn
Halfdanarson
c,
Caroline
Ganzer
ac,
Nilay
Shah
a,
Niall Mac
Dowell
ac and
Gonzalo
Guillén-Gosálbez
*d
aThe Sargent Centre for Process Systems Engineering, Imperial College London, UK
bInstitute for Applied Sustainability Research, Quito, Ecuador
cCentre for Environmental Policy, Imperial College London, UK
dInstitute for Chemical and Bioengineering, ETH Zürich, Switzerland. E-mail: gonzalo.guillen.gosalbez@chem.ethz.ch
First published on 29th August 2022
Abstract
The decarbonisation of the transportation sector is key to meeting the climate goals. Whilst the electrification of road passenger transportation is proving to be a viable low-carbon solution in many contexts, a viable pathway towards a decarbonised aviation sector remains opaque. In this context, so-called e-fuels produced via the combination of H2O, CO2 and renewable energy may have promise owing to their compatibility with existing infrastructure. Most studies on e-fuels focus only on the economic dimension, neglecting their environmental performance and associated costs. Here, we present a techno-economic evaluation and cradle-to-grave life cycle assessment of Fischer–Tropsch (FT) e-jet fuels produced at different locations in Europe from a range of CO2 and green H2 sources to comprehensively assess their potential in aviation, explicitly accounting for externalities. Our results show that e-jet fuel is at present much more expensive (at least 5.4-fold) than its fossil analogue, even when externalities are included (i.e., at least 2.3 fold the current cost of fossil jet fuel). Furthermore, e-jet fuels could exacerbate the damage to human health and ecosystems despite showing lower carbon footprint and resource scarcity impacts than their fossil counterparts. Overall, e-jet fuel could become more economically and environmentally attractive by reducing the cost and impact of CO2 and green H2 and, more specifically, the electricity used in their production processes. In this regard, the production plant's location emerges as a critical factor due to the costs associated with balancing the intermittency of site-specific renewables.
1. Introduction
Currently, energy consumption increases ca. 1% to 2% per year on average,1 with transport accounting for around 25% of the world's energy demand and 60% of total oil consumption annually.2 Thus, the transport sector is responsible for about 20% of the world's carbon emissions.3 Hence, any credible effort to mitigate climate change must also account for emissions from transport. Consequently, a range of different options have been explored, e.g., electrification, H2, biofuels and synthetic fuels, where the latter two have received particular attention because they could be blended with conventional fuels without changing existing infrastructure. e-Fuels are liquid or gaseous fuels produced from electrolytic H2via renewable electricity and captured carbon or nitrogen.4 Because both the power and the feedstocks come from renewable sources,5 the so-called renewable electrofuels have the potential to be carbon neutral in terms of greenhouse gas emissions.6 However, their energy-intensive nature, high production costs and the need for green H2 and concentrated CO2 streams constitute the main barriers to widespread deployment.7–10According to Hänggi et al.,11 when it comes to passenger automobiles, electric batteries are deemed more sustainable and cleaner than fossil fuels. However, long-distance transportation by land and sea and commercial air travel would require unique batteries unable to currently match present requirements, such as a high gravimetric energy density, a lightweight, a high degree of autonomy, or a short refuelling time.12,13 As a result, electrofuels may find use in transport applications where batteries are not suitable.6,14
According to Åkerman et al.,7 there are three potential aviation fuel substitutes for conventional fossil fuels: drop-in biofuels, H2, and drop-in electrofuels. The supply of sustainable biomass is inherently limited and owing to the increasingly pressing need to remove CO2 from the atmosphere, biomass resources will likely be employed in this context. Whilst H2 could be produced at a lower cost than electrofuels, it is not a drop-in option for the existing fleet, which may be expected to remain in service for some time. Therefore, this study focuses on electrofuels with the potential to be used as aviation fuels.
Recent literature studied the potential benefits and feasibility of electrofuels in the aviation sector, as shown in Table 1. Most of these studies focus only on the techno-economic dimension. Only a few assess their environmental performance, but often in terms only of global warming (GW) impacts. However, as discussed elsewhere,8–10 a full assessment of the potential of electrofuels to contribute to a net-zero emission society should consider both their techno-economic viability and environmental performance at an equivalent level of granularity. Moreover, drawing a comprehensive picture of environmental performance requires accounting for impacts beyond climate change. The latter can be achieved via a comprehensive life-cycle assessment (LCA). Specifically, electrofuels are currently more expensive but could be less polluting, depending on the carbon intensity of the energy used in their production, than their fossil analogues.22 However, they may impose significant indirect impacts on human health and the environment. Consequently, a fair comparison requires accounting for other impacts beyond climate change, which could be done by computing the monetised value of the life cycle environmental impacts.
| Source | Main focus | Economic assessment | Environmental assessment | Economic valuation of environmental impacts (externalities) | Uncertainty analysis | |||||
|---|---|---|---|---|---|---|---|---|---|---|
| Yes | No | Yes | No | Yes | No | Yes | No | |||
| Only GW indicators | GW + other indicators | |||||||||
| Åkerman et al.7 | Analysis of different scenarios and alternatives towards a more sustainable long-distance travel in Sweden in line with the Paris agreement | ✗ | ✗ | ✗ | ✗ | |||||
| Alhyari et al.15 | Assessment of the environmental impact of power-to-liquid (PtL) processes by applying LCA | ✗ | ✗ | ✗ | ||||||
| Goldmann et al.6 | Technical evaluation of n-octane, methanol, methane, H2 and ammonia as possible substitutes for conventional aviation fuels | ✗ | ✗ | ✗ | ✗ | |||||
| Kieckhäfer et al.16 | Application of a system dynamics approach to assessing the possibility for alternative jet fuel uptake in aviation and the extent to which alternative fuels can help meet CO2 reduction targets | ✗ | ✗ | ✗ | ✗ | |||||
| Schemme et al.17 | Techno-economic analysis of power-to-fuel (PtF) processes based on the same harmonised premises and boundary conditions | ✗ | ✗ | ✗ | ✗ | |||||
| Schmidt et al.18 | Review of the environmental and techno-economic performance of state-of-art PtL production processes for aviation | ✗ | ✗ | ✗ | ✗ | |||||
| Schmidt et al.19 | Review of technical, economic, and environmental aspects and potential of PtL processes for renewable jet fuel production | ✗ | ✗ | ✗ | ✗ | |||||
| Sherwin et al.20 | Economic viability analysis of electrofuels synthesised from CO2 captured using direct air capture (DAC), and H2 produced via water electrolysis, predominantly powered by solar or wind energy | ✗ | ✗ | ✗ | ✗ | |||||
| Trinh et al.21 | Development of an optimisation-based model to assess the impact of Sweden's carbon pricing, blending mandates, and penalty charge on renewable jet fuel production | ✗ | ✗ | ✗ | ✗ | |||||
Here, we present a comprehensive techno-economic and environmental study of Fischer–Tropsch (FT)-electrofuels with the potential to replace fossil jet fuel, covering a wide range of LCA metrics, externalities and several locations.
We focus on e-jet fuel obtained from CO2 captured from different sources and green H2 from solar, wind, and hybrid solar and wind-powered water-electrolysis systems. Our study considers various locations in Europe, each with different availability of solar and wind resources, which affects the cost of electricity and H2 storage, and thus the final cost of H2 and e-jet fuel.23,24 The plant integrates solar PV and wind systems, a proton exchange membrane electrolyser (PEMEL) and its corresponding balance of plant (BOP), alongside batteries and H2 storage tanks (or salt caverns). It also includes a reverse water-gas shift (rWGS) reactor, an FT reactor, a hydrocracking (HC) reactor, a burner, and a train of flash separators. The LCA undertaken here is based on the ISO 14040 series (2006) and the ReCiPe 2016 damage model, covering 22 midpoint and three endpoint indicators that are monetised according to specific economic penalties.25
We find that, at present, e-jet fuel is more expensive than fossil jet fuel by a factor of 5.4–15.1, even when externalities are accounted for. For e-jet fuels to be cost-competitive with conventional jet fuel, a carbon tax of 1125 USD/tCO2-eq would need to be imposed, which is deemed unrealistic. Moreover, e-jet fuel leads to burden-shifting as it worsens human health and ecosystem quality compared to fossil jet fuel. Overall, our work highlights the need to account for impacts beyond climate change in assessing electrofuels to minimise the potential collateral damage of low carbon transition pathways.
The paper is organised as follows: the methodology encompassing the model description, the LCA and techno-economic assessment, including the monetisation of endpoint impacts and the risk analysis, is outlined first. Following that, the results are presented, comparing e-jet fuel with conventional jet fuel. Finally, we summarise the primary findings and provide recommendations for further research.
2. Methodology
We consider five plant locations, namely the United Kingdom (GB), Germany (DE), France (FR), Spain (ES) and Italy (IT), given their high jet fuel demand in the European region (see Fig. 1).26 A summary of the scenarios assessed for each country, highlighting the H2 and CO2 sources and H2 storage media, is shown in Table 2.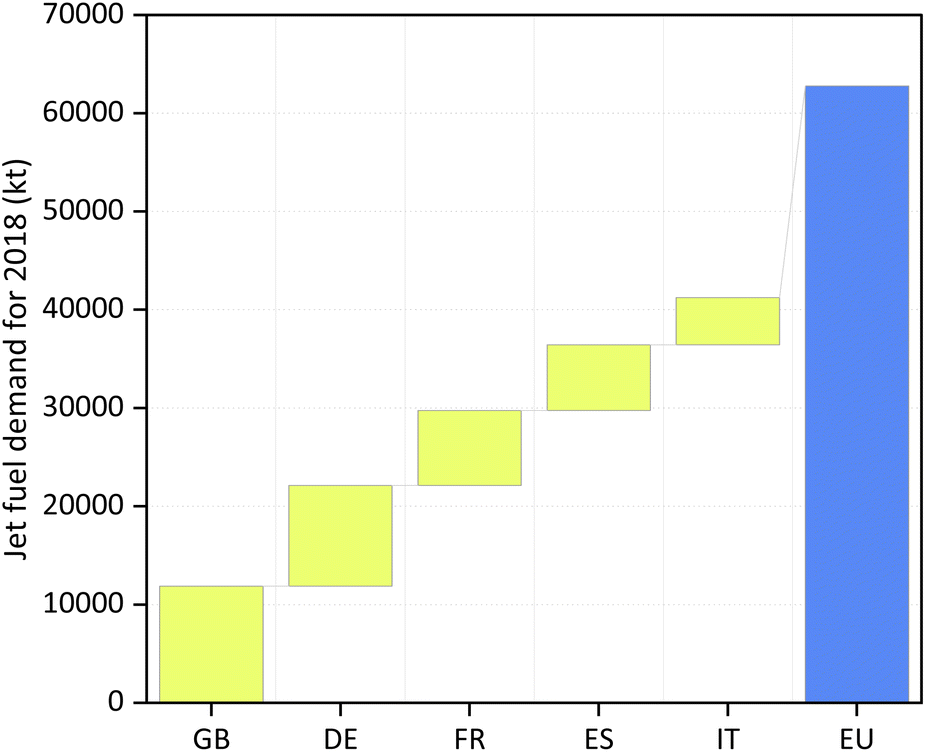 | ||
Fig. 1 European demand for jet fuel in 2018. The European Union's (EU) jet fuel demand for 2018 was 62![[thin space (1/6-em)]](https://www.rsc.org/images/entities/char_2009.gif) 800 kt. The sum of the demands of the United Kingdom (GB), Germany (DE), France (FR), Spain (ES) and Italy (IT), for the same year, was equivalent to approximately 65% of the EU's total demand.26 800 kt. The sum of the demands of the United Kingdom (GB), Germany (DE), France (FR), Spain (ES) and Italy (IT), for the same year, was equivalent to approximately 65% of the EU's total demand.26 | ||
| Scenario | H2 source | H2 storage media | CO2 source |
|---|---|---|---|
| 1 | Hybrid solar and wind-based electrolysis | Type I tanks | Coal-based power plant (C-PP) |
| 2 | Hybrid solar and wind-based electrolysis | Salt caverns | Coal-based power plant (C-PP) |
| 3 | Hybrid solar and wind-based electrolysis | Type I tanks | Natural gas-based power plant (NG-PP) |
| 4 | Hybrid solar and wind-based electrolysis | Salt caverns | Natural gas-based power plant (NG-PP) |
| 5 | Hybrid solar and wind-based electrolysis | Type I tanks | Direct air capture based on a high temperature, liquid solvent system (DAC-HT) |
| 6 | Hybrid solar and wind-based electrolysis | Salt caverns | Direct air capture based on a high temperature, liquid solvent system (DAC-HT) |
| 7 | Hybrid solar and wind-based electrolysis | Type I tanks | Direct air capture based on a low temperature, solid sorbent system (DAC-LT) |
| 8 | Hybrid solar and wind-based electrolysis | Salt caverns | Direct air capture based on a low temperature, solid sorbent system (DAC-LT) |
2.1. Model description
The production process, which corresponds to the foreground system exchanging mass and energy with the techno- and eco-spheres, was simulated in Aspen Plus v11 (ref. 27) based on the literature.28 The model includes the pure components H2, CO2, H2O, CO, and all the n-alkanes from C1 to C30, which were selected from the APV110.PURE37 databank. Due to its suitability for hydrocarbons,29 the Peng–Robinson equation of state with Boston–Mathias alpha function (PR-BM) was chosen to estimate thermodynamic properties.Fig. 2 provides the process flowsheet. CO2 and H2 react in an rWGS reactor to produce syngas, which is sent to a low-temperature FT reactor. The FT gases are then separated and upgraded via a flash separation train, whereas FT waxes undergo HC in a hydrocracker. The resulting products enter a final flash separator that purifies the e-jet fuel. In the next sections, we describe each step of the production process in detail.
 | ||
| Fig. 2 Flowsheet of the production process of e-jet fuel. Syncrude is produced in a low-temperature FT reactor from the syngas obtained from CO2 and H2. e-Jet fuel is then obtained from the separation of syncrude, according to the operating conditions depicted in the figure. A hydrocracker is implemented to process FT waxes and increase the fuel yield. The colour coding for the streams after the FT reactor is as follows: gaseous streams (red), liquid streams (orange), and wastewater (blue). | ||
Green H2. Green H2 is produced from water electrolysis using renewable electricity, according to eqn (1).
| H2O ⇄ H2 + 1/2O2, ΔH = +285.8 kJ mol−1 | (1) |
Other works assumed a fixed location to compute the H2 cost. In contrast, here, we applied an existing modelling framework, i.e., the gAWE model,24 to estimate the electrolytic H2 cost in various locations, thus explicitly considering the location-specific availability of renewable energy. The original model, which focused on green H2 from solar power, was extended to account for wind as an alternative energy source. The H2 production plant encompasses solar PV and wind facilities and the PEMEL system. The latter includes its BOP, and electricity and H2 storage systems, i.e., batteries and Type I tanks (or salt caverns), respectively. We consider the PEMEL technology given its high TRL and market availability.30 The fluctuating nature of renewables is taken into account by estimating the cost of storing electricity and H2 to guarantee a continuous supply of H2 to the fuel production plant, which substantially contributes to the NPC.23,24
The model, which is formulated as a mixed-integer linear programming (MILP) model, evaluates the cost-based optimal H2 production configuration considering raw materials and energy consumption, equipment sizing, heat integration requirements, and electricity and H2 storage capacities for a given hourly-based production target. We consider the production of 1 GWLHV of H2 (ref. 31–33) as input for the chemical plant plus an additional amount for the hydrocracker (see Fig. 2). We evaluated the production of green H2 in the five European countries for six different configurations; namely, (i) solar-powered PEMEL with Type I tanks for H2 storage, (ii) solar-powered PEMEL with salt caverns for H2 storage, (iii) wind-powered PEMEL with Type I tanks for H2 storage, (iv) wind-powered PEMEL with salt caverns for H2 storage (iii) hybrid solar and wind-powered PEMEL with Type I tanks for H2 storage, and (v) hybrid solar and wind-powered PEMEL with salt caverns for H2 storage. The MILP model was solved using GAMS 32.1.0 and the solver CPLEX 12.10.0.0. The hourly-based solar PV and wind capacity factors (CF) were taken from renewables.ninja34,35 for 2018. The model input data can be seen in Appendix C, Table C-2,† while additional details can be found in ref. 24.
Captured CO2. The concentrated CO2 required for electrofuels production36 entails a different environmental impact and can be obtained at various prices depending on the source. Thus, we evaluated three potential sources of CO2, namely CO2 captured from coal power plants (C-PP), natural gas power plants (NG-PP) and CO2 recovered directly from the atmosphere – direct air capture (DAC). The DAC technology is characterised by either a high temperature, liquid solvent system (DAC-HT) or a low temperature, solid sorbent system (DAC-LT). For CO2 from power plants, a system expansion strategy is employed to deal with the multi-functionality of electricity production. Data for the capture processes were taken from existing literature (Appendix B, Table B-4†).
| CO2 + H2 ⇄ CO + H2O, ΔH = 41.2 kJ mol−1 | (2) |
In our case, we assume that syngas is obtained from CO2 and H2 at 900 °C using a nickel-based catalyst.38,39 This catalyst was selected due to its high activity and low cost compared to noble metal-active phase catalysts.40
| nCO + (2n + 1)H2 → CnH2n+2 + nH2O, n = 1, 2,…,∞ | (3) |
We assumed here that the product distribution of the FT reactions follows the Anderson–Schulz–Flory (ASF) distribution:41
| wn = n(1 − α)2αn−1 | (4) |
Iron and cobalt are the preferred catalysts for FT industrial applications.42 For this study, we consider a low-temperature FT process (180–250 °C)43 using a cobalt catalyst44,45 (α = 0.90–0.95).46 This is because, for low-temperature FT processes implementing cobalt-based catalysts, only unbranched alkanes (CnH2n+2) are often obtained as products.17 As far as methane is concerned, it is well known that its selectivity is higher than predicted by the ASF distribution.41 To take this into account, we followed the approach by König et al.,39,47 which considers a correction factor for methane (methane yield correction, wCH4, of 0.04 for α = 0.95) based on an experimentally obtained FT product distribution.48 Additional FT design parameters can be found in Appendix A, Fig. A-1.†
Hydrocracking of FT waxes, i.e., long paraffinic chains (![[double bond splayed left]](https://www.rsc.org/images/entities/char_e009.gif) C21),51 provides high-end middle distillates with low sulphur and aromatics content.52 Regarding the catalysts, NiMo and NiW supported on solid acids are particularly well suited for producing middle distillates.52 However, Pd and Pt-loaded catalysts, which have high hydrogenation/dehydrogenation activity for heavy hydrocarbon cracking, could also be used owing to the sulphur-free nature of FT waxes.51,53,54 Thus, we considered a platinum-based catalyst supported on amorphous silica-alumina in this work.53,55 The HC product distribution is based on Calemma et al.54 (see Appendix A, Fig. A-1†).
C21),51 provides high-end middle distillates with low sulphur and aromatics content.52 Regarding the catalysts, NiMo and NiW supported on solid acids are particularly well suited for producing middle distillates.52 However, Pd and Pt-loaded catalysts, which have high hydrogenation/dehydrogenation activity for heavy hydrocarbon cracking, could also be used owing to the sulphur-free nature of FT waxes.51,53,54 Thus, we considered a platinum-based catalyst supported on amorphous silica-alumina in this work.53,55 The HC product distribution is based on Calemma et al.54 (see Appendix A, Fig. A-1†).
2.2. Life-cycle assessment (LCA)
Here, we applied LCA according to the guidelines given by Brujin et al.58 to quantify environmental impacts. These are linked to life cycle activities connected to the production and utilisation of fossil jet fuel and e-jet fuel, including, in the latter case, green H2 production. The LCA models were implemented in SimaPro v9.0 (ref. 59) interfacing with Ecoinvent 3.5. The modelling approach and assumptions are explained below.• HH (DALY): global warming (HH), stratospheric ozone depletion, ionising radiation, ozone formation (HH), fine particulate matter formation, human carcinogenic toxicity, human non-carcinogenic toxicity, and water consumption (HH).
• EQ (species yr): global warming (terrestrial ecosystems), global warming (freshwater ecosystems), ozone formation (terrestrial ecosystems), terrestrial acidification, freshwater eutrophication, marine eutrophication, terrestrial ecotoxicity, freshwater ecotoxicity, marine ecotoxicity, land use, water consumption (terrestrial ecosystems), and water consumption (aquatic ecosystems).
• RS (USD2013): mineral resource scarcity and fossil resource scarcity.
2.3. Economic analysis
Green H2. The NPC of green H2 was calculated from the capital expenditures (CAPEX) of the solar PV, wind and PEMEL systems and storage options, based on the design capacities obtained from the gAWE model. The OPEX was considered negligible since raw materials (H2O, sunlight and wind) are freely available, utilities (electricity) are modelled explicitly and fixed OPEX expenditures, such as labour cost, are low as well, relative to other costs.24 The CAPEX corresponds to the fixed capital investment (FCI) of the H2 production plant. The working capital (WC) was assumed to be 10% of the total capital investment (TCI).29 The TCI, i.e., the sum of the FCI and WC, was then annualised according to the equation below:
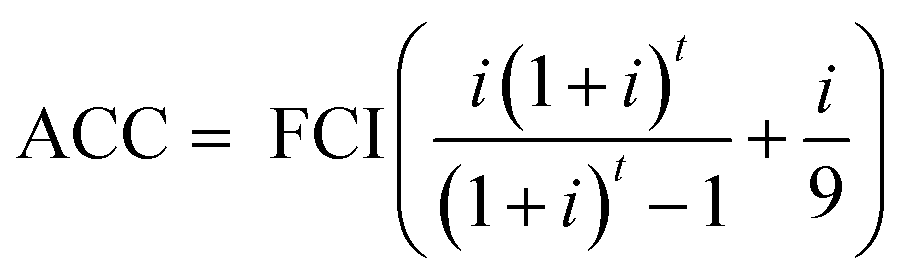 | (5) |
Finally, the NPC of green H2 was calculated by dividing the ACC by the annual production (AP), as shown below:
 | (6) |
The NPC of H2 is expressed in USD per kg.
The cost input data required by the model can be seen in Appendix C, Table C-2.†
e-Jet fuels. The NPC of the e-jets was obtained from the CAPEX and OPEX associated with the fuel production plant. These costs were calculated using the mass and energy flows obtained from the model simulation in Aspen Plus. The purchased cost (PC) of the conventional equipment units, i.e., heat exchangers, compressors, separators, and pumps, was calculated using the correlations given by Sinnot and Towler.68 On the other hand, the PC of special equipment units, i.e., the rWGS reactor, FT reactor, hydrocracker and burner, was obtained from eqn (7) using the parameters listed in Appendix C, Table C-3.† All costs, including raw materials, utilities, products, and equipment, were updated to 2018 using price indices, as shown below. The chemical engineering plant cost index (CEPCI)69 was applied to all equipment units. In contrast, the World Bank Commodity Price Data (The Pink Sheet)70 was employed in raw materials and utilities.
 | (7) |
The FCI of the fuel production plant and its total operating cost (TOC) were estimated following the guidelines given by Albrecht et al.29 based on the data presented in Appendix C, Tables C-3 and C-4.† The FCI includes the purchased equipment, installation, and further capital requirements in the construction phase. The TOC encompasses raw materials and utilities, costs/revenues from by-products, labour costs, maintenance costs, and other indirect costs.29 The ACC was obtained from eqn (5), with the data in Appendix C, Table C-1.† Lastly, the total annualised cost (TAC) and the NPC of e-jet fuel were calculated as follows:
| TAC = TOC + ACC | (8) |
 | (9) |
The NPC of e-jet fuel expressed in USD per Lfossil jet fuel-equivalent was converted to USD per t per km, i.e., fuel cost per load (in tonnes) and distance flown (in kilometres). We considered a conversion factor of 0.325 L per t per km for 2018.72–74
 | (10) |
• HH. A value of 7.4 × 10⁴ EUR2003 per 1 DALY is assumed to be the willingness-to-pay value for a life year with a minor risk increase from involuntary exposure.
• EQ. A value of 9.5 × 10⁶ EUR2003 per 1 lost species.year is derived based on the share of our well-being that we are ready to give up to protect ecosystems.
• RS. A value of 8.62 × 10⁻¹ EUR2003 per 1 USD2000 is obtained by converting USD2000 to EUR2003 considering inflation and the International Monetary Fund mid-year SDR exchange rate for 2003.
000 independent simulations were conducted for the cheapest alternative of each scenario in Table 2, varying the H2, CO2 and grid electricity costs. For each simulation, a normal distribution with a standard deviation of 20% with respect to the current costs was assumed, as suggested elsewhere.68
3. Results and discussion
In this section, the results of the process models are discussed first, to then focus on the environmental and economic results.3.1. Process models
A summary of the design capacities of the equipment in the H2 production plant is given in Table 3, whereas the mass and energy flows are shown in Table 4.| Equipment | GB | DE | FR | ES | IT | |||||||||||
|---|---|---|---|---|---|---|---|---|---|---|---|---|---|---|---|---|
| Solar H2 | Wind H2 | Hybrid H2 | Solar H2 | Wind H2 | Hybrid H2 | Solar H2 | Wind H2 | Hybrid H2 | Solar H2 | Wind H2 | Hybrid H2 | Solar H2 | Wind H2 | Hybrid H2 | ||
| PV system (GW) | 23.5 | — | 3.3 | 20.7 | — | 6.0 | 20.2 | — | 4.8 | 15.1 | — | 3.1 | 15.7 | — | 6.5 | |
| Wind system (GW) | — | 5.3 | 3.2 | — | 21.6 | 7.4 | — | 9.8 | 4.2 | — | 10.2 | 6.1 | — | 9.2 | 2.7 | |
| PEMEL (tH2 h−1) | 159.2 | 56.9 | 49.1 | 173.0 | 76.1 | 69.4 | 161.5 | 59.7 | 58.5 | 148.7 | 68.0 | 52.2 | 147.4 | 84.4 | 69.5 | |
| H2 storage tanks or caverns (t) | 54077 |
5342 | 3227 | 17823 |
8086 | 6653 | 33870 |
4670 | 3592 | 4507 | 5675 | 5978 | 6236 | 10048 |
5196 | |
| Electricity storage (GWh) | — | — | — | — | — | — | — | — | — | — | — | — | — | — | — | |
| Mass flows | ||
|---|---|---|
| Streams | Value | Unit |
| Inputs | ||
| CO2 | 235.6 | t h−1 |
| H2 | 30.4 | t h−1 |
| H2O | 72.8 | t h−1 |
| Air | 121.1 | t h−1 |
|
||
| Outputs | ||
| e-Jet fuel | 62.91 | t h−1 |
| Flue gas | 153.102 | t h−1 |
| Wastewater | 243.93 | t h−1 |
|
||
| Energy flows | ||
| Streams | Value | Unit |
|
||
| Inputs | ||
| Electricity | 122.2 | MW |
| Cooling water | 246.1 | MW |
|
||
| Outputs | ||
| e-Jet fuel | 764.2 | MW |
Focusing first on green H2, we find that in most of the locations, i.e., GB, FR, ES and IT, the design capacity of PV exceeds that of wind systems. This is because, in these locations, the annual CF for wind is higher than the one for solar PV systems.
Regarding PEMELs, the lowest design capacity corresponds to wind-solar hybrid systems due to the combined use of solar and wind resources. The model chooses H2 tanks as storage option for all locations due to the current prohibitively high cost of Li-ion batteries, ca., 420 USD/kWh.78 The required capacity of the storage tanks is adjusted by the model depending on the size of the solar PV, wind, and electrolysis systems.
Some of the most important properties of fossil jet fuel, and the corresponding properties estimated from the simulation for e-jet fuel, are shown in Appendix A, Table A-1.†
The energy analysis of the production process shows that the heating demand, i.e., 363.5 MW, can be entirely fulfilled by heat integration. Likewise, the cooling demand can be reduced by 60% compared with the non-integrated process (i.e., from 609.7 MW to 246.1 MW). The electricity required for the fuel production plant, i.e., 122.2 MW, is assumed to be taken directly from the grid to avoid expensive electric batteries. As grid electricity comes from different renewable and non-renewable sources, there are different amounts of carbon embedded in this electricity, depending on the location of the plant.
3.2. Life-cycle assessment (LCA)
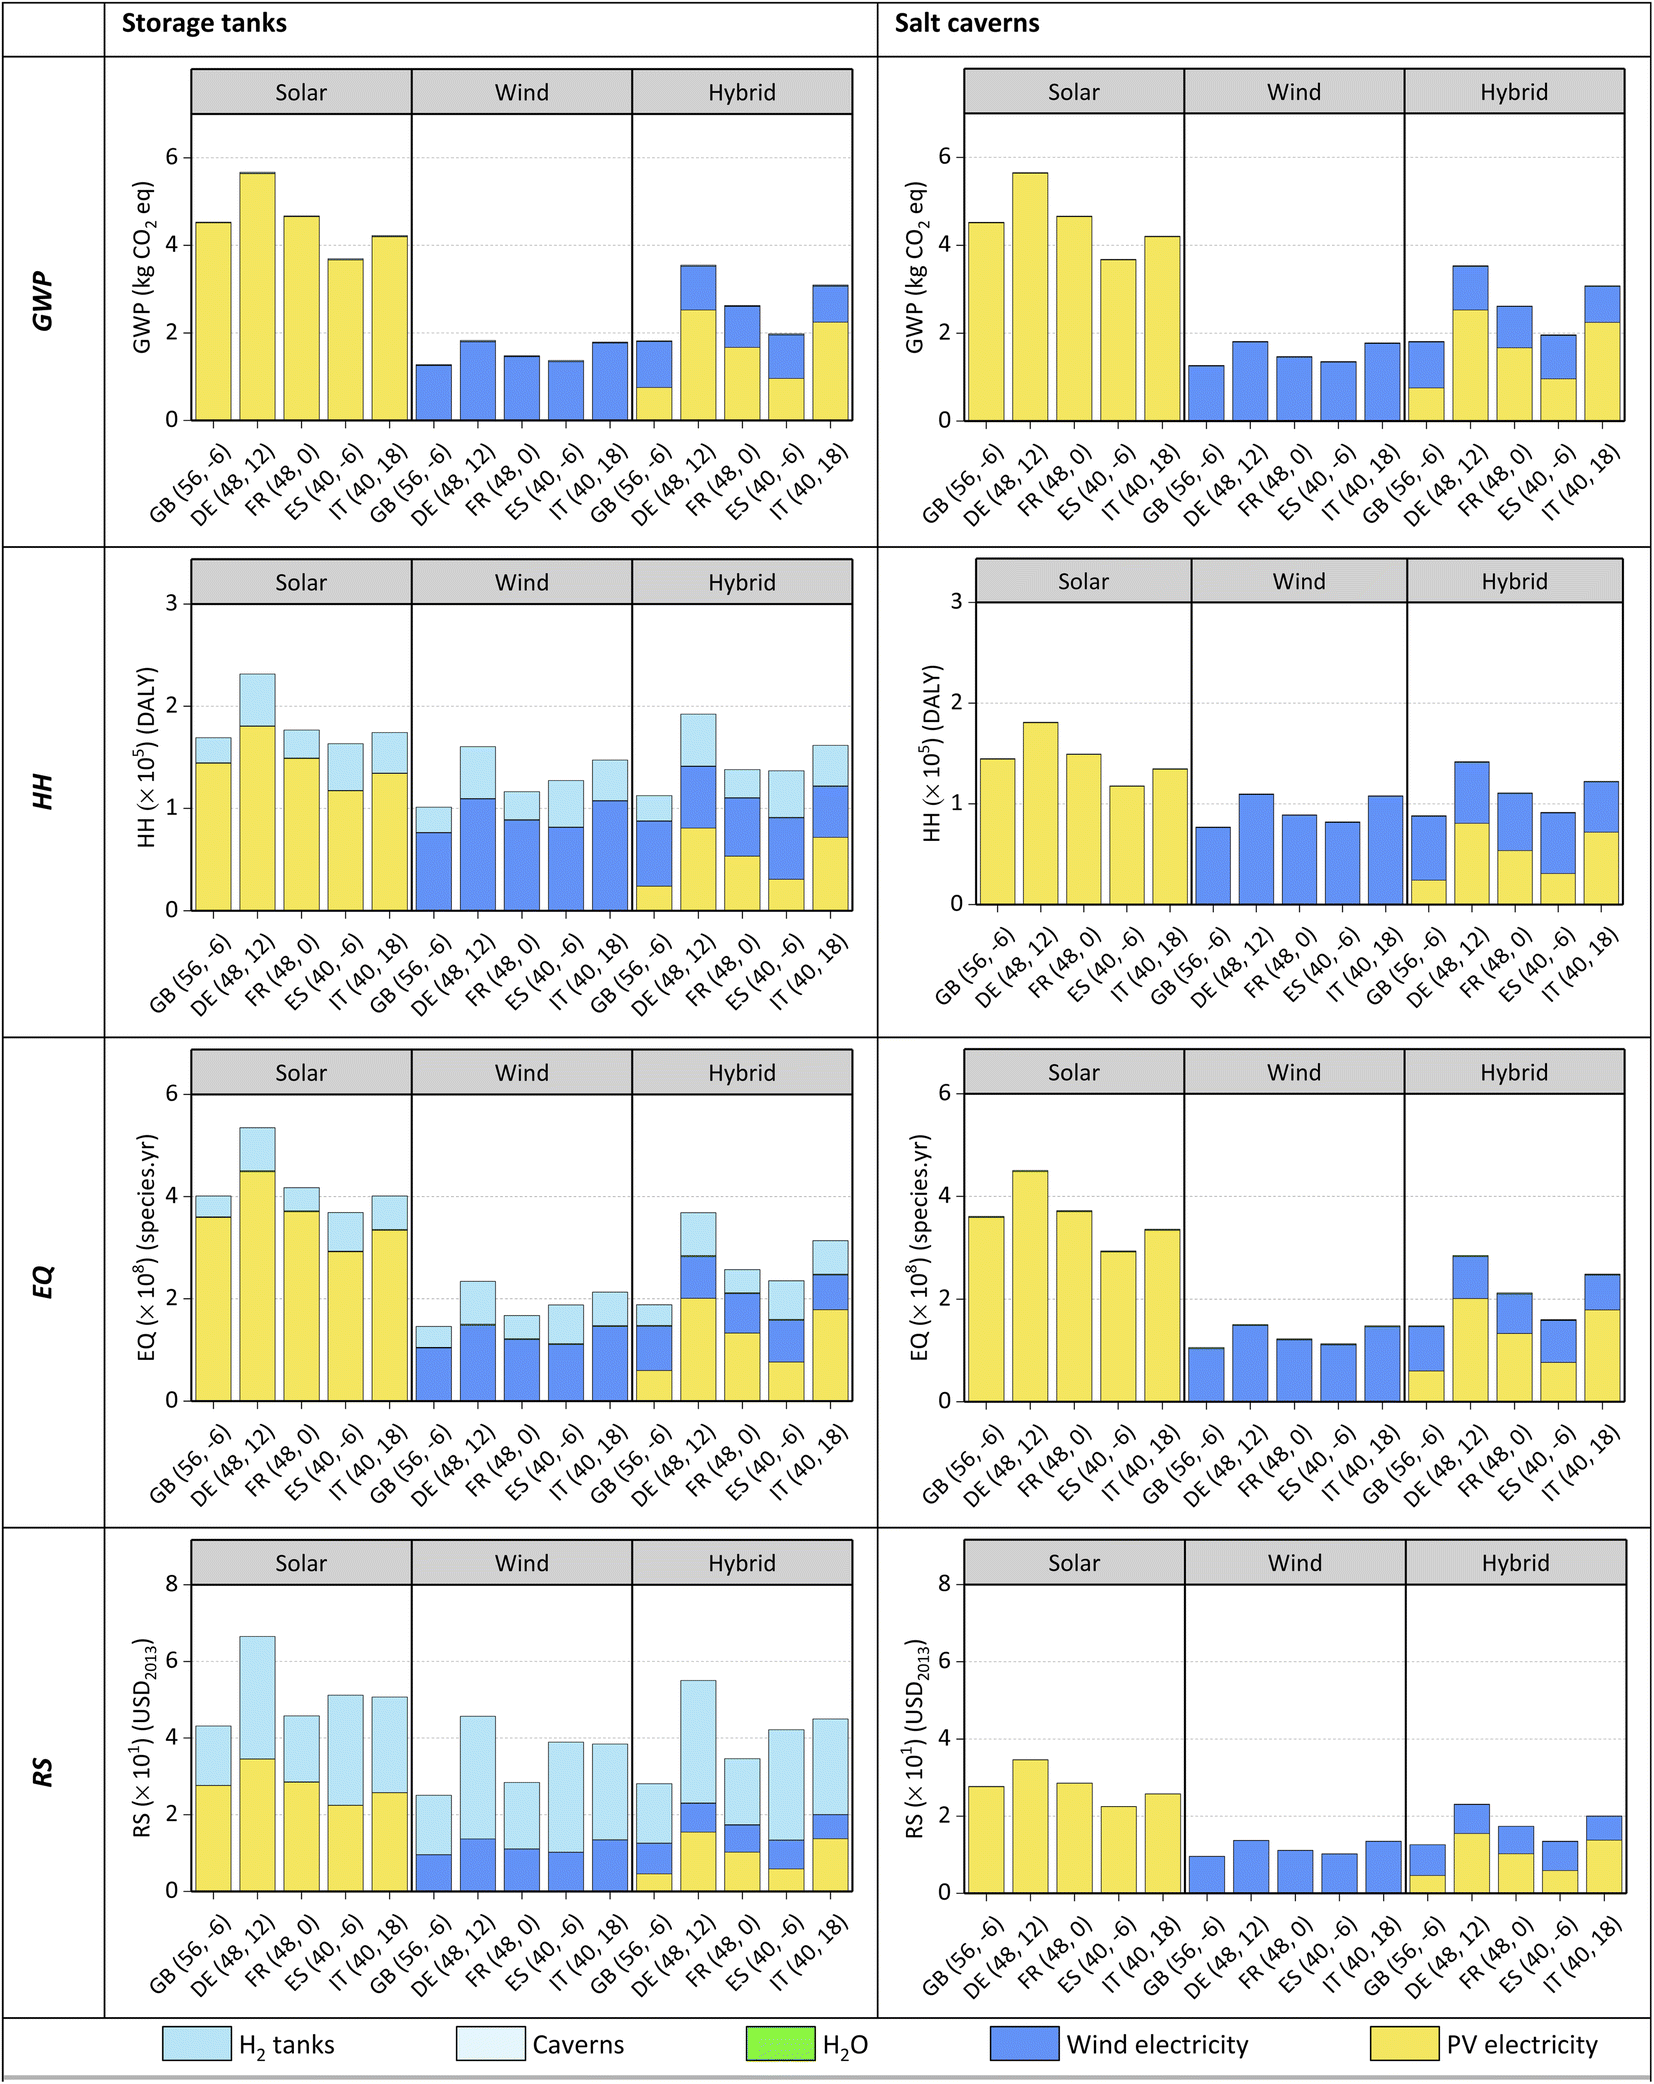 | ||
| Fig. 3 Green H2: LCA at the endpoint level + G: LCA at the endpoint level + WP. GWP: global warming potential, HH: human health, EQ: ecosystem quality, RS: resource scarcity. The figure shows the environmental impacts of the production of green H2 from solar, wind and solar-wind (hybrid) power in the United Kingdom (GB), Germany (DE), France (FR), Spain (ES) and Italy (IT), according to the ReCiPe 2016 LCA methodology. Most of the environmental impact of H2 comes from the electricity used for the electrolysis of water. For the scenarios assessed, wind H2 and solar H2 show the lowest and the highest impacts, respectively. Furthermore, tanks show higher impacts than salt caverns. | ||
We start by analysing the environmental footprint of green H2, the main contributor to the impact embodied in the e-fuel. Most of the environmental impacts associated with green H2 come from the electricity used in water electrolysis. The reason behind this is the fossil energy embodied in solar panels and wind turbines. However, the carbon footprint of solar PV and wind power is expected to decrease by 2050 compared to today's values by approximately 90% and 70%, respectively.79 These reductions would decrease the carbon footprint of electrolytic H2 substantially.
Overall, H2 from wind power outperforms both H2 from solar power and H2 from hybrid power in GWP and all endpoint categories.
Concerning H2 storage, tanks generate more impacts on HH, EQ and RS than salt caverns for all locations. For GWP, the impacts of Type I tanks and salt caverns are negligible compared to the electricity needed for water electrolysis. The environmental impact of Type I tanks is most notable in the RS endpoint category due to the use of aluminium alloy. For the modelling of salt caverns, only the impacts of compressing and drying H2 have been considered, which happen to be low in the categories analysed. Finally, although salt caverns would be environmentally better than Type I tanks, their availability could become an issue. Despite its potential for H2 storage in Europe, subsurface salt structures should meet strict technical criteria related to size, land availability and storage capacity,80,81 narrowing down the available options substantially.
 | ||
| Fig. 4 e-Jet fuel: LCA at the endpoint level + GWP. GWP: global warming potential, HH: human health, EQ: ecosystem quality, RS: resource scarcity. The environmental impacts of the production and utilisation of e-jet fuel from different sources of CO2 and green H2 from hybrid power are assessed based on the ReCiPe 2016 LCA methodology, for different locations: United Kingdom (GB), Germany (DE), France (FR), Spain (ES) and Italy (IT). The major contributors to the environmental impact of e-jet fuels are H2, CO2 and combustion emissions. There is burden-shifting, as e-jet fuel generally shows better performance in RS compared to fossil jet fuel at the expense of worsening HH and EQ. | ||
 | ||
| Fig. 5 Green H2: NPC breakdown. The NPC of green H2 from solar energy is higher than that from wind energy. However, for a given location, the cheapest H2 is obtained from a hybrid solar and wind system. In terms of the storage of H2, tanks are more expensive than salt caverns. From a location perspective, the cheapest H2 would be produced in GB. | ||
When comparing e-jet fuels with the BAU alternative, burden-shifting, i.e., some impacts become milder at the expense of worsening others, can be observed at both the endpoint and midpoint levels. Overall, there is burden-shifting toward the HH and EQ impact categories at the endpoint level. However, when using H2 stored in caverns, e-jet fuel can outperform the BAU in all the impact categories for specific locations, i.e., ES, when CO2 from C-PP is utilised as feedstock. Regarding GWP, e-jet fuels outperform the BAU in most locations when CO2 from power plants and DAC-HT are used. Nevertheless, the production of e-jet fuel in DE does not decrease in GWP compared to its fossil analogue, mainly due to the current environmental burden associated with green H2. Similarly, e-jet fuel from CO2 from DAC-LT would only be beneficial in FR.
In terms of the CO2 source, e-jet fuels from (DAC-HT) CO2 and (DAC-LT) CO2 show a higher environmental impact than (NG-PP) CO2 and (C-PP) CO2 on HH, EQ and RS. This means that, owing to their energy intensity,82,83 the DAC processes operated by both high and low-temperature heat perform worse than point source carbon capture. However, the high-carbon intensity energy currently in use is expected to be progressively decarbonised over the next few years.79,84 Moreover, it is worth noting that CO2 capture through DAC processes, unlike CO2 capture from power plants, aims to close the carbon loop. Therefore, a large global deployment of DAC technologies is expected in order to achieve the environmental objectives foreseen for the coming decades.
Lastly, from the LCA results of green H2, e-jet fuel produced from H2 stored in salt caverns shows lower environmental impacts in all the categories than when using storage tanks, regardless of the location.
3.3. Economic analysis
NPC: green H2. The NPC of green H2 is presented in Fig. 5.
The storage of H2 in salt caverns is cheaper than in tanks, ca. 72%. H2 from hybrid energy is always the cheapest option, i.e., 32–82% and 8–36% cheaper than solar-based H2 and wind-based H2, respectively. Regarding the cost breakdowns, the major contributors towards the NPC of H2 are the PV systems and/or wind systems (36–84%) except for solar H2 in GB, where the most significant investment would be in H2 tanks (ca. 52% of the NPC).
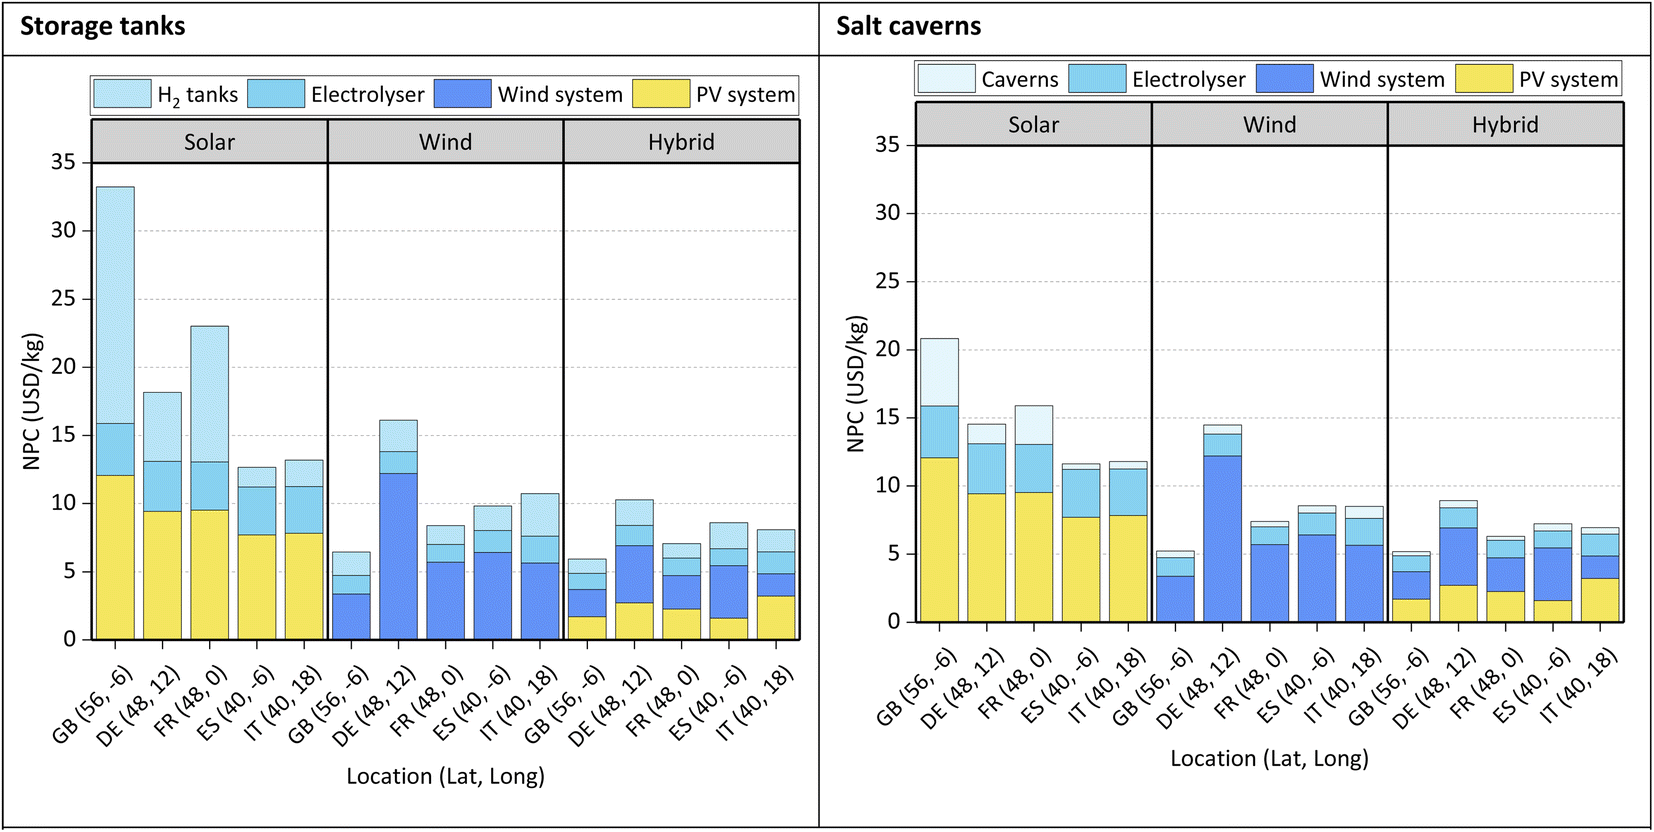
NPC: e-jet fuel. The NPC of e-jet fuel is presented in Fig. 6. H2 from hybrid solar and wind is considered for all scenarios, as in the LCA. The CAPEX and OPEX breakdowns are shown separately for the cheapest option of each scenario (marked with an *).
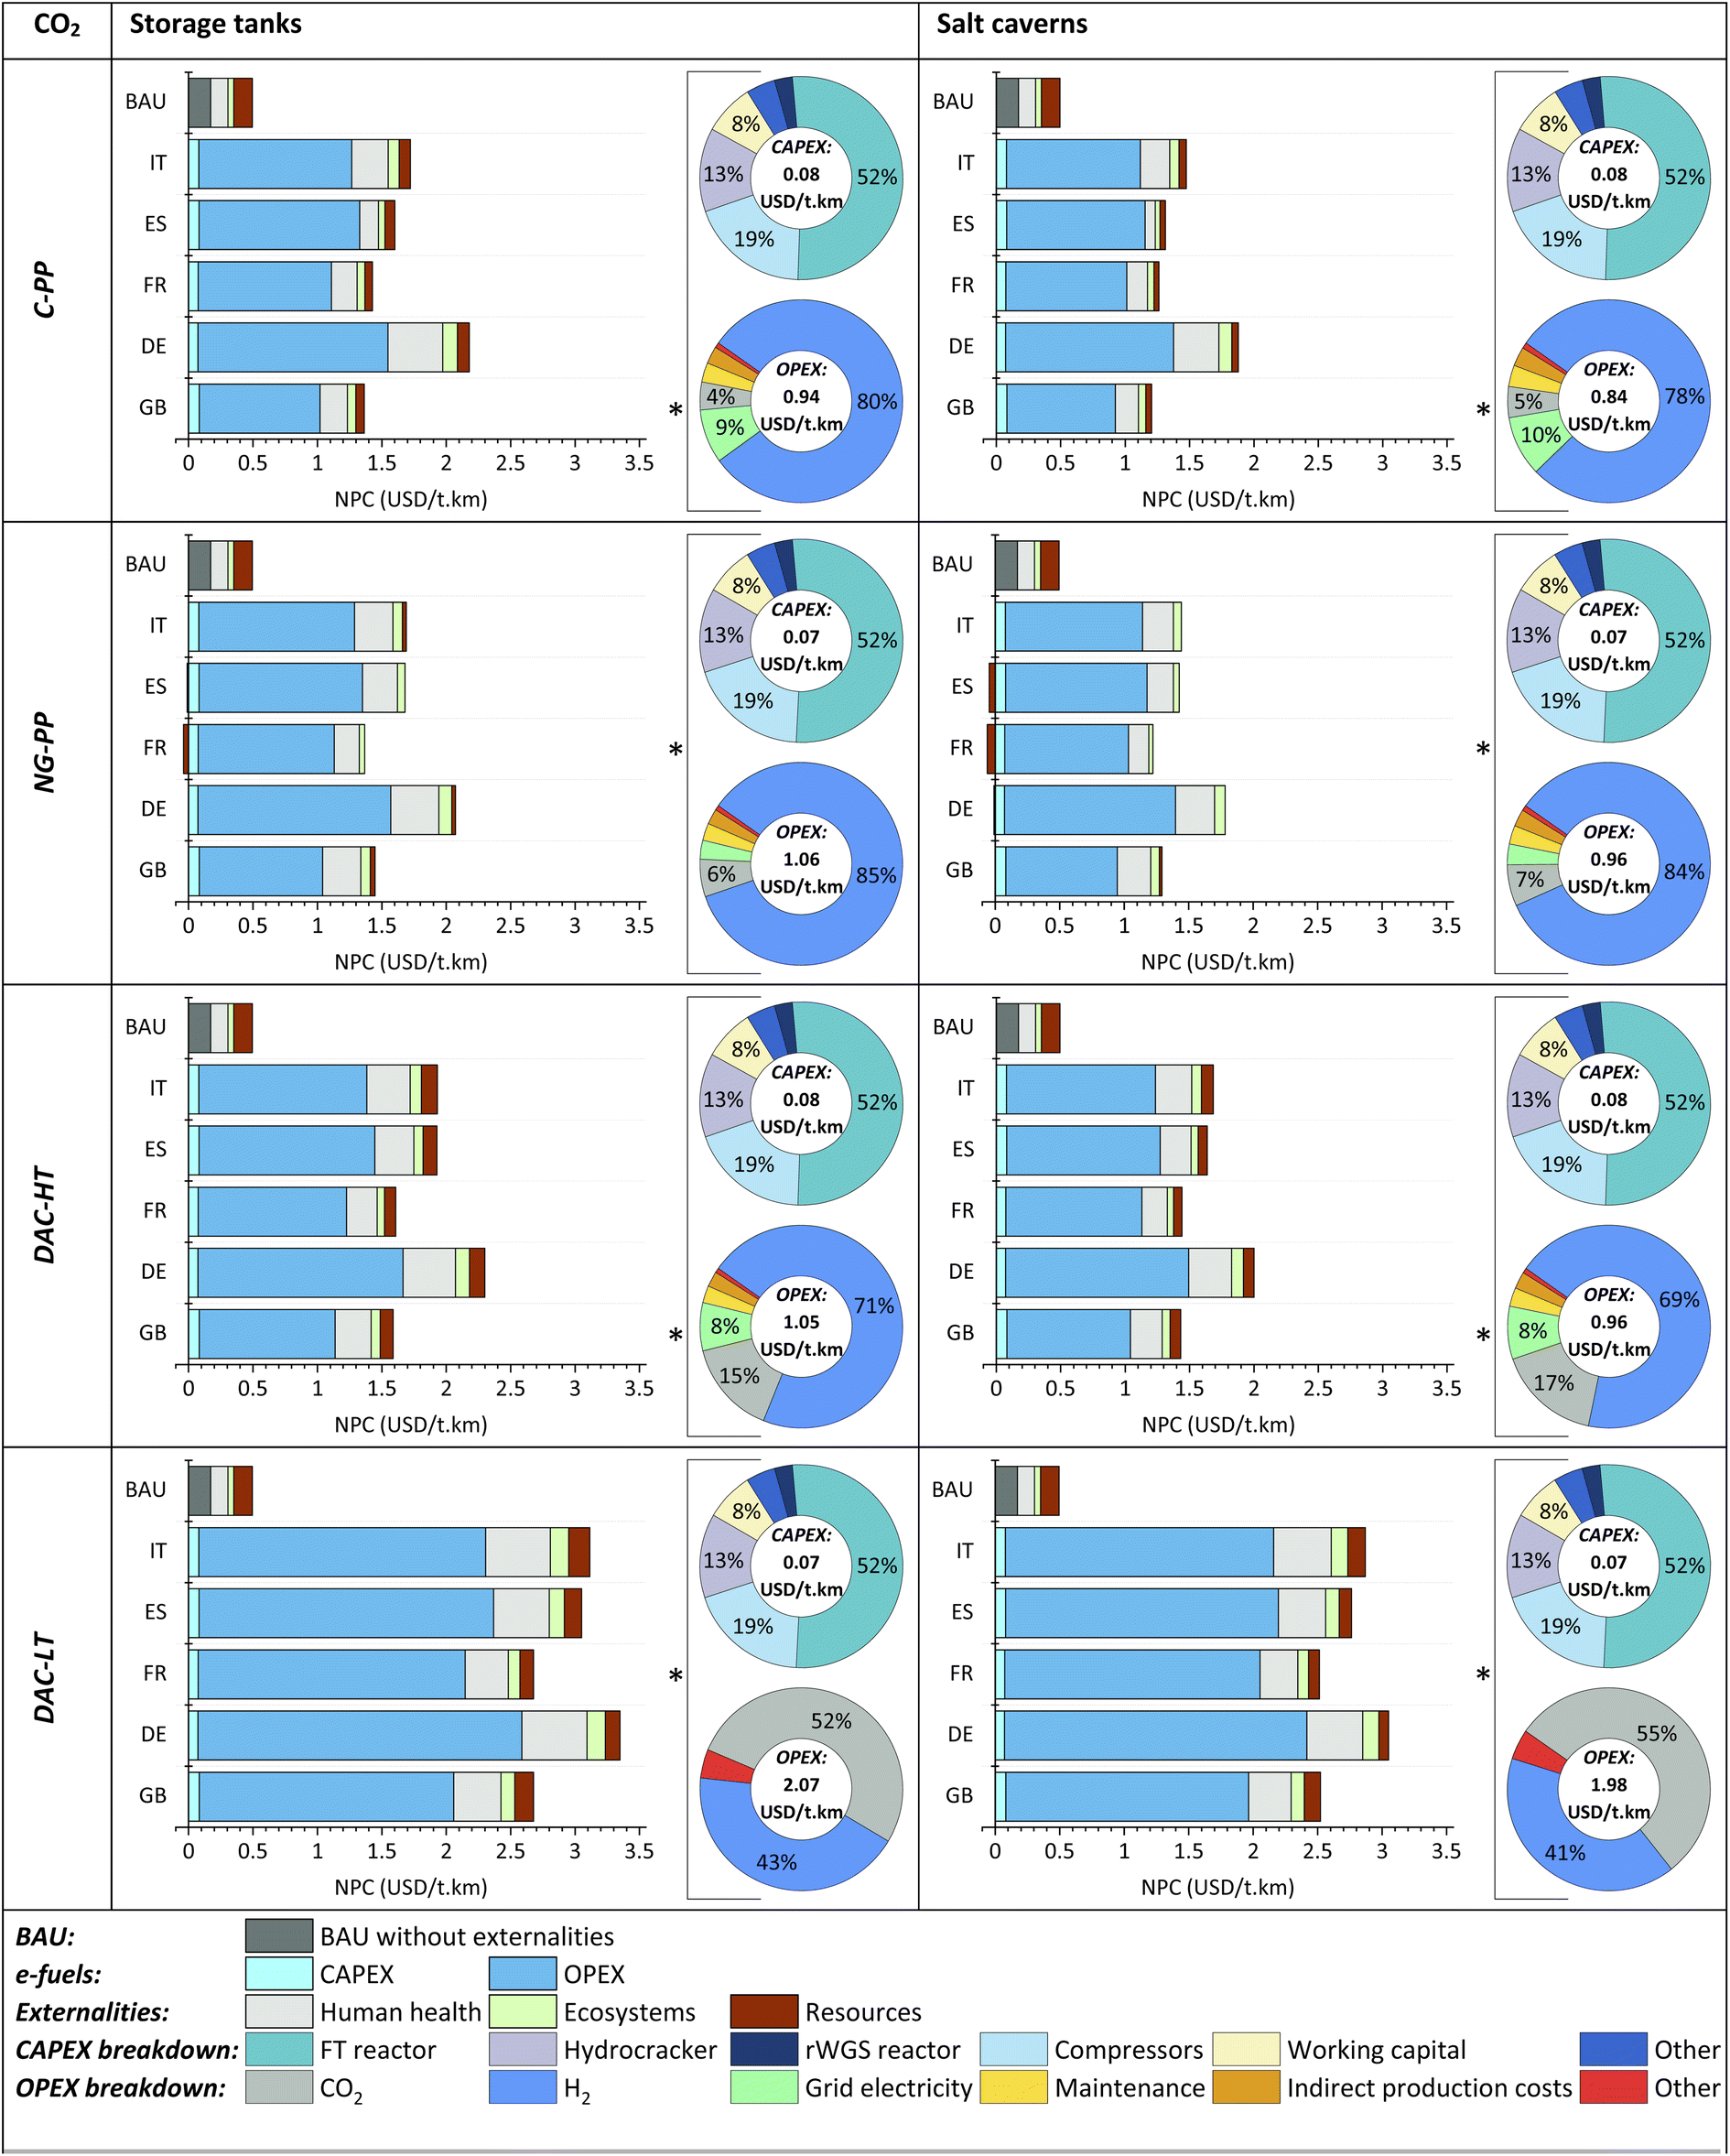 | ||
| Fig. 6 e-Jet fuel: NPC breakdown. e-Jet fuels are currently more expensive than their fossil analogues even when externalities are included in the production cost. The main contributions to the NPC of e-jet fuels come from H2, CO2 and grid electricity. The cheapest e-jet fuel would be produced in GB using CO2 from coal-fired plants and H2 from hybrid solar and wind energy. | ||
H2 stored in salt caverns is cheaper than H2 stored in tanks. Consequently, e-jet fuels from the former are thereby cheaper than those obtained from the latter, with externalities (i.e., 6–18% cheaper) and without externalities (i.e., 4–13% cheaper).
As depicted in Fig. 6, e-jet fuels are much more expensive than fossil jet fuel (BAU), i.e., 5.4–15.1-fold more costly, even after accounting for externalities, i.e., 2.3–6.8-fold more expensive. The current NPC of fossil jet fuel is 0.17 and 0.49 USD per t per km, without and with externalities, respectively.
Based on the economic performance excluding externalities, the option from (C-PP)CO2 in GB has the lowest production cost, with values of 0.93 and 1.02 USD per t per km, for H2 stored in salt caverns and type I tanks, respectively. However, after accounting for externalities, the alternative from (NG-PP)CO2 in FR is the cheapest option, with values of 1.16 and 1.33 USD per t per km for H2 stored in caverns and tanks, respectively. For each of the CO2 sources, e-jet fuel production in DE is the most costly among the locations assessed, including and excluding externalities.
OPEX is substantially higher than CAPEX in all cases, i.e., 11.5–34.8-fold higher for H2 tank storage and 10.3–32.4-fold higher for salt cavern storage.
In terms of the CAPEX of the plant, the FT reactor is the major contributor, followed by the compressors and the hydrocracker. Meanwhile, the most significant contributor to the OPEX is H2 and, to a lesser extent, CO2 and grid electricity, except for (DAC-LT) e-jet fuel, where CO2 is the main contributor to the NPC, followed by H2. It is important to mention that the CO2 cost for DAC-LT is based on the only DAC installation currently generating negative emissions, which is located in Iceland.85
According to the NPC breakdown of e-jet fuels, H2 and CO2 are the main cost contributors; their shares range between 34% and 84% for H2 without externalities (and 26–70% with externalities) and between 3% and 55% for CO2 without externalities (and 2–43%, with externalities).
The cost of the fuel represents only 17.7% of the total operating cost of a passenger airline,86 as shown in Fig. 7. However, the prohibitively high production costs of e-jet fuels, even when externalities are included, indicate that widespread deployment of these fuels will not occur in the short term, given the drastic reductions in captured CO2 and green H2 costs that would be necessary to make them economically appealing.
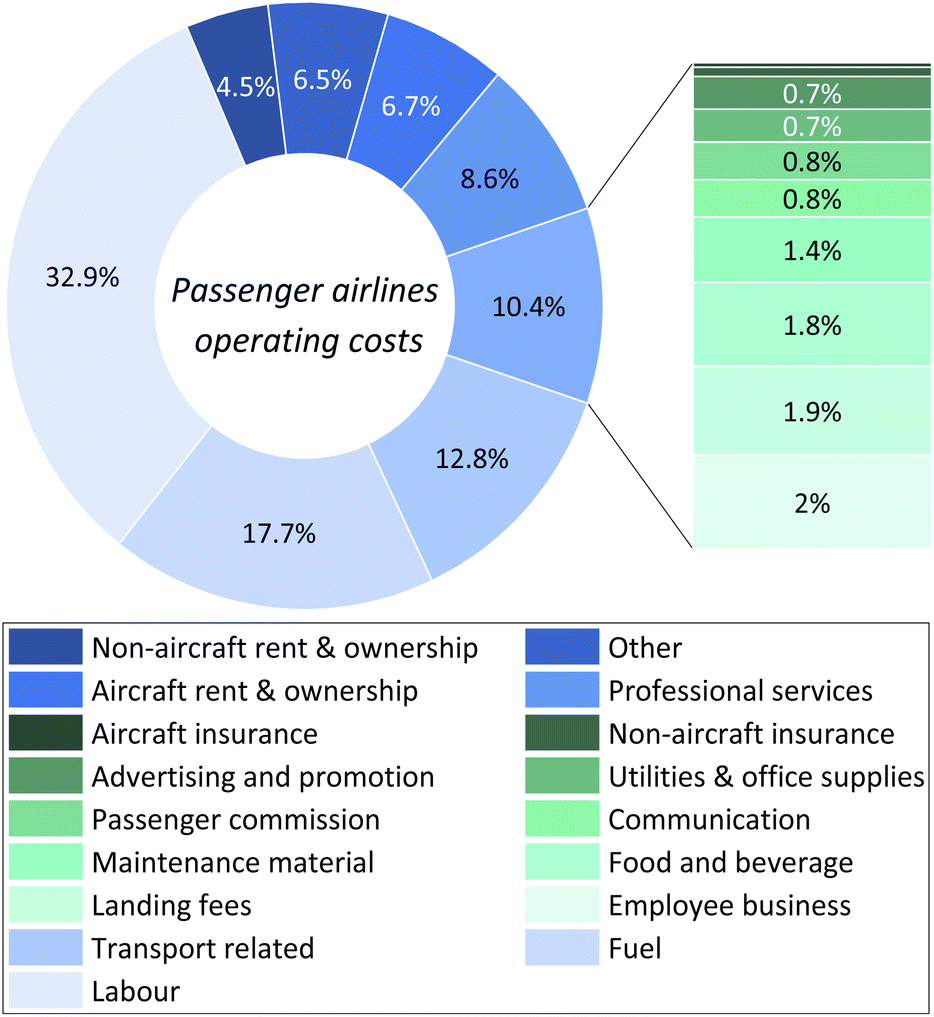 | ||
| Fig. 7 Breakdown of the operating costs of passenger airlines. Approximately, 17.7% of the total operating costs of passenger airlines comes from fuel cost. However, the major contributor to these costs is labour cost, which accounts for ca. 32.9% of them.86 | ||
770 USD/tCO2-eq, excluding externalities. All these values lie well above the current estimated social cost of carbon emissions (SCC), i.e., 37 USD/tCO2-eq, and mortality cost of carbon emissions (MCC), i.e., 258 USD/tCO2-eq.87
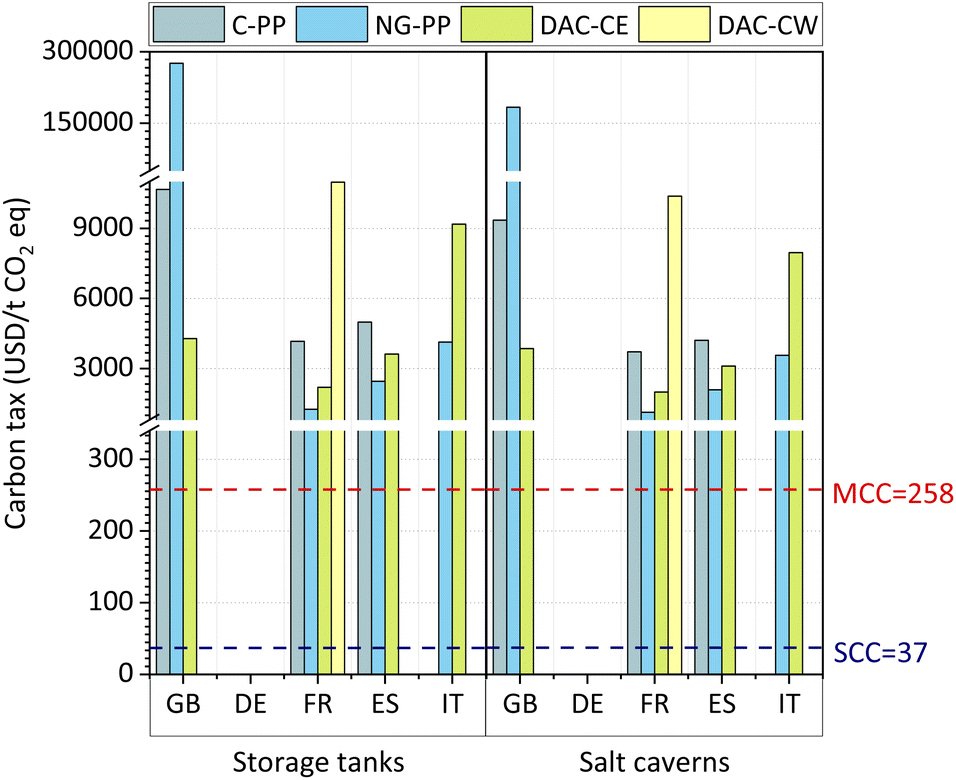 | ||
| Fig. 8 Carbon tax. A minimum carbon tax of 1125 USD/tCO2-eq would be required to make e-jet economically appealing compared to fossil jet fuel. | ||
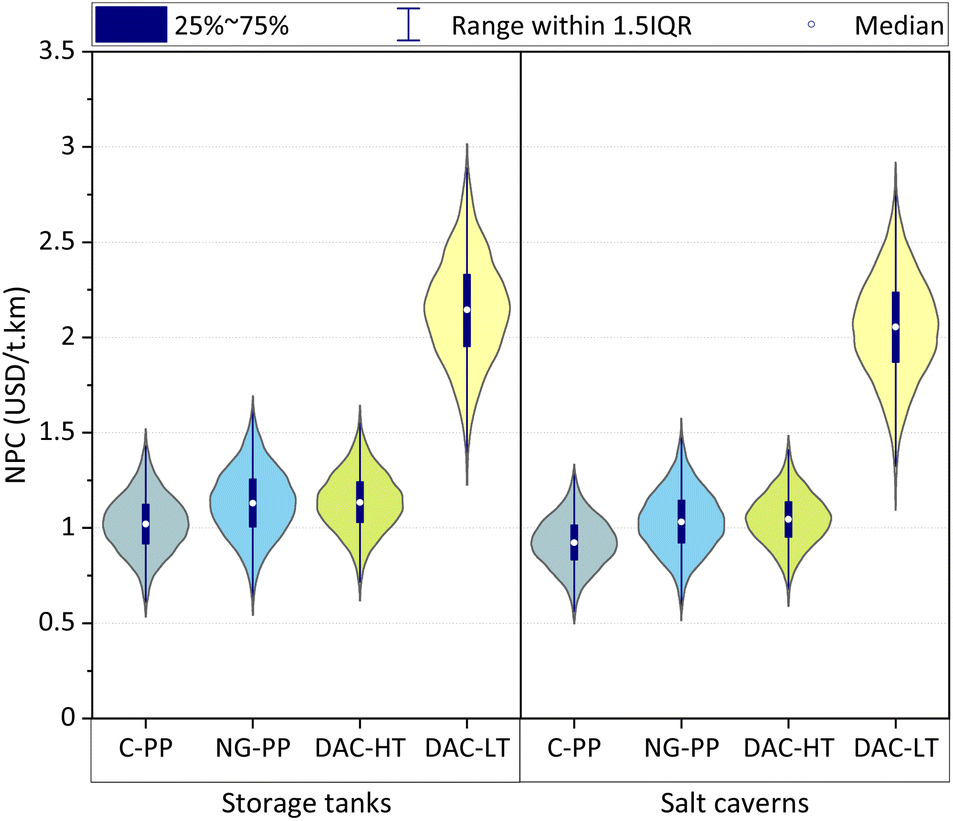 | ||
| Fig. 9 Uncertainty analysis. Based on the given parameters, the NPC of e-jet can go as low as 0.46/0.36 USD per t per km (from (C-PP) CO2), 0.53/0.39 USD per t per km (from (NG-PP) CO2), 0.52 USD per t per km (from (DAC-HT) CO2), and 1.11/1.03 USD per t per km (from (DAC-LT) CO2), for tanks and salt caverns storage, respectively. | ||
The variance of the cost lies in the range of 0.46–3.27 and 0.36–2.96 USD per t per km for H2 stored in tanks and salt caverns, respectively, indicating that the NPC of e-jet fuels has a strong dependence on the cost of H2, CO2 and grid electricity.
Regardless of the H2 storage option, e-jet fuel from (C-PP) CO2 is the cheapest alternative on average (1.02 and 0.92 USD per t per km for storage in tanks and caverns, respectively), followed by e-jet fuel produced using CO2 from NG-PP (1.13 and 1.03 USD per t per km), DAC-HT (1.13 and 1.04 USD per t per km) and DAC-LT (2.14 and 2.05 USD per t per km).
4. Conclusions
This work presents a critical analysis of e-jet fuel production from different sources of CO2 and green H2, using a wide range of tools to evaluate its current economic and environmental performance and elucidate the potential challenges for its widespread utilisation. Based on our analysis, e-jet fuel is not economically competitive against fossil fuel (i.e., at least 5.4-fold the cost of the fossil counterpart), mainly owing to the high price of green H2 and captured CO2, the two main feedstocks. This holds true even when the monetised LCA endpoint impacts, i.e., externalities, are added to the production cost; however, the economic gap is reduced such that e-jet fuel is found to be approximately 2.3-fold more expensive than the fossil analogue.For e-jet fuel to be economically competitive, a tax on CO2 of at least 1125 USD/tCO2-eq should be imposed on the fossil counterpart. This tax is equivalent to 30.4-fold the social cost of carbon and 4.4-fold the mortality cost of carbon at present. Thus, this is not deemed realistic.
From the environmental perspective, e-jet fuels could exacerbate some environmental categories. Whilst e-jet fuels mostly outperform fossil jet fuels in terms of global warming potential and resource scarcity, human health and ecosystem quality are worsened, i.e., burden-shifting from resource scarcity towards human health and ecosystem quality.
In view of the impact that CO2 and H2 have on the environmental and economic performance of e-jet fuels, efforts should focus on reducing their cost and impact, i.e., CO2 capture and H2O electrolysis, respectively, especially with regard to the electricity used, which is the most significant contributor to costs and environmental impacts (high carbon intensity at the moment).
Salt caverns for H2 storage and CO2 from natural gas and coal-fired power plants have proven to be among the cheapest alternatives; however, salt caverns are not universally available, and the use of fossil CO2 as a feedstock is fundamentally unsustainable. Hence, except for particular cases, H2 storage in tanks and CO2 from DAC will be considered the standard for e-jet fuel production plants requiring constant output.
As CO2 is also generated from burning e-jet fuels, where fossil CO2 is used as a feedstock, this technology can only be seen as an intermediate step towards a net-zero economy. In this regard, carbon capture and storage/sequestration (CCS) and bioenergy with carbon capture and storage/sequestration (BECCS) options should be evaluated as a possible way to close the carbon loop and effectively remove CO2 from the atmosphere.
The analysis presented in this study could be extended to regions other than Europe. The production costs of e-fuels would vary, depending mainly on the available energy resources (i.e., solar radiation and wind speed)34,35 and the investment risk associated with each region.88,89 Notwithstanding this, e-fuels are not expected to be economically competitive against fossil fuels using current technology. This is mainly due to the high investment costs of green H2 and, to a lesser extent, captured CO2 – the main raw materials for producing e-fuels.
Overall, the results of our study indicate that if we have the potential to deploy decarbonised energy, then it is better used to displace higher-carbon assets from the grid rather than to produce e-fuels. This work also highlights the importance of assessing any new technology oriented to sustainability beyond traditional economic and global warming potential indicators, given the potential for environmental burden shifting. Comprehensive assessments encompassing the economic performance and the global overview of the potential environmental impacts posed by any new technology will provide a more comprehensive picture that will facilitate more informed decision-making. Furthermore, we showed that accounting for the intermittency of renewables as part of the feasibility assessment of any project is key, given its strong impact on the project costs.
Author contributions
Diego Freire Ordóñez: conceptualisation, methodology, software, validation, formal analysis, investigation, data curation, writing – original draft, writing – review & editing, visualisation. Thorsteinn Halfdanarson: methodology. Caroline Ganzer: methodology. Nilay Shah: writing – review & editing, supervision. Niall Mac Dowell: writing – review & editing, supervision. Gonzalo Guillén-Gosálbez: conceptualisation, methodology, writing – review & editing, supervision.Conflicts of interest
There are no conflicts of interest to declare.Acknowledgements
Diego Freire has been funded by the Ecuadorian Secretariat for Higher Education, Science, Technology and Innovation, SENESCYT, Award No. 106-2017. The Institute for Applied Sustainability Research, iiasur, supports international research on global sustainability applied to the Global South. This publication was also created as part of NCCR Catalysis (grant 180544), a National Centre of Competence in Research funded by the Swiss National Science Foundation.Notes and references
- H. Ritchie and M. Roser, Energy, Our World in Data, 2020 Search PubMed.
- J.-P. Rodrigue, The geography of transport systems, Routledge, Abingdon Oxon, New York NY, 2020 Search PubMed.
- Benoit Lefevre and Angela Enriquez, Transport Sector Key to Closing the World's Emissions Gap, 2014 Search PubMed.
- K. Dahal, S. Brynolf, C. Xisto, J. Hansson, M. Grahn, T. Grönstedt and M. Lehtveer, Techno-economic review of alternative fuels and propulsion systems for the aviation sector, Renewable Sustainable Energy Rev., 2021, 151, 111564 CrossRef CAS.
- I. Ridjan, B. V. Mathiesen and D. Connolly, Terminology used for renewable liquid and gaseous fuels based on the conversion of electricity, J. Cleaner Prod., 2016, 112, 3709–3720 CrossRef CAS.
- A. Goldmann, W. Sauter, M. Oettinger, T. Kluge, U. Schröder, J. Seume, J. Friedrichs and F. Dinkelacker, A Study on Electrofuels in Aviation, Energies, 2018, 11, 392 CrossRef.
- J. Åkerman, A. Kamb, J. Larsson and J. Nässén, Low-carbon scenarios for long-distance travel 2060, Transportation Research Part D: Transport and Environment, 2021, 99, 103010 CrossRef.
- D. Freire Ordóñez, N. Shah and G. Guillén-Gosálbez, Economic and full environmental assessment of electrofuels via electrolysis and co-electrolysis considering externalities, Appl. Energy, 2021, 286, 116488 CrossRef.
- D. Freire Ordóñez and G. Guillén-Gosálbez, in 30th european symposium on computer aided chemical engineering, Elsevier, 2020, pp. 595–600 Search PubMed.
- D. Freire Ordóñez, T. Halfdanarson, C. Ganzer, G. Guillén-Gosálbez, N. M. Dowell and N. Shah, in Computer Aided Chemical Engineering, ed. A. Espuña, M. Graells and L. Puigjaner, Elsevier, 2017, pp. 1623–1628 Search PubMed.
- S. Hänggi, P. Elbert, T. Bütler, U. Cabalzar, S. Teske, C. Bach and C. Onder, A review of synthetic fuels for passenger vehicles, Energy Reports, 2019, 5, 555–569 CrossRef.
- L. Guzzella and A. Sciarretta, Vehicle propulsion systems. Introduction to modeling and optimization, Springer, Berlin, 3rd edn, 2013 Search PubMed.
- M. Lehtveer, S. Brynolf and M. Grahn, What Future for Electrofuels in Transport? Analysis of Cost Competitiveness in Global Climate Mitigation, Environ. Sci. Technol., 2019, 53, 1690–1697 CrossRef CAS.
- S. J. Davis, N. S. Lewis, M. Shaner, S. Aggarwal, D. Arent, I. L. Azevedo, S. M. Benson, T. Bradley, J. Brouwer, Y.-M. Chiang, C. T. M. Clack, A. Cohen, S. Doig, J. Edmonds, P. Fennell, C. B. Field, B. Hannegan, B.-M. Hodge, M. I. Hoffert, E. Ingersoll, P. Jaramillo, K. S. Lackner, K. J. Mach, M. Mastrandrea, J. Ogden, P. F. Peterson, D. L. Sanchez, D. Sperling, J. Stagner, J. E. Trancik, C.-J. Yang and K. Caldeira, Net-zero emissions energy systems, Science, 2018, 360, eaas9793 CrossRef PubMed.
- M. M. Alhyari, A. Al-Salaymeh, M. R. Irshidat, M. Kaltschmitt and U. Neuling, The Impact of Energy Source on the Life-Cycle Assessment of Power-to-Liquid Fuels, Journal of Ecological Engineering, 2019, 20, 239–244 CrossRef.
- K. Kieckhäfer, G. Quante, C. Müller, T. Spengler, M. Lossau and W. Jonas, Simulation-Based Analysis of the Potential of Alternative Fuels towards Reducing CO2 Emissions from Aviation, Energies, 2018, 11, 186 CrossRef.
- S. Schemme, J. L. Breuer, M. Köller, S. Meschede, F. Walman, R. C. Samsun, R. Peters and D. Stolten, H2-based synthetic fuels: A techno-economic comparison of alcohol, ether and hydrocarbon production, Int. J. Hydrogen Energy, 2020, 45(8), 5395–5414 CrossRef CAS.
- P. Schmidt, V. Batteiger, A. Roth, W. Weindorf and T. Raksha, Power to Liquids as Renewable Fuel Option for Aviation. A Review, 2018 Search PubMed.
- P. Schmidt, W. Weindorf, A. Roth, V. Batteiger, F. Riegel and Deutschland Umweltbundesamt, Power-to-liquids: Potentials and Perspectives for the Future Supply of Renewable Aviation Fuel, German Environment Agency, 2016 Search PubMed.
- E. D. Sherwin, Electrofuel Synthesis from Variable Renewable Electricity: An Optimization-Based Techno-Economic Analysis, Environ. Sci. Technol., 2021, 55, 7583–7594 CrossRef CAS PubMed.
- J. Trinh, F. Harahap, A. Fagerström and J. Hansson, What Are the Policy Impacts on Renewable Jet Fuel in Sweden?, Energies, 2021, 14, 7194 CrossRef CAS.
- G. Hutchings, M. Davidson, P. Atkins, P. Collier, N. Jackson, A. Morton, M. Muskett, M. Rosseinsky, P. Styring, P. Thornley and C. Williams, Sustainable synthetic carbon based fuels for transport. Sustainable synthetic carbon based fuels for transport, The Royal Society, London, 2019 Search PubMed.
- J. Armijo and C. Philibert, Flexible production of green hydrogen and ammonia from variable solar and wind energy: Case study of Chile and Argentina, Int. J. Hydrogen Energy, 2020, 45, 1541–1558 CrossRef CAS.
- C. Ganzer and N. Mac Dowell, A comparative assessment framework for sustainable production of fuels and chemicals explicitly accounting for intermittency, Sustainable Energy Fuels, 2020, 4(8), 3888–3903 RSC.
- B. P. Weidema, Comparing Three Life Cycle Impact Assessment Methods from an Endpoint Perspective, J. Ind. Ecol., 2015, 19, 20–26 CrossRef CAS.
- International Energy Agency (IEA) Data, International Energy Agency.
- Aspen Technology, Aspen Plus, https://www.aspentech.com/en/products/engineering/aspen-plus Search PubMed.
- D. H. König, M. Freiberg, R.-U. Dietrich and A. Wörner, Techno-economic study of the storage of fluctuating renewable energy in liquid hydrocarbons, Fuel, 2015, 159, 289–297 CrossRef.
- F. G. Albrecht, D. H. König, N. Baucks and R.-U. Dietrich, A standardized methodology for the techno-economic evaluation of alternative fuels – a case study, Fuel, 2017, 194, 511–526 CrossRef CAS.
- O. Schmidt, A. Gambhir, I. Staffell, A. Hawkes, J. Nelson and S. Few, Future cost and performance of water electrolysis: An expert elicitation study, Int. J. Hydrogen Energy, 2017, 42, 30470–30492 CrossRef CAS.
- PV magazine, Portuguese consortium plans 1 GW green hydrogen cluster, https://www.pv-magazine.com/2020/07/30/portuguese-consortium-plans-1-gw-green-hydrogen-cluster/, accessed 7 January 2022 Search PubMed.
- PV magazine, Thyssenkrupp increases annual electrolyzer capacity to 1 GW, https://www.pv-magazine.com/2020/06/09/thyssenkrupp-increases-annual-electrolyzer-capacity-to-1-gw/, accessed 7 January 2022 Search PubMed.
- Recharge, Plans unveiled for 1GW green-hydrogen power plant fuelled by wind and solar | Recharge, https://www.rechargenews.com/transition/plans-unveiled-for-1gw-green-hydrogen-power-plant-fuelled-by-wind-and-solar/2-1-812928, accessed 7 January 2022 Search PubMed.
- S. Pfenninger and I. Staffell, Long-term patterns of European PV output using 30 years of validated hourly reanalysis and satellite data, Energy, 2016, 114, 1251–1265 CrossRef.
- I. Staffell and S. Pfenninger, Using bias-corrected reanalysis to simulate current and future wind power output, Energy, 2016, 114, 1224–1239 CrossRef.
- G. Reiter and J. Lindorfer, Evaluating CO2 sources for power-to-gas applications – A case study for Austria, J. CO2 Util., 2015, 10, 40–49 CrossRef CAS.
- S. Sengupta, A. Jha, P. Shende, R. Maskara and A. K. Das, Catalytic performance of Co and Ni doped Fe-based catalysts for the hydrogenation of CO2 to CO via reverse water-gas shift reaction, J. Environ. Chem. Eng., 2019, 7, 102911 CrossRef CAS.
- R. B. Unde, Kinetics and reaction engineering aspects of syngas production by the heterogeneously catalysed reverse water gas shift reaction, Germany, 2012 Search PubMed.
- D. H. König, N. Baucks, R.-U. Dietrich and A. Wörner, Simulation and evaluation of a process concept for the generation of synthetic fuel from CO2 and H2, Energy, 2015, 91, 833–841 CrossRef.
- Z. Zhang, C. Shen, K. Sun, X. Jia, J. Ye and C. Liu, Advances in studies of the structural effects of supported Ni catalysts for CO 2 hydrogenation: from nanoparticle to single atom catalyst, J. Mater. Chem. A, 2022, 10, 5792–5812 RSC.
- M. Hillestad, Modeling the Fischer–Tropsch Product Distribution and Model Implementation, Chem. Prod. Process Model., 2015, 10, 147–159 CAS.
- M. Samavati, Design and analysis of solid oxide electrolysis-based systems for synthetic liquid fuels production, KTH Royal Institute of Technology, 2018 Search PubMed.
- D. Selvatico, A. Lanzini and M. Santarelli, Low Temperature Fischer-Tropsch fuels from syngas: Kinetic modeling and process simulation of different plant configurations, Fuel, 2016, 186, 544–560 CrossRef CAS.
- N. Jungbluth, R. Frischknecht, M. Faist Emmenegger, R. Steiner and M. Tuchschmid, Life Cycle Assessment of BTL-fuel production: Inventory Analysis, 2007 Search PubMed.
- K. Ibrik, Kinetics of the Fischer-Tropsch Reaction Over Alumina Supported Cobalt Catalyst in a Slurry Reactor, Qatar Foundation Annual Research Forum Proceedings, 2011, EGPS2 Search PubMed.
- D. Vervloet, F. Kapteijn, J. Nijenhuis and J. R. van Ommen, Fischer–Tropsch reaction–diffusion in a cobalt catalyst particle: aspects of activity and selectivity for a variable chain growth probability, Catal. Sci. Technol., 2012, 2, 1221 RSC.
- D. H. König, M. Freiberg, R.-U. Dietrich and A. Wörner, Techno-economic study of the storage of fluctuating renewable energy in liquid hydrocarbons, Fuel, 2015, 159, 289–297 CrossRef.
- M. Moser, T. Pregger, S. Simon, D. H. König, A. Wörner, R. U. Dietrich, M. Köhler, P. Oßwald, J. Grohmann, T. Kathrotia, G. Eckel, D. Schweitzer, N. Armbrust, H. Dieter, G. Scheffknecht, C. Kern, J. Thiessen, A. Jess and M. Aigner, Synthetic Liquid Hydrocarbons from Renewable Energy – Results of the Helmholtz Energy Alliance, Chem.-Ing.-Tech., 2017, 89, 274–288 CrossRef CAS.
- B. Viswanathan, in Energy sources, ed. B. Viswanathan, Elsevier, Amsterdam, Boston, 2017, pp. 29–57 Search PubMed.
- P. R. Robinson, in Advances in Clean Hydrocarbon Fuel Processing: Woodhead Publishing Series in Energy, ed. M. R. Khan, Woodhead Publishing, 2011, pp. 287–325 Search PubMed.
- J. Lee, S. Hwang, J. G. Seo, S.-B. Lee, J. C. Jung and I. K. Song, Production of middle distillate through hydrocracking of paraffin wax over Pd/SiO2–Al2O3 catalysts, J. Ind. Eng. Chem., 2010, 16, 790–794 CrossRef CAS.
- J. Lee, S. Hwang, J. G. Seo, U. G. Hong, J. C. Jung and I. K. Song, Pd catalyst supported on SiO2–Al2O3 xerogel for hydrocracking of paraffin wax to middle distillate, J. Ind. Eng. Chem., 2011, 17, 310–315 CrossRef CAS.
- Y. Liu, K. Murata, K. Okabe, M. Inaba, I. Takahara, T. Hanaoka and K. Sakanishi, Selective hydrocracking of Fischer–Tropsch waxes to high-quality diesel fuel over pt-promoted polyoxocation-pillared montmorillonites, Top. Catal., 2009, 52, 597–608 CrossRef CAS.
- V. Calemma, C. Gambaro, W. O. Parker, R. Carbone, R. Giardino and P. Scorletti, Middle distillates from hydrocracking of FT waxes: composition, characteristics and emission properties, Catal. Today, 2010, 149, 40–46 CrossRef CAS.
- T. Hengsawad, C. Srimingkwanchai, S. Butnark, D. E. Resasco and S. Jongpatiwut, Effect of metal–acid balance on hydroprocessed renewable jet fuel synthesis from hydrocracking and hydroisomerization of biohydrogenated diesel over Pt-supported catalysts, Ind. Eng. Chem. Res., 2018, 57, 1429–1440 CrossRef CAS.
- M. M. El-Halwagi, Sustainable Design Through Process Integration: Fundamentals and Applications to Industrial Pollution Prevention, Resource Conservation, and Profitability Enhancement, Elsevier Ltd, Amsterdam, 2nd edn, 2017 Search PubMed.
- Aspen Technology, Aspen Energy Analyzer, https://www.aspentech.com/en/products/pages/aspen-energy-analyzer Search PubMed.
- H. Bruijn, R. Duin, M. A. J. Huijbregts, J. B. Guinee, M. Gorree, R. Heijungs, G. Huppes, R. Kleijn, A. Koning, L. Oers and A. Wegener Sleeswijk, Handbook on Life Cycle Assessment. Operational Guide to the ISO Standards, Kluwer Academic Publishers, Dordrecht, 2004 Search PubMed.
- Pré Consultants B. V., SimaPro|The World's Leading LCA Software, https://simapro.com/, (accessed 2 August 2019) Search PubMed.
- L. J. Müller, A. Kätelhön, M. Bachmann, A. Zimmermann, A. Sternberg and A. Bardow, A Guideline for Life Cycle Assessment of Carbon Capture and Utilization, Front. Energy Res., 2020, 8, 15 CrossRef.
- K. Bareiß, C. de La Rua, M. Möckl and T. Hamacher, Life cycle assessment of hydrogen from proton exchange membrane water electrolysis in future energy systems, Appl. Energy, 2019, 237, 862–872 CrossRef.
- S. Häfele, M. Hauck and J. Dailly, Life cycle assessment of the manufacture and operation of solid oxide electrolyser components and stacks, Int. J. Hydrogen Energy, 2016, 41, 13786–13796 CrossRef.
- B. Sørensen and G. Spazzafumo, in Hydrogen and Fuel Cells, ed. B. Sørensen and G. Spazzafumo, Elsevier Science, San Diego, CA, USA, 2018, pp. 413–461 Search PubMed.
- H. Nojoumi, I. Dincer and G. F. Naterer, Greenhouse gas emissions assessment of hydrogen and kerosene-fueled aircraft propulsion, Int. J. Hydrogen Energy, 2009, 34, 1363–1369 CrossRef CAS.
- G. Wernet, C. Bauer, B. Steubing, J. Reinhard, E. Moreno-Ruiz and B. Weidema, The ecoinvent database version 3 (part I): overview and methodology, Int. J. Life Cycle Assess., 2016, 21, 1218–1230 CrossRef.
- M. Tomatis, M. T. Moreira, H. Xu, W. Deng, J. He and A. M. Parvez, Removal of VOCs from waste gases using various thermal oxidizers: A comparative study based on life cycle assessment and cost analysis in China, J. Cleaner Prod., 2019, 233, 808–818 CrossRef CAS.
- M. A. J. Huijbregts, Z. J. N. Steinmann, P. M. F. Elshout, G. Stam, F. Verones, M. Vieira, M. Zijp, A. Hollander and R. van Zelm, ReCiPe2016: a harmonised life cycle impact assessment method at midpoint and endpoint level, Int. J. Life Cycle Assess., 2017, 22, 138–147 CrossRef.
- R. Sinnott and G. Towler, Chemical engineering design, Elsevier, Oxford, 2020 Search PubMed.
- L. L. Access Intelligence, The Chemical Engineering Plant Cost Index - Chemical Engineering, https://www.chemengonline.com/pci-home, (accessed 18 April 2020) Search PubMed.
- World Bank, Commodity Markets, https://www.worldbank.org/en/research/commodity-markets, (accessed 11 January 2022) Search PubMed.
- M. B. Viswanathan, D. R. Raman, K. A. Rosentrater and B. H. Shanks, A Technoeconomic Platform for Early-Stage Process Design and Cost Estimation of Joint Fermentative–Catalytic Bioprocessing, Processes, 2020, 8, 229 CrossRef.
- IATA, Economic Performance of the Airline Industry, 2020 Search PubMed.
- B. Graver, K. Zhang and D. Rutherford, CO2 emissions from commercial aviation, 2018, 2022, https://theicct.org/publications/co2-emissions-commercial-aviation-2018, (accessed 11 January 2022) Search PubMed.
- Laia and Pierre-Selim, How much fuel per passenger an aircraft is consuming?, https://blog.openairlines.com/how-much-fuel-per-passenger-an-aircraft-is-consuming, (accessed 11 January 2022) Search PubMed.
- D. F. Rodríguez-Vallejo, G. Guillén-Gosálbez and B. Chachuat, What Is the True Cost of Producing Propylene from Methanol? The Role of Externalities, ACS Sustainable Chem. Eng., 2020, 8, 3072–3081 CrossRef.
- I. M. Algunaibet, C. Pozo, Á. Galán-Martín and G. Guillén-Gosálbez, Quantifying the cost of leaving the Paris Agreement via the integration of life cycle assessment, energy systems modeling and monetization, Appl. Energy, 2019, 242, 588–601 CrossRef.
- A. González-Garay, M. S. Frei, A. Al-Qahtani, C. Mondelli, G. Guillén-Gosálbez and J. Pérez-Ramírez, Plant-to-planet analysis of CO2-based methanol processes, Energy Environ. Sci., 2019, 12, 3425–3436 RSC.
- O. Schmidt, S. Melchior, A. Hawkes and I. Staffell, Projecting the Future Levelized Cost of Electricity Storage Technologies, Joule, 2019, 3, 81–100 CrossRef.
- M. Pehl, A. Arvesen, F. Humpenöder, A. Popp, E. G. Hertwich and G. Luderer, Understanding future emissions from low-carbon power systems by integration of life-cycle assessment and integrated energy modelling, Nat. Energy, 2017, 2, 939–945 CrossRef CAS.
- D. G. Caglayan, N. Weber, H. U. Heinrichs, J. Linßen, M. Robinius, P. A. Kukla and D. Stolten, Technical potential of salt caverns for hydrogen storage in Europe, Int. J. Hydrogen Energy, 2020, 45, 6793–6805 CrossRef CAS.
- Fuels Cells and Hydrogen 2 Joint Undertaking, Opportunities for Hydrogen Energy Technologies Considering the National Energy & Climate Plans, 2020 Search PubMed.
- D. W. Keith, G. Holmes, D. St. Angelo and K. Heidel, A Process for Capturing CO2 from the Atmosphere, Joule, 2018, 2, 1573–1594 CrossRef CAS.
- S. Deutz and A. Bardow, Life-cycle assessment of an industrial direct air capture process based on temperature–vacuum swing adsorption, Nat. Energy, 2021, 6, 203–213 CrossRef CAS.
- N. Mac Dowell, N. Sunny, N. Brandon, H. Herzog, A. Y. Ku, W. Maas, A. Ramirez, D. M. Reiner, G. N. Sant and N. Shah, The hydrogen economy: A pragmatic path forward, Joule, 2021, 5, 2524–2529 CrossRef CAS.
- H. J. Herzog, Direct air capture: A process engineer's view, 2021 Search PubMed.
- Airlines For America, A4A Passenger Airline Cost Index (PACI), https://www.airlines.org/dataset/a4a-quarterly-passenger-airline-cost-index-u-s-passenger-airlines/ Search PubMed.
- R. D. Bressler, The mortality cost of carbon, Nat. Commun., 2021, 12, 1–12 CrossRef PubMed.
- B. U. Schyska and A. Kies, How regional differences in cost of capital influence the optimal design of power systems, Appl. Energy, 2020, 262, 114523 CrossRef.
- C. Agutu, F. Egli, N. J. Williams, T. S. Schmidt and B. Steffen, Accounting for finance in electrification models for sub-Saharan Africa, Nat. Energy, 2022, 1–11 Search PubMed.
Footnote |
| † Electronic supplementary information (ESI) available. See https://doi.org/10.1039/d2se00757f |
| This journal is © The Royal Society of Chemistry 2022 |