
 Open Access Article
 This Open Access Article is licensed under a Creative Commons Attribution-Non Commercial 3.0 Unported Licence
Decarbonization potential of on-road fuels and powertrains in the European Union and the United States: a well-to-wheels assessment†
Hao
Cai
 *a,
Matteo
Prussi
*be,
Longwen
Ou
a,
Michael
Wang
a,
Marta
Yugo
c,
Laura
Lonza
d and
Nicolae
Scarlat
b
*a,
Matteo
Prussi
*be,
Longwen
Ou
a,
Michael
Wang
a,
Marta
Yugo
c,
Laura
Lonza
d and
Nicolae
Scarlat
b
aSystems Assessment Center, Energy Systems Division, Argonne National Laboratory, Lemont, Illinois, USA. E-mail: hcai@anl.gov
bEuropean Commission, Joint Research Centre (JRC), Ispra, Italy. E-mail: matteo.prussi@epolito.it
cConcawe, Bruxelles, Belgium
dDirectorate General Climate Acton (DG-CLIMA), European Commission, Bruxelles, Belgium
ePolytechnic University of Turin, Turin, Italy
First published on 1st September 2022
Abstract
Transportation is fundamental for any modern economy, but its growing energy demand and the related climate impact call for urgent action. Life-cycle analysis (LCA) is a suitable approach to assessing the greenhouse gas (GHG) performance and decarbonization potential of transportation fuels and vehicle powertrains. Here, we assessed well-to-wheels (WTW) GHG emission reductions for a wide set of light-duty vehicle fuel and powertrain technologies used in the European Union (EU) and the United States (U.S.) for their decarbonization potential. We focused on the similarities and differences of the results and the underlying methodologies and data of the two analyses. We evaluated the decarbonization potential of new fuel–vehicle systems in Europe and the United States in comparison to the baseline petroleum gasoline and diesel vehicles in each market. For the transportation fuels examined in both regions, waste-to-fuel technologies and drop-in renewable diesel fuels (biofuels) produced from residues offer the biggest opportunities for reducing per-energy-unit GHG emissions, but may be limited in scale-up potentials given feedstock availabilities, qualities, and logistics challenges. The potential benefits of electricity and hydrogen as fuels span a wide range, determined by the primary energy source and the potential deployment of carbon capture and sequestration technologies. From a tank-to-wheels perspective, electric powertrains, with higher energy efficiency than internal combustion engines, provide incontrovertible evidence of GHG savings. For vehicle–fuel combined systems, the per km WTW results from GREET are generally higher than the JEC estimates, owing to greater vehicle fuel consumption attributable to larger vehicle sizes and more aggressive driving cycles in the U.S. This paper highlights key drivers of WTW fuel–vehicle system GHG emissions as well as opportunities and limitations to decarbonize light-duty transportation in Europe and the United States with promising alternative fuel production and vehicle powertrain technologies. Results show that major solutions in both regions are aligned, despite certain differences in the methodologies and results of the WTW analyses. As well as informing optimal selection of fuel and powertrain technologies for future vehicles, these findings are also useful in informing how existing vehicles can best be decarbonized through the use of renewable fuels and advanced powertrain technologies.
1 Introduction
Transportation is fundamental to any modern economy. Its importance as a factor in climate change is constantly growing because its demand for energy tends to outpace technology improvements that have been implemented to curb its environmental impacts. Data aggregated at the international level show that on-road transportation accounts for about three quarters of the total transportation GHG impact.1 Transportation in the EU represents about one quarter of its total GHG emissions. The EU's road transportation sector accounted for 71% of the total energy demand in transport in 2017,2 but unlike other sectors of the economy, in the transportation sector the average GHG emissions of new passenger cars increased from 2017 to 2019.3 Similarly, the U.S. transportation sector accounted for 26% of total U.S. energy consumption in 2020 (ref. 4) and was responsible for 29% of total U.S. GHG emissions in 2019.5 Alternative fuels and powertrain technologies, including biofuels and renewable natural gas for internal combustion engines (ICEs), hydrogen fuel cell electric vehicles (FCEVs), hybrid electric vehicles (HEVs), plug-in hybrid electric vehicles (PHEVs), and battery electric vehicles (BEVs), have been developed in the EU, the U.S., and globally as possible technology solutions to mitigate GHG emissions and reduce the fossil energy consumption of the road transportation sector.GHG emission and fuel consumption policies and regulations are in place to stimulate the development of vehicle technologies and a transition from petroleum-based transportation fuels to a portfolio of low-carbon alternative fuels. The U.S. corporate average fuel economy (CAFE) standards set fleet-level fuel economy targets for light-duty vehicles, aiming to drive automotive innovation to curtail fuel consumption and GHG emissions.6 The Energy Independence and Security Act of 2007 mandates and expands the renewable fuel standard (RFS) with a total volumetric requirement of 36 billion gallons of biofuels by 2022.7 The California Air Resources Board (CARB) implemented California's low carbon fuel standard (LCFS), which requires a reduction in the average carbon intensity of California's transportation fuel mix by 20% by 2030 (compared to the 2010 baseline).8 Other jurisdictions are joining California to enact state-wide low-carbon fuels programs. For example, Oregon's Clean Fuels Program requires a 10% reduction in average carbon intensity from 2015 levels by 2025 and sets standards for annual average carbon intensity for gasoline, diesel, and jet fuels and their alternatives from 2016 to 2025.9
In the EU, a primary driver to transform the road transport sector is to be found in the 2019 CO2 emissions standard regulation, which sets targets for the EU: fleet-wide average CO2 emissions from new passenger cars and vans registered in the EU will have to be 37.5% lower in 2030 than the 2021 limit (95 g CO2 per km).10 For new light-duty vans, the reduction target would be 31% lower by 2030 (compared to 147 g CO2 per km in 2021).11 A dedicated incentive mechanism aims to accelerate the market uptake of zero- and low-emission vehicles. Targets have been revised for further emissions reductions: 55% for cars, 50% for vans, and a fleetwide target of 100% emissions reduction for new vehicles by 2035 (compared to the 2021 target), in line with the EU's increased climate focus.10 The use of alternative fuels for road transport has significantly increased, thanks to two pieces of legislation: the Renewable Energy Directive (RED)12 and the Fuel Quality Directive (FQD).13 RED set targets for renewable energy consumption, including a sub-target mandating that 10% of energy used in transport be produced with renewable sources by 2020. The FQD set a GHG reduction target for fuel suppliers, requiring them to reduce the GHG intensity of the fuel mix by 6% within the same timeline. RED and FQD share a set of sustainability criteria defining the eligibility of renewable biofuels to count towards the respective targets. Both Directives were amended in 2015 to account for indirect land use change (ILUC) caused by the increased demand for biofuels, and both are today being revised in light of the new goals set by the European Green Deal.
The share of renewable energy used for transportation in the EU rose from 7.4% in 2017 to 8.1% in 2018,14 following the planned path toward the EU target of 10% set for 2020. The average GHG intensity of fuels consumed in 28 EU countries was 3.7% lower in 2018 than in 2010, with progress varying greatly across member states.15 The recast of RED (REDII) was adopted in December 2018, setting an overall EU target for renewable energy consumption by 2030. A sub-target for the transport sector calls for a minimum of 14% of the energy consumed in road and rail transport to be renewable by 2030.16 Within that 14% target, there is a gradually increasing sub-target for biofuels produced from waste and residue-based feedstocks, which can be double-counted towards the target. In order to limit some indirect effect on other sectors, some specific class of non-food/waste feedstock (e.g., used cooking oil and animal fat) are capped at 1.7% in 2030. Higher RED goals are consistent with the EU's European Climate Law, adopted on 28 June 2021, which sets the objective of a climate-neutral EU by 2050. The proposed revision of RED17 defines one overall GHG intensity reduction target for all transportation modes and two dedicated sub-targets to address advanced (waste- and residue-based) biofuels and renewable fuels of non-biological origin (e.g., hydrogen-based gaseous and liquid fuels) with no multiple counting.
The effective assessment of the transition to an energy-efficient, low-carbon, and clean road transportation sector, as intended by this regulatory framework, calls for the holistic evaluation of the GHG emissions of vehicle and energy-fuel systems. Life-cycle analysis (LCA) is a suitable way to accomplish this goal. The European Commission's Joint Research Centre (JRC) has recently published the updated version of its JEC analysis.18 JEC is a long-standing collaboration between JRC, the European Council for Automotive R&D (EUCAR) and Environmental Science for European Refining (Concawe). JEC regularly produces and updates a WTW analysis, focusing on energy use and GHG emissions, for a wide range of fuel and powertrain options, which are relevant in the EU context. The main aim of the JEC study is to provide science-based evidence for assessing the differences in WTW emissions between the use of an alternative fuel and vehicle and fossil fuels in ICE vehicles.
JEC Well-to-Wheels Report v5 (ref. 18) consists of a well-to-tank (WTT) section modeled in the E3 database,19 which reports the energy demand and the related emissions of producing, transporting, manufacturing, and distributing a range of fuels suitable for road transportation powertrains, and a tank-to-wheels (TTW) section, which predicts in-vehicle energy consumption (performance) and the related emissions of a vehicle concept using the AVL Cruise™ simulation tool.20 The input data used for the JEC WTT analysis provide the reference values for EU legislation on renewable fuels.
The Greenhouse Gases, Regulated Emissions, and Energy Use in Technologies (GREET®) model is an LCA tool that examines the WTW impacts of vehicle technologies, fuels, and energy systems, as well as the life cycle of vehicle production, use, and recycling/disposal.21 GREET calculates energy consumption and GHG emissions, among other environmental impact metrics, for a variety of powertrain and fuel combinations. GREET is widely used for LCA of transportation fuels and vehicle technologies, including those by regulatory agencies. For example, CARB's LCFS program has used a version of GREET (CA-GREET) to estimate GHG emissions of fuel pathways for LCFS compliance by fuel providers.22 The U.S. Environmental Protection Agency has used GREET for its RFS program7 and vehicle GHG standards development.23 The Fuels Working Group of the International Civil Aviation Organization (ICAO) has been using GREET to develop carbon intensities of a variety of sustainable aviation fuels for ICAO's Carbon Offsetting and Reduction Scheme.24
This paper aims to compare the methodology, datasets, and resulting outputs used to compute the WTW GHG values for a wide set of fuel production pathways and fuel–vehicle systems, including both conventional and alternative fuels, for different powertrains for light-duty vehicles. Analysis in this paper addresses the decarbonization potential of alternative fuel–vehicle systems in the U.S. and the EU. For this comparison, we first present primary data, key methodological assumptions, and WTW results of the JEC and GREET studies. Second, we assess and discuss commonalities and specific elements in both studies regarding data and key drivers of relevance to the WTW GHG emissions of main road light-duty vehicle fuel pathways and powertrain technologies for the U.S. and EU. Despite differences related to parametric assumptions and methodological approaches, the results highlight promising fuel pathways and powertrain options for reducing the GHG impact of light-duty vehicles in both regions.
2 Methodology
2.1 Well-to-wheels approach
The GHG emissions for a given fuel used in a specific powertrain can be assessed on a WTW basis. The WTW methodology is grounded on the LCA approach, with a clearly defined system boundary and a specific impact category, i.e., GHG emissions, expressed in g CO2e/MJ.‡Fig. 1 illustrates the system boundary of the WTW vehicle–fuel system analyses. Note that vehicle manufacturing emissions are not included due to differences in vehicle size and configurations in the U.S. and EU, as shown in Table 2.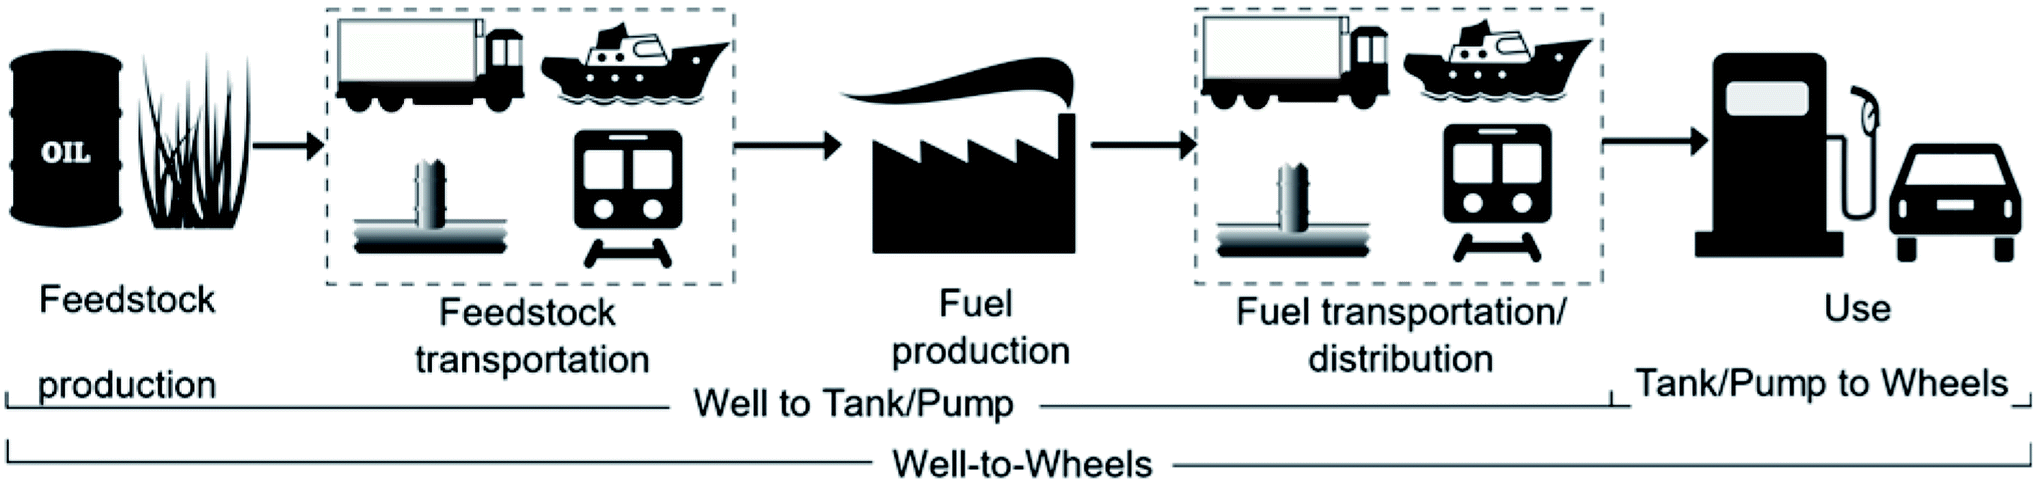 | ||
| Fig. 1 System boundary of WTW analysis of fuel–vehicle systems in the JEC study and GREET model. | ||
JEC WTW (based on an E3 database as well as other vehicle simulators) and GREET are two WTW LCA tools for modeling fuel production pathways and fuel use in different powertrains. They are created on the same conceptual framework—grounded in the LCA methodology per ISO 14040-2006 (ref. 26)—but differ in some specific areas, because localized data are generally developed for the best representation of activities involved in the WTW system boundary for a given fuel and vehicle powertrain technology.
Both the JEC study and GREET model start with the fuel pathway to simulate the fuel production and distribution, or well-to-tank or -pump activities, based on per MJ of fuel produced and used, which includes both the production and transportation of the feedstock to a downstream conversion facility where the finished fuel is produced. The difference between the GREET well-to-pump (WTP) analysis and the JEC WTT analysis is that the former excludes emissions of fugitive volatile organic compounds (VOCs) that might occur during refueling. The impact of ignoring potential VOC emissions on the WTW GHG emissions is negligible.§
In the WTW analysis, both tools consider vehicle fuel efficiency differences among vehicle powertrain technologies using different alternative fuels. The emissions results of fuel–vehicle systems are presented as per distance driven by the given vehicle powertrain. Thus, the difference between fuel pathway results per MJ of fuel and fuel–vehicle system results per distance driven indicates the inclusion of vehicle fuel efficiency in the latter.
2.2 JEC WTW study
The JEC WTW study aims to assess incremental emissions associated with the production of an alternative fuel compared with the current fuel production. Part of the WTW study, the WTT element, estimates GHG emissions related to the production of fossil and bio-derived fuel up to when it enters the tank of the vehicle. The JEC study aims to be forward-looking and considers state-of-the-art technologies for both fuel production pathways and light-duty vehicles to support future choices about, for example, R&D and/or policy development.One characteristic of the JEC study is that a marginal approach is used to allocate energy use and GHG emissions for conventional fossil fuel pathways. The marginal approach describes the effects, expressed in GHG emissions, of a change in current production induced by a change in the demand or supply for a specific product. The marginal approach in the JEC study enables consideration of shifting balances between conventional and alternative fuels, such as reduced demand for fossil fuels and a consequent increased demand for alternative fuels, to be considered. The marginal approach describes how production supply chains are affected and what the effects in terms of GHG emissions are: resulting incremental emissions (either positive or negative) are calculated based on the fossil baseline. The marginal approach was chosen to be instrumental in guiding judgments and decisions about replacing conventional fuels and vehicles with a set of possible alternatives. For fuels that are entering the market, this approach allows us to better understand and trace where the additional energy resources would come from and their impact on potential GHG intensity reductions.
Data needed to apply the marginal approach are not always available. In version 5 of the JEC study (JEC v5), the marginal approach has been applied to the refining of fossil crude oil to produce petroleum products27 and to natural gas-based and biofuel pathways, and average emissions have been estimated as a proxy for EU electricity and crop cultivation, mainly due to limited availability of good-quality data. Specifically, for petroleum refinery emissions, the ISO-14044 LCA guidelines have been followed, and marginal emissions associated with each finished fuel product were estimated. Concawe has used its petroleum refinery model, representative of EU refinery configurations, to produce a consistent set of GHG intensities for all refinery products. The Concawe methodology is based on a linear programming (LP) technique.28
For co-product allocation in biomass-derived pathways, the system expansion approach has been used. The boundaries of the analysis are extended to cover alternative production routes of co-products. According to the International Reference Life Cycle Data System (ILCD) handbook,29 all energy and emissions generated by a process are allocated to the main or desired product of that process. A co-product generates an energy and emission credit equal to the energy and emissions avoided by not producing the material that the co-product is most likely to displace. This is also the displacement method used in LCA.
It is worth noting that, for fuels of a biomass origin, GHG emissions do not include emissions caused by land use change (LUC)—either direct or indirect LUC (DLUC and ILUC)—mainly due to the high variability and uncertainties in the estimated values.
2.3 GREET
The GREET LCA system boundary is from the well to the wheels of the vehicle–fuel system, which includes recovery, production, processing, and transportation of feedstock and fuel production, plus transportation, distribution, and combustion during vehicle operation. GREET also includes the “vehicle cycle,” including material mining, vehicle production, vehicle use, and vehicle recycling/disposal. Together, the WTW analysis and the vehicle cycle analysis in GREET are often called cradle-to-grave (C2G) analysis.The GREET model calculates carbon dioxide (CO2) emissions from fuel combustion on a carbon mass balance basis. Non-combustion CO2 equivalent emissions, such as fugitive methane emissions from oil fields and LUC GHG emissions of biofuels, are considered separately in GREET. For a given vehicle–fuel system, the GREET LCA applies a bottom-up, combustion-technology-based approach to estimating the WTW emissions of each life-cycle stage per kilometer (km) driven, using eqn (1).
 | (1) |
2.4 Models comparison
For a comprehensive comparison of similar fuel–vehicle systems considered in the JEC WTW study and GREET modeling, we focused on comparing key data sources and assumptions as well as issues related to LCA methodology, especially co-product handling methods and carbon accounting methods, timeframe and technology representation, and vehicle sizes and fuel efficiencies.A medium-sized light-duty passenger vehicle was used in both the JEC WTW study (C-segment cars) and GREET WTW modeling (mid-size cars), given that it has been and will likely remain the most dominant segment of light-duty vehicles in both the EU and U.S. markets.
Table 1 shows the selected finished fuels produced from different feedstocks and conversion technologies for mid-sized internal combustion engine vehicles (ICEVs), fuel cell electric vehicles (FCEVs) and battery electric vehicles (BEVs). For the same finished fuel, the feedstock used may vary in the EU and the United States to reflect its market share in each market.
| Vehicle powertrain | Fuel type | GREET fuel pathway (blended fuels for vehicles) | JEC v5 fuel pathway (blended fuels for vehicles) |
|---|---|---|---|
| a FAME is commonly known as biodiesel in the United States. b Renewable diesel and hydrotreated vegetable oil are both drop-in hydrocarbon fuels. c When natural gas is produced from manure, municipal solid waste (MSW) or sewage, GREET refers to it as renewable natural gas (RNG) whereas JEC uses (compressed) biomethane (C)BM. Both terminology refers to the same treated “biogas” ready for its use in transport. d The basis for the estimate of the 2030 EU mix is reported in the JEC v5 report. As a reference, the EU-mix natural gas supply also includes 18.9% LNG and 3.4% bio-CH4 (40% of the bio-CH4 is derived from organic waste, 20% from manure, and 40% from energy crops). Pure fossil CNG is included in the WTW comparison. | |||
| Mid-sized ICEV | Petroleum gasoline | Petroleum gasoline blendstock (E10) | Petroleum gasoline blendstock (E10) |
| Petroleum diesel | Petroleum diesel (petroleum diesel) | Petroleum diesel (petroleum diesel) | |
| Ethanol | Corn ethanol (E85) | Imported U.S. corn ethanol (E100) | |
| Corn stover ethanol (E85) | Wheat straw ethanol (E100) | ||
| Sugarcane ethanol (E85) | Sugar beet ethanol (E100) | ||
| Fatty acid methyl esters (FAME)/biodiesela | Domestic soybean FAME (B7) | Imported soybean FAME | |
| Canola FAME | Rapeseed FAME | ||
| UCO FAME | UCO FAME | ||
| Tallow FAME | Tallow FAME | ||
| FAME (B7, EU mix) | |||
| Hydrotreated vegetable oils (HVO)/renewable diesel (RD)b | Canola RD (RD100) | Rapeseed HVO (HVO100) | |
| UCO RD (RD100) | UCO HVO (HVO100) | ||
| Soybean RD (RD100) | Soybean HVO (HVO100) | ||
| Renewable diesel via thermochemical conversion | Forest residue FT RD (RD100) | Wood residues FT RD (RD100) | |
| Forest residue fast pyrolysis RD (RD100) | Wood residues fast pyrolysis RD (RD100) | ||
| Mid-sized ICEV | CNG/renewable natural gas (RNG) compressed biomethane (CBM)c | Fossil CNG (CNG) | Fossil CNG (CNG)d |
| Manure AD RNG (RNG) | Manure compressed biomethane (CBM) | ||
| Municipal solid waste (MSW) AD RNG (RNG) | MSW CBM CD (CBM) | ||
| Sewage sludge AD RNG (RNG) | Sewage sludge CD CBM (CBM) | ||
| Mid-sized FCEV | Hydrogen | H2via NG SMR, without CCS (H2) | H2via NG SMR, without CCS (H2) |
| H2via NG SMR, with CCS (H2) | H2via NG SMR, with CCS (H2) | ||
| H2via electrolysis with U.S. average electricity (H2) | H2via electrolysis with EU electricity mix (H2) | ||
| H2via electrolysis with renewable electricity (H2) | H2via electrolysis with renewable electricity (H2) | ||
| Mid-sized BEV | Electricity | U.S. average grid | EU mix (2030)—low voltage |
| U.S. renewable grid | Wind electricity—low voltage | ||
In the GREET study, uncertainties of major parametric assumptions are characterized and summarized in the ESI.† Rigorous Monte Carlo simulations are conducted to estimate the range of uncertainties in the GHG emissions of the fuel–vehicle systems. In the JEC analysis, the uncertainties were assessed but not reported quantitatively. This was mostly related to the broad range of dataset used, and the different ways to address the subject. The uncertainty was reduced by an expert choice of the most reliable input data. Moreover, due to the complexity of reporting the results for the large number of fuel and powertrain systems analyzed, it was decided to prioritize the information about the variability connected to the use of different feedstocks, for a certain class of fuel, and avoid adding another layer of complexity and uncertainty.
Demand for crop-based biofuels may encourage cropland expansion and can therefore cause GHG emissions due to consequent Land Use Change. These indirect impacts, which could occur beyond the regions producing biofuels, are referred as Direct and Indirect LUC emissions. Existing literature shows important disparities among models in the baseline assumptions, shock size, simulation approach, and the data used in calculating emissions, therefore resulting in estimated LUC emissions affected by high uncertainties and falling in a broad range. However, to highlight the potential impact of these effect, we here report some examples. In the U.S., corn starch ethanol and soybean biodiesel are two major biofuels widely adopted in the U.S. transportation sector. The GREET modeling suggests that the total LUC GHG emissions for corn ethanol range from 2.1 to 9.3 g CO2e/MJ,37 compared to about 52 g CO2e/MJ when the LUC emissions are excluded, whereas the LUC GHG emissions for soybean biodiesel range from 4.3 to 10.0 g CO2e/MJ,38 compared to about 35 g CO2e/MJ when the LUC GHG emissions are excluded.
A recent and relevant exercise, considering the ILUC is the International Civil Aviation Organization – Carbon Offsetting and Reduction Scheme for Aviation (CORSIA). Even if CORSIA refers to aviation fuels, the conclusions we can derive for the ILUC issue are not significantly impacted, as the main feedstocks are common with the road alternative fuels productions. According to Prussi et al.,39 who estimated ILUC values for 14 of the technological pathways, the impact of ILUC can range from zero, when waste streams such as UCO are used, to very high figures for specific feedstock such as palm oil: 39.1 g CO2e/MJ of ILUC over a total emissions of 76.5 g CO2e/MJ of palm oil-derived final fuel. However, the conclusions from the authors suggest that many feedstocks and technologies can offer GHG saving when compared to the petroleum-derived baseline and that considering indirect effects may even lead to negative ILUC values for some biofuel pathways. For example, Prussi et al.39 estimated that miscanthus-derived finished fuel could have an ILUC value of −31.0 g CO2e/MJ over a total emission of 12.4 g CO2e/MJ.
| Fuel/technology | GREET (2030) | JEC (2025+) | |
|---|---|---|---|
| a BEV with an all-electric range of 161 km and 200 km in GREET and JEC v5 studies, respectively. b BEV with an all-electric range of 483 km and 400 km in GREET and JEC v5 studies, respectively. | |||
| Gasoline ICEV (E10 baseline) | Fuel type | E10 | E10 |
| Vehicle weight (kg) | 1444 | 1200 | |
| Fuel consumption (MJ/100 km) | 218.0 | 140.7 | |
| Diesel ICEV | Fuel type | Diesel | |
| Additional weight compared to baseline (kg) | 0 | 60 | |
| Percentage change in fuel consumption compared to baseline | −9% | −8% | |
| FFV (E85) | Fuel type | E85 | |
| Additional weight relative to baseline (kg) | 0 | NA | |
| Percentage change in fuel consumption compared to baseline | 0% | ||
| Biodiesel ICEV (B7) | Fuel type | B7 | |
| Additional weight relative to baseline (kg) | 0 | 60 | |
| Percentage change in fuel consumption compared to baseline | −9% | −8% | |
| Renewable diesel ICEV | Fuel type | Renewable diesel (HVO 100) | |
| Additional weight relative to baseline (kg) | 0 | 60 | |
| Percentage change in fuel consumption compared to baseline | −9% | −8% | |
| FT diesel ICEV | Fuel type | FT diesel | |
| Additional weight relative to baseline (kg) | 0 | 60 | |
| Percentage change in fuel consumption compared to baseline | −9% | −8% | |
| CNGV ICEV | Fuel type | CNG | |
| Additional weight relative to baseline (kg) | 209 | 27 | |
| Percentage change in fuel consumption compared to baseline | −5% | −2% | |
| H2 FCEV | Fuel type | Hydrogen | |
| Additional weight relative to baseline (kg) | 209 | 97 | |
| Percentage change in fuel consumption compared to baseline | −56% | −50% | |
| BEV (161/200)a | Fuel type | Electricity | |
| Additional weight relative to baseline (kg) | 0 | 8 | |
| Percentage change in fuel consumption compared to baseline | −71% | −70% | |
| BEV (483/400)b | Fuel type | Electricity | |
| Additional weight relative to baseline (kg) | 298 | 162 | |
| Percentage change in fuel consumption compared to baseline | −69% | −68% | |
3 Results
In this paper, we compare WTT and combustion GHG emissions per MJ of fuel produced and used in various fuel production pathways, as shown in Fig. 2. We also compared WTW GHG emissions per kilometer (km) of vehicle driven for various fuel–vehicle systems, as shown in Fig. 3.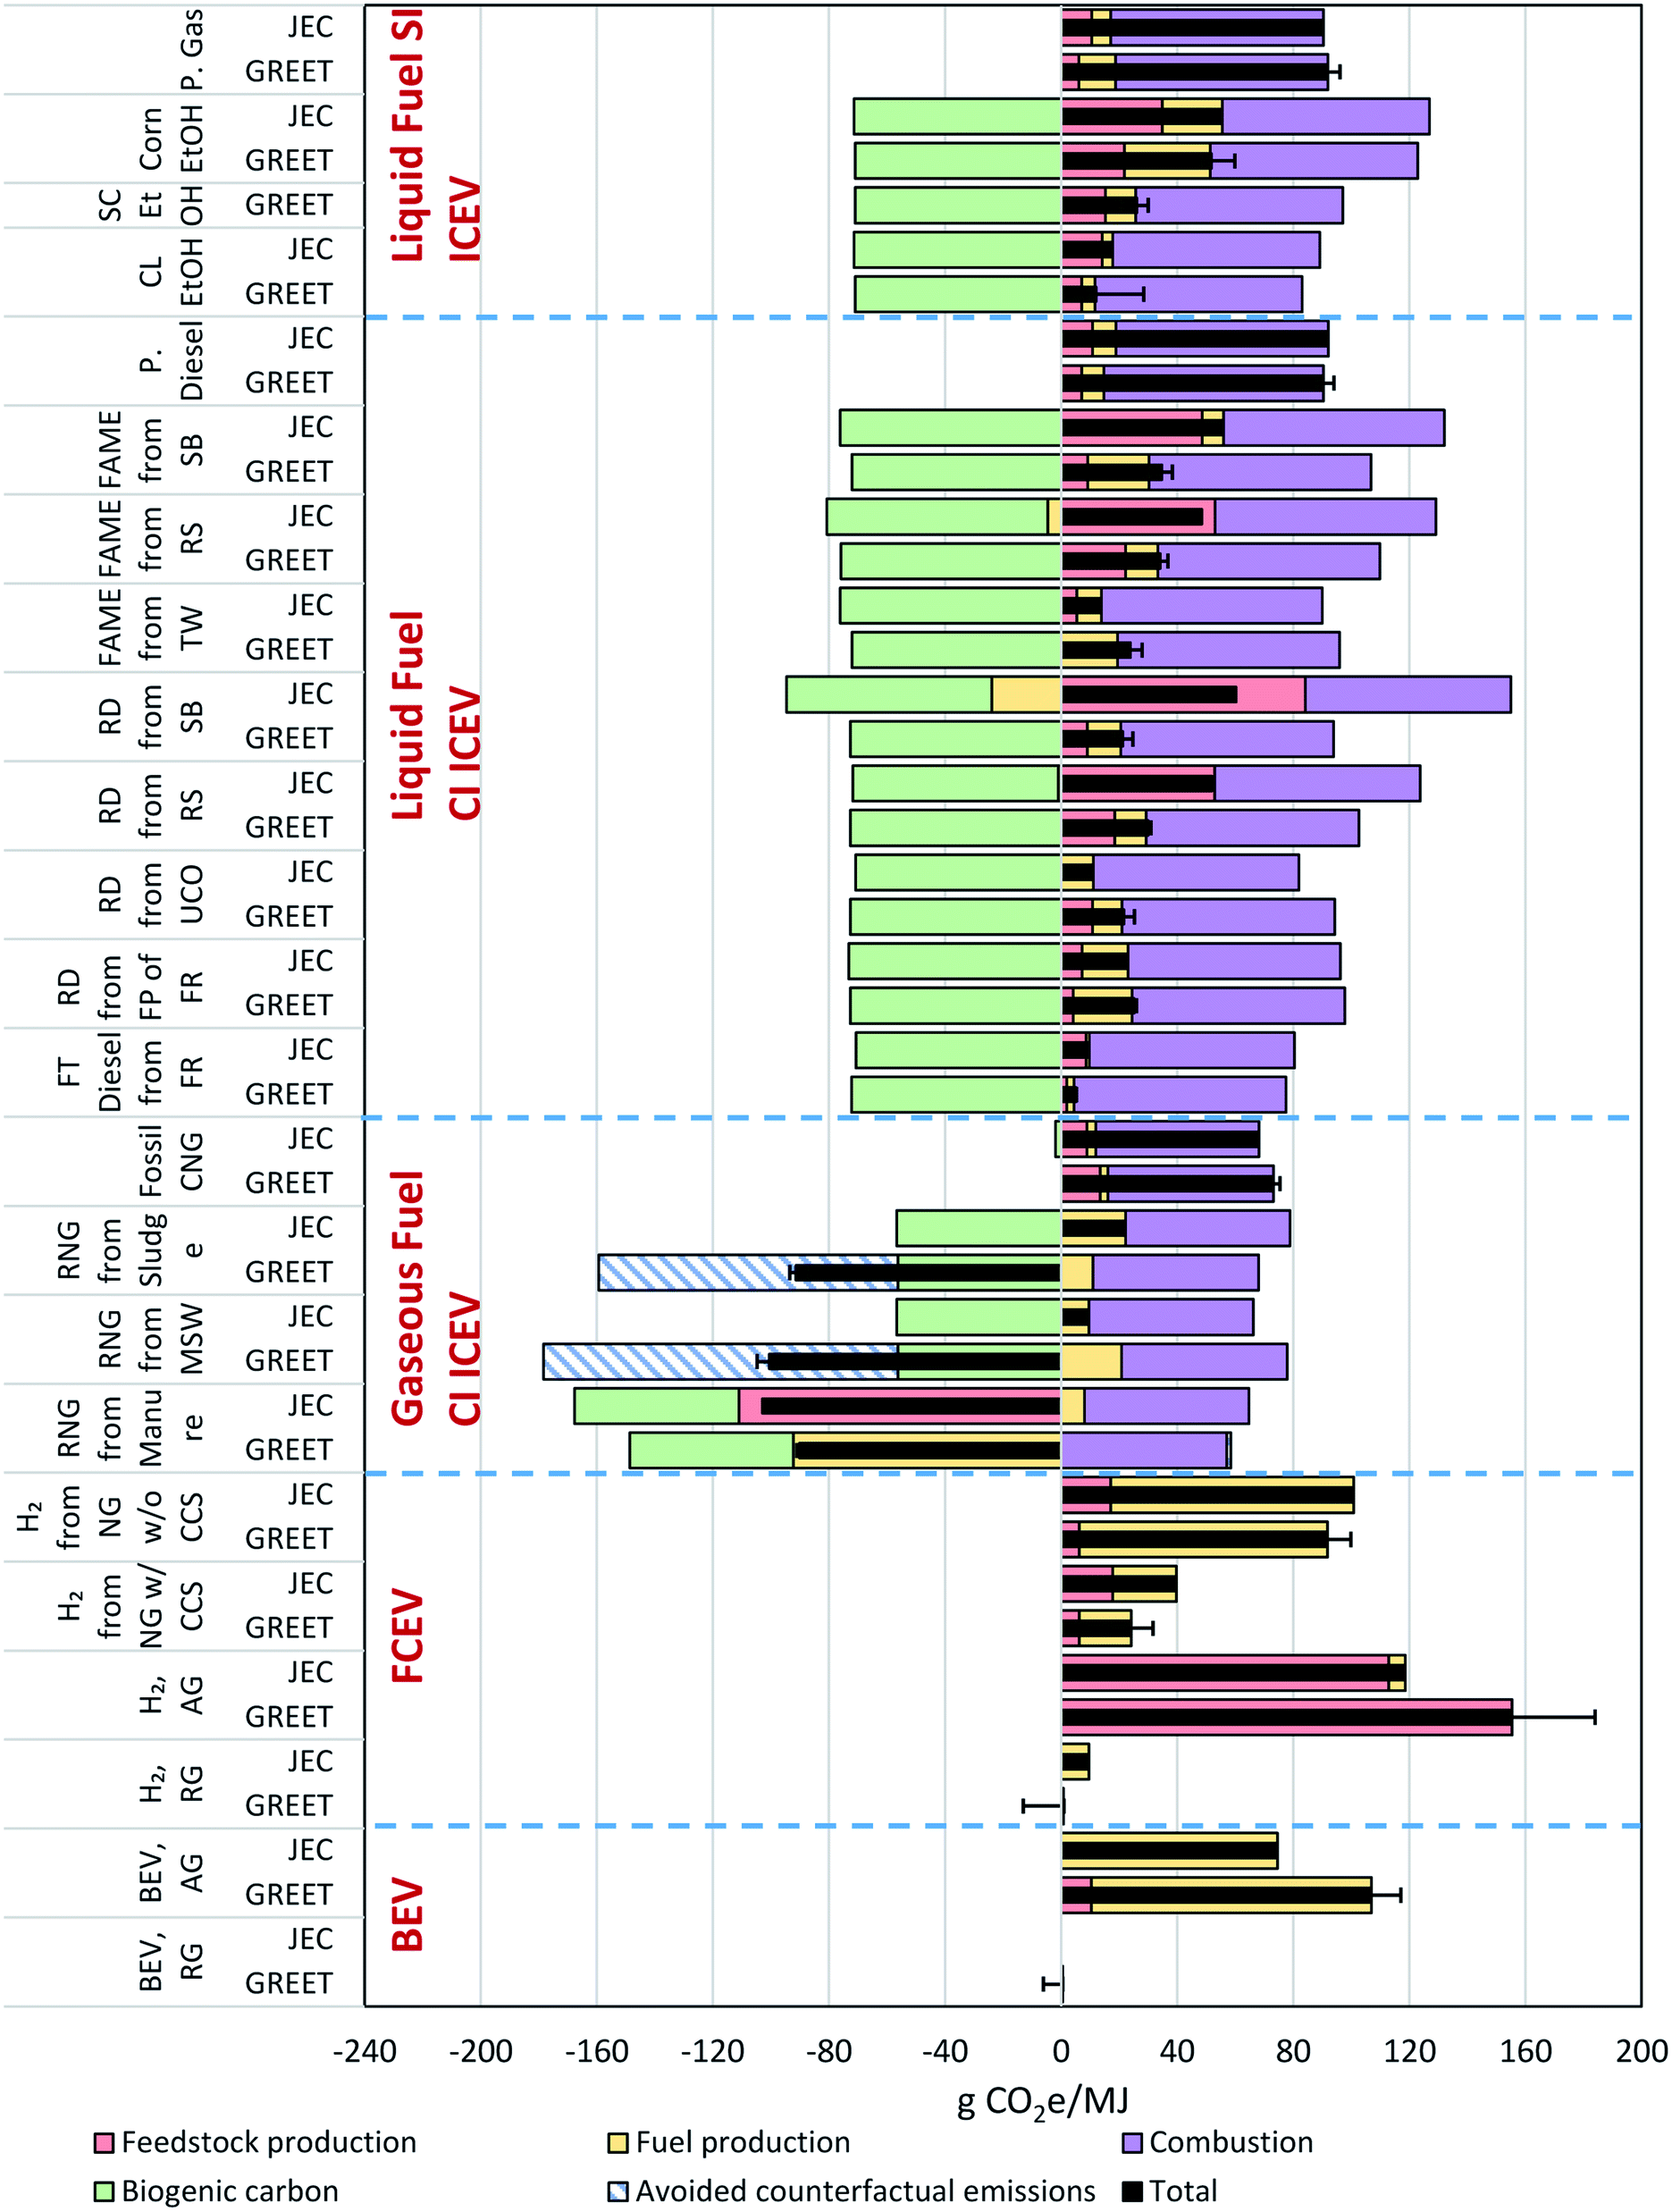 | ||
| Fig. 2 Comparison of (a) per MJ WTT and combustion results of various fuel production pathways for light-duty powertrains from GREET and JEC modeling. SI: spark ignition; CI: compression ignition; ICEV: internal combustion engine vehicle; FCEV: fuel cell electric vehicle; BEV: battery electric vehicle; P.gas: petroleum gasoline; CL: cellulosic; FAME: fatty acid methyl ester; FT: Fischer–Tropsch; FP: fast pyrolysis; FR: forest residue; RD: renewable diesel; UCO: used cooking oil; SB: soybean; TW: tallow; RNG: renewable natural gas (biomethane); MSW: municipal solid waste; RG: renewable electricity grid mix, AG: U.S./EU average electricity grid mix; CCS: carbon capture and storage. | ||
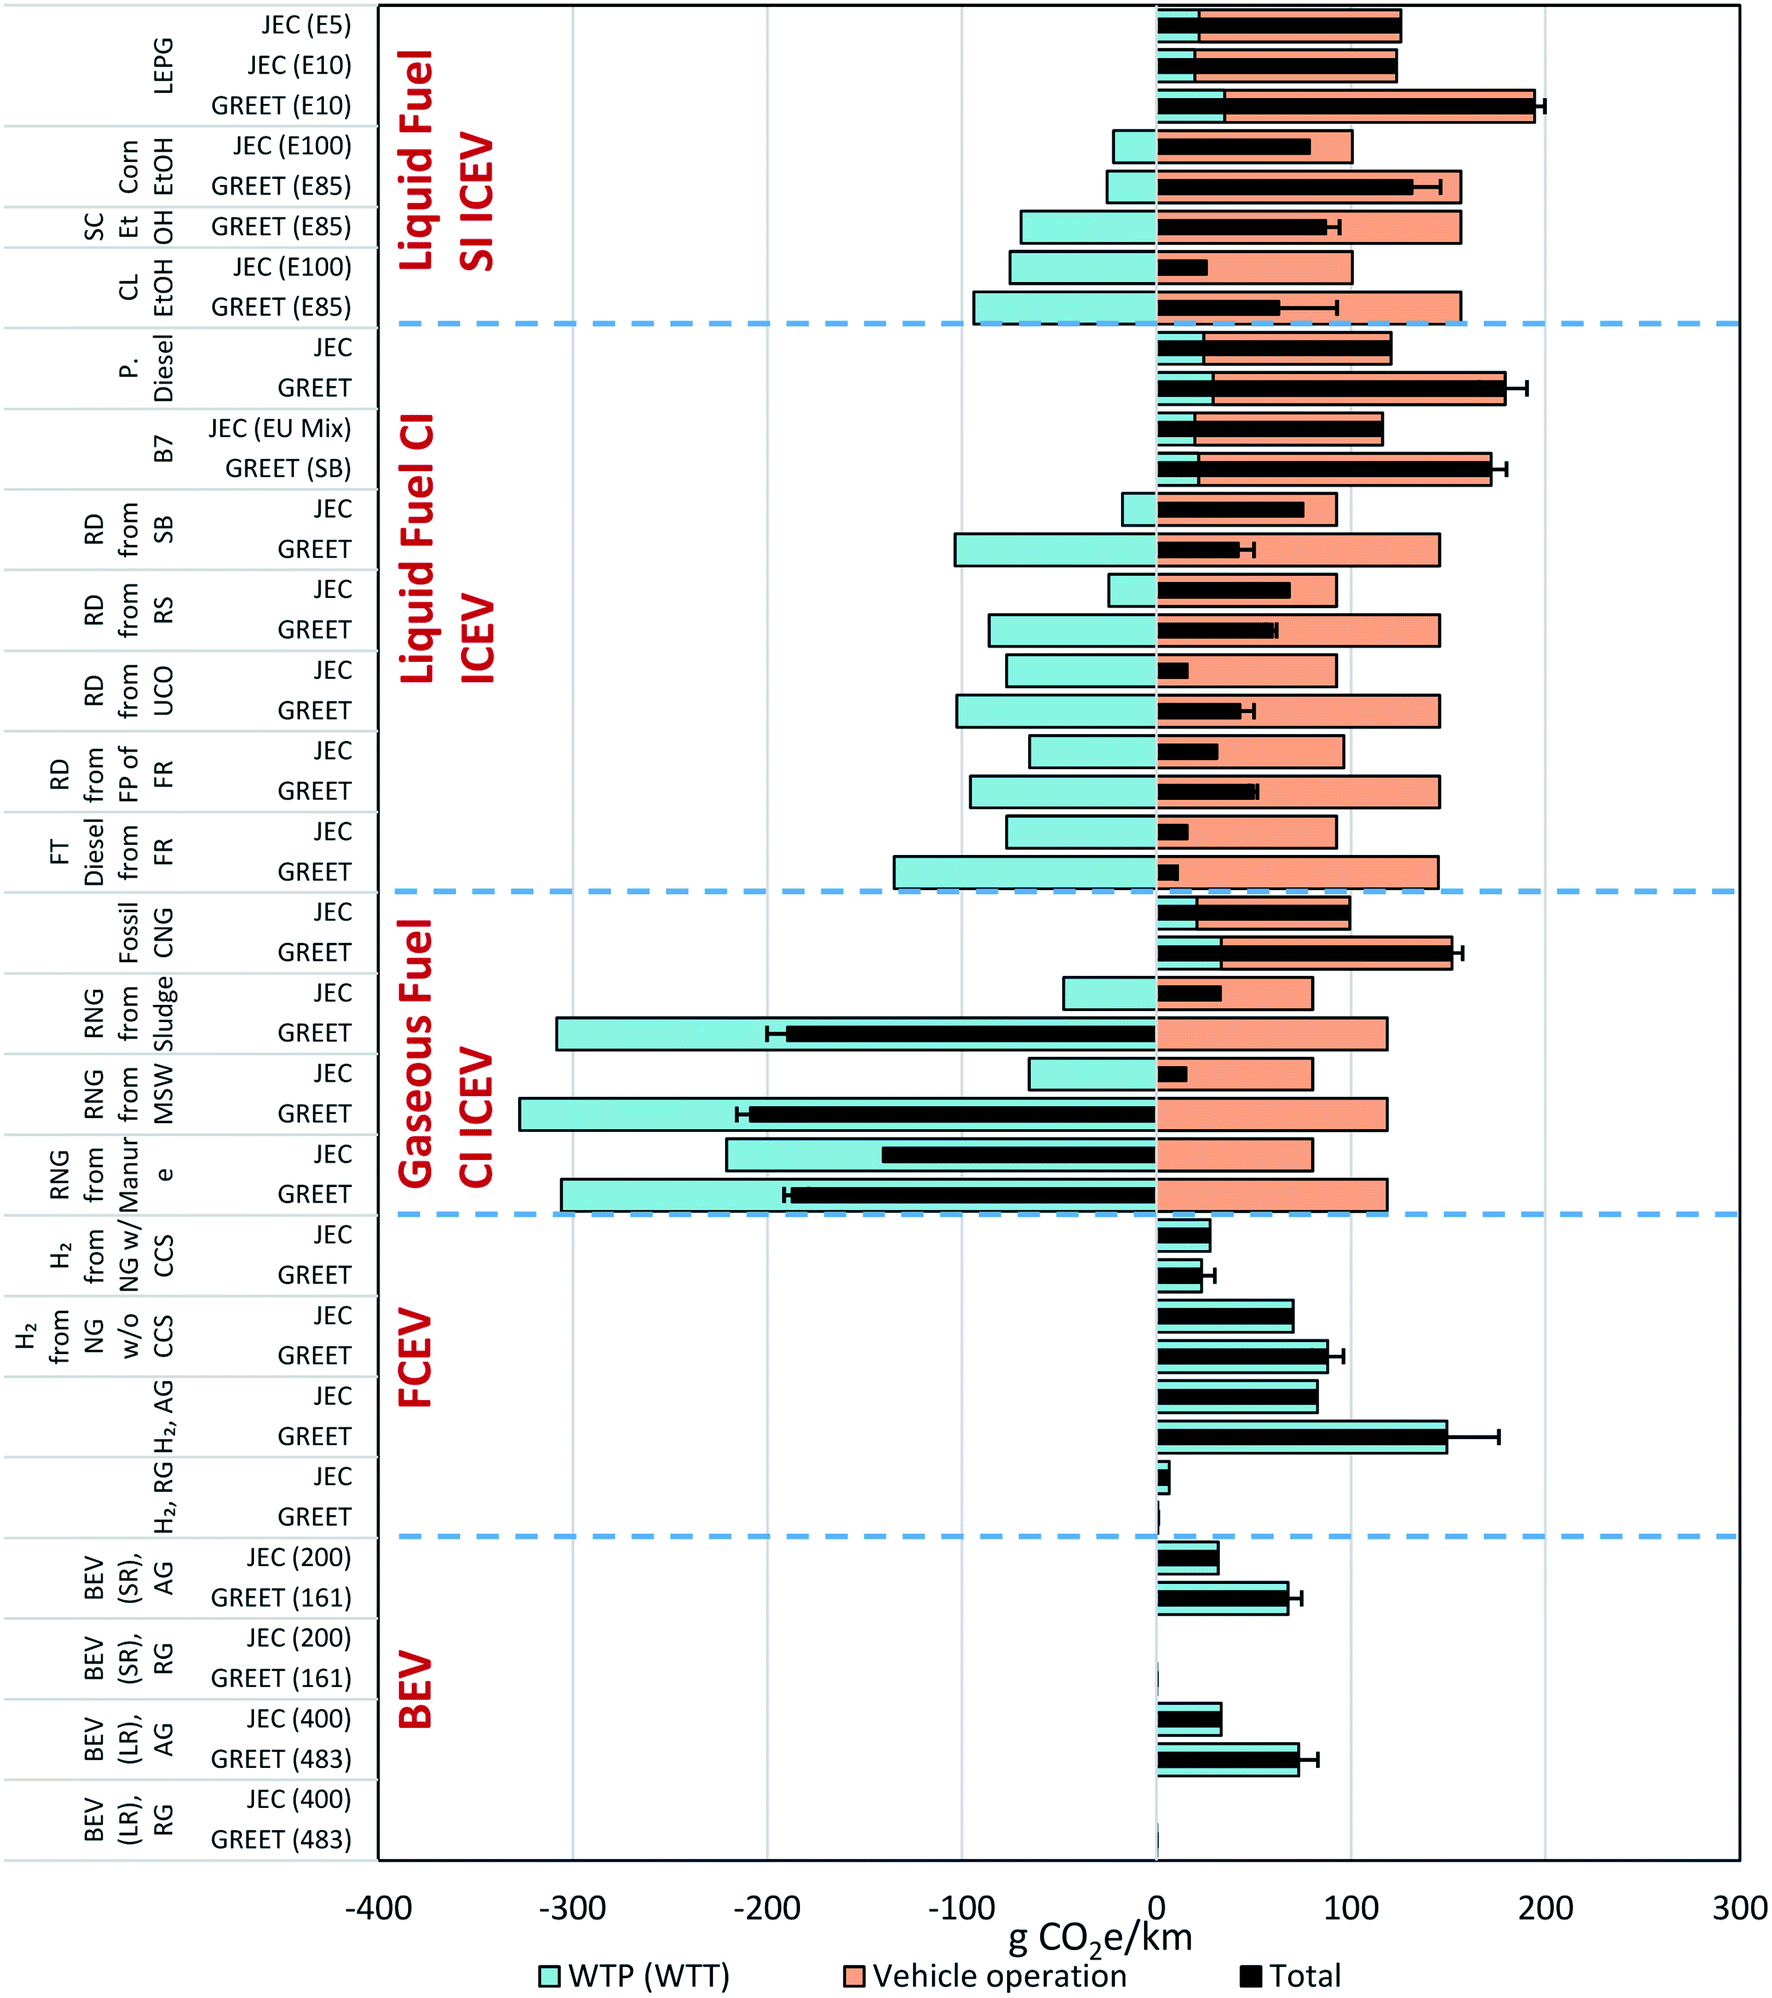 | ||
| Fig. 3 Comparison of per km WTW results of various light-duty fuel and vehicle systems from GREET and JEC modeling. Key: SI: spark ignition; CI: compression ignition; ICEV: internal combustion engine vehicles; FCEV: fuel cell electric vehicles; BEV: battery electric vehicles; LEPG: low-ethanol petroleum gasoline; CL: cellulosic; FAME: fatty acid methyl ester; E100: pure ethanol; E10: a mixture of 10% ethanol and 90% gasoline; E85: a mixture of 85% ethanol and 15% gasoline FT: Fischer–Tropsch; FP: fast pyrolysis; FR: forest residue; RD: renewable diesel; UCO: used cooking oil; SB: soybean; B7: a mixture of 7% FAME and 93% diesel; P. diesel: petroleum diesel; CNG: compressed natural gas; MSW: municipal solid waste; RG: renewable electricity grid mix, AG: U.S./EU average electricity grid mix;; LR: long range; SR: short range; CCS: carbon capture and storage. | ||
3.1 Per MJ WTT and combustion emissions results of baseline and alternative fuel pathways
For the baseline petroleum gasoline blendstock (100% fossil), the per MJ WTT and combustion GHG emissions of the two analyses are close (see Fig. 2). The crude oil recovery stage presents a lower GHG emission intensity for the U.S. petroleum fuels than that of its EU counterpart, given differences in crude sources,46 crude oil recovery efficiencies and associated flaring/fugitive emissions,47–50 and transportation logistics within both regions. However, petroleum refining processes are more energy-intensive, and thus GHG emission-intensive, for U.S. petroleum gasoline fuel production than EU operations.51 U.S. petroleum refineries are more complex and consume more energy to increase yields of fuel product (such as gasoline), resulting in higher carbon intensities of petroleum fuels than at EU counterparts. In addition, both the GREET and the JEC results for petroleum products are modeled with an energy-based process-level allocation method, but GREET takes an attributional LCA approach, which differs from the marginal approach in the JEC study. The fuel combustion phase results in similar GHG emissions given similar fuel carbon content per heating value for the gasoline fuels, despite differences in other fuel quality specifications such as sulfur content.52,53 See Table S1 in the ESI† for a comparison of key parametric assumptions of petroleum crude recovery and petroleum refining to produce gasoline and diesel fuels.The JEC marginal approach aims at identifying the consequences that a decision in the foreground system has for other processes and systems, both in the analyzed system's background system and on other systems. It models the analyzed system around these consequences. The results with this approach hence do not reflect the actual (or forecasted) specific or average supply-chain, but those of a hypothetic generic supply-chain that is prognosticated along market-mechanisms, and potentially including political interactions and consumer behavior changes.
For petroleum diesel, the JEC estimate of the overall per MJ WTT and combustion GHG emissions is slightly higher than GREET's, mostly due to about 4 g CO2e/MJ higher crude oil recovery emissions in the JEC estimate. As with petroleum gasoline, the difference can be attributed to different crude sources, recovery technologies, and logistics (see Table S1†). JEC modeled production of the crude oil from the oil reservoir and processing in Europe; the GHG intensities of the crude oils are based on the Oil Production GHG Emissions Estimator (OPGEE) model.54 Despite the methodological differences in calculating the refining GHG emissions as mentioned above, the JEC and GREET estimates at the refining step are close. The fuel combustion phase results in slightly higher GHG emissions in the GREET estimate, owing to slightly higher fuel carbon content per heating value for the diesel fuels. See the discussion of crude oil production in the ESI† for a comparison of key parametric assumptions of the U.S. and EU petroleum gasoline and petroleum diesel pathways.
The WTT and combustion carbon intensity of U.S. corn ethanol is comparable to that of its EU counterpart. Some differences occur in the production step, mainly due to slightly different assumptions about the energy input for the process and different allocation criteria for the co-products. The feedstock production step for corn ethanol and biofuel production in general considers different climatic and cultivation practices that require different levels of fertilizer inputs in the EU and United States. In addition, the GREET study analyzes sugarcane ethanol that is produced in Brazil and imported to the U.S.55 and shows a WTT and combustion carbon intensity of 26 g CO2e/MJ. For biofuels, both JEC and GREET assumed carbon neutrality for the carbon cycle of biogenic carbon uptake during biomass growth and biogenic carbon release from combustion of the fuel. See detailed parametric assumptions for corn farming and biochemical conversion of corn to ethanol in Table S4 of the ESI.† It is worth noting that CCS can be applied to corn ethanol fermentation plants to achieve additional GHG emission reduction. In the U.S., the GREET analysis shows that the corn ethanol carbon intensity could decrease from about 54 to 24 g CO2e/MJ.56
FAME in the United States is primarily produced from soybeans. On average, petroleum diesel fuel is blended with 7% FAME by volume (B7, which is market grade in the EU). A 20% blending level of FAME (B20) is the most common blend with elevated biodiesel content (>5%) in the U.S. market for conventional diesel engines. GREET per MJ WTT and combustion GHG emissions of U.S. soybean FAME are about 40% lower than the JEC estimate. In the U.S., soybean production and transportation to soybean mills and FAME production plants account for about 9 g CO2e/MJ, but the emissions at these steps are about 49 g CO2e/MJ in the EU. The feedstock transportation step is significant in the EU, as soybeans for FAME production in the EU are largely imported. The different allocation methods that address soybean meal as a co-product during the soy oil extraction step, and the production of glycerin as another co-product during the transesterification process that produces FAME, led to the difference in emissions, given the significant output of co-products, especially soybean meal, in this pathway. At the biorefinery stage, the GREET estimate is about 23 g CO2e/MJ, compared to JEC's 7 g CO2e/MJ for FAME production. As discussed previously,57 different co-product handling methods could greatly change the carbon intensities of the conversion and overall WTT and combustion GHG emissions of soybean FAME. GREET applied a mass-based allocation method to address the soybean meal effect at the soybean oil extraction step and a market value-based allocation method to address the glycerin effect during the transesterification process to produce FAME numbers, while JEC applies a displacement method to address the co-product effects of both soybean meal and glycerin. The displacement credits from soy meal, estimated as −32.3 g CO2e/MJ in JEC, are responsible for the main differences between the pathways. It is worth stressing that in JEC, when the displacement method cannot be applied due to the lack of reliable values, energy allocation is deemed the preferred alternative.
Canola oil, called rapeseed oil in the EU, is commonly used for FAME production in the United States. U.S. canola FAME has a WTT and combustion GHG emission intensity of 34 g CO2e/MJ, of which feedstock production, requiring fertilizers, pesticides, and farming energy,58 contributes about 67% of the emissions, and the transesterification conversion of canola oil to FAME contributes most of the remaining emissions. The JEC WTT and combustion estimate for rapeseed FAME is 48 g CO2e/MJ. It is higher than the GREET result for reasons similar to those discussed for soybean FAME.
Inedible tallow is another feedstock for FAME production in both the U.S. and EU. Its production in the U.S. is mostly driven by the LCFS carbon credit, which is currently priced at about $175–$200/ton of CO2 reduction.59 GREET estimates of tallow FAME suggest a higher emissions burden for fuel production than the JEC estimate. Although beef fat is considered a burden-free by-product from cattle slaughtering houses, both GREET and JEC assume that it needs to undergo a rendering process to remove impurities before it can be converted to FAME via transesterification.
As an alternative to the transesterification process to produce FAME, hydrotreated vegetable oil (HVO) routes are being deployed in the U.S. and Europe. In this pathway, the pure oil from a wide range of feedstocks can be directly hydrotreated. This removes double bonds and oxygen from the molecule, yielding a paraffinic fuel similar in properties to FT diesel that can be used either alone or blended into conventional diesel, and the final fuel properties are virtually independent of the original feedstock.
JEC v5 explores different HVO routes from a variety of oils from different seeds and waste materials (e.g., UCO and tallow). For simplification purposes, and because WTT values are quite similar to the equivalent FAME ones when the same feedstocks are used, only FAME pathways are presented in this paper for comparative purposes (the main difference between the two is the maximum allowed blend percentage of each diesel-like component in the final fuel, which could be higher for the HVO case, considered as a drop-in fuel, whereas FAME is subject to a blending wall).
Another pathway to producing renewable diesel is via fast pyrolysis (FP) of biomass. FP converts biomass to a liquid product known as bio-oil in high temperatures in an oxygen-deficient environment. The bio-oil is then hydrotreated to produce gasoline- and diesel-range fuels. Like HVO, this pyrolysis-based diesel can be used either alone or blended into conventional diesel.
GREET estimates UCO-derived RD to have a low carbon intensity of about 11 g CO2e/MJ when the feedstock is considered burden-free and is converted to RD via hydroprocessing. The emissions are primarily attributable to the conversion process, which consumes process energy and catalysts.60 When the UCO-derived HVO (RD) route is assessed in JEC, a similar value of 11.1 g CO2e/MJ is obtained. Again UCO is considered a waste material, and 90% of the emissions are produced during the hydrotreatment process. For other crop-derived HVO (RD), such as soybean oil, the same differences in feedstock production and co-product handling approaches that drove the differences for FAME explain the differences for HVO fuel results in GREET and JEC. WTT and combustion GHG emissions of FT diesel from forest residues are estimated to come primarily from feedstock collection and transportation to the FT biorefinery. In GREET, these are relatively small compared to those estimated by JEC. For both GREET and JEC studies, the conversion emissions are close to zero, owing to energy-self-sufficient biomass gasification without external energy that would contribute emissions. WTT and combustion GHG emissions of pyrolysis-based diesel come mainly from fuel production in both GREET and JEC v5 because the pyrolysis biorefinery consumes a considerable amount of natural gas to produce hydrogen for bio-oil upgrading. Electricity consumption at the pyrolysis biorefinery is another major contribution to the GHG emissions from fuel production.
For fossil-derived CNG, GREET estimates that natural gas production and pipeline transportation contribute about 11.5 g CO2e/MJ, compared to the JEC estimate of about 8.8 g CO2e/MJ. The difference is primarily attributable to differences in the energy efficiency of conventional and shale natural gas extraction, as well as methane leakage rates during natural gas production, transportation, and distribution.21,61 Note that the EU CNG mix consists of 3.4% biomethane, which contributes a biogenic carbon credit of about −2.0 g CO2e/MJ. The JEC estimate of the compression emissions is slightly higher than GREET's, given the inclusion of methane leakage during CNG dispensing at refueling stations and electricity consumption for CNG pumping at CNG refueling stations, despite about the same compression energy efficiencies of 97.8%. Fuel combustion emissions are about the same between GREET and JEC estimates, given the similar carbon content of the fuels.
Renewable natural gas (RNG) produced with animal manure, municipal solid waste (MSW), and sewage sludge through anaerobic digestion (AD) shifts such waste feedstock from established waste management systems and practices. For example, in the U.S., manure typically requires treatment with deep pits and lagoons, followed by land application as a soil nutrient supplement.62 Sewage sludge is typically treated by AD to produce biogas to meet AD process energy needs, with the remainder flared to reduce methane emissions. For MSW, typical waste management practices include landfilling, incineration or partial recycle and re-use. Diverting waste materials from such management systems may avoid their associated emissions, or forego associated biogenic carbon sequestration, resulting in GHG emission avoidance credits or foregone carbon sequestration benefits, which may be attributed to the fuel produced with these waste resources from a consequential LCA perspective.
For RNG production with MSW AD, the GREET methodology assumes that if the MSW were not used to produce RNG, 100% of it would otherwise be landfilled. MSW modeled with GREET represents the food waste fraction, which accounts for 77% by weight of the organic fraction (including food waste and yard trimming waste) of the U.S. average MSW63 suitable for AD. The detailed parametric assumptions of food waste AD for RNG production are detailed in a previous study.64 Among the possible carbon fates of food waste in a landfill, CO2 from waste decomposition, oxidation of CH4 emissions, and flaring and combustion of collected CH4 are considered carbon-neutral biogenic CO2 emissions, whereas the avoided CH4 emissions that outweigh potential biogenic carbon sequestration present a significant avoided GHG emission credit of about −117 g CO2e/MJ for shifting food waste to RNG production via AD. The net GHG effect, between the RNG production case and the counterfactual case with the GREET methodology, is that the WTT and combustion emissions are about −101 g CO2e/MJ. In the JEC study, only the organic fraction of the MSW is used for RNG production. This could be considered the equivalent of 100% food-waste-like material. The waste feedstock enters the calculation with zero upstream GHGs. Given that this material would otherwise be used for composting, no landfill CH4 emissions credits are considered in this pathway. The JEC WTT and combustion emissions are about 9.5 g CO2e/MJ for this pathway, including emissions from fuel production and transportation.
In contrast to the MSW case, in both the GREET and the JEC studies, RNG production with manure AD would avoid release or flaring of a large amount of methane-rich biogas from the waste management practices, resulting in a significant GHG emissions credit. Thanks to the credits from avoided CH4 emissions to the atmosphere, the RNG WTT and combustion emissions are estimated at −103 g CO2e /MJ in JEC. The GREET estimate, however, includes a small amount of net foregone GHG sequestration credit in the counterfactual scenario, given slightly greater carbon sequestration than fugitive CH4 emissions from the manure treatment. Meanwhile, the AD process modeled in GREET shows net negative GHG emissions because of sequestration of carbon from landfill of AD residues and negligible direct GHG emissions from the combustion of RNG to meet process energy demand during the AD process. See details in Table S12 in the ESI.†
For RNG with sewage sludge AD, the GREET methodology estimates emissions of −93 g CO2e/MJ. RNG production and processing contributes 23.0 g CO2e/MJ, mainly driven by CH4 leakage during RNG separation. However, the avoided CH4 emissions from the sludge AD processes in a counterfactual scenario generate a significant credit of −117 g CO2e/MJ, which outweighs the emissions from RNG production. JEC reports no specific credits for avoided emissions in this pathway, and the 22 CO2e/MJ estimated by JEC for the fermentation, upgrading, and distribution steps is consistent with the GREET one. See details in Tables S12 and S13 in the ESI† for a comparison of key parametric assumptions of the U.S. and EU CNG and RNG production pathways. This comparison highlights the importance of the counterfactual assumptions, due to the large potential credits for avoided emissions, for these specific AD pathways.
Average U.S. electricity generation has higher GHG emissions than the EU average generation mix, given a larger share of coal- and natural gas-based electricity generation in the U.S. GREET separates emissions associated with production of fuel feedstock for electricity generation. JEC follows the same approach, and the upstream values for each generation technology are reported in JEC v5. The European average grid electricity WTT emission factor was 110 CO2e/MJ in 2016. This has been reduced to 75 CO2e/MJ for the 2030 electricity mix, based on projections from the International Energy Agency's World Energy Outlook 2017 for Europe (New Policies Scenario with 45% renewable sources).65 Both GREET and JEC consider renewable electricity to be zero-carbon when infrastructure-related emissions are excluded. Note that the U.S. renewable grid in 2030 is projected to consist of 40.4% wind, 28.6% solar, 22.6% hydropower, 2.1% geothermal, and 6.4% other renewables, such as biomass. The small GHG emissions in the U.S. renewable electricity mix reflect a small amount of fugitive CO2 emissions from “geothermal-flash” technology.
U.S. hydrogen production via natural gas (NG) steam methane reforming (SMR) modeled in GREET has somewhat lower GHG emissions than its counterpart in the EU. GHG emissions associated with feedstock production are significantly higher in the EU, according to JEC v5. In Europe, transportation accounts for the largest part of the energy requirement because of the large distances involved. For example, the two most likely sources of marginal gas for Europe—western Siberian fields and future southwest Asian locations—are about 5000 km and 4000 km from Europe, respectively. Given the importance of such parameter, the data transportation distances have been recently updated66 and at distance of 4000 km has been assumed for the supply of marginal piped natural gas; in contrast, the supply of natural gas for SMR in the United States assumes an average of pipeline transportation distance of about 1100 km.
The conversion efficiencies considered in both studies are well aligned: U.S. hydrogen production via NG SMR has an energy efficiency of about 71.9%, compared to 76% in the EU. Unlike JEC v5, GREET assumed that surplus steam during the SMR process could be exported and displace steam produced elsewhere, generating displacement emission credits. With a CO2 capture efficiency of 90% in GREET, the hydrogen carbon intensity is reduced by about 74% when the SMR process applies carbon capture and sequestration technologies, which consumes about 357 kW h of electricity per ton of carbon sequestered. In the JEC study, the efficiency for SMR carbon capture and storage (CCS) plants is slightly lower (85%), leading to a total efficiency of 74%, which implies a smaller net WTT emissions reduction than the values reported in GREET (60% reduction). The reference pathway in the JEC study is a central large-scale reformer, hydrogen pipeline, and hydrogen compression to 88 MPa at the retail site. The efficiency of the medium-to-large-scale steam reformer is 76%, with a total WTT and combustion emission intensity of 100 g CO2e/MJ.
Hydrogen production via electrolysis in GREET has an energy efficiency of about 67%, which is about the same as that in JEC v5 (65%). With the U.S. average electricity generation mix in 2030 about 44% higher in GHG emissions that the EU counterpart in the 2025+ timeframe, GHG emissions of hydrogen production via electrolysis in the U.S. are about 30% higher than the EU when the U.S. and EU average electricity generation mixes are used, as shown in Fig. 2. This difference is mainly due to the transportation phase. If the U.S. renewable electricity generation mix were used to produce hydrogen via electrolysis, the fuel carbon intensity would become negligible (0.8 g CO2e/MJ).
For details on the emissions contributions of feedstock production, fuel production, combustion, and biogenic carbon credits to the WTT and combustion emissions of these fuel production pathways, see Tables S17–S21 of the ESI.† In addition, see Fig. S1† for per MJ WTT and combustion GHG emission reductions of fuel pathways compared to baseline petroleum gasoline in the United States and compared to the U.S. petroleum gasoline blendstock and the EU petroleum gasoline blendstock as the baseline in the EU.
3.2 Per km WTW GHG emissions results
Fig. 3 compares the per km WTW results of various light-duty fuel and vehicle systems from GREET and JEC modeling. For a mid-sized E10 gasoline ICEV, the per km WTW results show that the GREET results are noticeably higher than the JEC results. This is primarily attributable to ∼55% higher fuel consumption per km driven for the U.S. gasoline passenger cars, which are larger and ∼15% heavier than the EU counterparts. The fuel consumption of U.S. passenger cars was modeled in different driving cycles, including a high-acceleration aggressive driving cycle (US06), which penalizes the fuel economy of the U.S. vehicles. The per km GREET results present higher WTT emissions for the same reason, despite somewhat similar per MJ WTT results, as discussed above, for the petroleum gasoline and ethanol blendstocks for the EU and U.S. markets. The EU ICEVs, with the E5 petroleum gasoline fuel (the current EU market grade gasoline) have slightly higher per km WTW GHG emissions than the E10 ICEVs, given a lower blending level of bioethanol offering a lower emission intensity than the petroleum gasoline blendstock, as discussed earlier.For a mid-sized diesel ICEV, the per km WTW results show that the GREET results are noticeably higher than the JEC results for fuel options including petroleum diesel, B7 biodiesel, RD with UCO, and pyrolysis-based diesel. This is primarily attributable to 53% higher vehicle fuel consumption per km driven for the larger U.S. diesel cars. The difference in vehicle size and fuel consumption is also the main reason for higher per km WTW GHG emissions for U.S. ICEVs for FAME (B7) and its EU counterparts (a mix of B7 with FAME made of 47% rapeseed oil, 20% palm oil, 15% UCO, 5% animal fats, 5% imported soybean oil, 6% sunflower oil, and 2% other residual oils18). The GREET per km WTW results for FT diesel and soybean RD are close to the JEC results, because the much lower per MJ fuel production emissions estimated by GREET offset the much lower vehicle energy efficiency compared to EU counterparts.
For a mid-sized CNG ICEV, the per km WTW results show that the GREET results are noticeably higher than the JEC results for fossil CNG vehicles. This is primarily attributable to 50% higher vehicle fuel consumption per km driven for the larger U.S. CNG vehicles. A similar trend is observed for the GREET per km WTW results for RNG vehicles. It is worth noticing that in Europe biogas is today largely used to produce electricity, and that the use of this energy vector for cars could deliver other environmental benefits, especially in term of local emissions.
For a mid-sized BEV, the per km WTW results show that the U.S. BEVs with the 161 km and 483 km all-electric ranges, using the U.S. average electricity generation mix, are both about double the WTW GHG emissions of their EU counterparts with 200 km and 400 km all-electric ranges using the EU average electricity generation mix. This difference is due to more emission-intensive average electricity and larger BEVs in the United States. As the U.S. and EU electricity generation mixes transition to renewable electricity in the future, BEVs in both regions would offer close to zero WTW GHG emissions when the battery impact is excluded. The GREET estimate of the contribution of vehicle manufacturing including battery manufacturing is about 29% of C2G GHG emissions of the BEVs in the United States.67,68 For Europe, recent studies suggested similar contributions.69
The larger U.S. FCEVs consume ∼36% more fuel, measured by energy per km driven, than their EU counterparts. As a result, the GREET per km WTW GHG emissions could be much greater than the EU counterparts, especially when hydrogen is produced via electrolysis with the U.S. average generation mix. CCS technologies for NG SMR could significantly reduce the per km GHG emissions of FCEVs in both regions, especially in the United States given its slightly better capture efficiency. For details on the emission contributions of feedstock production, fuel production, combustion, and biogenic carbon credit to the WTW emissions of these fuel–vehicle systems, see Tables S22–S26 of the ESI.†
3.3 Decarbonization potential of fuel–vehicle systems
Fig. 4 compares the per km WTW results of alternative fuel–vehicle technologies generated in the JEC and GREET analyses to the EU and U.S. petroleum gasoline ICEV baseline. Petroleum diesel ICEVs in the United States are 8% lower in per km WTW GHG emissions than petroleum gasoline (E10) ICEVs, while the EU petroleum diesel ICEVs are about 2% lower in per km WTW GHG emissions than the EU petroleum gasoline (E10) ICEVs. Despite similar reductions in vehicle fuel consumption for diesel ICEVs relative to the gasoline counterparts in both regions (see Table 2), higher per MJ GHG emissions of EU petroleum diesel and lower per MJ GHG emissions of EU petroleum gasoline than those of the U.S. counterparts, as shown in Fig. 2, make the U.S. petroleum diesel ICEVs a better option for reducing GHG emissions of a gasoline ICEV dominant market than the EU counterpart in the EU market. These differences in the emissions for these two reference fossil fuels are mainly related to the differences in refinery configuration and throughput for the two regions.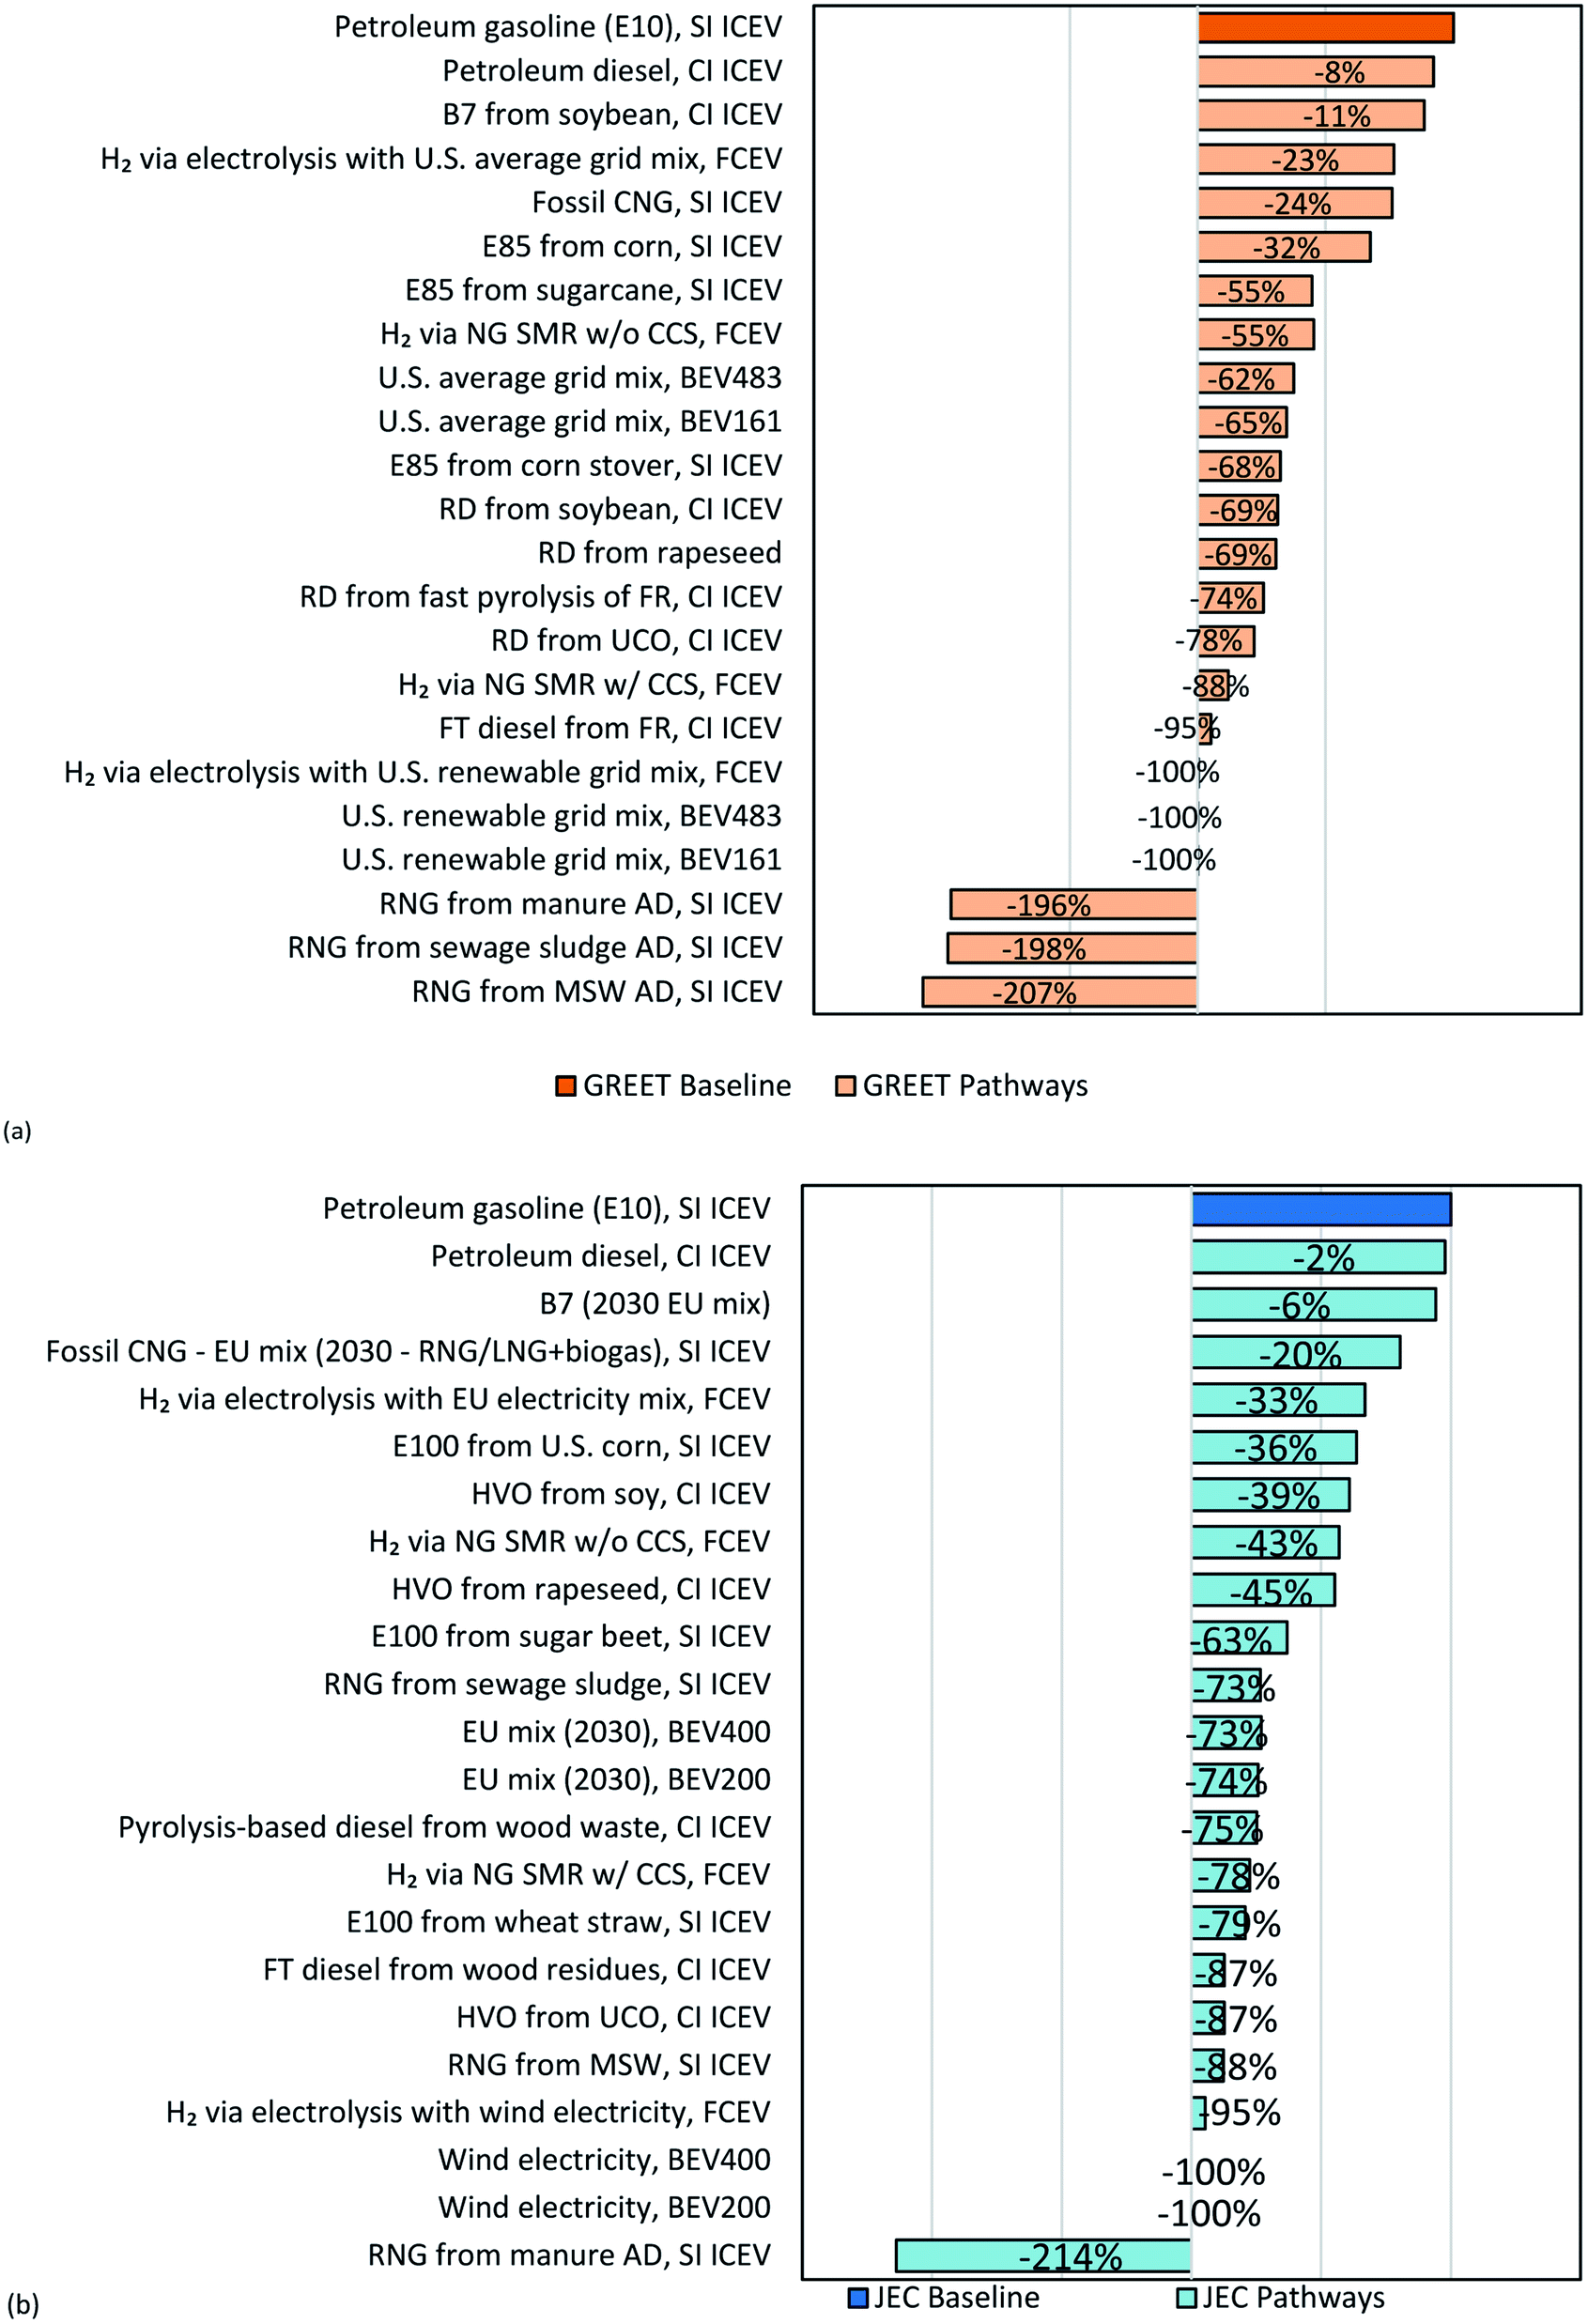 | ||
| Fig. 4 Per km WTW GHG emission reductions of fuel–vehicle technologies compared with baseline gasoline (E10) ICEV (a) in the United States according to GREET and (b) in the EU according to JEC v5. The results are normalized to the U.S. petroleum gasoline vehicles and EU petroleum gasoline vehicles as the baseline, respectively. | ||
In both the U.S. and EU markets, waste-to-energy (WTE) technologies, such as CNG production via AD of wet waste resources, e.g., wastewater sludge and animal manure, present the biggest opportunities to reduce WTW GHG emissions over those of baseline petroleum gasoline vehicles. In Europe, the use of compressed and liquefied natural gas are today mainly considered for heavy duty, as the car sector is more oriented to other solutions, such as electrification. Note that certain WTE technologies face challenges of limited feedstock resources and variation in quality. Therefore, the production scale of fuels from WTE technologies and their contribution to decarbonization of the transportation sector may be limited. For example, RNG production from operational RNG projects in the United States could displace about 0.4% of the annual gasoline consumption.70 In the European case, a recent study 71 reports that the current biomethane potential could already cover the existing demand of fossil natural gas for the transportation sector (about 2 billion cubic meters in 2018). Drop-in renewable diesel fuels, which could be produced from forest residues or wood waste feedstock via thermochemical conversion technologies, including FT and pyrolysis technologies, provide potential reductions of more than 75% in both the U.S. and EU. Ethanol produced from agricultural residues such as corn stover in the U.S. and wheat straw in the EU, could also offer significant emission reductions of about 68% and 79%, respectively. Electrification technologies with the average electricity generation mixes in both regions could reduce WTW GHG emissions 60%, or up to 100% if renewable electricity is used. FCEVs using hydrogen produced via NG SMR without CCS could offer about 55% and 43% reductions in WTW GHG emissions in the U.S. and EU, respectively. If CCS technologies are employed, such FCEVs technologies could offer 88% and 78% reductions, respectively. When the hydrogen is produced with renewable electricity via electrolysis, FCEVs could achieve almost 100% WTW GHG emission reduction in both regions. It is worth noting that this analysis does not take infrastructure and vehicle manufacturing impacts into consideration.
At a high blending level, such as 100% for HVO and 85% or 100% for ethanol, the GHG emissions saving potential for ICEVs is strongly related to the conversion routes and feedstocks used in the production stage. At a low blending level (e.g., B7), the per km potential emission reduction differences for the various FAME production pathways narrow. It is known that the blending level of low-carbon biofuels plays an important role in decarbonizing transportation GHG emissions,72 and in fact the current blending walls are often debated. A higher blending level of FAME in the EU market would harness the great GHG emission reduction potential of biofuels on a per MJ basis (see Fig. S1†), therefore offering a significantly greater per km GHG emission reductions. Meanwhile, oil seed feedstocks such as canola/rapeseed face a similar issue of limited supply without causing significant and potentially hazardous land use change. Therefore, the production scale of FAME from oil seeds and waste feedstocks may be somewhat limited, restricting their contribution to decarbonization of the transportation sector.
When electricity and hydrogen are used for fuel, it is worth noticing that the emission savings are determined by the primary source of energy used for their production. At least in the current transition to a fully renewable energy grid, when the electricity for BEVs or electricity used to produce hydrogen via electrolysis is taken from the grid, this may lead to a displacement of green electricity from another sector (e.g., industry) to transportation. If the electric system reacts to this marginal increment in demand by increasing production from fossil sources (e.g., natural gas), the models should properly account for this marginal change. These issues are country specific and time specific (as production is a non-steady process by definition) and warrant further effort to address.
4 Discussion
A comparison of the GREET and JEC WTW GHG emission results for the various alternative fuel and vehicle systems in the U.S. and EU showed both commonalities and differences in terms of the modeling approaches, key assumptions, and key drivers of GHG emissions. All these highlight the difference in the two regions' approaches, often related to different approaches towards the common goal of the road sector decarbonization.4.1 Main commonalities
Both models are based on an attributional approach chosen to address supply chain emissions associated with fuel production, transportation, and end use in vehicles. Process energy and material balances across the feedstock-to-fuel supply chain are key modeling inputs, influencing the WTW results. The energy efficiencies of feedstock production and fuel production are key parameters in both models for many fuel production pathways.Both models also take a consequential approach to addressing the land use change effects of some biofuels, such as corn ethanol. For example, GREET adopts a computable general equilibrium (CGE) modeling approach to quantifying the indirect GHG emissions from converting non-crop land to cropland, intensification of cropland, and other practices to produce more corn to meet the increasing demand for corn to produce ethanol.37,73 In the JEC v5 study the LUC effect was not directly added to the main results, but a full dedicated Annex was provided, to present the potential impact of this issue. This is line with the legislative framework on this topic, existing at the EU level.
In both modeling efforts, waste-to-energy technologies are highlighted as relevant options for sector decarbonization. Producing RNG from MSW via AD is modeled in both studies by considering the avoided emissions impacts of counterfactual scenarios in which common waste management practices, such as landfilling, lead to generated GHG emissions and/or to biogenic carbon sequestration. While both models take a consequential approach to addressing indirect emission impacts associated with shifting conventional waste management practices to waste-to-energy production practices, different hypotheses for the counterfactual scenario lead to significant differences in the results. In both regions, forest or agricultural residues without extensive farming inputs could generate low-carbon liquid fuels, including ethanol and renewable diesel, to power ICEVs and achieve significant emissions reductions over petroleum gasoline ICEVs.
Among the vehicle and powertrain technologies for light-duty passenger transportation, BEVs with U.S. and EU average electricity generation mixes reduce WTW GHG emission over 60% in both regions, given the significantly better energy efficiency of the electrification system compared with gasoline ICEVs and the continuous improvement of the electricity GHG emission intensities that could be expected in the 2025+ timeframe. Clearly, the emission reduction benefit would be even greater if BEVs were charged with renewable electricity. The decarbonization potential of hydrogen FCEVs depends on the hydrogen production technology and the potential deployment of CCS technologies with NG SMR. The GHG emissions of FCEVs with hydrogen from electrolysis of water vary greatly with the sources of electricity: in both regions, electrolysis with the average electricity generation mixes would be more emissions-intensive than when the hydrogen is produced with NG SMR without CCS, but could offer greater emissions reduction with renewable electricity than when the hydrogen is produced with NG SMR coupled with CCS.
4.2 Main differences
The WTT and combustion GHG emission results for most fuel production pathways vary between the two models. Apart from some differences in specific parametric assumptions, some overarching modeling differences contribute to the differences in the results. JEC takes a marginal approach to addressing baseline petroleum to account for emission impacts of the market dynamics and petroleum refining decision-making in the EU fuel market, whereas GREET takes an average approach to account for the emission impacts of a slate of crude oil sources from domestic and non-U.S. production and average operations of the U.S. refinery industry. Although the differences in the WTT and combustion GHG emission results of baseline petroleum fuels in the U.S. and EU are fairly small, it is important to understand their different contexts and implications to appropriately interpret and use the results.Comparing the results in per-km terms highlights the differences in vehicle driving cycles in the U.S. and EU and the differences in vehicle sizes and curb weights for the same powertrain technology. At the same time, improvements in vehicle technologies, as shown in Table 2, lead to significant differences in the vehicle fuel consumption rate, an indicator of vehicle operational energy efficiency. Such differences show that the amount of fuel required to drive a vehicle of a particular powertrain technology for one kilometer varies between a U.S. vehicle and its EU counterpart. This makes it difficult to directly compare the per km GHG emission results of vehicle technologies as estimated by the two models. A more direct comparison could be made of fuel production and the per MJ WTT and combustion GHG emission results. On the other hand, the per km results are useful for comparing the integrated fuel–vehicle systems within each model and the representative market. Such a comparison could better guide ongoing research and development and market transformation.
5 Conclusions
This paper compared two studies that investigate decarbonization options for road transportation in the EU and the U.S. The comparison focuses on the fuel production and use stages. GHG emissions per km has been used as the metric to show the benefits of alternative fuels per unit of service provided. However, these results are strongly affected by the differences in vehicle drive cycles and in vehicle sizes and curb weights for the same powertrain technology in the two regions.When focusing on the fuel production stage, a more direct comparison could be made on the per MJ WTT and combustion GHG emissions. On the other hand, the per km results are useful for comparing integrated fuel–vehicle systems within each model and the representative market. This comparison could better guide the choice of the most effective alternative fuel–vehicle systems for transportation decarbonization.
The results show that in both the U.S. and EU markets, waste-streams-to-energy technologies, such as CNG production via AD of wet waste resources, offer the biggest opportunities to reduce WTW GHG emissions. It must be noted that in Europe the AD biogas is mainly used to produce electricity, and this energy vector can supply the car sector and deliver additional environmental benefits (e.g., on local emissions). Drop-in renewable diesel fuels, produced from forest residues or wood waste feedstock via thermochemical conversion technologies, including FT and pyrolysis technologies, could potentially reduce GHG emissions more than 75% in both the U.S. and the EU, despite the varying energy efficiency of the conversion routes and feedstocks used. It is worth noting that sustainable feedstock availability may be limited and is subject to market dynamics and competition among sectors. Therefore, the actual penetration of a specific fuel pathway will be determined by factors beyond its capacity of reducing GHG emissions. Timely, deep decarbonization of the transportation sector requires a mix of low-carbon, renewable energy and powertrain technologies that could scale up collectively.
Using electricity and hydrogen as alternatives to petroleum gasoline and diesel fuels in BEVs and FCEVs offer great GHG emission reduction potential, especially with renewable electricity and hydrogen produced with electrolysis using renewable electricity and/or produced with CCS technologies.
Through the comparison of the GREET and JEC WTW studies, the paper demonstrates that the key solutions for road sector decarbonization are aligned for the EU and the United States. As well as informing optimal selection of fuel and powertrain technologies for future vehicles, these findings are also useful in informing how existing vehicles can best be decarbonized through the use of low-carbon renewable fuels and advanced powertrain technologies.
Acronyms and abbreviations
| AD | Anaerobic digestion |
| AG | U.S./EU average electricity grid mix |
| API | American Petroleum Institute |
| B7 | Mixture of 7% FAME and 93% diesel |
| BEV | Battery electric vehicles |
| CAFE | Corporate average fuel economy |
| CARB | California Air Resources Board |
| CCGT | Combined cycle gas turbine |
| CCS | Carbon capture and storage |
| CGE | Computable general equilibrium |
| CI | Compression ignition |
| CIMS | Crude information management system |
| CL | Cellulosic |
| CNG | Compressed natural gas |
| CNGV | Compressed natural gas vehicles |
| DG CLIMA | EU Commission's Directorate-General for Climate Action |
| DISI | Direct-injection spark-ignition (engine) |
| DICI | Direct injection compression ignition (engine) |
| Dilbit | Diluted bitumen |
| DLUC | Direct land use change |
| E10 | Mixture of 10% ethanol and 90% gasoline |
| E85 | Mixture of 85% ethanol and 15% gasoline |
| E100 | Pure ethanol |
| EtOH | Ethyl alcohol or ethanol |
| EUCAR | European council for automotive research and development |
| FAME | Fatty acid methyl ester |
| FCEV | Fuel cell electric vehicles |
| FP | Fast pyrolysis |
| FQD | Fuel quality directive |
| FR | Forest residue |
| FT | Fischer–Tropsch |
| GHG | GreenHouse gas |
| GREET | Greenhouse gases, regulated emissions, and energy use in technologies |
| HEFA | Hydroprocessed esters and fatty acid |
| HEV | Hybrid electric vehicles |
| HVO | Hydrotreated vegetable oil |
| FFV | Flexible fuels vehicles |
| ICAO | International Civil Aviation Organization |
| ICCT | International Council on Clean Transportation |
| ICE | Internal combustion engine |
| ICEV | Internal combustion engine vehicle |
| IGCC | Integrated gasification combined cycle |
| ILCD | International Reference Life Cycle Data System |
| ILUC | Indirect land use change |
| JEC | European Commission's Joint Research Centre (JRC), the European Council for Automotive R&D (EUCAR), and Environmental Science for European Refining (Concawe), collectively |
| JEC v5 | Version 5 of the JEC Well-To-Wheels Report |
| JRC | European Commission's Joint Research Centre |
| LCA | Life-cycle analysis |
| LCFS | (California's) low carbon fuel standard |
| LEPG | Low-ethanol petroleum gasoline |
| MSW | Municipal solid waste |
| MWth | Megawatt thermal |
| OPGEE | Oil production greenhouse gas emissions estimator |
| PTW | Pump-to-wheels |
| PHEV | Plug-in hybrid electric vehicles |
| RD | Renewable diesel |
| RFS | Renewable fuel standard |
| RG | Renewable electricity grid mix |
| RED | Renewable energy directive |
| SB | Soybean |
| SC | Sugarcane |
| SCO | Synthetic crude oil |
| SI | Spark ignition |
| SMR | Steam methane reforming |
| TTW | Tank-to-wheels |
| UCO | Used cooking oil |
| WLTP | Worldwide harmonised light vehicle test procedure |
| WTP | Well-to-pump |
| WTT | Well-to-tank |
| WTW | Well-to-wheels |
Disclaimer
The views expressed here are solely those of the authors and may not, under any circumstances, be regarded as an official position of the European Commission, Concawe, Argonne National Laboratory, or the U.S. Department of Energy.Author contributions
Hao Cai: methodology, formal analysis, validation, writing – original draft, writing – review & editing, and project administration. Matteo Prussi: methodology, formal analysis, validation, writing – original draft, writing – review & editing, project administration. Longwen Ou: formal analysis, visualization, writing – original draft. Michael Wang: conceptualization, funding acquisition, supervision. Marta Yugo: formal analysis, visualization, vriting – original draft, and writing – review & editing. Laura Lonza: validation, writing – original draft, and writing – review & editing. Nicolae Scarlat: validation and supervision.Conflicts of interest
The authors declare that they have no known competing financial interests or personal relationships that could have appeared to influence the work reported in this paper.Acknowledgements
Concawe acknowledges Ludwig-Bölkow-Systemtechnik GmbH (LBST) for technical support in modelling WTT values. The JRC acknowledges the contributions of EUCAR and all the JEC experts in the release of the JEC WTW v5 study. Argonne National Laboratory acknowledges the Vehicle Technologies Office, Bioenergy Technologies Office, and Fuel Cell Technologies Office of the U.S. Department of Energy's Office of Energy Efficiency and Renewable Energy under Contract No. DE-AC02-06CH113.References
- International Energy Agency, Transport sector CO2 emissions by mode in the Sustainable Development Scenario, 2000-2030 – Charts – Data & Statistics, https://www.iea.org/data-and-statistics/charts/transport-sector-co2-emissions-by-mode-in-the-sustainable-development-scenario-2000-2030, accessed July 25, 2021 Search PubMed.
- European Environment Agency, Transport, https://www.eea.europa.eu/publications/transport-increasing-oil-consumption-and/increasing-oil-consumption-and-ghg, accessed July 25, 2021 Search PubMed.
- European Environment Agency, CO2 performance of new passenger cars in Europe, https://www.eea.europa.eu/data-and-maps/indicators/average-co2-emissions-from-motor-vehicles-1/assessment, accessed July 25, 2021 Search PubMed.
- U.S. Energy Information Administration, Use of energy for transportation, https://www.eia.gov/energyexplained/use-of-energy/transportation.php, accessed July 25, 2021 Search PubMed.
- U.S. Environmental Protection Agency, Sources of Greenhouse Gas Emissions, https://www.epa.gov/ghgemissions/sources-greenhouse-gas-emissions, accessed July 25, 2021 Search PubMed.
- National Highway Traffic Safety Administration, Corporate Average Fuel Economy, https://www.nhtsa.gov/laws-regulations/corporate-average-fuel-economy, accessed July 25, 2021 Search PubMed.
- U.S. Environmental Protection Agency, Overview for Renewable Fuel Standard, https://www.epa.gov/renewable-fuel-standard-program/overview-renewable-fuel-standard, accessed July 25, 2021 Search PubMed.
- California Air Resources Board, Low Carbon Fuel Standard, https://ww2.arb.ca.gov/our-work/programs/low-carbon-fuel-standard, accessed July 25, 2021 Search PubMed.
- State of Oregon, Oregon Clean Fuels Program, https://www.oregon.gov/deq/ghgp/cfp/Pages/CFP-Overview.aspx, accessed July 25, 2021 Search PubMed.
- European Environment Agency, Regulation (EU) 2019/631, https://www.eea.europa.eu/policy-documents/regulation-eu-2019-631, accessed July 25, 2021 Search PubMed.
- European Commission, Proposal for a REGULATION OF THE EUROPEAN PARLIAMENT AND OF THE COUNCIL amending Regulation (EU) 2019/631 as regards strengthening the CO2 emission performance standards for new passenger cars and new light commercial vehicles in line with the Union’s increased climate ambition, https://www.google.com/search?q=Proposal+for+aREGULATION+OF+THE+EUROPEAN+PARLIAMENT+AND+OF+THE+COUNCILamending+Regulation+(EU)+2019%2F631+as+regards+strengthening+the+CO2+emission+performance+standards+for+new+passenger+cars+and+new+light+commercial+vehicles+in+line+with+the+Union%E2%80%99s+increased+climate+ambition&rlz=1C1CHBF_enUS895US895&oq=Proposal+for+aREGULATION+OF+THE+EUROPEAN+PARLIAMENT+AND+OF+THE+COUNCILamending+Regulation+(EU)+2019%2F631+as+regards+strengthening+the+CO2+emission+performance+standards+for+new+passenger+cars+and+new+light+commercial+vehicles+in+line+with+the+Union%E2%80%99s+increased+climate+ambition&aqs=chrome..69i57.792j0j7&sourceid=chrome&ie=UTF-8, accessed July 25, 2021 Search PubMed.
- European Union, Directive 2009/28/EC of the European Parliament and of the Council of 23 April 2009 on the promotion of the use of energy from renewable sources and amending and subsequently repealing Directives 2001/77/EC and 2003/30/EC, https://eur-lex.europa.eu/eli/dir/2009/28/oj, accessed July 25, 2021 Search PubMed.
- European Union, Directive 98/70/EC of the European Parliament and of the Council of 13 October 1998 Relating to the Quality of Petrol and Diesel Fuels and Amending Council Directive 93/12/EEC, 2018, vol. OJ L Search PubMed.
- European Environment Agency, Use of renewable fuels in transport in Europe, https://www.eea.europa.eu/data-and-maps/indicators/use-of-cleaner-and-alternative-fuels/use-of-cleaner-and-alternative-5, accessed July 25, 2021 Search PubMed.
- European Environment Agency, Quality and greenhouse gas intensities of transport fuels in the EU in 2017, https://www.eea.europa.eu/publications/quality-and-greenhouse-gas-intensities-1, accessed July 25, 2021 Search PubMed.
- European Union, Directive (EU) 2018/2001 of the European Parliament and of the Council of 11 December 2018 on the Promotion of the Use of Energy from Renewable Sources, 2018, vol. OJ L Search PubMed.
- European Commission, Proposal for amending Directive (EU) 2018/2001, Regulation (EU) 2018/1999 and Directive 98/70/EC as regards the promotion of energy from renewable sources, https://www.google.com/search?q=557+Proposal+for+amending+Directive+(EU)+2018%2F2001%2C+Regulation+(EU)+2018%2F1999+and+Directive+98%<?pdb_no 2F70?>2F70<?pdb END?>%<?pdb_no 2FEC?>2FEC<?pdb END?>+as+regards+the+promotion+of+energy+from+renewable+sources%26rlz=1C1CHBF_enUS895US895%<?pdb_no 26oq?>26oq<?pdb END?>=557+Proposal+for+amending+Direc, accessed July 25, 2021 Search PubMed.
- M. Prussi, M. Yugo, L. De Prada, M. Padella and R. Edwards, JEC Well-To-Wheels report v5, EUR 30284 EN, Publications Office, LU, 2020 Search PubMed.
- LBST, E3database, https://www.e3database.com/, accessed July 28, 2021 Search PubMed.
- AVL, AVL CRUISE™, https://www.avl.com/cruise, accessed July 28, 2021 Search PubMed.
- M. Wang, A. Elgowainy, U. Lee, A. Bafana, P. T. Benavides, A. Burnham, H. Cai, Q. Dai, U. R. Gracida-Alvarez, T. R. Hawkins, P. V. Jaquez, J. C. Kelly, H. Kwon, Z. Lu, X. Liu, L. Ou, P. Sun, O. Winjobi, H. Xu, E. Yoo, G. G. Zaimes and G. Zang, Summary of Expansions and Updates in GREET® 2020, Argonne National Lab. (ANL), Argonne, IL (United States), 2020 Search PubMed.
- California Air Resources Board, LCFS Life Cycle Analysis Models and Documentation, https://ww2.arb.ca.gov/resources/documents/lcfs-life-cycle-analysis-models-and-documentation, accessed July 25, 2021 Search PubMed.
- U.S. Environmental Protection Agency, Final Rule for Phase 2 Greenhouse Gas Emissions Standards and Fuel Efficiency Standards for Medium- and Heavy-Duty Engines and Vehicles, https://www.epa.gov/regulations-emissions-vehicles-and-engines/final-rule-phase-2-greenhouse-gas-emissions-standards-and, accessed July 27, 2021 Search PubMed.
- M. Prussi, U. Lee, M. Wang, R. Malina, H. Valin, F. Taheripour, C. Velarde, M. D. Staples, L. Lonza and J. I. Hileman, CORSIA: The first internationally adopted approach to calculate life-cycle GHG emissions for aviation fuels, Renew. Sustain. Energy Rev., 2021, 150, 111398 CrossRef CAS.
- The Intergovernmental Panel on Climate Change, Fifth Assessment Report, https://www.ipcc.ch/assessment-report/ar5/, accessed July 25, 2021 Search PubMed.
- International Organization for Standardization, ISO 14040:2006 - Environmental management — Life cycle assessment — Principles and framework, https://www.iso.org/standard/37456.html, accessed July 25, 2021.
- C. Moretti, A. Moro, R. Edwards, M. V. Rocco and E. Colombo, Appl. Energy, 2017, 206, 372–381 CrossRef CAS.
- Concawe, Estimating the marginal CO2 intensities of EU refinery products, https://www.concawe.eu/publication/estimating-the-marginal-co2-intensities-of-eu-refinery-products-report-117/, accessed July 28, 2021 Search PubMed.
- European Commission, ILCD International Life Cycle Data system, https://eplca.jrc.ec.europa.eu/ilcd.html, accessed July 25, 2021 Search PubMed.
- H. Cai, J. B. Dunn, Z. Wang, J. Han and M. Q. Wang, Biotechnol. Biofuels, 2013, 6, 141 CrossRef CAS.
- U. Lee, H. Kwon, M. Wu and M. Wang, Retrospective analysis of the U.S. corn ethanol industry for 2005–2019: implications for greenhouse gas emission reductions, Biofuels Bioprod. Biorefining, 2021, 15(5), 1318–1331 CrossRef CAS.
- M. Wang, J. Han, J. B. Dunn, H. Cai and A. Elgowainy, Environ. Res. Lett., 2012, 7, 045905 CrossRef CAS.
- J. Byrne, Renewable ethanol sector waits to see how EU policy will play out, https://www.feednavigator.com/Article/2020/09/02/Bioethanol-sector-waits-to-see-how-EU-policy-will-play-out, accessed July 26, 2021 Search PubMed.
- R. Chen, Z. Qin, J. Han, M. Wang, F. Taheripour, W. Tyner, D. O'Connor and J. Duffield, Bioresour. Technol., 2018, 251, 249–258 CrossRef CAS PubMed.
- Energy Information Administration, Monthly Biodiesel Production Report, https://www.eia.gov/biofuels/biodiesel/production/, accessed July 26, 2021 Search PubMed.
- B. Flach, S. Lieberz and S. Bolla, EU Biofuels Annual 2019 - Reports - ETIP-B-SABS 2, https://www.etipbioenergy.eu/databases/reports/429-eu-biofuels-annual-2019, accessed July 26, 2021 Search PubMed.
- Z. Qin, J. B. Dunn, H. Kwon, S. Mueller and M. M. Wander, GCB Bioenergy, 2016, 8, 1136–1149 CrossRef CAS.
- R. Chen, Z. Qin, J. Han, M. Wang, F. Taheripour, W. Tyner, D. O’Connor and J. Duffield, Bioresour. Technol., 2018, 251, 249–258 CrossRef CAS.
- M. Prussi, U. Lee, M. Wang, R. Malina, H. Valin, F. Taheripour, C. Velarde, M. D. Staples, L. Lonza and J. I. Hileman, Renewable Sustainable Energy Rev., 2021, 150, 111398 CrossRef CAS.
- U.S. Environmental Protection Agency, EPA Emission Standards for Light-Duty Vehicles and Trucks and Motorcycles, https://www.epa.gov/emission-standards-reference-guide/epa-emission-standards-light-duty-vehicles-and-trucks-and, accessed July 26, 2021 Search PubMed.
- WLTPfacts, What is WLTP, https://www.wltpfacts.eu/what-is-wltp-how-will-it-work/, accessed July 26, 2021 Search PubMed.
- A. Huss and P. Weingerl, JEC Well to Wheels Analysis : Well to Wheels Analysis of Future Automotive Fuels and Powertrains in the European Context : Passenger Car., Publications Office, LU, 2020 Search PubMed.
- U.S. Environmental Protection Agency, Dynamometer Drive Schedules, https://www.epa.gov/vehicle-and-fuel-emissions-testing/dynamometer-drive-schedules, accessed July 28, 2021 Search PubMed.
- A. Elgowainy, J. Han, J. Ward, F. Joseck, D. Gohlke, A. Lindauer, T. Ramsden, M. Biddy, M. Alexander, S. Barnhart, I. Sutherland, L. Verduzco and T. J. Wallington, Environ. Sci. Technol., 2018, 52, 2392–2399 CrossRef CAS PubMed.
- Vehicle Technologies Office, Modeling and Simulation, https://www.energy.gov/eere/vehicles/modeling-and-simulation, accessed July 26, 2021 Search PubMed.
- U.S. Energy Information Administration, Oil imports and exports, https://www.eia.gov/energyexplained/oil-and-petroleum-products/imports-and-exports.php, accessed July 18, 2021 Search PubMed.
- A. R. Brandt, T. Yeskoo, M. S. McNally, K. Vafi, S. Yeh, H. Cai and M. Q. Wang, Energy Fuels, 2016, 30, 9613–9621 CrossRef CAS.
- H. Cai, A. R. Brandt, S. Yeh, J. G. Englander, J. Han, A. Elgowainy and M. Q. Wang, Environ. Sci. Technol., 2015, 49, 8219–8227 CrossRef CAS PubMed.
- Exergia, E3M-lab, and COWI, Study on actual GHG data for diesel, petrol, kerosene and natural gas, https://platformduurzamebiobrandstoffen.nl/infotheek/study-on-actual-ghg-data-for-diesel-petrol-kerosene-and-natural-gas/, accessed July 28, 2021 Search PubMed.
- S. Yeh, A. Ghandi, B. R. Scanlon, A. R. Brandt, H. Cai, M. Q. Wang, K. Vafi and R. C. Reedy, Energy Fuels, 2017, 31, 1440–1449 CrossRef CAS.
- J. Han, G. S. Forman, A. Elgowainy, H. Cai, M. Wang and V. B. DiVita, Fuel, 2015, 157, 292–298 CrossRef CAS.
- Transport Policy, EU, https://www.transportpolicy.net/standard/eu-fuels-diesel-and-gasoline/, accessed July 26, 2021 Search PubMed.
- Transport Policy, US, https://www.transportpolicy.net/standard/us-fuels-diesel-and-gasoline/, accessed July 26, 2021 Search PubMed.
- Stanford University, OPGEE: The Oil Production Greenhouse gas Emissions Estimator, https://www.google.com/search?q=OPGEE%3A+The+Oil+Production+Greenhouse+gas+Emissions+Estimator%26rlz=1C1CHBF_enUS895US895%26oq=OPGEE%3A+The+Oil+Production+Greenhouse+gas+Emissions+Estimator%26aqs=chrome..69i57j69i58.847j0j7%26sourceid=chrome%26ie=UTF-8, accessed July 26, 2021 Search PubMed.
- M. Wang, J. Han, J. B. Dunn, H. Cai and A. Elgowainy, Environ. Res. Lett., 2012, 7, 045905 CrossRef CAS.
- M. Wang, A. Elgowainy, U. Lee, A. Bafana, P. T. Benavides, A. Burnham, H. Cai, Q. Dai, U. R. Gracida-Alvarez, T. R. Hawkins, P. V. Jaquez, J. C. Kelly, H. Kwon, Z. Lu, X. Liu, L. Ou, P. Sun, O. Winjobi, H. Xu, E. Yoo, G. G. Zaimes and G. Zang, Summary of Expansions and Updates in GREET® 2020, Argonne National Lab. (ANL), Argonne, IL (United States), 2020 Search PubMed.
- M. Wang, H. Huo and S. Arora, Energy Policy, 2011, 39, 5726–5736 CrossRef CAS.
- H. Cai, J. Han, A. Elgowainy and M. Wang, Parameters of Canola Biofuel Production Pathways in GREET, https://greet.es.anl.gov/publication-canadian-canola, accessed August 4, 2021 Search PubMed.
- California Air Resources Board, Weekly LCFS Credit Trading Activity Reports, https://ww3.arb.ca.gov/fuels/lcfs/credit/lrtweeklycreditreports.htm, accessed July 26, 2021 Search PubMed.
- L. Ou, S. Li, L. Tao, S. Phillips, T. Hawkins, A. Singh, L. Snowden-Swan and H. Cai, Rev. J. Clean. Prod., 2022, 10(1), 382–393 CAS.
- H. Cai, A. Burnham, R. Chen and M. Wang, Energy Policy, 2017, 109, 565–578 CrossRef CAS.
- U.S. Environmental Protection Agency, Inventory of U.S. Greenhouse Gas Emissions and Sinks, https://www.epa.gov/greenhouse-gas-emissions/inventory-us-greenhouse-gas-emissions-and-sinks-1990-2019, accessed July 26, 2021 Search PubMed.
- U.S. Environmental Protection Agency, Advancing Sustainable Materials Management, https://www.epa.gov/facts-and-figures-about-materials-waste-and-recycling/advancing-sustainable-materials-management, accessed August 2, 2021 Search PubMed.
- U. Lee, J. Han and M. Wang, J. Clean. Prod., 2017, 166, 335–342 CrossRef CAS.
- International Energy Agency, World Energy Outlook 2017 – Analysis, https://www.iea.org/reports/world-energy-outlook-2017, accessed August 29, 2021 Search PubMed.
- Thinkstep, Greenhouse Gas Intensity of Natural Gas; Study for the Natural & Bio Gas Vehicle Association (NGVA) Europe, https://www.google.com/search?q=Thinkstep%3A+Greenhouse+Gas+Intensity+of+Natural+Gas%3B+Study+for+the+Natural+%26+Bio+Gas+Vehicle+Association+(NGVA)+Europe%26rlz=1C1CHBF_enUS895US895%26oq=Thinkstep%3A+Greenhouse+Gas+Intensity+of+Natural+Gas%3B+Study+for+the+N, accessed July 26, 2021 Search PubMed.
- J. C. Kelly, J. L. Sullivan, A. Burnham and A. Elgowainy, Environ. Sci. Technol., 2015, 49, 12535–12542 CrossRef CAS.
- J. B. Dunn, L. Gaines, J. C. Kelly, C. James and K. G. Gallagher, Energy Environ. Sci., 2015, 8, 158–168 RSC.
- N. Hill, S. Amaral, S. Morgan-Price, T. Nokes, J. Bates, H. Helms, H. Fehrenbach, K. Biemann, N. Abdalla, J. Jöhrens, E. Cotton, L. German, A. Harris, S. Haye, C. Sim, A. Bauen and S. Ziem-Milojevic, Determining the Environmental Impacts of Conventional and Alternatively Fuelled Vehicles through LCA: Final Report, Publications Office of the European Union, LU, 2020 Search PubMed.
- Argonne National Laboratory, Renewable Natural Gas Database, https://www.anl.gov/es/reference/renewable-natural-gas-database, accessed January 25, 2022 Search PubMed.
- M. Prussi, M. Padella, M. Conton, E. D. Postma and L. Lonza, J. Cleaner Prod., 2019, 222, 565–572 CrossRef CAS PubMed.
- J. B. Dunn, E. Newes, H. Cai, Y. Zhang, A. Brooker, L. Ou, N. Mundt, A. Bhatt, S. Peterson and M. Biddy, Energy Environ. Sci., 2020, 13, 2262–2274 RSC.
- J. B. Dunn, S. Mueller, H. Kwon and M. Q. Wang, Biotechnol. Biofuels, 2013, 6, 51 CrossRef CAS PubMed.
Footnotes |
| † Electronic supplementary information (ESI) available. See https://doi.org/10.1039/d2se00411a |
| ‡ GHG emissions are calculated based on the emissions of three major greenhouse gases—CO2, CH4, and N2O—and their global warming potentials (1, 30, and 265, respectively), per the Fifth Assessment Report by the Intergovernmental Panel on Climate Change.25 |
| § While GREET uses WTP terminology and JEC uses WTT, for simplicity, we will refer to both as WTT results. |
| ¶ The JEC assumptions are from the JEC TTW analysis.42 The GREET assumptions are based on average vehicle fuel economy in five driving cycles43 that are modeled with software called Autonomie.44,45 |
| This journal is © The Royal Society of Chemistry 2022 |