Mono-dimensional and two-dimensional models for chemical looping reforming with packed bed reactors and validation under real process conditions
Received
14th March 2022
, Accepted 17th April 2022
First published on 20th April 2022
Abstract
Chemical looping reforming (CLR) is an emerging hydrogen/syngas production technology, integrated with CO2 capture. Packed bed reactors are widely used in the hydrogen production industry as they are preferred for high pressure operation and the mathematical modelling describing their operation is very important for their design. In this study, a one-dimensional (1-D) and a two-dimensional (2-D) model have been developed to describe the dynamic operation of chemical looping reforming processes in packed bed reactors (CLR-PB). The reactor under study (L: 400 mm ID: 35 mm) contains an axially placed thermowell (OD: 6.35 mm) to monitor the temperature across the reactor bed at 6 points and 440 g of NiO/CaAl2O4 oxygen carrier (OC). Both models have been validated presenting very good agreement with the experimental results. The comparison between modelling and experimental results has been carried out in terms of thermowell temperature and the gas composition breakthroughs, with the 2-D model capturing the thermowell temperature recordings with high accuracy, while the 1-D model delivered results that underestimated it by 2.5%. Nonetheless, the predicted average bed temperature presented a difference limited to 1% lower estimation of the 1-D to the 2-D model. The temperature difference between the bed and the thermowell has achieved a value of >180 °C thus resulting also problematic in terms of safe operation if not properly considered. with temperatures during oxidation being higher even by 181 °C inside the bed, emphasizing the importance of the model in the proper design and safe operation of the reactor. The 1-D model, due to the significantly lower computation time (∼21 times faster than 2-D), has been selected to be tested against a range of operating conditions for oxidation (500–600 °C, 1–5 bar, 10–40 NLPM, 10–20% O2), reduction (600–900 °C, 1–5 bar) with H2, syngas and CH4-rich reducing agents and dry reforming (700–900 °C, 1–5 bar), delivering results with good agreement especially under high temperature conditions where solid conversion is high and under conditions which resemble the expected industrial ones.
1 Introduction
Climate change policy is the main agenda of most policymakers, mainly due to the CO2 emissions released into the atmosphere related to anthropogenic activities.1 Despite the progress in renewable energy technologies, the main energy demand nowadays is met by fossil fuel resources with 84% of the total energy consumption.1
In order to meet the ambitious target of net zero emissions by 2050, several technologies need to be developed and implemented on a large scale including the decarbonisation of the fossil fuel industry via carbon capture, utilisation and storage (CCUS).2
There are three major technologies for carbon capture in industry: (a) pre-combustion, where air/O2 reacts with the fuel and steam to produce a mixture of H2, CO, H2O and CO2 where CO2 will be separated; (b) post-combustion in which air and fuel react to combust and CO2 exists in the mixture of the flue gas and is separated downstream; and (c) oxyfuel combustion where the combustion of the fuel takes place with pure O2 instead of air, eliminating the presence of N2 in the flue gases, so that CO2 is separated by H2O condensation.3
Hydrogen is considered one of the most promising alternatives to meet the energy demand as it has a high energy content and produces zero CO2 emissions when used for combustion processes if available as blue hydrogen (integrated with CCUS) or green hydrogen (generated from renewables such as water electrolysis or biomass gasification). Conventionally, hydrogen is produced from fossil fuels and mostly employed in the energy and chemical industry: more than 50% of hydrogen is used for ammonia production while other main uses are oil refining and methanol production4 with increasing demand over the coming years as given by demand projections.5 Feedstock for hydrogen production is mostly fossil fuel based, generating approximately 830 million tonnes of CO2 each year, surpassing the total CO2 emissions of the United Kingdom and Indonesia combined.6
Steam methane reforming (SMR) is the most used and mature technology, accounting for three quarters of the total annual production.7,8 However, the endothermic character of the SMR reaction makes the process energy intensive with H2 manufacturing contributing to 3% of the global CO2 emissions, making it an urgent field of research to reduce emissions.9
In order to produce H2 with CO2 capture, extra separation steps are required in the process. In the case of SMR, the heat required for the endothermic reactor is provided by fuel combustion in a furnace, producing flue gas. CO2 capture only from the syngas stream is limited to 60% of the total CO2, while the additional CO2 capture from the furnace flue gases requires an extra separation unit.10 The most used technique for the separation of CO2 in hydrogen production is absorption with the use of chemical (MEA, TEA and MDEA) or physical (Rectisol®, Selexol™, and Purisol®) solvents.11–13 Nevertheless, novel technologies have been developed for CO2 separation in hydrogen production including cryogenic separation,14 membranes,15 sorption-enhanced hydrogen production16 and chemical looping.17
Chemical looping reforming is one of the emerging technologies to produce H2 with near zero CO2 emissions, where high purity CO2 separation is integrated into the fuel conversion step.18,19 Chemical looping reforming has been proposed in three different configurations featuring interconnected fluidised bed reactors,20 moving bed reactors21 and packed bed reactors.22 Based on the state-of-the-art technologies in SMR and ATR where reforming takes place in packed bed reactors, Spallina et al.23 introduced the CLR concept implemented in packed bed reactors (CLR-PB). As shown in Fig. 1, the process is comprised of three steps. During the first one, air is fed into a reactor containing a metal catalyst (usually Ni, Cu, Fe, or Mn) called the oxygen carrier (OC). The air oxidizes the OC with the exothermic reaction increasing the temperature inside the bed and heat is accumulated. The main product of oxidation is N2 at high temperature which can be used for high temperature heat production or power generation in a combined cycle. The second step required is to reduce the OC by using a low-grade fuel available in a chemical plant such as the off-gas of the PSA unit,24 the venting fuel in gas-to-liquid plants (methanol, Fischer–Tropsch synthesis) or direct reduction of iron.25 The main gaseous products in this step are CO2 and H2O, where CO2 can be easily separated with high purity after water condensation and sent for long term storage or used as feedstock in case of carbon capture and utilisation (CCU). As reduction reactions are usually close to heat neutral, most of the heat generated in the reactor during oxidation is available in the solid material at high temperature and it is used for the final step, the catalytic and endothermic methane reforming. During this step H2O and/or CO2 are fed along with natural gas into the reactor and steam/dry reforming takes place to produce syngas.
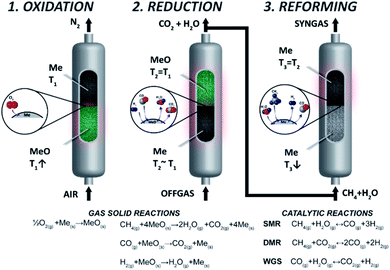 |
| | Fig. 1 CLR-PB process steps. Reproduced from ref. 24 with the permission of Elsevier. | |
Packed bed reactors are broadly used in the chemical industry, with steam methane reforming being one of the most important applications. Multi-tubular fired reactors use a furnace to provide the necessary heat (FTR) and auto-thermal reformers (ATR) use air or oxygen, with the heat provided by the partial oxidation of natural gas.8 The performance of packed bed chemical reactors (e.g., conversion, yield, catalyst stability) is strongly dependent on the temperature profile of the reactor, therefore the understanding and modelling of the profiles (axial and radial) is essential at the design stage. Temperature is a crucial parameter for a safe reactor design in order to avoid any unwanted products and potential hot spots in the reactor leading to potential hazards, and also a very important one to maximize process efficiency. Several approaches have been implemented to measure temperature with thermocouples placed in various positions inside and outside the reactors.26,27 One popular method is the use of a thermowell (large metal casing) placed concentrically in the bed, containing thermocouples at different points in the axial direction.28,29 Thermowells are being used in lab and pilot scale reactors30–32 and also in industrial reactors where they are placed in selected tubes to monitor the process conditions.33
Reactor modelling is used to simulate the reactor's performance and provides essential foreground for reactor design and changes in the reactor operation. The presence of the thermowell inside the reactor is an important parameter which must be considered as it has considerable heat capacity and as it may cover a significant volume inside the reactor tube, affecting its packing and operation, especially for lab scale units. A pseudo-homogeneous model to describe the inclusion of the thermowell has been developed by Pirkle et al.34 while later Landon33 derived an empirical equation to describe the presence of the thermowell in an exothermic reaction simulation. Dixon and Wu35 studied the flow in packed beds and the effect of the thermowell at different tube-to-particle ratios by using computational fluid dynamics (CFD) simulations, while later on they included exothermic reactions in their model.36 Chen et al.37 developed a 2-D model containing a thermowell to validate the results of their pilot-plant reactor for the reaction of naphtha hydrotreatment (overall exothermic reaction, with lumped ΔH0 = −101.1 kJ mol−1). Hamers et al.32 developed a 1-D model for chemical looping combustion using syngas to validate the experimental results for oxidation and reduction experiments in a lab scale reactor containing a thermowell with 20 measurement points by including the thermal inertia of the thermowell in the energy balance of the reactor, thus predicting more accurately the temperature change of the solid material.
In this paper, a one-dimensional (1-D) and a two-dimensional (2-D) model have been developed to validate the experimental results for a CLR packed bed reactor. The lab-scale reactor contains a thermowell (OD 6.35 mm) placed concentrically to measure the temperature at 10 points along the axial direction while the system is heated by an external furnace. The simulations cover a range of operating conditions for the oxidation, reduction and reforming stages, by operating the process at different flow rates, pressures, temperatures and compositions very close to relevant industrial conditions.
2 Methodology
2.1 Experimental setup
The experimental setup consists of a packed bed reactor of length 1050 mm, internal diameter 35 mm and outer diameter 60 mm in a special alloy (253 MA) as shown in Fig. 2 (left and centre), capable of operating at 1000 °C and 20 bar built by Array Industries B.V. (https://www.arrayindustries.com). A thermowell of 6.35 mm diameter is inserted from the gas inlet point (bottom side) and placed concentrically in the tube, consisting of 10 measuring points (K-type thermocouples (TCs)) with a 75 mm length interval built by Endress+Hauser (https://www.uk.endress.com). An external furnace capable of heating up to 1200 °C is used to regulate the reactor's temperature while insulation material has been placed at the bottom and top of the furnace to reduce heat losses. As an oxygen carrier and reforming catalyst, 440 grams of Ni supported on CaAl2O4 have been used, with a particle size of 1.0–1.4 mm and an overall bed length of 400 mm. Six thermocouples are therefore able to measure the reactive zone with the first TC being TC3 (at z = 5 mm of the reactive zone) and the last one being TC8 (at z = 380 mm of the reactive zone). Inert material (Al2O3) has been placed before and after the reactive zone to ensure a good gas mixing and preheating. The flow rate and composition of feed gases are regulated by mass flow controllers (Bronkhorst) while pressure is regulated by a digital back pressure regulator. After the reactor the gases are air-cooled, steam is condensed, and the gases are fed to a mass spectrometer (Hiden QGA) and CO analyser (Siemens) as shown in Fig. 2 (right).
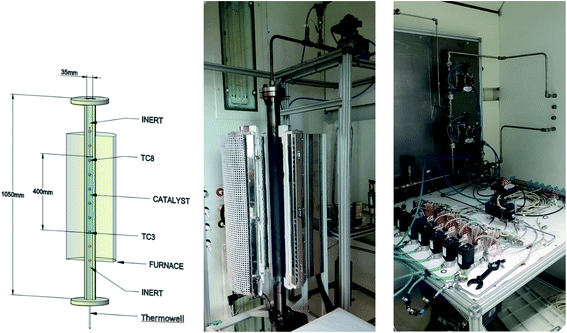 |
| | Fig. 2 (Left) CLR packed bed reactor schematic; (center) packed bed reactor system placed in FC-2 at the University of Manchester; (right) gas feeding system placed in FC-1.38 | |
2.2 Design of experiments
Reactor performance has been examined against a range of operating conditions presented in Table 1. He is used as a tracer in oxidation with air and reduction with H2 and syngas, while in the case of reduction with CH4 and dry reforming it is used to obtain a total flow rate of 12 NLPM.
Table 1 Operating conditions for the experiments the model has been tested against
|
|
Oxidation |
Reduction |
Dry reforming |
| Air |
H2 |
Syngas |
CH4-rich |
CH4 + CO2 (+inert) |
|
All the experiments tested at different pressures and temperatures refer to a flow rate of 10 NLPM. 40 NLPM is used only for validation at higher flow rate at 600 °C initial bed temperature and 1 bar.
|
| Flow rate (NLPM) |
10–40a |
10 |
10 |
12 |
12 |
| Temperature (°C) |
500–600 |
600–900 |
700–900 |
| Pressure (bar) |
1–5 |
1–5 |
1–5 |
| Composition (mol%) |
|
|
|
|
|
|
| N2 |
40.0 |
— |
70.0 |
— |
— |
— |
| Air |
50.0 |
90.0 |
— |
— |
| H2 |
— |
20.0 |
10.0 |
— |
— |
| CO |
— |
— |
10.0 |
— |
— |
| CO2 |
— |
— |
70.0 |
50.0 |
50.0 |
| CH4 |
— |
— |
— |
8.3 |
8.3 |
| He |
10.0 |
10.0 |
10.0 |
41.7 |
41.7 |
All the experiments have been designed and performed to operate as close as possible to realistic industrial conditions despite the limitations associated with a laboratory scale reactor. The experiments have been designed so that N2 (at a flow rate of 5 NLPM) was flowing through the bed and the furnace was set to the temperature setpoint until a stable temperature profile is reached.
3 Modelling
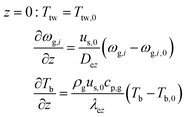
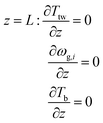
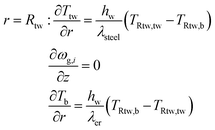
Two models have been developed and compared against experimental results. The first model is a 1-D pseudo-homogeneous axially dispersed model; the second is a 2-D pseudo-homogeneous axially and radially dispersed model. In both models, the pressure drop has been neglected given that it was never higher than 0.1 bar, and thus not relevant for the purpose of this work. The thermowell has been modelled in both cases. In the 1-D model, an energy balance is used for the thermowell as shown in eqn (4) where the heat exchange between the thermowell and the bed is included. In the energy balance for the bed (eqn (3)) both the heat exchanges for the thermowell and the reactor wall are included. For the 2-D model, a heat balance (eqn (8)) is applied from the center of the tube (r = 0) up to the thermowell's radius to ensure that the boundary condition is enforced at the correct radial length. From the thermowell (R = Rtw) up to the reactor's wall (R = Rt), eqn (7) is applied for the reactor bed. Heat losses occur through the reactor wall as well as at the extremities of the reactor which are located outside the furnace. The implementation of these axial heat losses would significantly increase the complexity of the model and the computation time especially for the 2-D model as the dispersion effects for the inert material needed to be accounted for. The stainless steel material of the reactor wall has a high thermal conductivity (>26 W m−1 K−1) which results in a negligible difference between the inside and outside temperatures of the reactor wall with the resistance to heat transfer accounting for approximately 3.4% of the total resistance, as also demonstrated by Chen et al.37 A typical axial temperature profile across the whole tube (with furnace setpoint at 900 °C) is presented in Fig. 3: the catalytic beds at the inlet (left side) and outlet (right side) are at lower temperature due to heat losses in the axial direction with a more pronounced effect at the inlet where the N2 is flowing. Temperature at TC8 – the last thermocouple inside the reactor bed – is balanced at 882.8 °C after sufficient time, 20 °C lower than the furnace set temperature. In the case that a temperature of 900 °C is selected for the reactor wall across the reactor bed, TC8 (8th TC from the left in Fig. 3) would eventually balance out at 900 °C instead of 882.8 °C. As heat dispersion from the inert material has been neglected, a compromising solution is to set the wall temperature at TC8 at 882.8 °C, thus minimizing the deviation from the actual heat behaviour. The temperature of the feed gases is initially ambient (25 °C) and is gradually preheated up to 817.1 °C where the first thermocouple (TC3) is located at the beginning of the reactor bed. The flow rates used in the experiments are always larger (10–40 NLPM) than the ones used for setting the initial bed temperature (5 NLPM) which results in further cooling of the first part of the bed. TC2 – located in the inert material before the bed and measuring 723.5 °C, approximately 100 °C lower than TC3 – is used as an indicator of the temperature drop so that the inlet gas temperature in the reactor is calculated from the TC2 temperature readings increased by 100 °C.
 |
| | Fig. 3 Axial tube temperature profile when furnace temperature is set at 900 °C. | |
The PDEs for the mass and energy balance are presented in eqn (1)–(4) for the 1-D model and in eqn (5)–(8) for the 2-D model.
1-D gas phase mass balance:
| |  | (1) |
1-D solid phase mass balance:
| |  | (2) |
1-D combined gas–solid energy balance:
| |  | (3) |
with:
1-D thermowell energy balance:
| |  | (4) |
Axial boundary conditions:
2-D gas phase mass balance:
| |  | (5) |
2-D solid phase mass balance:
| |  | (6) |
2-D combined gas–solid energy balance:
| |  | (7) |
2-D thermowell energy balance:
| |  | (8) |
Radial boundary conditions:
Thorough details of the discretization methods and the solvers used as well as the calculation of the parameters can be found in the Appendix.
3.1 Kinetics
Oxidation and reduction with H2 and CO (eqn (9)–(11)) kinetics were taken from Medrano et al.39 and the implementation of the pressure effect on the kinetics by Hamers et al.40 The kinetics were derived from a shrinking core model implementing chemical and ash diffusion effects, validated with a Ni/CaAl2O4 catalyst. The kinetic model equations are presented in eqn (12)–(15) and the kinetic parameters in Table 2. This model has been corrected from previous versions published in the literature. A correction is made in eqn (13) where the term b (solid–gas mole ratio) was not reported correctly in previously published studies. Further details and the actual derivation are included in the Appendix.
Table 2 Kinetic parameters for the Ni/CaAl2O4 oxidation and reduction
|
|
Medrano39 |
| H2 |
CO |
O2 |
|
C
s (mol m−3) |
89![[thin space (1/6-em)]](https://www.rsc.org/images/entities/char_2009.gif) 960 960 |
89![[thin space (1/6-em)]](https://www.rsc.org/images/entities/char_2009.gif) 960 960 |
151![[thin space (1/6-em)]](https://www.rsc.org/images/entities/char_2009.gif) 200 200 |
|
r
0 (m) |
3.13 × 10⁻⁸ |
3.13 × 10⁻⁸ |
5.8 × 10⁻⁷ |
|
k
0 (mol1−n m3n−2 s−1) |
9.0 × 10⁻⁴ |
3.5 × 10⁻³ |
1.2 × 10⁻³ |
|
E
A (kJ mol−1) |
30 |
45 |
7 |
|
n
|
0.6 |
0.65 |
0.9 |
|
D
0 (mol1−n m3n−1 s−1) |
1.7 × 10⁻³ |
7.4 × 10⁶ |
1 |
|
E
D (kJ mol−1) |
150 |
300 |
0 |
|
k
x
|
5 |
15 |
0 |
|
b
|
1 |
1 |
2 |
|
q
|
0.75 |
0.85 |
1.05 |
Oxidation
| | | O2 + Ni → NiO, ΔH0 = −479.4 kJ molO2−1 | (9) |
Reduction
| | | H2 + NiO → H2O + Ni, ΔH0 = −2.125 kJ molH2−1 | (10) |
| | | CO + NiO → CO2 + Ni, ΔH0 = −43.26 kJ molCO−1 | (11) |
| |  | (12) |
H2 & CO reduction
| |  | (13) |
| |  | (14) |
| |  | (15) |
Concerning the catalytic reforming and shift reactions (eqn (16)–(18)), kinetics from Xu and Froment41 were used. The kinetic model equations are presented in eqn (19)–(24) and the kinetic parameters are given in Tables 3 and 4.
| | | CH4 + H2O ↔ CO + 3H2, ΔH0 = 206.1 kJ mol−1 | (16) |
| | | CO + H2O ↔ CO2 + H2, ΔH0 = −41.15 kJ mol−1 | (17) |
| | | CH4 + 2H2O ↔ CO2 + 4H2, ΔH0 = 165.0 kJ mol−1 | (18) |
| | 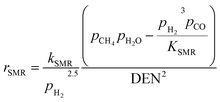 | (19) |
| |  | (20) |
| | 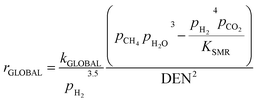 | (21) |
| |  | (22) |
| |  | (23) |
| |  | (24) |
Table 3 Pre-exponential parameters and activation energies
|
k
0,SMR (mol bar0.5 g−1 s−1) |
k
0,WGS (mol bar−1 g−1 s−1) |
k
0,GLOBAL (mol bar0.5 g−1 s−1) |
E
A,SMR (kJ mol−1) |
E
A,WGS (kJ mol−1) |
E
A,GLOBAL (kJ mol−1) |
| 1.17 × 10¹² |
5.43 × 10² |
2.83 × 10¹¹ |
240.1 |
67.13 |
243.9 |
Table 4 Pre-exponential constants for adsorption constants and enthalpy change of adsorption
|
K
0,CO
|
K
0,H2
|
K
0,CH4
|
K
0,H2O |
ΔHabs,CO (kJ mol−1) |
ΔHabs,H2 (kJ mol−1) |
ΔHabs,CH4 (kJ mol−1) |
ΔHabs,H2O (kJ mol−1) |
| 8.23 × 10⁻⁵ |
6.12 × 10⁻⁹ |
6.65 × 10⁻⁴ |
1.77 × 10⁵ |
−70.65 |
−82.90 |
−38.28 |
88.68 |
4 Results and discussion
4.1 Model validation
The model validation was carried out using the oxidation cycle step which has the highest heat of reaction (see eqn (9)), thus presenting the sharpest temperature increase and therefore being the most sensitive step. Oxidation with 20% O2 and 600 °C initial bed temperature has been selected as it was the experimental oxidation with the highest solid conversion (above 85% Ni to NiO conversion). Moreover, the operating conditions are very close to industrial applications since simulated air is used (diluted with He as a tracer) and initial bed temperatures are 500–600 °C, as expected after the reforming stage.42 The gas breakthrough curves were used for validation in all the examined cases to determine the solid conversion achieved (reaction front). Both models present a very good match to the experimental results (Fig. 4 left), with the 2-D model being accurate also in the prediction of the heat front (temperature drop after the initial increase). The temperature versus time profiles were used as they provide more details of the kinetic behaviour and the heat losses by logging the temperature recording every second. Only TC3 is not described well by the 2-D model due to its proximity to the beginning of the bed: the lower temperature at this point (90 °C lower than the set temperature) caused by heat losses and the cooling of the feed gases leads to lower conversion. The difference between the temperature profiles recorded from the 1-D and the 2-D models is explained by the additional term used for the heat losses from the bed film surrounding the thermowell, while in the 1-D model the heat losses are calculated from the average bed temperature.
 |
| | Fig. 4 (Left) Thermowell temperature profiles for the experiment (solid lines), the 1-D model (dashed lines) and the 2-D model (dashed dotted lines) for 20% O2, 600 °C set bed temperature and 1 bar pressure; (right) temperature for the experimental thermowell (solid lines) and bed average temperature 1-D model (dashed lines) and 2-D model (dashed dotted lines) for 20% O2, 600 °C set bed temperature and 1 bar pressure. Temperature has been radially averaged for the case of the 2-D model. | |
The bed radially averaged 2-D results provided a 10 °C higher temperature than the 1-D model at each position of the reactor (Fig. 4 right), a similar trend to the temperature results for the thermowell. As expected, the radially average temperature increase inside the bed is significantly higher and sharper than the temperature recorded from the TCs (∼100 °C higher). This is an important highlight that was not possible to show in our previous work25 as it influences the design and operation of the reactor from safety and material stability points of view. Due to the thermowell's inertia to temperature swings, the temperature varies at a slower rate than the bed one as shown by the sharp peaks in the bed temperatures compared to the smoother ones formed by the plot of the experimental results recorded from the thermowell. The use of a detailed model represents therefore an important achievement which was not otherwise possible in terms of maximum average temperature achieved (1097 °C in the bed instead of 1000 °C in the thermowell at TC7) and ultimately the maximum temperature rise that is expected for the tested material.
In Fig. 5, the evolution of the 2-D temperature profile during oxidation is plotted. The reaction front is moving across the bed elevating temperature with the highest values produced symmetrically to the axis of the reactor. The highest temperature in the reactor is 1181 °C, at 280 seconds, 68% of the total cycle time, at z = 265 mm and it is located at Rt/3 from the centre of the reactor's tube (2.7 mm from the thermowell's wall and 11.7 mm from the tube's wall) as the wall temperature is always lower than the temperature of the thermowell in this experiment. This is another very important observation as the reactor can momentarily develop temperatures up to 181 °C higher than the reading from the thermocouples and this may be crucial for safe reactor operation. In all timeframes, the thermowell temperature is lower than the maximum of the bed, an effect of the lower response time to the temperature variations.
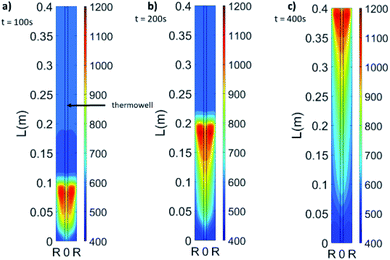 |
| | Fig. 5 2-D model radial profiles for 20% O2, 600 °C set bed temperature and 1 bar pressure at 100 seconds (a), 200 seconds (b) and 400 seconds (c). | |
The results obtained in terms of mass flow rates and compositions were identical for the 2 models as the radial mass dispersion has a marginal impact on axial profiles, showing good agreement with the experimental breakthrough as shown in Fig. 6.
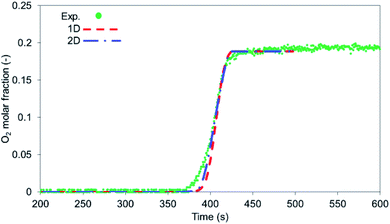 |
| | Fig. 6 O2 breakthrough comparison between the experiment (circular markers) and 1-D model (red dashed line) and radially averaged 2-D model (blue dashed dotted line), flow rate 10 NLPM, bed temperature 600 °C and pressure 1 bar. | |
The comparison of the 1-D and 2-D models has shown an overall difference of 2.5% in the maximum temperature increase for the thermowell simulations and about 1% to the average bed temperature, demonstrating that the 1-D model implemented with heat losses and dispersion reflects accurately the expected result of the system. Further results in terms of model validation refer to the 1-D model given the remarkable difference in computation time (∼21 times faster) compared to the 2-D model.
4.1.1 Oxidation.
The model has been tested against a range of conditions in terms of pressure, temperature, composition and flow rate. In Fig. 7, the O2 molar outlet for different temperatures (500 and 600 °C initial bed temperature) and various pressures (1 to 5 bar) is presented for a 20% O2 concentration, with the model predicting well the O2 breakthrough curves. In all scenarios, the experimental values seem more dispersed than the model and this is explained by the extra dispersion inside the support material after the bed, but also along the tubes and the cooler up to the mass-spec detection. As shown in Fig. 8a and b, the comparison of experiments and modelling of the temperature profiles at initial solid temperatures/pressures of 500 °C/3 bar and 600 °C/5 bar, respectively, are presented: the model captures well the temperature rise as well as the maximum temperature achieved which reflect the reaction front along the bed, not affected by the external empty volume of piping and coolers. The oxygen carrier capacity for each case has been selected based on the results during the previous reduction case as amply discussed in our previous work.25 In these 20% O2 cases, 78.1% Ni-to-NiO conversion occurs in the 500 °C/3 bar case, while 90.7% of the solid conversion is obtained at 600 °C/5 bar, which was the highest conversion achieved for the examined oxidation experiments. Lower initial bed temperatures lead to lower solid conversion as demonstrated in our previous study43 but also from previous kinetic studies for the same material.39 This difference is reflected also in the maximum temperature increase achieved in each case, 468.9 °C compared to 531 °C respectively, as the temperature increase is dependent on the effective active weight OC content as shown in eqn (25).44 Increased pressure for this flow rate leads to higher conversion due to lower gas velocity and therefore higher residence time. Moreover, even though pressure has a negative effect on the kinetics (see the model in eqn (14) from the kinetic study of Hamers et al.40), the experimental results appear to be more dispersed than the model with increasing pressure leading to more dispersion caused by gas mixing in the tubes and the water condenser after the reactor. However, as demonstrated and discussed in our previous study43 the pressure effect is quite limited when tested against higher flow rates (40 NLPM) in the examined pressure range (1–5 bar). This behaviour is attributed to the mass transfer limitations that have an increased influence at lower flow rates, while their effect is quite reduced at higher flow rates as also demonstrated by the kinetic studies from San Pio et al.45| |  | (25) |
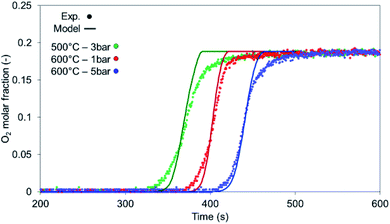 |
| | Fig. 7 O2 breakthrough comparison between the experiments (circular markers) and 1-D model (solid lines), at a flow rate of 10 NLPM. | |
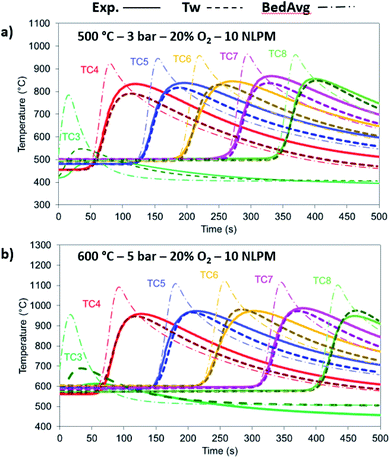 |
| | Fig. 8 Comparison between the experimental (solid lines), 1-D thermowell model (dashed lines) and 1-D bed model (dashed dotted lines) temperature for 20% O2 and 10 NLPM with (a) 500 °C/3 bar and (b) 600 °C/5 bar. | |
At 500 °C, the material is not entirely converted at the beginning and at the end of the bed due to the lower solid temperatures caused by the heat losses and the cooler gas feed leading to the model over-predicting the temperature rise.
The 10% O2 concentration cases have been examined in terms of flow rate, with 10 NLPM and 40 NLPM flow rates corresponding to 0.25 m s−1 and 1 m s−1 superficial velocity, respectively, with the latter representing an industrial scenario. As shown from the O2 breakthrough in Fig. 9 and from the temperature profiles in Fig. 10a and b, the model is in good agreement with the experimental results. In terms of O2 breakthrough, the breakthrough in the 10 NLPM case appears to be slightly more mass dispersed than the results predicted by the model, while in the case of 40 NLPM the results match very well. This can be explained by the higher gas velocity downstream the reactor where any mixing and stabilisation of gas composition occurs at a lower time (about 4 times lower). The temperature profiles produce the expected results with the 1-D model providing slightly lower maximum temperatures (about 20 °C) than the experimental ones. In the 40 NLPM case, the temperatures predicted by the model corresponding to TC3 and TC4 (respectively 1st and 2nd TCs in the reactive zone) do not align with the experimental results, a result of the large gas flow being not pre-heated at the expected temperature, thus becoming colder (330 °C) and eventually leading to lower conversion at the beginning of the bed.
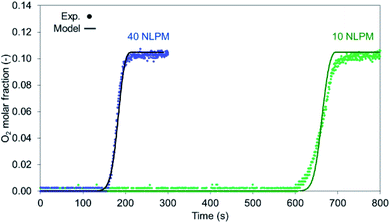 |
| | Fig. 9 O2 breakthrough for a high flow rate (40 NLPM – 1 m s−1) and lower flow rate (10 NLPM – 0.1 m s−1). | |
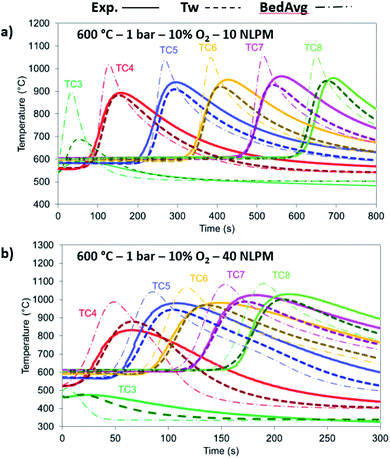 |
| | Fig. 10 Temperature comparison between the experimental (solid lines), 1-D thermowell model (dashed lines) and 1-D bed model (dashed dotted lines) temperature for 10% O2, 1 bar and 600 °C with (a) 10 NLPM and (b) 40 NLPM. | |
4.1.2 Reduction.
In the case of NiO reduction with H2, only a gas–solid reaction occurs, as there aren't any catalytic reactions taking place with the feed consisting of H2 (20%), N2 (70%) and He (10%) as tracer. Reduction with H2 is mildly exothermic, thus a small increase in temperature is recorded during experiments (about +30 °C), also shown by the model in Fig. 11 top.
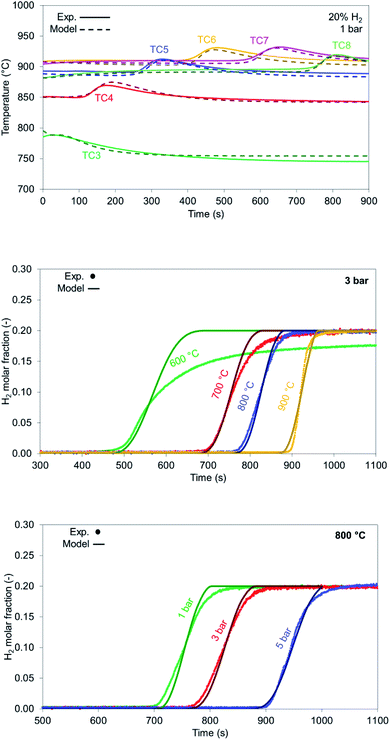 |
| | Fig. 11 (Top) Temperature profiles for the experiment (solid lines) and model (dashed lines) for reduction with 20% H2 at 900 °C, 1 bar and 10 NLPM; (middle) temperature comparison for H2 breakthrough during reduction with 20% H2 at 3 bar pressure and 10 NLPM flow rate; (bottom) pressure comparison for H2 breakthrough during reduction with 20% H2 at 800 °C and 10 NLPM flow rate. | |
H2 breakthrough curves for different bed temperatures are shown in Fig. 11 middle. The model aligns with the experimental results for all the cases examined except for the case with an initial solid temperature of 600 °C due to slow kinetics. The breakthrough occurs after 450 seconds with a resulting low solid conversion of NiO into Ni (approximately 63%). As bed temperature increases, solid conversion increases from 80% (700 °C) up to 97.7% (at 900 °C). It must be noted that solid reduction under industrial conditions occurs when the bed is at its maximum temperature, thus the process is always carried out under optimal conditions.
Increasing pressure leads to better conversion for the reduction cases as well (Fig. 11 bottom) with the 5 bar case reaching a conversion of 99.5% at 800 °C. In all the examined cases the slope generated from the model matches well the experimental results, where the experimental results appear to be more dispersed due to reasons explained in Section 4.1.
In case of reduction with syngas (see Table 1), the kinetics involve both gas–solid reactions between H2/CO and NiO as well as catalytic reactions such as RWGS. Carbon deposition does not occur in the presence of CO as sufficient CO2 is supplied in the feed. According to Fig. 12 top, the model predicts slightly faster kinetics (indicated by a sharper slope at the reaction front). The model predicts well the breakthrough values for the 900 °C case (Fig. 12 middle) with slightly sharper profiles, as well as the proper gas composition after NiO has been completely reduced and the the bed has not more oxygen left and it behaves effectively as cataytic reactor with mainly RWGS occurring, of CO (CO/H2 ratio >9 at the outlet). H2 breakthrough is sharper and comes later than the one for CO in the model as well (853 seconds for H2 and 803 seconds for CO), confirming the faster kinetics of H2 as a reducing agent compared to CO.
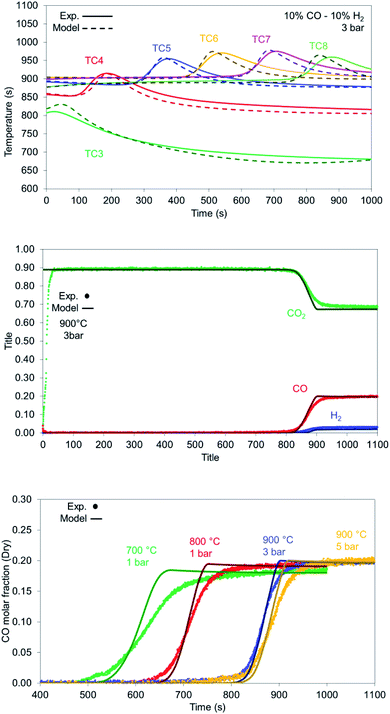 |
| | Fig. 12 (Top) Temperature profiles for the experiment (solid lines) and model (dashed lines) for reduction with 10% H2, 10% CO and 70% CO2 at 900 °C, 3 bar and 10 NLPM; (middle) gas breakthrough for reduction with 10% CO, 10% H2 and 70% CO2 (no He and H2O); (bottom) CO breakthrough during reduction for various bed temperatures and pressures for reduction with 10% CO, 10% H2 and 10 NLPM flow rate. | |
At lower bed temperatures, the experimental results seem to deviate even further from the model, presenting much slower kinetics than the model predicts. While conversion for 900 °C is high (>95%), it drops to 81.4% at 800 °C and to 74.4% at 700 °C indicating that the kinetic model implemented for the CO does not accurately describe the reduction at temperatures below 800 °C (Fig. 12 bottom).
In case of reduction with CH4-rich gas, a mixture of CO2 and CH4 (+He) with a CO2 to CH4 ratio of 6 has been selected. The breakthrough curves are predicted well from the model with the experimental results being more dispersed than the model (Fig. 13) while this effect is encountered in the temperature profile as well (Fig. 14 left). After the solid has been reduced, the the bed has not more oxygen left and it behaves effectively as cataytic reactor with mainly dry reforming occurring, (reported in Argyris et al.43) with a final composition very close to the thermodynamic equilibrium at 900 °C and 1 bar. CH4 slip occurs in the first 10 seconds in the experimental results (about 1%) as a consequence of CH4 not being able to reduce the OC used in this study (NiO/CaAl2O4). This would suggest a CH4–CaAl2O4 interaction that inhibits the reduction with CH4 since NiO supported on different materials (Al2O3, NiAl2O4, MgAl2O4, TiO2 and ZrO2) does react under different operating conditions. In the simulations, a 0.1% Ni content is used in the first 5 mm of the bed, which was enough to quickly convert the methane to CO and H2, so no methane slip was observed. All CH4 is converted in the first 70 mm of the bed (Fig. 14 right) while the CO and H2 generated reduce the bed, with the dry reforming reactions dropping the temperature in the first part of the bed (TC3 & TC4) and the exothermic reduction reactions raising the temperature in the rest of the bed (TC5–TC8).
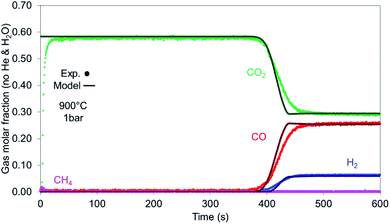 |
| | Fig. 13 Gases breakthrough for reduction with synthetic biogas (CO2![[thin space (1/6-em)]](https://www.rsc.org/images/entities/char_2009.gif) : :![[thin space (1/6-em)]](https://www.rsc.org/images/entities/char_2009.gif) CH4 – 6 CH4 – 6![[thin space (1/6-em)]](https://www.rsc.org/images/entities/char_2009.gif) : :![[thin space (1/6-em)]](https://www.rsc.org/images/entities/char_2009.gif) 1) for 900 °C and 1 bar. 1) for 900 °C and 1 bar. | |
 |
| | Fig. 14 (Left) Temperature profiles for the experiment (solid lines) and model (dashed lines) for reduction with synthetic biogas (CO2![[thin space (1/6-em)]](https://www.rsc.org/images/entities/char_2009.gif) : :![[thin space (1/6-em)]](https://www.rsc.org/images/entities/char_2009.gif) CH4 – 6 CH4 – 6![[thin space (1/6-em)]](https://www.rsc.org/images/entities/char_2009.gif) : :![[thin space (1/6-em)]](https://www.rsc.org/images/entities/char_2009.gif) 1) for 900 °C and 1 bar. (Right) Axial molar fraction profiles during reduction with synthetic biogas CO2 1) for 900 °C and 1 bar. (Right) Axial molar fraction profiles during reduction with synthetic biogas CO2![[thin space (1/6-em)]](https://www.rsc.org/images/entities/char_2009.gif) : :![[thin space (1/6-em)]](https://www.rsc.org/images/entities/char_2009.gif) CH4 – 6 CH4 – 6![[thin space (1/6-em)]](https://www.rsc.org/images/entities/char_2009.gif) : :![[thin space (1/6-em)]](https://www.rsc.org/images/entities/char_2009.gif) 1 for 900 °C and 1 bar. 1 for 900 °C and 1 bar. | |
When examined against different temperatures and pressures shown in Fig. 15, the model seems to perform well for the 900 °C cases (1 & 5 bar) while starting to deviate from the experimental values as temperature drops, an effect encountered in the syngas results as well.
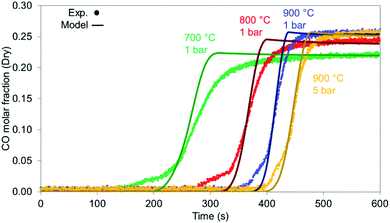 |
| | Fig. 15 CO breakthrough during reduction for various bed temperatures and pressures for reduction with synthetic biogas CO2![[thin space (1/6-em)]](https://www.rsc.org/images/entities/char_2009.gif) : :![[thin space (1/6-em)]](https://www.rsc.org/images/entities/char_2009.gif) CH4 – 6 CH4 – 6![[thin space (1/6-em)]](https://www.rsc.org/images/entities/char_2009.gif) : :![[thin space (1/6-em)]](https://www.rsc.org/images/entities/char_2009.gif) 1 for 900 °C and 1 bar. 1 for 900 °C and 1 bar. | |
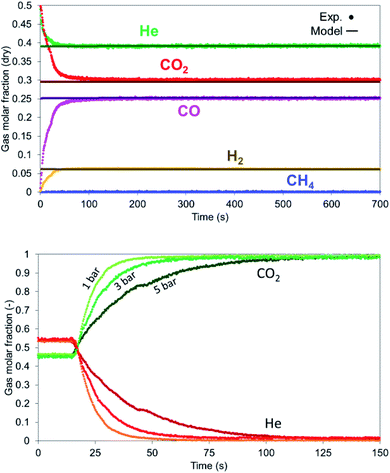 |
| | Fig. 16 (Left) Gas profiles during dry reforming at 900 °C, 1 bar, 12 NLPM flow rate and 6![[thin space (1/6-em)]](https://www.rsc.org/images/entities/char_2009.gif) : :![[thin space (1/6-em)]](https://www.rsc.org/images/entities/char_2009.gif) 1 – CO2 1 – CO2![[thin space (1/6-em)]](https://www.rsc.org/images/entities/char_2009.gif) : :![[thin space (1/6-em)]](https://www.rsc.org/images/entities/char_2009.gif) CH4. (Right) Dispersion effect at various pressures on the gas detection for a mixture of He and CO2. He valve is switched off at 20 seconds. CH4. (Right) Dispersion effect at various pressures on the gas detection for a mixture of He and CO2. He valve is switched off at 20 seconds. | |
The dispersion effect is more evident with the increase in pressure as encountered in all the experiments. When He and CO2 are fed in the system and He valve switches off, it takes 30 seconds to remove helium at 1 bar, 50 seconds at 3 bar and 90 seconds at 5 bar (Fig. 16 right).
The model predicts accurately the temperature decrease of the thermowell temperature (especially at the beginning of the bed) for 900 °C at 1 bar (Fig. 17 left), 3 bar (Fig. 18a) and 5 bar (Fig. 18b) where minor differences were encountered from the effect of pressure. As depicted in Fig. 17 left, only the recorded TC3 deviates from the average temperature demonstrating that at the beginning of the bed where most of the reforming occurs, the solid temperature drops very fast and the response of the TC to depict it is not fast enough. This demonstrates that in this zone the solid temperature drop is higher than the temperature recorded by the thermocouples, and unwanted phenomena such as carbon deposition may occur. In the remaining part of the bed, as the reaction extent is limited, the temperature change in each TC is limited and well detected also by the model.
 |
| | Fig. 17 (Left) Dry reforming temperature profiles for the experiment (solid lines), thermowell model (dashed lines) and bed average (dashed dotted lines). Conditions are 900 °C, 1 bar, 12 NLPM and CO2![[thin space (1/6-em)]](https://www.rsc.org/images/entities/char_2009.gif) : :![[thin space (1/6-em)]](https://www.rsc.org/images/entities/char_2009.gif) CH4 – 6 CH4 – 6![[thin space (1/6-em)]](https://www.rsc.org/images/entities/char_2009.gif) : :![[thin space (1/6-em)]](https://www.rsc.org/images/entities/char_2009.gif) 1 balanced with He. (Right) Axial temperature profiles for dry reforming for the experiment (diamond markers) and model (solid lines), at 900 °C, 1 bar, 12 NLPM and CO2 1 balanced with He. (Right) Axial temperature profiles for dry reforming for the experiment (diamond markers) and model (solid lines), at 900 °C, 1 bar, 12 NLPM and CO2![[thin space (1/6-em)]](https://www.rsc.org/images/entities/char_2009.gif) : :![[thin space (1/6-em)]](https://www.rsc.org/images/entities/char_2009.gif) CH4 – 6 CH4 – 6![[thin space (1/6-em)]](https://www.rsc.org/images/entities/char_2009.gif) : :![[thin space (1/6-em)]](https://www.rsc.org/images/entities/char_2009.gif) 1 balanced with He. 1 balanced with He. | |
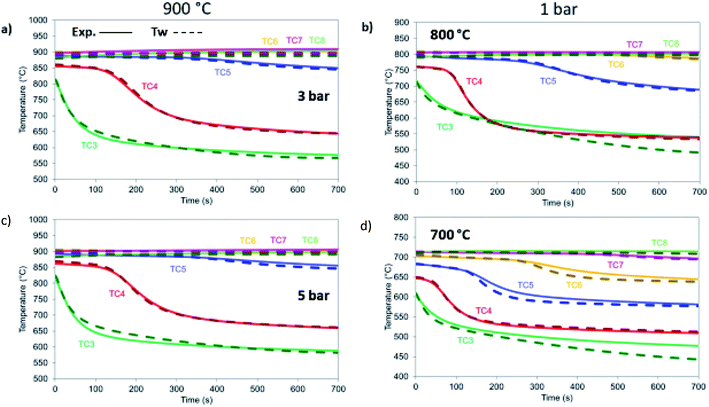 |
| | Fig. 18 Dry reforming under different temperature and pressure conditions. All cases are 12 NLPM, 6 : 1 CO2 : CH4 and balanced 8 with He: (a) 900 °C, 3 bar, (b) 800 °C, 1 bar, (c) 900 °C, 5 bar, (d) 700 °C, 1 bar. | |
The axial temperature thermowell profiles shown in Fig. 17 (right) present a better depiction of the way heat is removed from the reactor. The biggest drop in temperature is located in the first 50 mm of the bed while as time progresses more heat is being removed.
At different temperatures and pressures, the experimental results well align with the modelling prediction (Fig. 18) except for the case at 700 °C (Fig. 18d) with slight deviation in TC3 (40 °C lower than the experimental value) and TC6 and TC7 (with a difference of 22 °C). This is a combination of the 1-D heat loss model not being able to capture exactly the sharper temperature drop that takes place at lower temperatures and the fact that the kinetics used were derived for a catalyst with a different support. Nevertheless, the differences are limited in time making the 1-D model very appropriate for further reactor design.
5 Conclusion
Two mathematical models have been developed, a one-dimensional axially dispersed pseudo-homogeneous model and a two-dimensional axially and radially dispersed pseudo-homogeneous model, to simulate the dynamic behaviour of a chemical looping reforming packed bed reactor for oxidation, reduction and dry reforming in a range of different temperatures (500–900 °C), pressures (1–5 bar), flow rates (10–40 NLPM) and feed composition. The 2-D model delivered results in very good agreement with the experimental results, matching the experimental readings of the thermowell. The highest average bed temperature during oxidation was found to be 1097 °C – 100 °C higher than the thermowell's highest temperature at 1000 °C – with a total maximum of 1181 °C, located at z = 265 mm and r = Rt/3. The difference is attributed to the thermal inertia of the thermowell not being able to capture the sharp temperature differences in the bed. The 1-D model predicted well the temperatures of the thermowell with a small underestimation (2.5% lower than the 2-D model) but delivered a similar profile for the bed average temperature to the one predicted for the 2-D model (1% lower). Therefore, the 1-D model has been selected as the main model to test all the experimental data due to the significantly lower computation time (∼21 times faster) compared to the 2-D model. The maximum conversion in oxidation has been 90.7% at 600 °C and 5 bar resulting in a 534 °C maximum average bed temperature increase. Higher pressure has a positive effect on the solid conversion at 600 °C, 20% O2 and a flow rate of 10 NLPM, with 84.7% at 1 bar to 90.7% at 5 bar. Reduction with H2 and syngas modelling results presented very good agreement and gas breakthrough profiles at temperatures higher than 800 °C with an increasing deviation at lower temperatures due to incomplete conversion and overestimation of the kinetic model. In case of CH4 reduction, a 0.1% Ni at the first 5 mm of the bed was enough to convert the methane through dry reforming reactions to syngas. The feed consisted of CO2 and CH4 in a 6![[thin space (1/6-em)]](https://www.rsc.org/images/entities/char_2009.gif) :
:![[thin space (1/6-em)]](https://www.rsc.org/images/entities/char_2009.gif) 1 ratio, which justifies that with very few Ni sites available to activate the reforming, CH4 is quickly converted to syngas to reduce the bed. Reforming presented excellent agreement with the temperature of the thermowell which matched the average bed temperature apart from the first thermocouple TC3, where the temperature drop is significantly larger (up to 150 °C lower) than the thermowell, which cannot capture the sharp drop and is affected by the higher gas feed temperature as well.
1 ratio, which justifies that with very few Ni sites available to activate the reforming, CH4 is quickly converted to syngas to reduce the bed. Reforming presented excellent agreement with the temperature of the thermowell which matched the average bed temperature apart from the first thermocouple TC3, where the temperature drop is significantly larger (up to 150 °C lower) than the thermowell, which cannot capture the sharp drop and is affected by the higher gas feed temperature as well.
The developed models present a step forward in the chemical looping reforming modelling in packed bed reactors as they have been tested against a wide range of operating conditions presenting results with very good agreement. A 2-D model has been tested for the first time against nickel oxidation in a packed bed reactor containing a thermowell, illustrating a full profile axially and radially in the reactor bed, which emphasized the significant differences between the thermowell recording and the actual bed temperature. The 1-D model has been proven to be robust and efficient for providing very good results in a wide range of conditions, therefore constituting the basis for scale-up modelling and design.
Appendix
Model development and PDE discretization
Both models have been developed with the C++ programming language as it offers high-performance solutions, essential for the complexity of the developed models. For the axial mass and heat conversion terms in both models, a weighted essentially non-oscillatory (WENO) scheme has been used, more specifically a semi-discrete Buckley–Leverett equation with WENO 5th order flux reconstruction and Lax–Friedrichs (LF) flux splitting.46,47 This is a high order, high accuracy finite volume scheme which provided high accuracy solutions even with a limited number of grid points selected.48 For the radial convection terms in the 2-D model, a central-difference scheme has been used as the mass and temperature variations are expected to be considerably milder. Second-order central difference schemes have been used for all the dispersion/diffusion terms. A total of 80 grid points have been selected for the axial discretization (5 mm step) as higher grid point selection had a marginal effect on the results. Concerning the radial discretization in the 2-D model, 10 grid points (0.32 mm step) have been selected for the thermocouple radius (r: 0–3.175 mm) and 40 grid points (0.36 mm step) for the bed range (r: 3.175–17.5 mm) which proved to be sufficient to avoid any solution instabilities. An increase in the number of radial grid points proved to have no significant effect on the results. With the discretization of PDE space terms, the problem is solved as an initial value problem. A variable-step and variable-order solver is used49 for the time derivatives. The values for the relative and absolute error tolerances have been selected to prevent any oscillatory solutions but also to prevent a significant rise in computation time.
Parameter calculations
Gas density has been calculated according to the ideal gas law as shown in eqn (A1)| |  | (A1) |
The specific heat capacities for the gases and the solids as well as the enthalpies of formation were calculated by interpolating data from Barin's thermodynamic tables.50
Gas viscosities taken from the NIST online database, binary diffusivities from Fuller et al.51 and the Wilke mixing rule52 were used for both in terms of gas mix.
The mass axial dispersion coefficient is calculated from Edwards and Richardson53 in eqn (A2) and (A3).
| |  | (A2) |
| |  | (A3) |
The heat axial dispersion coefficient is calculated from Dixon and Cresswell54 in eqn (A4)–(A6).
| |  | (A4) |
| |  | (A5) |
| |  | (A6) |
Effective radial thermal conductivity has been calculated from eqn (A7)–(A13) taken from Zehner and Schlünder55,56 and Bauer and Schlünder.57
| |  | (A8) |
| |  | (A9) |
with
C = 1.25 for spherical particles
| |  | (A10) |
| |  | (A11) |
| |  | (A12) |
| |  | (A13) |
The wall heat transfer coefficient has been calculated with the suggestions from Dixon58 using the formula derived by Yagi and Kunii59 presented in eqn (A14)–(A20)
| |  | (A14) |
| |  | (A15) |
| |  | (A16) |
| |  | (A17) |
The overall heat transfer coefficient is calculated from the Dixon60 equation:
| |  | (A19) |
| |  | (A20) |
Deriving the shrinking core model
The shrinking core model used is ash diffusion and chemical reaction controlled. The equations taken from Levenspiel61 for spherical particles are as follows:| | | ttotal = tash diff + treaction | (A21) |
| | | tash diff = τash diff[1 − 3(1 − Xj)2/3 + 2(1 − Xj)] | (A22) |
| |  | (A23) |
| | | treaction = τreaction[1 − (1 − Xj)1/3] | (A24) |
| |  | (A25) |
The reactivity  is calculated using the derivative of eqn (A21) shown below:
| |  | (A26) |
Conflicts of interest
There are no conflicts to declare.
Abbreviations
| AR | Air reactor |
| ATR | Autothermal reforming |
| CLC | Chemical looping combustion |
| CLR | Chemical looping reforming |
| CLR-PB | Chemical looping reforming in packed bed reactors |
| DMR | Dry methane reforming |
| FR | Fuel reactor |
| FTR | Fired tubular reforming |
| GTL | Gas to liquid |
| NLPM | Normal liters per minute |
| OC | Oxygen carrier |
| RWGS | Reverse water gas shift |
| SMR | Steam methane reforming |
| TC | Thermocouple |
| TRL | Technology readiness levels |
| WGS | Water-gas shift |
| WGSR | Water-gas shift reactor |
Symbols (units)
|
A
| Heat exchange surface (m2) |
|
b
| Gas–solid stoichiometric factor (mols molg−1) |
| Bi | Tube biot number (hwRtλr−1) |
|
C
| Molar density (mol m−3) |
|
c
p
| Constant pressure specific heat capacity per unit mass for the gas (J kg−1 K−1) |
|
D
| Effective diffusion coefficient of a gaseous reactant in the ash layer (mg3 ms−1 s−1) |
|
D
ez
| Effective axial dispersion coefficient (mg3 mb−1 s−1) |
|
D
er
| Effective radial dispersion coefficient (mg3 mb−1 s−1) |
|
D
i,mix
| Molecular diffusivity of component i in a mixture (mg3 mg−1 s−1) |
|
D
0
| Diffusion pre-exponential factor (mol1−n m3n−1 s−1) |
|
d
p
| Particle diameter (m) |
|
d
t
| Tube internal diameter (m) |
|
e
| Emissivity |
|
E
A
| Activation energy (J mol−1) |
|
E
D
| Diffusion activation energy (J mol−1) |
|
h
| Convective heat transfer coefficient (J m−2 s−1 K−1) |
| ΔHTabs | Enthalpy change of adsorption (J mol−1) |
| ΔHT | Enthalpy change of reaction (J mol−1) |
|
K
| Equilibrium constant |
|
k
| Reaction rate constant (s−1) |
|
k
0
| Pre-exponential factor (s−1) |
| MM | Molecular mass (mol kg−1) |
|
N
| Number of components in the system |
|
n
| Reaction order |
| Nuw | Wall Nusselt number (hwdpλg−1) |
| Nuw0 | Wall Nusselt number at zero flow (hw0dpλg−1) |

| Wall film Nusselt number ( dpλg−1) dpλg−1) |
| Num | Mechanical fluid Nusselt number (hwmdpλg−1) |
|
p
| Gas partial pressure (bar) |
|
P
| Gas mixture pressure (bar) |
| Perf | Radial fluid Peclet number (usρgcpdpλr,g−1) |
| Perf,∞ | Limited value of Perf at high Re |
| Pr | Prandtl number (cpμ λg−1) |
|
R
| Gas constant (J mol−1 K−1) |
|
r
| Reaction rate (mol mb−3 s−1) |
|
r
0
| Particle radius (m) |
| Re | Reynolds number (dpusρgμ−1) |
|
R
t
| Tube radius (m) |
| Sc | Schmidt number (μ ρg−1Di,mix−1) |
|
T
| Temperature (K) |
|
t
| Time (s) |
|
U
| Overall heat transfer coefficient (W m−2 K−1) |
|
u
s
| Superficial gas velocity (mg3 mb−2 s−1) |
|
X
| Solid conversion |
|
z
| Axial length (m) |
Greek letters
|
ε
g
| Bed porosity (mg3 mb3) |
|
ε
p
| Particle porosity (mg3 mp3) |
|
ε
s
| Bed solid fraction (ms3 mb3) |
|
λ
| Thermal conductivity (J m−1 s−1 K−1) |
|
λ
ez
| Effective axial heat dispersion coefficient (J mb−1 s−1 K−1) |
|
λ
er
| Effective radial heat dispersion coefficient (J mb−1 s−1 K−1) |
|
μ
| Gas viscosity (Pa s) |
|
ρ
| Density (kg m−3) |
|
τ
| Time for complete solid particle conversion (s) |
|
ω
| Weight fraction (kg kg−1) |
Subscripts
| act | Active |
| avg | Average |
|
b
| Bed |
| g | Gas |
|
i
|
i
th gas component |
|
j
|
j
th solid component |
|
k
|
k
th reaction |
| ref. | Reference |
|
r
| Radial length (m) |
| s | Solid |
| tw | Thermowell |
| w | Wall |
| 0 | Initial |
Acknowledgements
The authors acknowledge the EPSRC project (BREINSTORM – EP/S030654/1) and the Department of BEIS in the framework of the Low Carbon Hydrogen Supply 2: Stream 1 Phase 1 Competition (TRN 5044/04/2021) (RECYCLE, HYS2137) for providing funding and support for development of this study. For the purpose of open access, the author has applied a Creative Commons Attribution (CC BY) licence to any Author Accepted Manuscript version arising.
References
-
Contribution of Working Group I to the Fifth Assessment Report of the Intergovernmental Panel on Climate Change, ed. T. F. Stocker, D. Qin, G.-K. Plattner, M. Tignor, S. K. Allen, J. Boschung, A. Nauels, Y. Xia, V. Bex and P. M. Midgley, Cambridge University Press, Cambridge, United Kingdom and New York, NY, USA, 2013, p. 1535 Search PubMed.
-
International Energy Agency, CCUS in Clean Energy Transitions – Analysis – IEA, https://www.iea.org/reports/ccus-in-clean-energy-transitions, accessed 24 January 2022 Search PubMed.
- A. I. Osman, M. Hefny, M. I. A. Abdel Maksoud, A. M. Elgarahy and D. W. Rooney, Environ. Chem. Lett., 2020, 192, 797–849 Search PubMed.
- R. Yukesh Kannah, S. Kavitha, Preethi, O. Parthiba Karthikeyan, G. Kumar, N. V. Dai-Viet and J. Rajesh Banu, Bioresour. Technol., 2021, 319, 124175 CrossRef CAS PubMed.
- A. Pareek, R. Dom, J. Gupta, J. Chandran, V. Adepu and P. H. Borse, Mater. Sci. Energy Technol., 2019, 3, 319–327 Search PubMed.
-
International Energy Agency, The Future of Hydrogen – Analysis – IEA, https://www.iea.org/reports/the-future-of-hydrogen, accessed 8 December 2021 Search PubMed.
- J. P. Van Hook and J. P. Van Hook, Catal. Rev., 1980, 21, 1–51 CrossRef CAS.
- L. Chen, Z. Qi, S. Zhang, J. Su and G. A. Somorjai, Catal, 2020, 10, 858 CrossRef CAS.
- C. E. Finke, H. F. Leandri, E. T. Karumb, D. Zheng, M. R. Hoffmann and N. A. Fromer, Energy Environ. Sci., 2021, 14, 1517–1529 RSC.
- M. Voldsund, K. Jordal and R. Anantharaman, Int. J. Hydrogen Energy, 2016, 41, 4969–4992 CrossRef CAS.
-
R. B. Gupta, Hydrogen fuel: production, transport, and storage, CRC Press, 2008 Search PubMed.
-
A. L. Kohl, R. Richard and B. Nielsen, Gas Purification 5th Edition, 1997, p. 1395, ISBN: 978-0-88415-220-0 Search PubMed.
-
A. Basile and A. Iulianelli, Advances in Hydrogen Production, Storage and Distribution, Elsevier Inc., 2014 Search PubMed.
- D. Aaron and C. Tsouris, Sep. Sci. Technol., 2005, 40, 321–348 CrossRef CAS.
- A. Brunetti, F. Scura, G. Barbieri and E. Drioli, J. Membr. Sci., 2010, 359, 115–125 CrossRef CAS.
- D. P. Harrison, Ind. Eng. Chem. Res., 2008, 47, 6486–6501 CrossRef CAS.
- M. Luo, Y. Yi, S. Wang, Z. Wang, M. Du, J. Pan and Q. Wang, Renewable Sustainable Energy Rev., 2018, 81, 3186–3214 CrossRef CAS.
- M. Rydén, A. Lyngfelt and T. Mattisson, Fuel, 2006, 85, 1631–1641 CrossRef.
- L. F. de Diego, M. Ortiz, F. García-Labiano, J. Adánez, A. Abad and P. Gayán, Energy Procedia, 2009, 1, 3–10 CrossRef CAS.
- A. Ugwu, A. Zaabout, F. Donat, G. Van Diest, K. Albertsen, C. Muller and S. Amini, Ind. Eng. Chem. Res., 2021, 60, 3516–3531 CrossRef CAS PubMed.
-
A. Abad, in Calcium and Chemical Looping Technology for Power Generation and Carbon Dioxide (CO2) Capture, Woodhead Publishing, 2015, pp. 327–374 Search PubMed.
- M. A. Pans, A. Abad, L. F. De Diego, F. García-Labiano, P. Gayán and J. Adánez, Int. J. Hydrogen Energy, 2013, 38, 11878–11892 CrossRef CAS.
- V. Spallina, B. Marinello, F. Gallucci, M. C. Romano and M. Van Sint Annaland, Fuel Process. Technol., 2017, 156, 156–170 CrossRef CAS.
- P. A. Argyris, A. Wright, O. Taheri Qazvini and V. Spallina, Chem. Eng. J., 2022, 428, 132606 CrossRef CAS.
-
The MIDREX® Process - Technology Brochure, 2018, https://www.midrex.com/ Search PubMed.
- J. C. Thoméo, C. O. Rouiller and J. T. Freire, Ind. Eng. Chem. Res., 2004, 43, 4140–4148 CrossRef.
- B. Sosna, Y. Dong, L. Chromow, O. Korup and R. Horn, Chem.-Ing.-Tech., 2016, 88, 1676–1683 CrossRef CAS.
- K. W. Hansen and S. B. Jørgensen, Chem. Eng. Sci., 1976, 31, 579–586 CrossRef CAS.
- A. G. Dixon and Y. Wu, Numer. Heat Transfer, Part A, 2019, 76, 811–829 CrossRef CAS.
- T. Ouni, M. Honkela, A. Kolah and J. Aittamaa, Chem. Eng. Process., 2006, 45, 329–339 CrossRef CAS.
- J. Chen, Z. Ring and T. Dabros, Ind. Eng. Chem. Res., 2001, 40, 3294–3300 CrossRef CAS.
- H. P. Hamers, F. Gallucci, G. Williams and M. Van Sint Annaland, Fuel, 2015, 159, 828–836 CrossRef CAS.
- V. G. Landon, Comput. Chem. Eng., 1996, 20, 475–481 CrossRef CAS.
- J. C. Pirkle, H. S. Kheshgi and P. S. Hagan, AIChE J., 1991, 37, 1265–1269 CrossRef CAS.
- A. G. Dixon and Y. Wu, Numer. Heat Transfer, Part A, 2019, 76, 811–829 CrossRef CAS.
- A. G. Dixon and Y. Wu, Chem. Eng. Res. Des., 2020, 159, 125–137 CrossRef CAS.
- J. Chen, Z. Ring and T. Dabros, Ind. Eng. Chem. Res., 2001, 40, 3294–3300 CrossRef CAS.
- F. Gallucci, H. P. Hamers, M. van Zanten and M. van Sint Annaland, Chem. Eng. J., 2015, 274, 156–168 CrossRef CAS.
- J. A. Medrano, H. P. Hamers, G. Williams, M. van Sint Annaland and F. Gallucci, Appl. Energy, 2015, 158, 86–96 CrossRef CAS.
- H. P. Hamers, F. Gallucci, G. Williams, P. D. Cobden and M. Van Sint Annaland, Energy Fuels, 2015, 29, 2656–2663 CrossRef CAS.
- J. Xu and G. F. Froment, AIChE J., 1989, 35, 88–96 CrossRef CAS.
- R. J. Lee Pereira, P. A. Argyris and V. Spallina, Appl. Energy, 2020, 280, 115874 CrossRef CAS.
- P. Alexandros Argyris, C. de Leeuwe, S. Z. Abbas, A. Amieiro, S. Poultson, D. Wails and V. Spallina, Chem. Eng. J., 2022, 435, 134883 CrossRef CAS.
- S. Noorman, M. Van Sint Annaland and H. Kuipers, Ind. Eng. Chem. Res., 2007, 46, 4212–4220 CrossRef CAS.
- M. A. San Pio, F. Gallucci, I. Roghair and M. van Sint Annaland, Int. J. Hydrogen Energy, 2017, 42, 12111–12121 CrossRef CAS.
-
B. Cockburn, C. Johnson, C.-W. Shu and E. Tadmor, Essentially non-oscillatory and weighted essentially non_oscillatory schemes for hyperbolic conservation laws, in Advanced Numerical Approximation of Nonlinear hyperbolic Equations, Lecture Notes in Mathematics, Springer-Verlag, Berlin, 1998, vol. 1697, pp. 325–432 Search PubMed.
- J. Smit, M. Van Sint Annaland and J. A. M. Kuipers, Chem. Eng. Sci., 2005, 60, 2609–2619 CrossRef CAS.
- J. Qiu and C. W. Shu, J. Comput. Phys., 2002, 183, 187–209 CrossRef.
- A. C. Hindmarsh, P. N. Brown, K. E. Grant, S. L. Lee, R. Serban, D. E. Shumaker and C. S. Woodward, ACM Trans. Math. Softw., 2005, 31, 363–396 CrossRef.
-
I. Barin and G. Platzki, Thermochemical data of pure substances, VCH, New York, 3rd edn, 1995 Search PubMed.
- E. N. Fuller, P. D. Schettler and J. C. Giddings, Ind. Eng. Chem. Res., 1966, 58, 18–27 CrossRef CAS.
- C. R. Wilke, J. Chem. Phys., 1950, 18, 517–519 CrossRef CAS.
- M. F. Edwards and J. F. Richardson, Chem. Eng. Sci., 1968, 23, 109–123 CrossRef CAS.
- A. G. Dixon and D. L. Cresswell, AIChE J., 1979, 25, 663–676 CrossRef CAS.
- P. Zehner and E. U. Schlünder, Chem. Ing. Tech., 1970, 42, 933–941 CrossRef CAS.
- P. Zehner and E. U. Schlünder, Chem. Ing. Tech., 1972, 44, 1303–1308 CrossRef CAS.
- R. Bauer and E. U. Schlüender, Int. J. Chem. Eng., 1978, 18, 189–204 Search PubMed.
- A. G. Dixon, Can. J. Chem. Eng., 2012, 90, 507–527 CrossRef CAS.
- S. Yagi and D. Kunii, AIChE J., 1960, 6, 97–104 CrossRef CAS.
- A. G. Dixon, Chem. Eng. Process., 1996, 35, 323–331 CrossRef CAS.
- O. Levenspiel, Ind. Eng. Chem. Res., 1999, 38(11), 4140–4143 CrossRef CAS.
|
| This journal is © The Royal Society of Chemistry 2022 |
Click here to see how this site uses Cookies. View our privacy policy here.  Open Access Article
 *
*


![[thin space (1/6-em)]](https://www.rsc.org/images/entities/char_2009.gif) 960
960![[thin space (1/6-em)]](https://www.rsc.org/images/entities/char_2009.gif) 960
960![[thin space (1/6-em)]](https://www.rsc.org/images/entities/char_2009.gif) 200
200


![[thin space (1/6-em)]](https://www.rsc.org/images/entities/char_2009.gif) :
:![[thin space (1/6-em)]](https://www.rsc.org/images/entities/char_2009.gif) CH4 – 6
CH4 – 6![[thin space (1/6-em)]](https://www.rsc.org/images/entities/char_2009.gif) :
:![[thin space (1/6-em)]](https://www.rsc.org/images/entities/char_2009.gif) 1) for 900 °C and 1 bar.
1) for 900 °C and 1 bar.
![[thin space (1/6-em)]](https://www.rsc.org/images/entities/char_2009.gif) :
:![[thin space (1/6-em)]](https://www.rsc.org/images/entities/char_2009.gif) CH4 – 6
CH4 – 6![[thin space (1/6-em)]](https://www.rsc.org/images/entities/char_2009.gif) :
:![[thin space (1/6-em)]](https://www.rsc.org/images/entities/char_2009.gif) 1 for 900 °C and 1 bar.
1 for 900 °C and 1 bar.![[thin space (1/6-em)]](https://www.rsc.org/images/entities/char_2009.gif) :
:![[thin space (1/6-em)]](https://www.rsc.org/images/entities/char_2009.gif) 1 ratio, which justifies that with very few Ni sites available to activate the reforming, CH4 is quickly converted to syngas to reduce the bed. Reforming presented excellent agreement with the temperature of the thermowell which matched the average bed temperature apart from the first thermocouple TC3, where the temperature drop is significantly larger (up to 150 °C lower) than the thermowell, which cannot capture the sharp drop and is affected by the higher gas feed temperature as well.
1 ratio, which justifies that with very few Ni sites available to activate the reforming, CH4 is quickly converted to syngas to reduce the bed. Reforming presented excellent agreement with the temperature of the thermowell which matched the average bed temperature apart from the first thermocouple TC3, where the temperature drop is significantly larger (up to 150 °C lower) than the thermowell, which cannot capture the sharp drop and is affected by the higher gas feed temperature as well.


 is calculated using the derivative of eqn (A21) shown below:


