 Open Access Article
Creative Commons Attribution 3.0 Unported Licence
Extended oligo-cyclopentadithiophene dyes for liquid and solid-state dye-sensitised solar cells†
Artit
Jarusarunchai
a,
Xuan
Liu
b,
Wenjun
Wu
 b and
Neil
Robertson
 *a
*a
aSchool of Chemistry, University of Edinburgh, King's Buildings, David Brewster Road, Edinburgh, EH9 3FJ, UK. E-mail: Neil.Robertson@ed.ac.uk
bKey Laboratory for Advanced Materials and Feringa Nobel Prize Scientist, Joint Research Center Shanghai Key Laboratory of Functional Materials Chemistry, School of Chemistry and Molecular Engineering, East China University of Science & Technology, 130 Meilon Road, Shanghai 200237, P. R. China. E-mail: wjwu@ecust.edu.cn
First published on 31st March 2022
Abstract
A new series of dyes called T-CPDT, without a strong electron-donor moiety, was designed, based on a combination of previously-reported CPDT and 5T dyes, and synthesised. By addition of a thiophene unit between alkylated CPDT unit(s) and the cyanoacrylic acid acceptor group, their optical, electrochemical and photovoltaic properties were tuned and studied. Upon extending CPDT units from 1 to 3, hence, T-CPDT-1, T-CPDT-2 and T-CPDT-3, the UV-Vis absorption undergoes a bathochromic shift together with a larger extinction coefficient, while the first oxidation potential is less positive. These dyes were applied in DSSC devices with I−/I3− electrolyte and with a Spiro-OMeTAD hole transporter. Among the T-CPDT series, T-CPDT-3 shows the highest PCE of 5.88% with I−/I3− electrolyte and 4.38% for a solid-state device, mainly due to larger Jsc and Voc. Their photovoltaic results with I−/I3− electrolyte were compared to those of CPDT-3 and 5T under the same conditions. We also show that the addition of the extra thiophene to CPDT-3, forming T-CPDT-3, leads to slower electron recombination kinetics, compared to those of CPDT-3 and 5T. Interestingly, the solid-state device with T-CPDT-3 achieves a very high Jsc of 11.27 mA cm−2 with a less than 1 micron thick TiO2 film which is unusually thin for solid-state devices.
Introduction
It has been around 30 years since dye-sensitised solar cells (DSSCs) emerged as a promising photovoltaic technology following the seminal report of efficient DSSCs by O'Regan and Grätzel.1 The working principle of DSSCs is closely related to photosynthesis by utilisation of dye molecules as a photo-absorber to generate electrons, which are subsequently transferred to a mesoporous semiconductor, mostly TiO2. There are three main classes of dyes that have been studied, namely Ru-polypyridyl complexes, Zn-porphyrin complexes and metal-free organic dyes.2 Out of these, metal-free organic dyes have been researched extensively due to their high extinction coefficient, availability of starting materials, flexible design and ease of tuning their electronic properties. These features enable compatibility with different types of DSSC architecture.2–5 The conventional metal-free organic dyes are designed based on the state-of-the-art donor–π–acceptor (D–π–A) structure. In this design, modification of the donors, π-conjugated spacers and acceptors plays the key role in tuning the dyes' electronic and electrochemical properties and thus, performance of DSSCs.In addition to the conventional motif, an additional donor or acceptor group has also been introduced into the D–π–A structure, yielding 2D–π–A or D–A′–π–A, respectively, in order to broaden and shift the absorption toward the red region.6,7 In addition, the π-conjugated spacers can also be modified to expand the absorption spectrum. There are three approaches that can be used to engineer the π-conjugated spacers: (1) variation of the spacer length to adjust the HOMO–LUMO gap; (2) change in the types of the spacers as the absorption is characteristic of the spacers; and (3) modification of the planarity of the spacers.8 The commonly used spacers are thiophene and its derivatives as they provide good π-conjugation and planarity.9 Since the planarity can be used to determine the degree of extended effective π-conjugation length, bridging the two neighbouring rings is used to maximise the planarity.8 In this case, 4H-cyclopenta[2,1-b:3,4-b′]dithiophene (CPDT) possesses more rigid conjugation and co-planarity, providing a higher absorption coefficient as well as electron-donating ability.10,11 Apart from that, CPDT also provides facile introduction of long alkyl chains which can help to prevent aggregation and prevent electron recombination.11–13
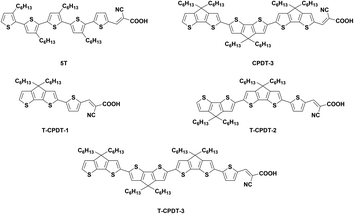
In contrast to the conventional D–π–A, Abate et al. removed the strong donor group carbazole of the MK-2 dye to obtain the 5T dye (Fig. 1), resulting in increased efficiency due to exclusively higher Voc in solid-state DSSCs (ssDSSCs) for 5T compared with MK-2.14 This study paved the way for a new strategy of dye design by omitting the strong donor moiety, but, instead, using the π-spacer as both donor and π-conjugation parts. In the ensuing year, a new series of dyes called CPDT (Fig. S1†) was designed and synthesised by using CPDT as the π-spacer.15 The coplanarity within CPDT units led to a bathochromic shift of λmax and higher extinction coefficients with increasing CPDT units, compared with the twisted structure of 5T due to larger dihedral angles between thiophene units. The efficiency of the devices based on the CPDT series and 5T was compared in liquid and solid-state DSSCs. The results showed that the CPDT-3 dyes (Fig. 1) achieved higher Jsc in both types of cells, especially in ssDSSC, but gave lower Voc than 5T, which was mainly due to recombination.
As seen from the 5T structure which has a thiophene unit attached directly to the cyanoacrylic acid, we hypothesise that a similar configuration may help the CPDT series to gain higher Voc. This is based on the assumption that this single thiophene unit reduces conjugation with the acceptor unit compared with a fused CPDT due to larger dihedral angles, which may prevent the recombination. Therefore, in this study, a new series of dyes called T-CPDT (Fig. 1) was designed and synthesised via an addition of one thiophene unit in between the CPDT units and cyanoacrylic acid as shown in Fig. 1, aiming to improve Voc, while retaining high Jsc. Their characteristic properties were determined by experimental and theoretical techniques, and the solar cell devices based on them were tested using both I−/I3− liquid electrolyte and 2,2′,7,7′-tetrakis(N,N-di-p-methoxy-phenyl-amine)-9,9′-spirobifluorene (Spiro-OMeTAD) as a HTM.
Results and discussion
Synthesis
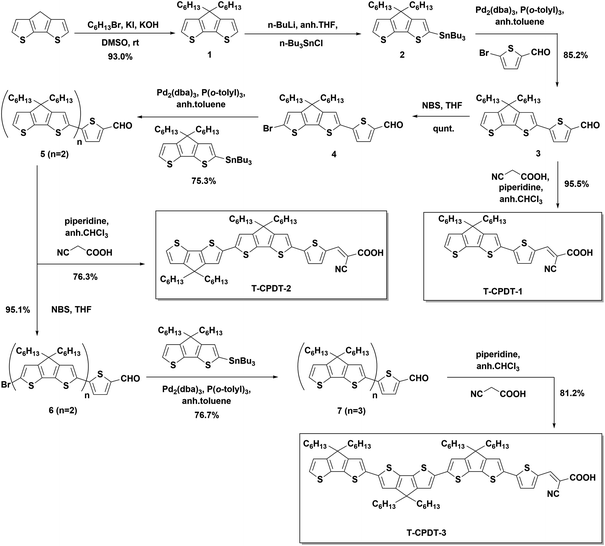
Scheme 1 presents the synthetic route which was used to synthesise the T-CPDT series for DSSC applications. The synthesis started with the alkylation of the CPDT unit with two hexyl chains to give compound 1 which subsequently underwent stannylation to compound 2. The Stille cross-coupling reaction was used to connect compound 2 with 5-bromothiophene-2-carbaldehyde to yield compound 3. T-CPDT-1 was synthesised via the Knoevenagel condensation catalysed by piperidine of compound 3 with 2-cyanoacetic acid. It was found that there are two isomers, (E)- and (Z)- of T-CPDT-1 in which the (E)-isomer is the major product with approximately 84![[thin space (1/6-em)]](https://www.rsc.org/images/entities/char_2009.gif) :
:![[thin space (1/6-em)]](https://www.rsc.org/images/entities/char_2009.gif) 16 of (E)
16 of (E)![[thin space (1/6-em)]](https://www.rsc.org/images/entities/char_2009.gif) :
:![[thin space (1/6-em)]](https://www.rsc.org/images/entities/char_2009.gif) (Z) determined by 1H NMR as shown in Fig. S2†. The separation between these two isomers was difficult but partially possible as the (E)-isomer was eluted before the (Z)-isomer by conventional column chromatography as seen in Fig. S2,† where 97% purity of the (E)-isomer was obtained. However, there is some part of the mixture that cannot be purified and ends up being eluted as the mixture. By performing the dry column vacuum chromatography (DCVC) technique,16 the purification is facilitated, but separation of the mixture is not improved. To synthesise compound 5, compound 3 was brominated to give compound 4, which subsequently reacted with compound 2via the Stille cross-coupling reaction. Compound 5 was used as a starting material to synthesise T-CPDT-2 by the Knoevenagel condensation, while in a separate reaction, the compound underwent the bromination reaction to give compound 6. The Stille cross-coupling reaction between compound 6 and compound 2 gave compound 7 which was followed by the Knoevenagel condensation to yield the final dye, T-CPDT-3. As opposed to T-CPDT-1, there is no observation of two isomers in either T-CPDT-2 or T-CPDT-3: only the (E)-isomer was observed in both products measured by 1H NMR.
(Z) determined by 1H NMR as shown in Fig. S2†. The separation between these two isomers was difficult but partially possible as the (E)-isomer was eluted before the (Z)-isomer by conventional column chromatography as seen in Fig. S2,† where 97% purity of the (E)-isomer was obtained. However, there is some part of the mixture that cannot be purified and ends up being eluted as the mixture. By performing the dry column vacuum chromatography (DCVC) technique,16 the purification is facilitated, but separation of the mixture is not improved. To synthesise compound 5, compound 3 was brominated to give compound 4, which subsequently reacted with compound 2via the Stille cross-coupling reaction. Compound 5 was used as a starting material to synthesise T-CPDT-2 by the Knoevenagel condensation, while in a separate reaction, the compound underwent the bromination reaction to give compound 6. The Stille cross-coupling reaction between compound 6 and compound 2 gave compound 7 which was followed by the Knoevenagel condensation to yield the final dye, T-CPDT-3. As opposed to T-CPDT-1, there is no observation of two isomers in either T-CPDT-2 or T-CPDT-3: only the (E)-isomer was observed in both products measured by 1H NMR.
Optical and electrochemical properties
Fig. 2 shows the UV-Vis absorption spectra of the T-CPDT series in DCM solution. A Beer–Lambert plot was applied to determine the extinction coefficients of each dye, and they all show linear behaviour over measured concentrations in the range of 5–20 μM, confirming no aggregation. Their corresponding optical properties are summarised in Table 1. These absorption spectra arise from intramolecular charge transfer (ICT) from the CPDT unit(s) to the cyanoacrylic acid group. From Fig. 2, it is clearly seen that the extension of the number of CPDT units leads to a bathochromic shift and higher extinction coefficient from T-CPDT-1 to T-CPDT-3. Adding one CPDT unit on T-CPDT-1 to form T-CPDT-2 causes a large bathochromic shift (63 nm, 2093 cm−1), while T-CPDT-3 shows a slight bathochromic shift compared to T-CPDT-2 (15 nm, 433 cm−1). The colour of the corresponding dye solution in DCM is pink, purple, and dark blue for T-CPDT-1, T-CPDT-2 and T-CPDT-3, respectively. Their optical gaps were calculated by extrapolation of the low-energy onset of their absorption peaks and are listed in Table 1. The additional thiophene unit also results in a further bathochromic shift when the T-CPDT dyes are compared to the analogous dyes in the CPDT series (Table 1). This is because the extra thiophene unit provides more conjugation; hence, the optical gap of the T-CPDT series is further reduced. However, as shown in Table 1, the extra thiophene unit reduces the extinction coefficient of the T-CPDT series, compared to the CPDT series. This might be due to the extra thiophene unit causing an overall larger dihedral angle in the T-CPDT series. Similar to the CPDT series, the coplanar CPDT unit(s) in the T-CPDT series results in a bathochromic shift and higher extinction coefficient than those in 5T.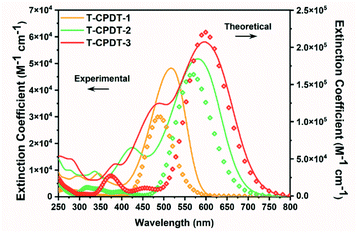 | ||
| Fig. 2 UV-Vis spectra of the T-CPDT series (solid lines) in DCM together with theoretical absorption spectra (dots) with a FWHM of 3000 cm−1 in DCM (PCM solvation model). | ||
| Dye | λ max (nm), ε (M−1 cm−1) | E optgap (eV) | E ox vs. NHEc (V) | E red vs. NHEc (V) | E HOMO (eV) | E LUMO (eV) | (V) |
|---|---|---|---|---|---|---|---|
a Absorption spectra were obtained in DCM.
b The optical energy gaps of the T-CPDT and the CPDT series were estimated by the onset of the corresponding dye's absorption spectrum.
c Potentials were measured in DCM with 0.3 M TBAPF6 as a supporting electrolyte versus Fc/Fc+ and were converted to be against NHE by addition of 0.63 V.17
d
E
HOMO energy was calculated from the equation of −1.4(Eoxvs. Fc/Fc+) − 4.6 (eV).18
e
E
LUMO energy was estimated from the equation of −4.88 − (Eredvs. Fc/Fc+) (eV).19
f Excited state oxidation potential  was calculated from Eox − Eoptgap.
g The data were taken from ref. 15, except for Eoptgap, EHOMO, ELUMO and was calculated from Eox − Eoptgap.
g The data were taken from ref. 15, except for Eoptgap, EHOMO, ELUMO and  . .
|
|||||||
| T-CPDT-1 | 518, 48![[thin space (1/6-em)]](https://www.rsc.org/images/entities/char_2009.gif) 000 000 |
2.14 | 1.18 | −1.42 | −5.37 | −2.83 | −0.96 |
| T-CPDT-2 | 581, 53![[thin space (1/6-em)]](https://www.rsc.org/images/entities/char_2009.gif) 000 000 |
1.83 | 0.81 | −1.39 | −4.85 | −2.86 | −1.02 |
| T-CPDT-3 | 596, 58![[thin space (1/6-em)]](https://www.rsc.org/images/entities/char_2009.gif) 000 000 |
1.76 | 0.66 | −1.35 | −4.64 | −2.90 | −1.10 |
| CPDT-1 | 456, 49000g | 2.43 | 1.46g | −1.54g | −5.76 | −2.71 | −0.97 |
| CPDT-2 | 546, 54000g | 1.94 | 0.89g | −1.48g | −4.96 | −2.77 | −1.05 |
| CPDT-3 | 585, 74000g | 1.77 | 0.71g | −1.44g | −4.71 | −2.81 | −1.06 |
| 5T | 478, 39000g | 2.15 | 1.08g | −1.29g | −5.23 | −2.96 | −1.07 |
Cyclic voltammetry and square-wave voltammetry were carried out to estimate oxidation and reduction potentials and electrochemical reversibility of the T-CPDT series. HOMO and LUMO energies were calculated based on oxidation and reduction potentials, respectively. The results are tabulated in Table 1. The cyclic voltammogram of T-CPDT-1 (Fig. S3†) shows that the oxidation process of T-CPDT-1 is not fully chemically or electrochemically reversible within the time scale of electrochemical measurement. In contrast, T-CPDT-2 and T-CPDT-3 exhibit two reversible oxidation processes as shown in Fig. S3†. For the reduction processes as shown in the square-wave voltammograms (Fig. 3A), T-CPDT-1 to T-CPDT-3 all show a reversible reduction process. Fig. 3A also illustrates that adding more CPDT units shifts the oxidation potential to a less positive potential from T-CPDT-1 to T-CPDT-3. Furthermore, T-CPDT-3 undergoes further oxidation at a smaller additional potential than T-CPDT-2. On the other hand, more CPDT units do not affect the reduction potentials much, which indicates that the cyanoacrylic acid moiety determines the reduction processes. When compared to the CPDT series, the additional thiophene unit between CPDT and cyanoacrylic acid leads to even less positive oxidation potentials and slightly less negative reduction potentials as shown in Table 1.
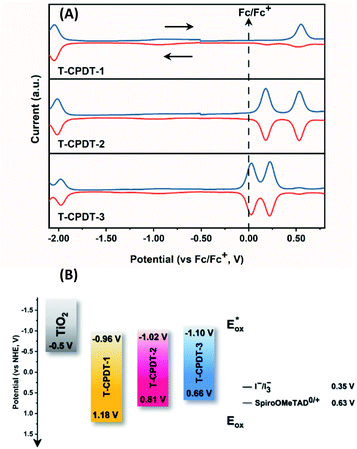 | ||
| Fig. 3 (A) Square-wave voltammograms of the T-CPDT series in DCM and (B) energy alignment of the T-CPDT series in comparison with TiO2 and commonly used electrolytes (the redox potential values were taken from ref. 20 and 21). | ||
Fig. 3B represents the energy diagram of the T-CPDT series along with a typical value of the conduction band (CB) potential of TiO2 and redox potentials of the redox couples for the DSSCs used here. All the oxidation potentials of the T-CPDT series are more positive than the standard redox potential of I−/I3− electrolyte. This suggests sufficient dye regeneration. However, T-CPDT-3 has a slightly more positive oxidation potential (Eox) than that of Spiro-OMeTAD (0.63 V vs. NHE21), which indicates that dye regeneration might be slow when used in a solid-state based device with this HTM. Their excited-state oxidation potentials  are more negative than the CB edge (ECB) potential of TiO2 (−0.5 V vs. NHE20), confirming sufficient driving force for electron injection from the excited dyes to the CB of TiO2.
Computational study
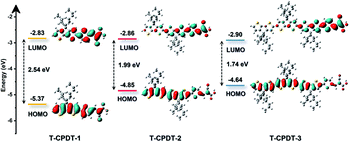
To gain insight into the frontier molecular orbitals of the T-CPDT series, DFT calculations were performed to optimise the dye geometry and their electron distribution. Fig. 4 shows the orbital distribution and electronic energy levels of the T-CDPT series in the DCM solvation model. The HOMO (highest occupied molecular orbital) of all molecules is mainly delocalised over the CPDT units. In contrast, the LUMO (lowest unoccupied molecular orbital) is shifted toward the cyanoacrylic acid group with some character on the additional thiophene unit. Thus, these computational results support the electrochemical results in terms of the relationship between oxidation and reduction potentials and HOMO and LUMO, respectively. Moreover, the calculations show a larger extent of separation between the HOMO and LUMO when more CPDT units are present in the structure. Time-dependent DFT (TDDFT) calculations were carried out to investigate the electronic transitions, and the results are shown in Fig. 2 and Table 2. The calculated electronic transitions correspond to those of the experimental ones: more CPDT units lead to a bathochromic shift and higher extinction coefficient. As shown in Table 2, the % MO contributions of the most intense transition obtained from the calculations with corresponding oscillator strengths (f) show that the transition character from the HOMO to the LUMO is predominant. When the molecule has greater conjugation, the involvement of the HOMO-1 and LUMO+1 becomes a larger contribution as seen in T-CPDT-3. Regarding the oscillator strength, its value increases along with the length of CPDT units, indicating higher probability of the transition.| Dye | λ max (nm) | % MO contribution | f |
|---|---|---|---|
| T-CPDT-1 | 491 | HOMO to LUMO (92%) | 1.47 |
| T-CPDT-2 | 569 | HOMO to LUMO (79%) | 2.62 |
| T-CPDT-3 | 599 | HOMO to LUMO (61%) | 3.04 |
| HOMO-1 to LUMO (17%) | |||
| HOMO to LUMO+1 (13%) |
Photovoltaic performances
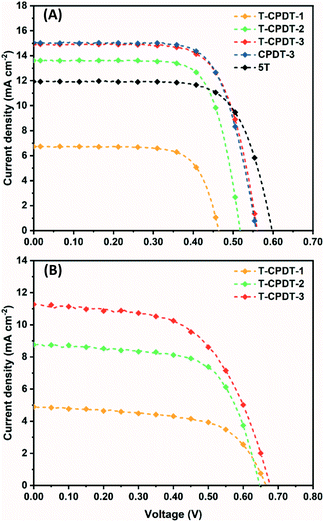
The photovoltaic performances of the T-CPDT series were examined in both liquid (I−/I3−) and solid-state (Spiro-OMeTAD as the HTM) DSSCs. For liquid-based devices with the T-CPDT series only, the corresponding current–voltage (J–V) curves of the best devices are shown in Fig. 5A, and the results are tabulated in Table 3. From the results, it is clearly seen that the device with T-CPDT-3 achieved the highest power conversion efficiency (PCE) of 5.88%, followed by T-CDPT-2 with a PCE of 5.19% and T-CPDT-1 with a PCE of 2.27%, respectively. The higher Jsc and Voc from T-CPDT-3 than those of T-CPDT-2 and T-CDPT-1 are the main reasons for the higher PCE for T-CPDT-3 than the others. For the ssDSSCs with T-CPDT, the corresponding J–V curves of the best devices are shown in Fig. 5B, and the results are tabulated in Table 3. Similarly, T-CPDT-3 achieved the highest PCE mainly due to higher Jsc and Voc. The Jsc from the best solid-state device based on T-CPDT-3 (11.27 mA cm−2) is astonishingly high with the TiO2 film thickness less than 1 μm (0.96 μm in this work). It is worth mentioning that the optimised TiO2 film thickness in ssDSSCs is generally around 2 μm.22,23 Although T-CPDT-3 achieved higher Jsc and Voc, it suffers from low ff, which is likely due to the low dye regeneration driving force as suggested in Fig. 5B. It is also worth mentioning that T-CPDT-3 as suggested in Fig. 5B exhibits a good performance (4.38% from the best cell) among ssDSSCs with Spiro-OMeTAD and the same additives (Table S1†). Recently, there has been some interesting work on new dyes (S524 and AQ31025) for ssDSSCs with Spiro-OMeTAD, which show outstanding PCEs (around 8%). They both exhibit comparable Jsc (with a 2.2 μm TiO2 layer) to T-CPDT-3 but higher Voc and ff. This implies that the improvement in Voc and ff for T-CPDT-3 is needed in order to achieve higher PCE.| Dye | Electrolyte | J sc (mA cm−2) | V oc (V) | ff | PCE (%) | Dye loading (mol cm−2) |
|---|---|---|---|---|---|---|
| a The average results in brackets were calculated from 4 individual cells for I−/I3− electrolyte and from 8 individual cells for the Spiro-OMeTAD HTM. | ||||||
| T-CPDT-1 | I −/I3− | 6.72 (6.55 ± 0.13) | 0.46 (0.47 ± 0.03) | 0.73 (0.71 ± 0.02) | 2.27 (2.18 ± 0.08) | 1.45 × 10⁻⁷ |
| T-CPDT-2 | I −/I3− | 13.61 (13.49 ± 0.94) | 0.52 (0.51 ± 0.01) | 0.73 (0.71 ± 0.02) | 5.19 (4.93 ± 0.18) | 1.70 × 10⁻⁷ |
| T-CPDT-3 | I −/I3− | 14.90 (14.88 ± 0.88) | 0.56 (0.55 ± 0.01) | 0.71 (0.68 ± 0.02) | 5.88 (5.60 ± 0.27) | 1.88 × 10⁻⁷ |
| CPDT-3 | I −/I3− | 15.07 (14.37 ± 0.53) | 0.56 (0.56 ± 0.01) | 0.71 (0.68 ± 0.05) | 5.95 (5.53 ± 0.35) | 1.85 × 10⁻⁷ |
| 5T | I −/I3− | 11.92 (11.65 ± 0.22) | 0.60 (0.59 ± 0.01) | 0.71 (0.73 ± 0.01) | 5.06 (5.03 ± 0.05) | 2.35 × 10⁻⁷ |
| T-CPDT-1 | Spiro | 4.90 (4.34 ± 0.30) | 0.66 (0.65 ± 0.01) | 0.61 (0.61 ± 0.01) | 1.98 (1.72 ± 0.13) | — |
| T-CPDT-2 | Spiro | 8.82 (8.13 ± 0.69) | 0.65 (0.65 ± 0.01) | 0.65 (0.64 ± 0.02) | 3.70 (3.36 ± 0.29) | — |
| T-CPDT-3 | Spiro | 11.27 (10.17 ± 0.76) | 0.68 (0.67 ± 0.01) | 0.58 (0.53 ± 0.07) | 4.38 (3.59 ± 0.45) | — |
The improvement of Jsc with increasing the number of CPDT units can be explained in terms of larger conjugation leading to a higher extinction coefficient and an expansion of the absorption peak towards 800 nm. The IPCE can be explained in terms of injection efficiency (φinj), charge collection efficiency (ηcol), light harvesting efficiency (LHE(λ)), and dye regeneration efficiency (φreg) as shown in eqn (1):26
| IPCE = LHE(λ) × φinj × φreg × ηcol | (1) |
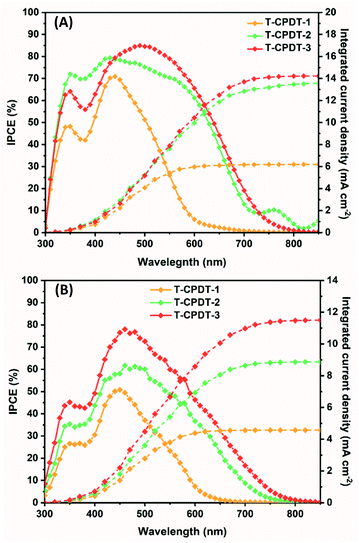
Considering the driving force for charge injection by the difference between their  and CB of TiO2, they are greater than 0.2 V, which indicates fast injection rate considered to be nearly unity.27 Moreover, sufficient driving force for dye regeneration is guaranteed as mentioned above. By comparing their absorption spectra shown in Fig. 2, it suggests that the LHE(λ) has an influence on the improvement of Jsc. As seen in Fig. 6A and B, T-CPDT-3 shows the broadest IPCE over a range of 400–700 nm and an extension to around 800 nm with a maximum IPCE of approximately 85% for the liquid-based device and 80% for the solid-state device. Although T-CPDT-2 exhibits high IPCE in the range of 300–400 nm and broad IPCE over almost the same range as T-CPDT-3 for liquid-based devices, its maximum IPCE is around 80%, which is lower than that of T-CPDT-3. For solid-state devices, T-CPDT-2 clearly shows lower IPCE than that of T-CPDT-3. A narrow range and small IPCE values are observed for T-CPDT-1 in both types of devices, which explains why it attained the smallest Jsc. The integrated Jsc values from their corresponding IPCE are in good agreement with the experimental results from J–V measurement.
To probe the postulation that the additional thiophene unit in the T-CPDT series, compared to CPDT-3 and 5T, would improve Voc, devices with T-CPDT, CPDT-3 and 5T were fabricated for liquid-based devices. The results are tabulated in Table 3. The devices with T-CPDT-3 and CPDT-3 achieved comparable PCE and Jsc while 5T had lower Jsc compared to them. The lower Jsc in 5T originates from a lower absorption coefficient (Table 1) than those of T-CPDT-3 and CPDT-3, hence, lower light harvesting capability under the same device conditions i.e., the same thickness of TiO2. In contrast to the PCE and Jsc results, 5T achieved the highest Voc, while T-CPDT-3 and CPDT-3 showed approximately the same Voc, followed by T-CPDT-2 and T-CPDT-1, respectively. Therefore, the additional thiophene did not help to improve Voc. However, the extra thiophene unit did not lead to detrimental performances as evidenced by the improved overall performance of T-CPDT-1 and the improved Jsc of T-CPDT-2 when compared to CPDT-115 and CPDT-2,15 respectively.
Electrochemical impedance spectroscopy (EIS)
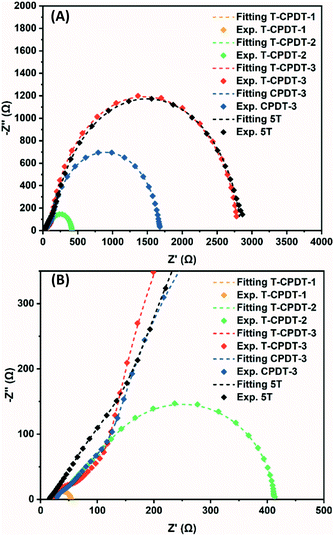
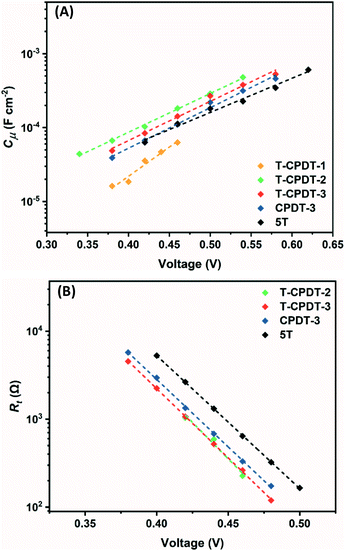
According to the performance results, differences in Voc within the T-CPDT series and among the T-CPDT, CPDT-3 and 5T were observed. In order to clarify these differences, impedance spectroscopy (EIS) measurements on liquid-based devices were performed in the frequency range between 0.1 MHz and 0.05 Hz under LED illumination at various forward biases. The EIS spectra were fitted using the transmission line model,28 and the equivalent circuit is shown in Fig. S4†. The EIS spectra exhibit a typical DSSC feature where the Pt/electrolyte interface charge transfer and TiO2/dye/electrolyte interface are represented by the first semicircle at high frequencies and the middle semicircle at intermediate frequencies, respectively, as shown in Fig. 7.29Fitting of the EIS spectra enabled chemical capacitance (Cμ), transport resistance (Rt) and charge recombination resistance (Rrec) at the TiO2/dye/electrolyte interface to be extracted. Since a constant phase element (CPE) is often used in EIS fitting, the equivalent capacitance of the CPE, hereafter Cμ, is calculated by eqn (2):29,30
 | (2) |
 | (3) |
The dependence of electron transport resistance (Rt) on voltage can be explained viaeqn (4)28,32 shown below:
 | (4) |
The differences in ECB can originate from the dipole moment of the dye as shown in Fig. 9. The dipole moment of dyes can affect the energetics of the TiO2 electrode according to eqn (5):34
 | (5) |
 is the dipole moment component of individual molecules perpendicular to the surface, γ is the dye surface concentration, and ε0 and ε are the dielectric constant of the monolayer and the permittivity of the vacuum, respectively. Assuming that the orientation of the dyes is perpendicular to the TiO2 surface by using the cyanoacrylic acid group to bind on the surface,
  can be represented by μtotal in which it points outwards from the TiO2 surface as shown in Fig. 9. This direction of the negative dipole moment is known to induce an upward shift of ECB as it aligns the electron-rich end of the molecule on the TiO2 surface.34 Thus, the larger the magnitude of
  , the more negative the shift (electrochemical scale) in the TiO2 CB, leading to higher Voc. As shown by the results in Fig. 9, the largest μtotal is seen from CPDT-3 > T-CPDT-3 > T-CPDT-2 > T-CPDT-1 > 5T. Therefore, the μtotal results seem to agree well with the trend in Cμ, except for 5T which has the lowest μtotal, but the highest ECB as mentioned above. However, the ΔECB also depends on γ as suggested in eqn (5). The dye desorption results indicate that the dye loading amount of 5T is the highest as shown in Table 3. This may contribute to an overall greater upward shift of ECB in 5T. It is noteworthy that the dye orientation may not be perfectly perpendicular to the TiO2 surface in the real situation. This can also cause some variation in the ECB shift according to eqn (5). Notwithstanding this caveat, the dipole moment and dye coverage results seem to be important parameters determining the trend in the ECB shift.
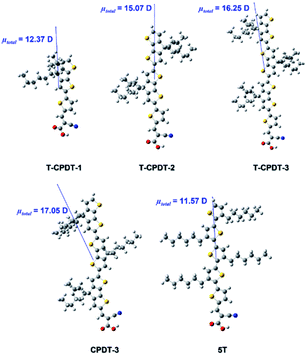 | ||
| Fig. 9 The total dipole moment from the T-CPDT series, CPDT-3 and 5T calculated by DFT with DCM (PCM solvation model). | ||
The trends shown in the conduction band energy (Fig. 8A and B) contribute significantly to the different Voc across the devices that possess similar α (T-CPDT-2, T-CPDT-3, CPDT-3 and 5T); however, for a complete picture, it may be necessary to also analyse the electron recombination process at the TiO2/dye/electrolyte interface. In terms of the electron recombination process, the recombination resistance (Rrec) and electron lifetime (τn) can be used to quantify the recombination between electrons in TiO2 and the redox couple in the electrolyte.35 While Rrec can be extracted from fitting the impedance spectrum, τn can be determined by the relationship between Cμ and Rrec as shown in eqn (6):29
| τn = CμRrec | (6) |
To decouple the contribution of voltage to the electron recombination in different devices, fitting Rrec and τn as a function of electron density (n) is used, and n can be determined viaeqn (7):36
 | (7) |
Fig. 10A and B illustrate, respectively, the Rrec and τn as a function of electron density, in which their values decrease exponentially with increasing electron density. From the Rrec results in Fig. 10A, it can be seen that T-CPDT-3 has the largest Rrec followed by 5T, CPDT-3, T-CPDT-2 and T-CPDT-1. In line with Rrec, the same trend is also observed in τn as shown in Fig. 10B. This suggests that the electron recombination with the redox electrolyte in the device with T-CPDT-3 is impeded most effectively among the studied dyes, hence, the longest τn.
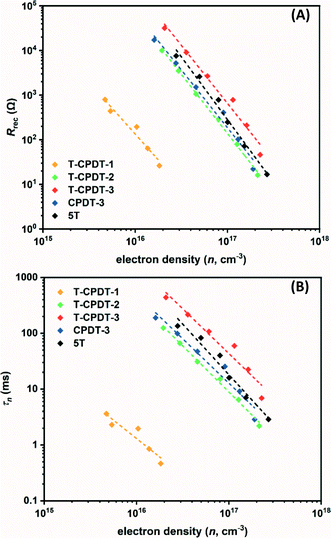 | ||
| Fig. 10 (A) Recombination resistance (Rrec) and (B) electron lifetime (τn) as a function of electron density (n). | ||
To rationalise the electron recombination results, it can be linked to the dye structure. In the dye design, long alkyl chains are normally introduced into the structure to prevent aggregation and electron recombination.11–13 Due to the hydrophobic properties of long alkyl chains, they can prevent hydrophilic redox ions, such as I3−, from approaching the TiO2 surface, leading to a decrease in the I3− concentration near the TiO2 surface, hence, suppression of electron recombination.35,37 As shown in Fig. 1, T-CPDT-3 has 6 hexyl chains alternating in the opposite orientation, whereas T-CPDT-2 and T-CPDT-1 have 4 and 2 hexyl chains, respectively. As a result, T-CPDT-3 can prevent the electron recombination more effectively among the T-CPDT series, contributing to the enhancement of Voc from T-CPDT-1 to T-CPDT-3. Interestingly, the addition of the thiophene unit to CPDT-3 yielding T-CPDT-3 increases Rrec and τn, which is not normal as the longer π-conjugation is likely to facilitate the electron recombination.38,39 This might be attributed to the extra thiophene in T-CPDT-3 mitigating the electron recombination by separating the last CPDT unit and cyanoacrylic acid group, which further decreases the I3− concentration near the TiO2 surface. In addition, the overall larger dihedral angles of T-CPDT-3 with respect to CPDT-3 (from the UV-Vis results) may also contribute to slower electron recombination kinetics. As a result, the electron recombination is less likely to occur. The same rationale of the number of alkyl chains can also be used to explain the difference in Rrec and τn between T-CPDT-3 and 5T as T-CPDT-3 has more hexyl chains than 5T, hence, higher Rrec and τn in T-CPDT-3. Although T-CPDT-2 and 5T have the same number of hexyl chains, there is a difference in recombination kinetics between them. This might be attributed to the dye coverage results shown in Table 3, revealing that there is more 5T on the TiO2 surface, compared to T-CPDT-2.
According to the EIS results, one can summarise the trend in different Voc with the extra thiophene unit in the T-CPDT series, CPDT-3 and 5T in terms of the ECB shift and electron recombination kinetics. Among the T-CPDT series, it is clear that T-CPDT-1 and T-CPDT-2 show faster recombination kinetics, and also lower ECB in T-CPDT-2, compared with T-CPDT-3, CPDT-3 and 5T. Thus, they achieved lower Voc compared to T-CPDT-3, CPDT-3 and 5T. Comparing T-CPDT-3 and CPDT-3, the former has lower ECB, but this is compensated by slower electron recombination kinetics attributed to effectively blocking I3− from approaching the TiO2 surface, which eventually leads to similar Voc. Comparing T-CPDT-3 and 5T, the ECB upwards shift in 5T due to larger dye coverage is more pronounced than the slower electron recombination kinetics in T-CPDT-3; hence, the highest Voc is in the device with 5T. For Voc trends in ssDSSCs, we believe that the study of EIS among the T-CPDT series in liquid-based devices can also be applied to solid-state devices.
Conclusions
A new series of dyes called T-CPDT (denoted as T-CPDT-1, T-CPDT-2 and T-CPDT-3) was designed and synthesised, using linked CPDT units and adding a thiophene unit between CPDT and cyanoacrylic acid units. The optical properties of the T-CPDT series show that the increase in CPDT units leads to a bathochromic shift. The electrochemical characterisation reveals that the oxidation potential becomes less positive with increasing CPDT units. When compared to the CPDT counterpart dyes without the added thiophene, the addition of thiophene causes a bathochromic shift and lower oxidation potential. The DSSC results based on the T-CPDT series with I−/I3− electrolyte and Spiro-OMeTAD as the HTM show that Jsc, Voc and PCE increase upon addition of CPDT units with the champion cell of T-CPDT-3 achieving 5.88% and 4.38% for the I−/I3−-based cell and solid-state cell, respectively. A comparison of the liquid-based DSSC with CPDT-3 and 5T was made under the same conditions. The devices with T-CPDT-3 and CPDT-3 show similar J–V results in all aspects, while the device with 5T attains higher Voc but lower Jsc and PCE than T-CPDT-3. The EIS results reveal that the additional thiophene unit leads to slower electron recombination kinetics which subsequently prolongs the electron lifetime in T-CPDT-3, compared to CPDT-3. However, the dipole moment of T-CPDT-3 becomes lower with this extra thiophene, compared to CPDT-3. As a result, they give similar Voc attributed to compensation of these effects of the additional thiophene. The EIS results also show that although 5T has faster electron recombination kinetics and a shorter electron lifetime than T-CPDT-3, more 5T dye can be loaded on the TiO2 surface, hence, a more upward shift in ECB for 5T. The effect of this ECB shift is more pronounced than the slower electron recombination and longer electron lifetime in T-CPDT-3; thus, 5T can achieve higher Voc than T-CPDT-3. Interestingly, T-CPDT-3 can achieve outstanding Jsc (11.27 mA cm−2) in a solid-state device with the TiO2 film thickness less than 1 micron. This implies that T-CPDT-3 can be a promising dye for co-sensitisation with any dyes that have low current but high voltage, to complement their properties and achieve highly efficient solar cells.Author contributions
AJ: carried out and analysed most of the experimental work and initial manuscript drafting; XL: carried out the ssDSSC cell fabrication, testing and IPCE measurements for all devices; NR: supervision of most of the experimental work and manuscript review & editing; WW: supervision of the ssDSSC and IPCE experimental work and manuscript review.Conflicts of interest
There are no conflicts to declare.Acknowledgements
AJ would like to thank the Royal Government of Thailand through the Development and Promotion of Science and Technology Talents Project (DPST) for funding. WW gratefully thanks the National Natural Science Foundation of China (NFSC 22075083) for financial support.References
- B. O'Regan and M. Grätzel, Nature, 1991, 353, 737–740 CrossRef.
- S. Zhang, X. Yang, Y. Numata and L. Han, Energy Environ. Sci., 2013, 6, 1443–1464 RSC.
- A. Hagfeldt, G. Boschloo, L. Sun, L. Kloo and H. Pettersson, Chem. Rev., 2010, 110, 6595–6663 CrossRef CAS PubMed.
- B. Liu, B. Wang, R. Wang, L. Gao, S. Huo, Q. Liu, X. Li and W. Zhu, J. Mater. Chem. A, 2014, 2, 804–812 RSC.
- R. Grisorio, L. De Marco, R. Agosta, R. Iacobellis, R. Giannuzzi, M. Manca, P. Mastrorilli, G. Gigli and G. P. Suranna, ChemSusChem, 2014, 7, 2659–2669 CrossRef CAS PubMed.
- Y. Tan, M. Liang, Z. Lu, Y. Zheng, X. Tong, Z. Sun and S. Xue, Org. Lett., 2014, 16, 3978–3981 CrossRef CAS PubMed.
- Y. Wu, W.-H. Zhu, S. M. Zakeeruddin and M. Grätzel, ACS Appl. Mater. Interfaces, 2015, 7, 9307–9318 CrossRef CAS PubMed.
- C.-J. Tan, C.-S. Yang, Y.-C. Sheng, H. W. Amini and H.-H. G. Tsai, J. Phys. Chem. C, 2016, 120, 21272–21284 CrossRef CAS.
- J. Zhang, Y.-H. Kan, H.-B. Li, Y. Geng, Y. Wu and Z.-M. Su, Dyes Pigm., 2012, 95, 313–321 CrossRef CAS.
- C.-G. Wu, W.-T. Shieh, C.-S. Yang, C.-J. Tan, C.-H. Chang, S.-C. Chen, C.-Y. Wu and H.-H. G. Tsai, Dyes Pigm., 2013, 99, 1091–1100 CrossRef CAS.
- Q. Chai, W. Li, J. Liu, Z. Geng, H. Tian and W. Zhu, Sci. Rep., 2015, 5, 11330 CrossRef CAS PubMed.
- X. Cheng, S. Sun, M. Liang, Y. Shi, Z. Sun and S. Xue, Dyes Pigm., 2012, 92, 1292–1299 CrossRef CAS.
- C. Baldoli, S. Bertuolo, E. Licandro, L. Viglianti, P. Mussini, G. Marotta, P. Salvatori, F. De Angelis, P. Manca, N. Manfredi and A. Abbotto, Dyes Pigm., 2015, 121, 351–362 CrossRef CAS.
- A. Abate, M. Planells, D. J. Hollman, S. D. Stranks, A. Petrozza, A. R. S. Kandada, Y. Vaynzof, S. K. Pathak, N. Robertson and H. J. Snaith, Adv. Energy Mater., 2014, 4, 1400166 CrossRef.
- Y. Hu, A. Abate, Y. Cao, A. Ivaturi, S. M. Zakeeruddin, M. Grätzel and N. Robertson, J. Phys. Chem. C, 2016, 120, 15027–15034 CrossRef CAS.
- D. S. Pedersen and C. Rosenbohm, Synthesis, 2001, 2001, 2431–2434 Search PubMed.
- V. V Pavlishchuk and A. W. Addison, Inorg. Chim. Acta, 2000, 298, 97–102 CrossRef.
- B. W. D'Andrade, S. Datta, S. R. Forrest, P. Djurovich, E. Polikarpov and M. E. Thompson, Org. Electron., 2005, 6, 11–20 CrossRef.
- M. Planells, A. Abate, H. J. Snaith and N. Robertson, ACS Appl. Mater. Interfaces, 2014, 6, 17226–17235 CrossRef CAS PubMed.
- G. Boschloo, Front. Chem., 2019, 7, 77 CrossRef CAS PubMed.
- B. Xu, H. Tian, L. Lin, D. Qian, H. Chen, J. Zhang, N. Vlachopoulos, G. Boschloo, Y. Luo, F. Zhang, A. Hagfeldt and L. Sun, Adv. Energy Mater., 2015, 5, 1401185 CrossRef.
- W. H. Nguyen, C. D. Bailie, J. Burschka, T. Moehl, M. Grätzel, M. D. McGehee and A. Sellinger, Chem. Mater., 2013, 25, 1519–1525 CrossRef CAS.
- I. Benesperi, H. Michaels and M. Freitag, J. Mater. Chem. C, 2018, 6, 11903–11942 RSC.
- Z. Shen, B. Xu, P. Liu, Y. Hu, Y. Yu, H. Ding, L. Kloo, J. Hua, L. Sun and H. Tian, J. Mater. Chem. A, 2017, 5, 1242–1247 RSC.
- X. Li, B. Xu, P. Liu, Y. Hu, L. Kloo, J. Hua, L. Sun and H. Tian, J. Mater. Chem. A, 2017, 5, 3157–3166 RSC.
- J.-M. Ji, H. Zhou, Y. K. Eom, C. H. Kim and H. K. Kim, Adv. Energy Mater., 2020, 10, 2000124 CrossRef CAS.
- Y. Xie, W. Wu, H. Zhu, J. Liu, W. Zhang, H. Tian and W.-H. Zhu, Chem. Sci., 2016, 7, 544–549 RSC.
- F. Fabregat-Santiago, J. Bisquert, G. Garcia-Belmonte, G. Boschloo and A. Hagfeldt, Sol. Energy Mater. Sol. Cells, 2005, 87, 117–131 CrossRef CAS.
- F. Fabregat-Santiago, G. Garcia-Belmonte, I. Mora-Seró and J. Bisquert, Phys. Chem. Chem. Phys., 2011, 13, 9083–9118 RSC.
- A. Sacco, Renewable Sustainable Energy Rev., 2017, 79, 814–829 CrossRef CAS.
- S. R. Raga, E. M. Barea and F. Fabregat-Santiago, J. Phys. Chem. Lett., 2012, 3, 1629–1634 CrossRef CAS PubMed.
- Q. Wang, S. Ito, M. Grätzel, F. Fabregat-Santiago, I. Mora-Seró, J. Bisquert, T. Bessho and H. Imai, J. Phys. Chem. B, 2006, 110, 25210–25221 CrossRef CAS PubMed.
- J. Bisquert, I. Mora-Sero and F. Fabregat-Santiago, ChemElectroChem, 2014, 1, 289–296 CrossRef CAS.
- J. Preat, D. Jacquemin and E. A. Perpète, Energy Environ. Sci., 2010, 3, 891–904 RSC.
- E. M. Barea and J. Bisquert, Langmuir, 2013, 29, 8773–8781 CrossRef CAS PubMed.
- P. R. F. Barnes, K. Miettunen, X. Li, A. Y. Anderson, T. Bessho, M. Gratzel and B. C. O'Regan, Adv. Mater., 2013, 25, 1881–1922 CrossRef CAS PubMed.
- N. Koumura, Z.-S. Wang, S. Mori, M. Miyashita, E. Suzuki and K. Hara, J. Am. Chem. Soc., 2006, 128, 14256–14257 CrossRef CAS PubMed.
- T. Marinado, K. Nonomura, J. Nissfolk, M. K. Karlsson, D. P. Hagberg, L. Sun, S. Mori and A. Hagfeldt, Langmuir, 2010, 26, 2592–2598 CrossRef CAS PubMed.
- S. Namuangruk, R. Fukuda, M. Ehara, J. Meeprasert, T. Khanasa, S. Morada, T. Kaewin, S. Jungsuttiwong, T. Sudyoadsuk and V. Promarak, J. Phys. Chem. C, 2012, 116, 25653–25663 CrossRef CAS.
Footnote |
| † Electronic supplementary information (ESI) available: Details of dye syntheses, experimental and theoretical dye characterisation, cell fabrication in liquid electrolyte and solid HTM and characterisation. See DOI: 10.1039/d2se00131d |
| This journal is © The Royal Society of Chemistry 2022 |

