
 Open Access Article
 This Open Access Article is licensed under a Creative Commons Attribution-Non Commercial 3.0 Unported Licence
New insights into the environmental performance of perovskite-on-silicon tandem solar cells – a life cycle assessment of industrially manufactured modules†
Martin
Roffeis
 *a,
Simon
Kirner
b,
Jan-Christoph
Goldschmidt
c,
Bernd
Stannowski
d,
Laura Miranda
Perez
e,
Christopher
Case
e and
Matthias
Finkbeiner
a
*a,
Simon
Kirner
b,
Jan-Christoph
Goldschmidt
c,
Bernd
Stannowski
d,
Laura Miranda
Perez
e,
Christopher
Case
e and
Matthias
Finkbeiner
a
aTechnische Universität Berlin, Chair of Sustainable Engineering, Straße des 17. Juni 135, 10623 Berlin, Germany. E-mail: martin.roffeis@mailbox.org
bOxford PV Germany GmbH, Muenstersche Strasse 23, 14772 Brandenburg an der Havel, Germany
cGerman Philipps-Universität Marburg, Physik (Fb13), Renthof 7, 35032 Marburg, Germany
dHelmholtz Zentrum Berlin, PVcomB, Schwarzschildstr. 3, 12489 Berlin, Germany
eOxford PV, Unit 7–8 Oxford Industrial Park, Mead Road, Oxford OX5 1QU, UK
First published on 6th May 2022
Abstract
LCA studies of perovskite-on-silicon tandem (PST) cells have so far been heavily reliant on laboratory data and process data from test facilities to project environmental impacts, producing results that differ significantly from one another. This paper reports on potential environmental impacts of an industrially manufactured PST module. Based on process data from a volume manufacturing line in Brandenburg, Germany, a comprehensive life cycle assessment (LCA) was performed using the ReCiPe 2016 v1.1 method. The production of one module was estimated with a global warming potential (GWP) of 434 kg CO2 eq., terrestrial ecotoxicity potential of 598 kg 1,4-DB eq., freshwater consumption (FWC) of 14 m3, and fossil and metal depletion potential (FDP and MDP) of 164 kg oil eq. and 2034 g Cu eq., respectively. In line with other studies, the environmental performance of the PST module was largely influenced by the amount of energy consumed in the course of production, making the silicon wafer production the determining process step in most impact categories considered. Exceptions were found with the metal depletion potential (MDP) and terrestrial ecotoxicity potential (TETP), where copper, aluminum and float glass implemented in the cell manufacturing and module production process decisively determined the impacts of production. The built-in lead, on the other hand, had no significant influence on the result of the toxicity-specific impact categories in ReCiPe, even if complete lead emission was assumed. The results were also analysed and compared to those of a silicon hetero-junction solar cell (SHJ) module, modelled analogously to the PST production process. While we found the overall environmental impact of the PST module per piece to be higher than that of the SHJ module in most impact categories (up to 7%) due to the additional process steps, a comparison made on the basis of kW h produced shows advantages for the PST module with 6–18% across all impact categories, as a higher efficiency overcompensates the higher environmental burden of production, assuming the same lifetime for both modules.
1. Introduction
Photovoltaic (PV) technology has taken major steps in development in the last few years and shows great potential to play a key role in the energy transition during the next decades. As a result of the learning curve of the manufacturing of PV technologies, together with a continuous increase in the power conversion efficiency (PCE), PV is now among the cheapest technologies for energy production.1 One of the greatest recent advances in this regard is hybrid metal halide perovskites (MHPs), a new class of hybrid organic–inorganic semiconductors. MHPs are materials with the perovskite structure where the inorganic framework is formed by a divalent metal, in general lead or tin or a mixture of both, and halides and the organic molecules are located between the octahedra of the inorganic cage. MHPs show expedient optoelectronic properties, sporting a large absorption coefficient, small exciton binding energy and a band gap that can be tuned to ideally function as a single junction cell, or as a sub cell in a multi-junction solar cell.2,3 Applied as a thin film on top of a second lower band gap absorber, for instance a crystalline silicon bottom cell, such perovskite-on-silicon tandem (PST) cells are able to achieve PCEs well above the limit of single junction solar cells. Only recently, PST cells developed by Helmholtz-Zentrum Berlin4 and Oxford PV5 certified with PCEs of 29.15% (HZB), 29.52% and 29.80%,6 respectively, set new world records according to the international standards.Now with the 30% PCE landmark within close reach, interest in the application potential of PST cells is further increasing. In addition to the economic potential and the technical feasibility, it is above all questions of possible environmental benefits that are attracting public attention.7–9 This is generally based on the notion that higher efficiencies reduce the environmental impact per unit of energy produced. What is neglected here, however, is that changes in the manufacturing process and material composition also change the environmental impact of a PV device, and rarely in an immediately predictable way. This applies in particular to the addition of manufacturing steps or materials with potentially high environmental impacts, such as lead used in the synthesis of the perovskite absorber layer, which due to its acute toxic effect, can disproportionately increase the environmental burden in toxicity-specific impact categories.10,11 Hence, environmental characterization of all material and energy flows involved in the production, use and disposal of a PV device, i.e., “from-cradle-to-grave”, is required in order to make reliable statements about possible environmental effects.
There have been quite a few studies in recent years looking into whether and to what extent PST cells offer environmental advantages over conventional PV technologies. To estimate the environmental impact, the majority of studies employed life cycle assessment (LCA), a method most widely used for this type of analysis.11–13 However, as a technology under development, studies have so far been heavily dependent on process data from laboratory and test facilities, using linear extrapolations to project the environmental impact of industrially manufactured devices. These ex ante studies often produce very different results depending on the methodological decisions and assumptions made.11–14 This is particularly evident in assumptions relating to the design of industrial production steps and the lifetime of PST modules under field conditions, which are difficult to make on the basis of laboratory or experimental production settings and, therefore, vary greatly between studies.
Aiming to make a decisive contribution to closing this knowledge gap, this paper examines the environmental performance of one of the first industrially manufactured PST modules. Using process data from Oxford PV, a comprehensive life cycle inventory (LCI) was modelled, recording all essential material and energy flows involved in the industrial scale production of a 2 m2 PST module (i.e., from the cradle to plant gate). The environmental performance of the LCI model was assessed using the ReCiPe 2016 v1.1 method and the results are compared to those of a hetero-junction solar cell (SHJ) module of almost identical build as the bottom cell in the tandem device. The analysis of the environmental impacts related to the production and per unit of electricity generated, points to environmentally critical aspects in the production of PST modules and thus could offer inspiration and guidance for future research, strategic planning, and commercial decision-making.
2. Materials and methods
An LCA enables the assessment of potential environmental impacts of a product, process, or service throughout its entire life cycle, starting from raw material extraction and processing/cradle, through the product manufacture, distribution and use, to its end-of-life by way of recycling or disposal of the materials, from which it is built.15 Following the internationally recognized LCA guidelines provided in ISO 14040 (ref. 15) and ISO 14044 (ref. 16) standards (not third-party reviewed against ISO 14040), this LCA study was carried out in four operational phases: (1) goal and scope definition, (2) LCI modelling, (3) life cycle impact assessment (LCIA) and (4) interpretation. In the following sections we will detail all methods and materials relevant to the results presented.2.1 Goal and scope
This study aims at estimating the environmental performance of an industrially manufactured PST module. The main goal is to assess whether the efficiency gain of a tandem device compared to that of a silicon single junction cell can compensate for the additional environmental loads added through the manufacture of the perovskite top cell. The life cycle study is expected to (1) detect environmentally critical aspects of commercial production; (2) reveal potential trade-offs between PCE and environmental impact, and (3) provide reference points for future research and development activities to improve the environmental performance of current production designs.In order to fulfil these objectives, an attributional LCA is carried out, in which a comprehensive LCI of a volume manufacturing line is characterised with environmental impact data using the ReCiPe 2016 v1.1 method. Because of numerous existing inconsistencies, e.g., regarding the build and capacity of cells researched, the modeling of the product system, and choices concerning the impact assessment methods, setting of system boundaries and the handling of co-products, the study results are not compared with those of the previously published LCA studies examining the environmental performance of PST cells or any other PV technology, for that matter. However, to gauge whether the PST device offers environmental advantages over established PV technologies, the estimated impacts related to the production of the PST module are compared with those of a SHJ module of the same dimension, modelled analogously to the PST production process.
The environmental performance of the 2 m2 PST module, is estimated in this study using a representative life cycle model. The life cycle of the PST module can be divided into 6 life cycle stages: wafer production (A), cell manufacturing (B), module production (C), installation (D), operation (E), and end-of life (F) (see also Fig. 1).
 | ||
| Fig. 1 System boundaries and relevant life cycle stages of the examined product system (schematic representation). Life cycle stages shaded in gray are not part of the life cycle model and are only taken into account to a limited extent when examining the environmental impact. | ||
Material and energy flows transcending the system boundaries outlined in Fig. 1 in one or the other direction determine the environmental life cycle performance of the PST module. Since insufficient data are yet available on the behavior of PST modules under field conditions (e.g., failure rates, maintenance intervals, etc.) and possible disposal and recycling concepts have not yet been adequately researched, this study does not account for material and energy flows related to the module installation (D), operation (E) and end-of-life (F). The life cycle model under research thus covers all relevant material and energy flows related to the sourcing and processing of materials and energetic resources used in wafer production (A), manufacture of the PST cell (B) and module production (C), i.e., from “cradle to gate”. Though the use phase (installation and operation) and end-of-life are not included by way of modelling, decisive factors influencing the environmental performance of the module, such as module capacity, lifetime and potential emissions from disused modules, are quantitatively assessed as part of a scenario analysis and interpretation of the results (see Section 2.2.1).
The environmental performance of the PST production model is measured against the reference flow of one PST module provided to a generic market in Germany. To better understand the causes and drivers of the environmental performance, the assessment results are analysed using two different functional units (FUs): (1) a production-related FU, where impacts are calculated per module produced and (2) a performance-based FU, where impacts are expressed as the number of kW h produced. All relevant performance characteristics and framework conditions defining the production and function of the module are summarized in Table 1.
| Parameter | Unit | SHJ | PST | DSa |
|---|---|---|---|---|
| a Data source: PD – primary data (data obtained from surveys carried out between July 2018 and February 2021 as part of the ProTandem project); SD – secondary data; AS – assumption; CA – calculated. b PR – performance ratio. | ||||
| Production line | ||||
| Factory output | Modules per a | 483![[thin space (1/6-em)]](https://www.rsc.org/images/entities/char_2009.gif) 538 538 |
483538 |
PD |
| MW a−1 | 213 | 213 | PD | |
|
||||
| Module | ||||
| Wafer area (M4 format) | cm2 | 258 | 258 | PD |
| Cells per module | pcs | 72 | 72 | PD |
| Silicon area per module | cm2 | 18576 |
18576 |
PD |
| Gross module area | cm2 | 20000 |
20000 |
PD |
| Module efficiency (silicon area) | % | 24 | 27 | PD |
| Module efficiency (total area) | % | 22 | 25 | PD |
| Module capacity | Wp | 440 | 500 | PD |
|
||||
| Performance | ||||
| Lifetime | a | 25 | 25 | PD |
| Average degradation rate | %/a | 0.7 | 0.7 | SD18 |
| PRb (initial) | % | 80 | 80 | SD18 |
| PRb (incl. average degradation during lifetime) | % | 73.6 | 73.6 | SD18 |
| Annual average irradiation (Germany) | kW h m−2 | 1250 | 1250 | AS |
| Annual yield | kW h/2 m2 | 405 | 460 | CA |
| Yield over lifetime | kW h/2 m2 | 10125 |
11500 |
CA |
With a specific surface area of 258 cm2, the PST cell delivers an output of 6.94 Wp corresponding to 26.9% cell efficiency. Seventy-two PST cells connected in series provide 500 Wp over a 2 m2 module area, which corresponds to a module efficiency of 25% when measured monofacially (see also Table 1).
A key challenge for the commercialization of PST cells has long been the operational stability of perovskites. Lead-based perovskites can be unstable, if not appropriately protected against environmental influences, which can lead to their rapid decay when exposed to oxygen, light and heat, i.e. the very conditions in which they are meant to generate electricity.12,19 The consequences can be a short service life/lifetime and the release of potentially hazardous substances into the environment. The latter relates in particular to the emissions of lead, a known neurotoxin that can disrupt the hematopoietic, renal, reproductive, and central nervous systems in animals and humans, even in very small amounts.10,11,20 By adapting the formulation and synthesis of the perovskite and the cell design and encapsulation optimization, Oxford PV succeeded in mitigating stability-related deficits and aims at providing future buyers of their modules with the industry-standard 25 year performance guarantee. Estimated conservatively, this study assumes an initial performance ratio of 80% and an annual degradation rate of 0.7%, which is summarized in an average performance ratio of 73.6% over 25 years of service (Table 1). Due to the proven stability improvements, no distinction is made between the PST and SHJ modules with regard to the degradation rate. Assuming installation in Germany under annual average irradiation on an optimally oriented module plain of 1250 kW h m−2, a 2 m2 PST module with a peak power of 500 Wp is thus capable of generating 460 kW h annually and 11500 kW h over its estimated lifetime. With the same dimensions, but a lower module efficiency of 22% (440 Wp), the SHJ module, with which the environmental performance of the PST module is to be compared, achieves lower yields generating 405 kW h annually and 10125 kW h over 25 years. It is worth mentioning here that the capacity factor in Germany is relatively low compared to other regions where PV is installed on a larger scale. At a sunnier location, the module output and thus the yield over 25 years would be considerably higher, which would also be reflected in a relatively lower environmental impact per kW h.
The performance ratio of modern PV systems depends on many factors such as module orientation and mounting (fixed versus single- or dual-axis tracking), shading, and ambient temperature and wind conditions. Also, the type of solar cell has an impact: SHJ cells for example are known for their low temperature coefficient. Perovskite cells can have even lower temperature coefficients,21 presumably overcompensating the small effect because PST solar cells are more sensitive to natural spectral changes of irradiation.22 Due to a lack of field data, a relatively low performance ratio was assumed for both cell types. It is worth noting, however, that modern systems in Germany are capable of reaching the initial performance ratios of 0.85 and higher, making higher yields possible.
The PST cells consist of a ∼160 μm thick SHJ bottom cell and a perovskite solar cell on top. Fig. 2 shows the layer stack of the PST cell in greater detail.
 | ||
| Fig. 2 Layer stack of the PST cell under research (relative thickness of the crystalline silicon layer has been adjusted by factor 10−2 for better illustration). FS = front-side; RS = rear-side. | ||
The tandem solar cell consists of a bottom silicon cell with a perovskite cell on top. The bottom cell stack resembles the typical silicon heterojunction solar cell (SHJ), which was pioneered by, among others, Sanyo/Panasonic, and which is well known for its superior performance to conventional (PERC) silicon solar cells. In this SHJ device, a phosphorous (n-type) doped crystalline silicon wafer is passivated on both sides by thin layers of intrinsic amorphous silicon (a-Si), followed by a p-type a-Si layer on the rear side and an n-type a-Si layer on the front side. Indium tin oxide (ITO) layers on either side form the electrodes. Located on top of the SHJ bottom cell is the perovskite top cell, which in this case consists of a poly(triaryl amine) (PTAA) p-type layer, the methylammonium lead triiodide (MAPbI3) “perovskite” absorber layer and a zinc oxide n-type layer. Another ITO layer forms the top electrode. The tandem cell is completed by a grid electrode consisting of silver (cf.Fig. 3). The module material stack is illustrated in Fig. 3.
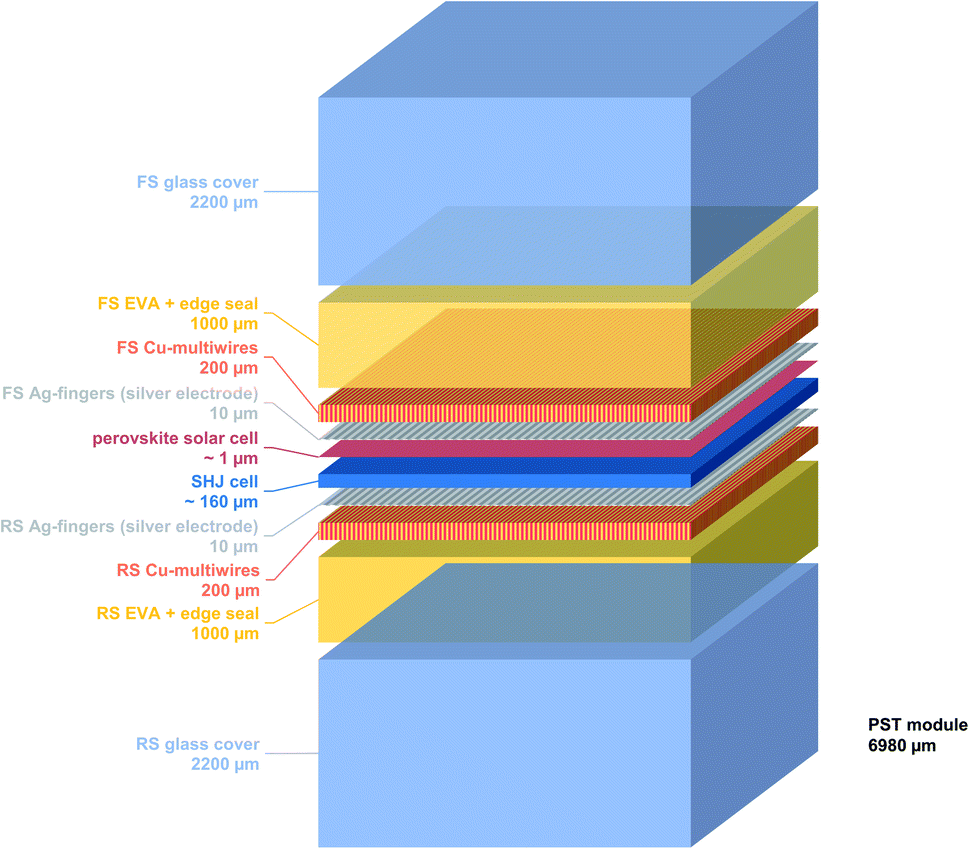 | ||
| Fig. 3 Layer stack of the PST module under research. | ||
Unlike most conventional PV modules, the PST module has glass covers on both the front and rear sides. In between, embedded in a transparent layer made of ethylene and vinyl acetate (EVA), are the PST cells (Fig. 3). The PST cells are provided with 10 μm thin silver fingers (silver electrode), which are screen-printed onto the surfaces of the top and bottom of the cells. “Multiwires” made of copper are soldered perpendicular to the silver fingers. The silver fingers collect the electrical current generated by the PST cells and pass it on to the copper-core multiwires, which are connected to a junction box via metal bars.
2.2 Life cycle inventory (LCI)
The life cycle model detailed in this section was created between June 2018 and February 2021 as part of the ProTandem project; a consortium of experts from science and industry that received funding from the Federal Ministry for Economic Affairs and Energy (BMWi) with the aim to support the development of industrial mass production towards market maturity, for which the assurance of environmental compatibility is a prerequisite.The process data gathered in this way facilitated the modelling of an industrial scaled production process comprising all relevant energy and material flows involved in the provision of a PST module to a generic market in Germany (Fig. 4). The wafer production (A) and associated upstream and downstream process chains, such as the mining of energy and material resources, the production of operating and auxiliary materials, energy generation and water supply processes, or the disposal of solid and liquid waste, were modeled predominantly on the basis of secondary data. As it matches current procurement practices in the PV industry, it was assumed that wafers were sourced from China. The wafer production (A) model draws on data sets found in the LCA database 3.5 of the ecoinvent Association, which were adapted according to the given geographic context and wafer type used. In this first life cycle stage, a distinction was made between (A.01) wafer fabrication, (A.02) wafer packaging, and (A.03) transport of wafers from China to Germany.
 | ||
| Fig. 4 Data basis and geographical context of all life cycle stages and associated unit processes considered in the modelling of the PST module production. | ||
The production process of the PST module was largely modeled on the basis of primary data (Fig. 4). Where the primary data gathered were incomplete or information on synthesis routes was not available, datasets were complemented with averaged industrial data available in the literature, or substituted by equivalent processes (i.e., processes with equivalent function and suspected environmental impact), as was the case with the hole transporting material (HTM) poly(triaryl amine) or PTAA, instead of which the synthesis and deposition of Spiro-OMeTAD are assumed (Fig. 4).
The production model entails all relevant energy and material flows driving cell manufacturing (B) and module production (C), i.e., from the provision of required raw materials and the manufacturing of intermediate products for the assembly and packaging of the finished module. The output of unit process A.03, i.e., imported M4 wafer, provides the basis for the manufacturing of the PST cell. The wafers are then cleaned and textured (B.01), before they are coated with a-Si by means of plasma enhanced chemical vapor deposition (PECVD) (B.02). The waste water from cleaning and texturing are neutralized in-house (X.04) to minimize waste stream. Residual gas is burned and scrubbed (X.01), and is washed in the second step together with other acidic and caustic exhaust streams (X.07 and X.08). Sputter coating is used to deposit the front, back and intermediate ITO layer (B.03, B.04 and B.09). The trays used to hold the cells are cleaned in-house, accounted for in unit process X.02. The top cell fabrication starts by evaporating the PTAA p-layer, or Spiro-OMeTAD used as proxy (B.05), followed by the evaporation of MAPbI3 (B.06), a curing step (B.07), and the deposition of a ZnO n-type layer (B.08). The tandem cell is completed by screen printing of the silver paste (B.10) and curing to form a silver grid (B.11). The finished cells are tested (B.12) and contacted with the multiwires, connected into strings, laminated and assembled into a module (C.01). The assembled modules then go to the packaging unit (C.02), which marks the end of the production process as modules – being packed in cardboard boxes and stacked on EURO pallets – are made ready for distribution. Central facility systems include the ultra-pure water fabrication (X.03), process cooling (X.05), air compressor (X.06), process exhaust ventilator (X.09) and exhaust filter systems (X.10).
Aiming to reproduce the site conditions at Oxford PV, it is assumed that cell manufacturing (B) and module production (C) take place in Brandenburg, Germany. However, as it concerns most relevant environmental determinants, such as electricity grid mix, ways of water supply and wastewater treatment, applicable limits for air pollutants and available processes for recycling, and disposing of solid waste, the site conditions in Brandenburg are representative for all of Germany.
Although studies have not yet established that the lead contained in perovskites poses increased environmental risks, persistent concerns are understandable, given the high toxicity potential that lead emanates.10,23 Since the study focuses primarily on the production process, the effects of possible lead emissions, which are expected to occur predominantly in the use phase and end-of-life of the PST module,10 could only be mapped to a limited extent in the life cycle model. However, in order to take this issue into account when calculating the environmental performance, a worst-case scenario was assumed that all of the lead built into the PST module is emitted into the environment. Information about the proportions of lead emitted to soil, air or water was taken from a study by Hauck et al. (2017).24 More information on the model assumptions in this regard can be found in the ESI S1, Table S1.†
For better interpretation of the results and to analyse whether the PST technology offers any environmental advantages over established PV technologies, the environmental performance of the PST module is compared with that of a SHJ module of the same dimension and build as the bottom SHJ cell used in the PST tandem device. The production process of the SHJ module was modeled analogously to that of the PST module. The production base (M4 wafer) and the module build-up correspond to those of the PST module. Notable differences can be found primarily in the cell manufacturing process, where the unit processes responsible for the synthesis and the application of the second absorber layer are omitted (Fig. 5). In addition to changed performance characteristics, this results in noticeable differences in the bill of materials, as a comparison of a selection of inventory data shown in Table 2. However, the omission of unit processes also affects the capacity utilization of processes that are present further upstream and downstream, such as water and energy supplying processes or processes facilitating exhaust abatement and wastewater treatment. Moreover, presuming that the maturity of the technology reduces the probability of production errors, we assumed that the reject rate in the SHJ module production is lower than that in the production of the PST modules. This changes the input and output flows even in processes that are otherwise (qua modeling) identical in the SHJ and PST module, although differences in the inventory flows are less pronounced here (Table 2).
 | ||
| Fig. 5 Unit processes considered in the modelling of the SHJ cell manufacturing process. | ||
| Inventory data (input/output) | Unit (per module) | SHJ (amount) | PST (amount) | Diff. (%) | |
|---|---|---|---|---|---|
| a Waste water treatment. b Cells/modules that were rejected as part of quality control due to defects or damage. | |||||
| I | M4 wafer [at plant gate DE] | pcs | 72.8 | 73.3 | +1 |
| I | Hydrofluoric acid [49% in H2O] | ml | 107.9 | 108.8 | +1 |
| I | Hydrogen chloride [36% in H2O] | ml | 103.7 | 121.5 | +16 |
| I | Potassium hydroxide [50% in H2O] | ml | 259.0 | 391.2 | +51 |
| I | Natrium hydroxide [50% in H2O] | ml | 146.9 | 165.0 | +12 |
| I | Sulfuric acid [95% in H2O] | ml | 57.5 | 58.0 | +1 |
| I | ITO target [97% In2O3/3% SnO2] | g | 3.5 | 3.0 | −14 |
| I | Poly(triaryl amine) – PTAA | μg | — | 26.9 | — |
| I | Methylammonium iodide [CH3NH3I] | g | — | 2.1 | — |
| I | Lead iodide [PbI2] | g | — | 6.2 | — |
| I | Zinc oxide [ZnO] | g | — | 0.1 | — |
| I | Ag-paste [95% Ag, 5% solvent] | g | 8.2 | 5.2 | −37 |
| I | Copper wires [Cu] | kg | 0.2 | 0.2 | +1 |
| I | Float glass | kg | 22.6 | 22.7 | +0 |
| I | Interconnection ribbon [Cu] | g | 77.5 | 78.2 | +1 |
| I | Encapsulant [EVA] | g | 3.1 | 3.1 | +1 |
| I | Multiwires [Cu] | kg | 0.2 | 0.2 | +1 |
| I | Oxygen [O2, gas] | l | 19.5 | 19.7 | +1 |
| I | Argon [Ar, gas] | l | 3.0 | 3.9 | +30 |
| I | Nitrogen [N2, gas] | l | 3107.6 | 3943.0 | +27 |
| I | Silane [H4Si, gas] | l | 1.1 | 1.1 | +1 |
| I | Nitrogen triflouride [NF3, gas] | l | 0.2 | 0.3 | +1 |
| I | Diborane [B2H6 in H2, gas] | l | 1.1 | 1.1 | +1 |
| I | Phosphine in [PH3 (1%) in H2, gas] | l | 0.6 | 0.7 | +1 |
| I | Hydrogen [H2] | l | 10.8 | 10.9 | +1 |
| I | Electricity | kW h | 69.9 | 83.5 | +19 |
| I | Industrial city water [cooling, tap water] | m3 | 2.2 | 3.6 | +64 |
| I | Ultra-pure water [deionized] | m3 | 0.2 | 0.2 | +17 |
| I | Industrial city water [process, tap water] | m3 | 0.4 | 0.4 | +1 |
| I | Clean dry air (CDA) | m3 | 8.7 | 9.8 | +12 |
| O | Slurry from in-house WWTa | g | 28.7 | 41.4 | +44 |
| O | Mixed metals | g | 30.8 | 31.0 | +1 |
| O | Defective parts (cells/modules)b | g | 10.6 | 16.4 | +55 |
| O | Module [ready for operation] | pcs | 1.0 | 1.0 | 0 |
A detailed list of all input and output flows taken into account in the modelling of the SHJ and PST product system and information on the origin of the data used can be found in the ESI S2.†
When selecting the data sets used for the modeling of the background system, care was taken to ensure that the geographical reference of data sets corresponds to that of the individual life cycle stages modeled in the foreground system. All processes involved in the background system reflect the current state of technology, taking into account the geographical context. More detailed information on the data sets used in the modelling of the background system can found in the ESI S2.†
2.3 Life cycle impact assessment (LCIA)
In the LCIA, the material and energy flows recorded in the LCI model are translated into environmental impacts by means of characterization factors. The potential environmental impacts of the SHJ and PST production model are assessed using the ReCiPe 2016 (v1.11) method.28 In ReCiPe, impacts are calculated for 18 ReCiPe impact categories at the midpoint level, of which only a selection is discussed in more detail in this study. The environmental characterisation of the LCI models followed the hierarchist perspective, i.e., a set of methodological choices representing the scientific consensus with regard to the time frame and plausibility of impact mechanisms.28 The optional components of the impact assessment (normalization, grouping and weighting) are not included in this study due to their subjective character.162.4 Data quality and uncertainty
The modeling of the SHJ and PST module production included a number of assumptions and approximations both in the foreground and background system, which, in addition to the risk of amplification of measurement errors, can undermine the predictive value of the LCA results. Since the data used in modeling are mostly single-point data without any degree of variability, an estimation of the model parameter uncertainty using statistical uncertainty propagation approaches such as the Monte Carlo analysis or the fuzzy set theory was only of limited use. However, a comprehensive impact analysis is carried out to illustrate the relative contribution of inventory items to the overall results and thus highlight model parameters that are most influential on the assessment results.As no comparison of the results with other LCA studies is sought and characterization methods and background databases used are the same for the SHJ and PST production model, no analysis for method-related uncertainties was carried out. Uncertainties owing to the applied characterization methods, i.e., ReCiPe 2016 (v1.11), and the databases used (ecoinvent V 3.5 and GaBi SP40) are well documented and can be recalculated from the data shown here and in the ESI† if necessary.
3. Results and discussion
The results of the LCI analysis and the LCIA are presented and discussed in the following sections. In order not to suggest an unrealistic degree of accuracy, the results are rounded to one decimal place in the decimal form or scientific notation or given as a percentage without a comma for relative values.3.1 LCI analysis
In order to better understand how the LCIA results presented later came about, the LCI model of PST module production was analysed with regard to the dominant energy and material flows. First, it was examined which model elements mapped in the foreground system account for the greatest mass flow in the production of the PST modules. As can be seen in Fig. 6, auxiliary and operating materials, i.e., materials that are consumed during the production process and, if at all, only indirectly become part of the product, dominate the mass balance. Industrial city water (tap water), which is mainly used for cooling (to a greater extent, especially in processes B.02, B.04 and B.06) and for the production of ultra-pure water and, to a lesser extent, for cleaning purposes, represents the largest mass flow in the PST production model at around 1285 kg per module produced. The ultra-pure water produced on site from tap water is mainly used in the wet bench and exhaust abatement processes and, at around 238.5 kg, it represents the second largest mass flow. Float glass, mounted on the front and rear side of the module for better encapsulation, shows the third largest mass contribution with 22.7 kg, all while making up approximately 82% of the module weight (27.6 kg). Only in 6th to 9th position, well after the input of clean dry air (11.7 kg) and nitrogen (4.9 kg), further module parts are ranked such as the module frame made of aluminum (3.4 kg), the 72 M4 wafers (0.8 kg), the J-box set (0.5 kg) and copper wires (0.4 kg). Lead iodide (PbI2) and methylammonium iodide (CH3NH3I), the two essential components of perovskites, make a rather small mass contribution in the PST module production with an input of about 6 g and 2 g per module, respectively (Fig. 6). | ||
| Fig. 6 Mass contribution of inventory items mapped in the foreground system expressed in kg per PST module produced. Inventory items with a mass flow of less than 1 × 10⁻⁴% of the module weight are not shown. | ||
Studies examining the environmental impact of PST technology have consistently identified the energy used in the production process, particularly in the manufacture of crystalline silicon, as the determining factor.11,12,23,29–31 The same can be observed in the LCI results of this study. Fig. 7 shows that the renewable and non-renewable energy resources consumed in the wafer fabrication alone, at 6466 MJ, account for around 67% of the energy used throughout the PST module production (9685 MJ per PST module). With an equivalent of 2089 MJ, the module assembly (C.01) step shows the second highest energy consumption, which can be traced back to the built-in aluminum (module frame) and float glass, and the energy used in the curing process. Unit processes within the cell production stage (B) only account for approx. 10% of the renewable and non-renewable energy resources used, largely attributable to the wafer cleaning/texturing (B.01) process and the application of the perovskite and Spiro-OMeTAD layer (B.06 and B.05) (Fig. 7).
 | ||
| Fig. 7 Renewable and non-renewable energy resources used in the production of one PST module accounting for all material and energy flows mapped in the background and foreground system of the life cycle model. The LCI results expressed in MJ per PST module provided to a generic market in Germany. | ||
3.2 LCIA analysis
The LCIA results are summarized in Table 3. In the interest of clarity and legibility, this section focuses only on a selection of ReCiPe midpoint categories. The assessment results for all 18 ReCiPe impact categories are presented in the ESI S3.†| Impact category | CFma (abbr.) | Unit (per module) | Amount (amount) | Life cycle stageb | Pbc (%) | ||
|---|---|---|---|---|---|---|---|
| |A| (%) | |B| (%) | |C| (%) | |||||
| a Characterisation factor at midpoint. b Wafer production (A), cell manufacturing (B), and module production (C). c Contributions of impacts owing to assumed lead (Pb) emissions. d Fine particulate matter formation. e kBq Co-60 eq. to air. | |||||||
| Climate change, default | GWP | kg CO2 eq. | 434 | 69 | 9 | 22 | 0 |
| Particulate matter formd | PMFP | g PM2.5 eq. | 684 | 77 | 8 | 15 | 0 |
| Fossil depletion | FDP | kg oil eq. | 164 | 75 | 7 | 18 | 0 |
| Freshwater consumption | FWC | m3 | 14 | 94 | 2 | 4 | 0 |
| Freshwater ecotoxicity | FETP | kg 1,4 DB eq. | 4 | 85 | 11 | 4 | 0 |
| Freshwater eutrophication | FEP | g P eq. | 210 | 90 | 7 | 3 | 0 |
| Human toxicity, non-cancer | HTP(NC) | kg 1,4-DB eq. | 421 | 74 | 19 | 5 | 1 |
| Ionizing radiation | IRP | kBq Co-60 eq.e | 71 | 95 | 1 | 3 | 0 |
| Marine ecotoxicity | METP | kg 1,4-DB eq. | 5 | 72 | 23 | 5 | 0 |
| Marine eutrophication | MEP | g N eq. | 31 | 83 | 9 | 8 | 0 |
| Metal depletion | MDP | g Cu eq. | 2034 | 28 | 37 | 36 | 0 |
| Terrestrial acidification | TAP | g SO2 eq. | 1577 | 74 | 6 | 19 | 0 |
| Terrestrial ecotoxicity | TETP | kg 1,4-DB eq. | 598 | 57 | 10 | 31 | 1 |
The production of a 2 m2 PST module with a capacity of 500 Wp is estimated with a global warming potential (GWP) of 434 kg CO2 equivalent. As in the case for most impact categories, the GWP is determined in large by the energy consumption of the individual life cycle stages. Most of the energy and heat consumed in China, and also Germany and Europe for that matter, is provided through the combustion of non-renewable and renewable resources.32,33 This increases the score of emission-sensitive characterization factors, like the GWP, the fine particulate matter formation (PMFP), or factors indicating eutrophication and acidification potentials (MEP, FEP, and TAP), and also influences the results of other impact indicators, such as fossil depletion potential (FDP), freshwater consumption (FWC), or freshwater and marine ecotoxicity (FETP and METP), indicating environmental impacts that result from the extraction, processing, or cultivation of the respective energy resource (Table 3).
Similar to the result patterns observed for the consumption of energy resources, 69% of the GWP is owed to material and energy flows involved in the wafer production stage, followed by the module production (22%) and cell manufacturing (10%) stage. A detailed breakdown of the GWP result shows which materials and processes involved in the PST module production require the most energy and thus indirectly determine the GWP (Fig. 8). In the wafer production stage, the sourcing and energy-intensive production of silicon carbide (8%) and silicon crystal (53%) are the biggest contributors. The electricity consumed in China during the fabrication of the M4 wafer only contributes 3% to the overall results. In addition, there are significant contributions from aluminum (9%) and float glass (6%), both of which are materials whose manufacture is considered energy-intensive. With regard to float glass, it should be noted that it is theoretically possible to carry out encapsulation with other types of glasses, such as rolled glass. Compared to float glass, rolled glass requires less energy to produce, which in turn would reduce the environmental impact in energy-sensitive categories. The figures given here can therefore be regarded as the upper limit.
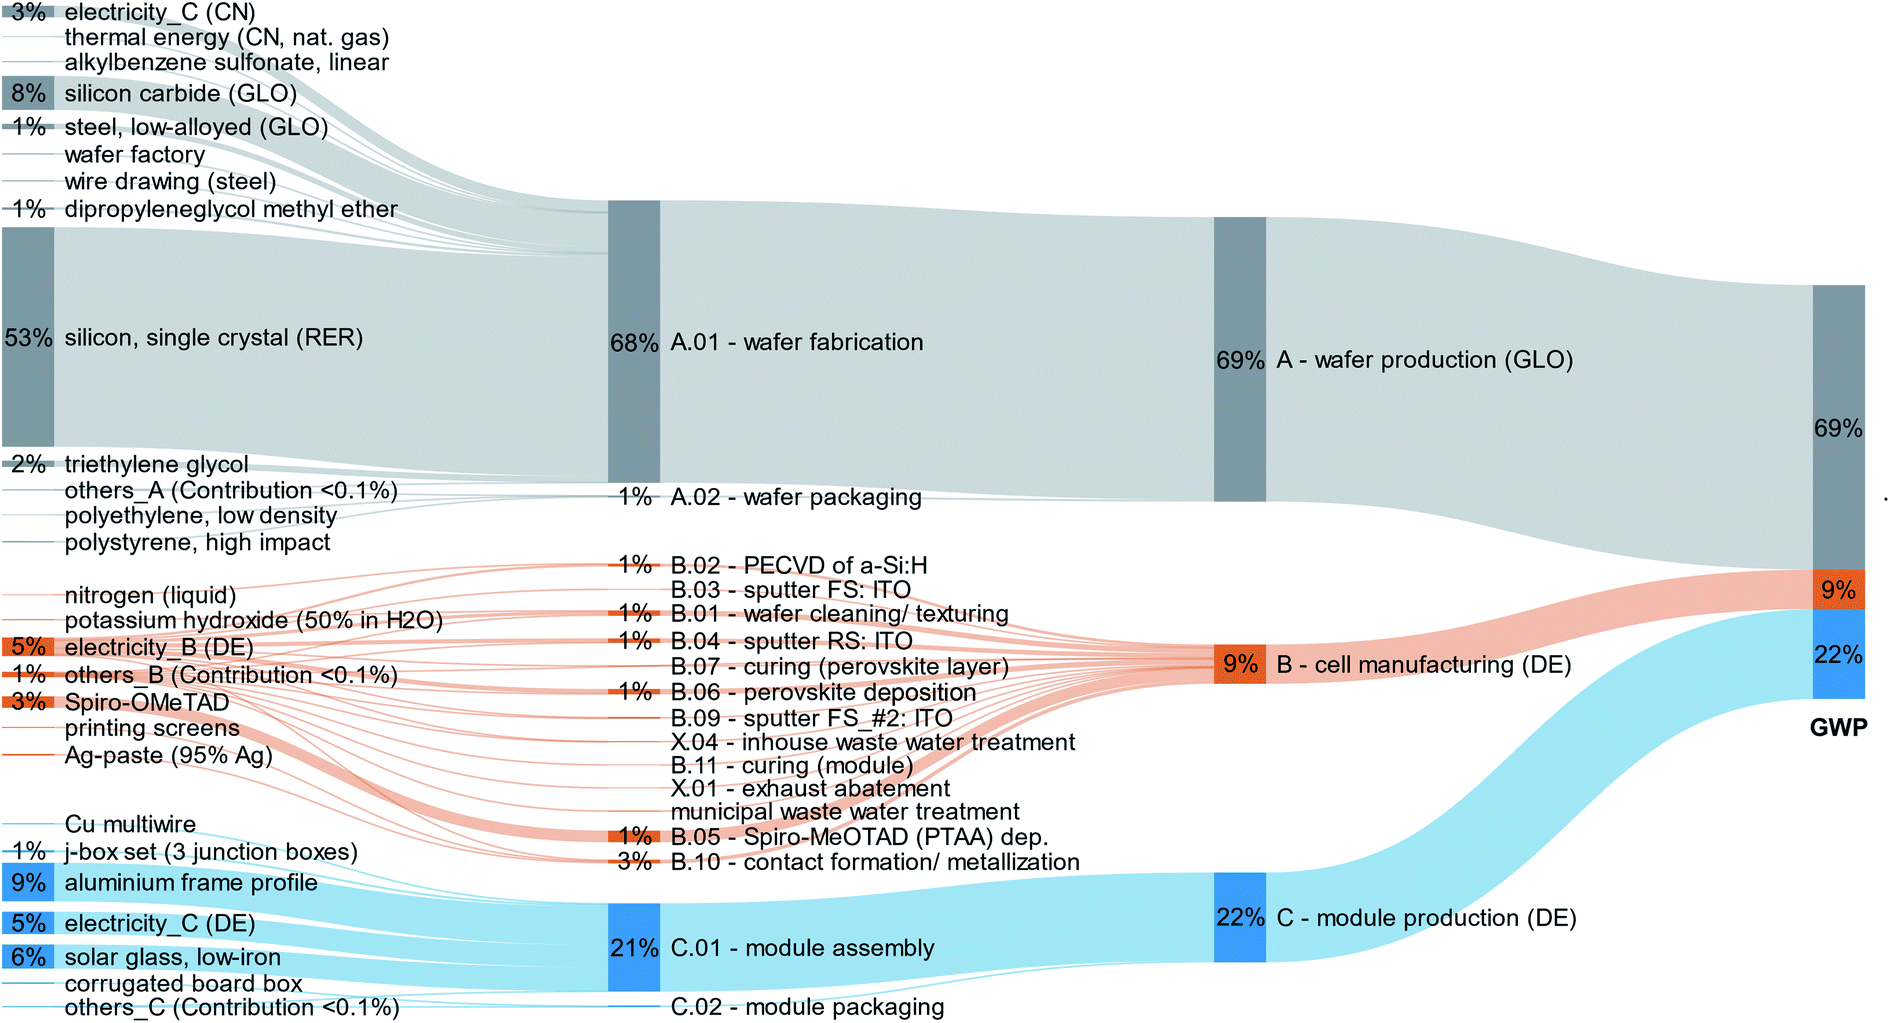 | ||
| Fig. 8 Contribution analysis of the global warming potential (GWP) associated with the provision of a PST module to a generic market in Germany. Mapping of inventory items with contributions greater than 0.1% to the total result. | ||
In the case of metal depletion potential (MDP), the contribution analysis shows a somewhat more balanced result. The cell manufacturing stage (B) is, with 37%, the biggest contributor (Table 3 and Fig. 9). This is mainly due to silver contained in the soldering paste and the Spiro-OMeTAD synthesis for which larger amounts of magnesium are required i.e., in the course of the 2,2′,7,7′-tetrabromo-9-9′-spirobi [9H-fluorene] preparation (ESI S2†). Other notable MDP contributions come from the steel-made printing screens (4%) used in the contact formation/metallization process (B.10) and lead iodide (2%) used in the perovskite synthesis (Fig. 9). The module assembly (C.01) and module packaging (C.02) process together account for 36% of the estimated MDP. Copper and aluminum used in C.01 contribute a total of 32% to the MDP and thus explain the largest part of the contribution allocated to the module production stage (C). The 28% contribution made by the wafer production stage (A) is essentially owed to steel and crystalline silicon used in the course of the wafer fabrication (Fig. 9).
 | ||
| Fig. 9 Contribution analysis of the metal depletion potential (MDP) associated with the provision of a PST module to a generic market in Germany. Mapping images of inventory items with contributions greater than 0.1% to the total result. | ||
It is worth mentioning that lead built to the module, which was assumed to be completely emitted, only marginally affects the environmental performance of the module, as estimated by the ReCiPe method (Table 3). A contribution greater than 0.5% was found only for the human toxicity (non-cancer) and terrestrial ecotoxicity potential (HTC(NC) and TETP). A more detailed breakdown of the TETP results shows that toxicity does not arise primarily from acute toxic substances, such as lead iodide or hydrogen fluoride, used in the cell production stage (B), but is rather attributed to materials and intermediate products with a significantly higher mass flow, such as the silicon wafer, copper wires or the float glass (compare Fig. 6 and 11). The latter two, which are installed in the module assembly (C.01) process, together already contribute 24% to the total TETP. The module frame (aluminum), electricity (curing), the J-box set and packaging materials contribute the remaining 7% to 35% TETP caused by the module production (B) stage (Fig. 10). In the wafer production stage, which accounts for the largest part of the estimated TETP with 57%, the toxicity potential originates in particular from the production processes of crystalline silicon (31%), silicon carbide (5%) and steel (5%). Added to this are brass and triethylene glycol, which each contribute 3% to the total TETP. The built-in lead, shows an insignificant influence with 1% contribution on the TETP result, even though complete emission is assumed (Fig. 10).
 | ||
| Fig. 10 Contribution analysis of the terrestrial ecotoxicity potential (TETP) associated with the provision of a PST module to a generic market in Germany. Mapping images of inventory items with contributions greater than 0.1% to the total result. | ||
 | ||
| Fig. 11 Estimated environmental impacts per kW h produced for a SHJ and PST module operating in Germany for 25 years. Impact of the PST module expressed in percentage relative to the impact of the SHJ module in each impact category. | ||
While lead contained in the device makes a rather insignificant contribution to toxicity-specific impact categories from a global perspective (i.e., LCA perspective), the results do not provide any information about possible local hazards. Information on these possible local effects requires in-depth case-specific toxicological investigations, which are advisable in view of the acute dangers emanating from emitted lead.
It is noticeable that some of the processes identified as influential in the contribution analysis were modelled solely on the basis of secondary data (see also Fig. 4). The use of secondary data is always associated with uncertainties, since methodological inconsistencies can lead to distorted results and thus wrong conclusions and recommendations. Although great attention was paid to ensuring that the selected secondary data sets are consistent with those of the rest of the LCI model, certain deviations had to be accepted, for example with regard to the level of detail and the temporal and geographic reference of the data sets. The wafer fabrication (A.01) process, whose environmental load shows a consistently determining influence on the LCI and LCIA results, was modelled based on the data set “RoW: single-Si wafer production, photovoltaic 〈u-so〉” found in the LCA database ecoinvent 3.5 (ESI S2†). Although other studies also concluded that wafer production is the determining factor for the environmental impact of a PV system, it seems worthwhile to investigate whether the underlying technology (time reference 2018) is still state of the art and how recent technological developments in wafer manufacturing would affect the overall results. Another aspect that would be worth exploring in follow-up studies is how the results change when other HTMs are used instead of Spiro-OMeTAD. In this study Spiro-OMeTAD acted as a proxy, as data on the synthesis of the HTM actually used, PTAA, were not available. However, the relative contribution of Spiro-OMeTAD to the overall environmental impact is partly pronounced, especially when it comes to the consumption of energy resources (Fig. 7) and MDP (Fig. 10). The use of HTMs with a lower environmental impact would certainly measurably reduce the environmental impact of the PST module in associated categories.
3.3 Comparison with SHJ production with and without the use case scenario
In view of the additional materials and manufacturing steps involved in the manufacture of the PST module, it is to be expected that the module will show a higher environmental impact than the SHJ module (Fig. 4 and 5). A comparison of the LCIA results of both modules reflects this line of thought, even if this does not apply to all impact categories (Table 4).| Impact category | CFma (abbr.) | Unit (per module) | SHJ (amount) | PST (amount) | Diff.b (%) |
|---|---|---|---|---|---|
| a Characterisation factor at midpoint. b Impacts of the PST module relative to those of the SHJ module. c Fine particulate matter formation. d kBq Co-60 eq. to air. | |||||
| Climate change, default | GWP | kg CO2 eq. | 411 | 434 | +6 |
| Particulate matter formc | PMFP | g PM2.5 eq. | 644 | 684 | +6 |
| Fossil depletion | FDP | kg oil eq. | 157 | 164 | +4 |
| Freshwater consumption | FWC | m3 | 14 | 14 | +1 |
| Freshwater ecotoxicity | FETP | kg 1,4 DB eq. | 4 | 4 | 0 |
| Freshwater eutrophication | FEP | g P eq. | 209 | 210 | 0 |
| Human toxicity, non-cancer | HTP(NC) | kg 1,4-DB eq. | 440 | 421 | −4 |
| Ionizing radiation | IRP | kBq Co-60 eq.d | 70 | 71 | +1 |
| Marine ecotoxicity | METP | kg 1,4-DB eq. | 6 | 5 | −7 |
| Marine eutrophication | MEP | g N eq. | 29 | 31 | +4 |
| Metal depletion | MDP | g Cu eq. | 1900 | 2034 | +7 |
| Terrestrial acidification | TAP | g SO2 eq. | 1510 | 1577 | +5 |
| Terrestrial ecotoxicity | TETP | kg 1,4-DB eq. | 578 | 598 | +3 |
Concerning the results of MDP, GWP and PMFP, in particular, the environmental impact of the SHJ module is noticeably lower than that of the PST module. In impact indicators whose results are primarily determined by material and energy flows of the wafer production, such as FWC, FETP, FEP and IRP, hardly any differences can be made out between the results of the modules (compare Tables 3 and 5). A different picture emerges, however, with the results of HTP(NC) and METP, where the environmental impact of the SHJ module is higher than that of the PST module (Table 4). The reason for this is that about 37% less silver is used in the contact formation/metallization process (B.10) of the PST module than in the SHJ module, which is mirrored by the HTP(NC) and METP result, given the high toxicity of silver (compare Tables 2 and 5). Less silver is necessary for the PST cell in comparison to the SHJ cell, because the electrical current of the individual solar cells is roughly 50% lower (operating voltage is much higher) and thus less metallization is required to keep losses from the series resistance at the same level. In a tandem device the solar spectrum is distributed between the two sub-cells, thus the current is roughly halved, while the voltage is considerably higher due to the reduction of thermalisation losses.
| Impact category | CFma (abbr.) | Unit (per kW h) | SHJ (amount) | PST (amount) | Diff.b (%) |
|---|---|---|---|---|---|
| a Characterisation factor at midpoint. b Impacts of the PST module relative to those of the SHJ module. c Fine particulate matter formation. d Bq Co-60 eq. to air. | |||||
| Climate change, default | GWP | g CO2 eq. | 40.6 | 37.7 | −7 |
| Particulate matter formc | PMFP | mg PM2.5 eq. | 63.6 | 59.5 | −6 |
| Fossil depletion | FDP | g oil eq. | 15.5 | 14.3 | −8 |
| Freshwater consumption | FWC | l | 1.4 | 1.2 | −11 |
| Freshwater ecotoxicity | FETP | mg 1,4 DB eq. | 348.6 | 307.0 | −12 |
| Freshwater eutrophication | FEP | mg P eq. | 20.6 | 18.3 | −12 |
| Human toxicity, non-cancer | HTP(NC) | g 1,4-DB eq. | 43.5 | 36.6 | −16 |
| Ionizing radiation | IRP | Bq Co-60 eq.d | 6.9 | 6.2 | −11 |
| Marine ecotoxicity | METP | g 1,4-DB eq. | 0.6 | 0.5 | −18 |
| Marine eutrophication | MEP | mg N eq. | 2.9 | 2.7 | −9 |
| Metal depletion | MDP | mg Cu eq. | 187.7 | 176.5 | −6 |
| Terrestrial acidification | TAP | mg SO2 eq. | 149.1 | 137.4 | −8 |
| Terrestrial ecotoxicity | TETP | g 1,4-DB eq. | 57.1 | 52.0 | −9 |
Overall, the differences between the results in the range of −7% to +7% are small. Given the inherent uncertainties of any LCA study, such numerical differences are usually not deemed significant. Due to the high consistency of the LCI models applied, the results for the more robust impact categories GWP, FDP, FEP, MEP and TAP are deemed significant, nevertheless.
The result is a different one, however, when environmental impacts of the modules are compared on the basis of kW h produced (Table 5). Here the PST module shows a superior environmental performance with sizeable advantages being evident in the toxicity-specific impact categories FETP, HTC(NC) and METP, in particular. Likewise, with respect to the previous comparison per module, the advantages of the PST module are the lowest with the results of GWP, PMFP and MDP (Table 5 and Fig. 11). For a general classification of the results, a comparison of the environmental impacts per kW h of the PST and SHJ module with that of the German grid mix can be found in Table S2 in the ESI S1.†
Assuming a performance ratio of 73.6% (average annual degradation rate of 0.7% included) and an annual average irradiation on an optimally oriented module plain of 1250 kW h m−2, the 440 Wp SHJ and 500 Wp PST module would have produced 10125 kW h and 11500 kW h respectively by the end of their 25 year performance guarantee. The PST module would thus be able to generate roughly the same amount of energy in 22 years as the SHJ module over 25 years.
After 22 years, however, the environmental impact of the PST module would not have yet equaled that of the SHJ module, at least not in all of the impact categories considered (Fig. 12). For example, a PST module would have to generate electricity for at least 23 years in order to be on par with the GWP, PMFP, FDP, MEP, TAP and TETP of an SHJ module that has been in operation for 25 years. In the case of the MDP, the PST module would have to stay operational for at least 24 years (Fig. 12).
 | ||
| Fig. 12 Operating time of a PST module at which its environmental impact per kW h is equal to that of an SHJ module that has been operated for 25 years. | ||
With the HTP (NC) and METP, the PST module would only show the same environmental impact as an SHJ module after 21 and 20 years respectively, though in both cases the PST module would have produced less electricity than a 25-old SHJ module, entirely apart from the fact that after this time the module would still show environmental disadvantages in the previously mentioned categories (Fig. 12).
4. Conclusions
This paper reports on the environmental performance of a perovskite-silicon tandem (PST) module, which was estimated via a comprehensive LCI model of a volume manufacturing line in Brandenburg, Germany, using the ReCiPe 2016 (v1.11) impact assessment method. The results were analysed for a selection of impact categories and compared with those of a silicon heterojunction (SHJ) module of the same dimension and build, modelled according to the same principles as the PST module LCI. In agreement with other studies, the environmental performance was largely influenced by the amount of energy consumed during production, which made the wafer production stage the determining process step in most impact categories considered. Exceptions were found for MDP and TETP, where copper, aluminum and float glass installed in the cell manufacturing and module assembly process, significantly determined the estimated environmental performance of the module. The built-in lead, on the other hand, showed a marginal influence on the results, including toxicity-specific impact categories, even when complete emission was assumed as a worst-case scenario. However, the LCIA results should always be interpreted with caution, as they provide a rather rough approximation of possible environmental impacts from a global perspective and reveal little about actual hazards on a local scale. To address such acute effects at a local scale is beyond the scope of LCA and requires detailed and case-specific toxicological investigations. Consideration should also be given to the uncertainties that result from the LCI modeling. This applies in particular to the wafer production step, which was modeled almost exclusively on the basis of secondary data and shows a consistently determining influence on the LCI and LCIA results.While the overall environmental impact of the production of the PST module was found slightly higher than that of the SHJ module per piece, with a small difference of up to 7%, when the comparison is based on the kW h produced, advantages are given for the PST module in all impact categories in the range of 6–18%. A higher PCE of the PST module reduces the relative input of materials and energy per unit of energy produced, which in turn benefits its environmental impact in comparison to that of PV devices with lower efficiency, such as the SHJ module. However, these environmental advantages over established PV technologies can only materialize under the condition that the PST module can meet a comparable lifetime (here 25 years) under field operation. According to calculations made in this study, a PST module that fails to maintain 80% of its original capacity for more than 21 years would produce energy with a higher environmental impact per unit than a less efficient SHJ module operated for 25 years.
Author contributions
Martin Roffeis: conceptualization, data curation, formal analysis, investigation, methodology, visualisation, and writing – original draft. Simon Kirner: investigation, validation, and writing – review & editing. Jan-Christoph Goldschmidt: validation and writing – review & editing. Bernd Stannowski: validation and writing – review & editing. Laura Miranda Perez: validation and writing – review & editing. Christopher Case: validation and writing – review & editing. Matthias Finkbeiner: funding acquisition, resources, and supervision.Conflicts of interest
There are no conflicts to declare.Acknowledgements
The project on which this report is based was funded by the German Federal Ministry of Education and Research under the funding code/grant number 0324288 “ProTandem”. The responsibility for the content lies with the author. The authors are thankful to the BMWi for the funding and excellent project support.Notes and references
- L. Cozzi, T. Gould, S. Bouckart, D. Crow, T. Y. Kim, C. Mcglade, P. Olejarnik, B. Wanner and D. Wetzel, World Energy Outlook 2020. IEA Report, Paris, 2020 Search PubMed.
- A. Al-Ashouri, A. Magomedov, M. Roß, M. Jošt, M. Talaikis, G. Chistiakova, T. Bertram, J. A. Márquez, E. Köhnen, E. Kasparavičius, S. Levcenco, L. Gil-Escrig, C. J. Hages, R. Schlatmann, B. Rech, T. Malinauskas, T. Unold, C. A. Kaufmann, L. Korte, G. Niaura, V. Getautis and S. Albrecht, Energy Environ. Sci., 2019, 12, 3356–3369 RSC.
- H. Liu, C. Liu, W. Li, W. Kong, H. Chen, H. Zhang, X. Zhang, W. Wang and C. Cheng, Sol. RRL, 2020, 4(6), 2000011 CrossRef CAS.
- A. Al-Ashouri, E. Köhnen, B. Li, A. Magomedov, H. Hempel, P. Caprioglio, J. A. Márquez, A. B. M. Vilches, E. Kasparavicius, J. A. Smith, N. Phung, D. Menzel, M. Grischek, L. Kegelmann, D. Skroblin, C. Gollwitzer, T. Malinauskas, M. Jošt, G. Matič, B. Rech, R. Schlatmann, M. Topič, L. Korte, A. Abate, B. Stannowski, D. Neher, M. Stolterfoht, T. Unold, V. Getautis and S. Albrecht, Science, 2020, 370(6522), 1300–1309 CrossRef CAS.
- Oxford PV, Oxford PV hits new world record for solar cell, 2020 Search PubMed.
- PV magazin, Helmholtz Center achieves 29.80% efficiency for perovskite/silicon tandem solar cell, https://www.pv-magazine.com/2021/11/22/helmholtz-center-achieves-29-80-efficiency-for-perovskite-silicon-tandem-solar-cell/, accessed 21 December 2021.
- T. Heap, Why I’m feeling hopeful about the environment in 2021 – BBC News, https://www.bbc.com/news/science-environment-55429607, accessed 27 April 2021.
- E. Gatten, British company breaks record for solar power efficiency, https://www.telegraph.co.uk/environment/2020/12/21/british-company-breaks-record-solar-power-efficiency/, accessed 27 April 2021.
- J. Ambrose, UK firm’s solar power breakthrough could make world’s most efficient panels by 2021, https://www.theguardian.com/business/2020/aug/15/uk-firms-solar-power-breakthrough-could-make-worlds-most-efficient-panels-by-2021, accessed 27 April 2021.
- P. Billen, E. Leccisi, S. Dastidar, S. Li, L. Lobaton, S. Spatari, A. T. Fafarman, V. M. Fthenakis and J. B. Baxter, Energy, 2019, 166, 1089–1096 CrossRef CAS.
- A. Urbina, JPhys Energy, 2020, 2, 022001 CrossRef CAS.
- K. P. Goetz, A. D. Taylor, Y. J. Hofstetter and Y. Vaynzof, ACS Appl. Mater. Interfaces, 2021, 13, 1–17 CrossRef CAS PubMed.
- G. Schileo and G. Grancini, J. Mater. Chem. C, 2021, 9, 67–76 RSC.
- C. F. C. Salas Redondo, K. A. Blanco and L. O. W. J. G. M. Peijnenburg, EU PVSEC Proceedings, 2020, 754–764 Search PubMed.
- ISO, ISO 14040, 2006.
- ISO, ISO 14044, 2006, 80.
- C. Case, N. Beaumont and D. Kirk, ACS Energy Lett., 2019, 4, 2760–2762 CrossRef CAS.
- Fraunhofer ISE, Photovoltaics Report, https://www.ise.fraunhofer.de/content/dam/ise/de/documents/publications/studies/Photovoltaics-Report.pdf.
- S. A. Khalifa, S. Spatari, A. T. Fafarman and J. B. Baxter, ACS Sustainable Chem. Eng., 2020, 8, 16537–16548 CrossRef CAS.
- G. Flora, D. Gupta and A. Tiwari, Interdiscip. Toxicol., 2012, 5(2), 47 CAS.
- M. Jošt, B. Lipovšek, B. Glažar, A. Al-Ashouri, K. Brecl, G. Matič, A. Magomedov, V. Getautis, M. Topič and S. Albrecht, Adv. Energy Mater., 2020, 10, 2000454 CrossRef.
- J. Lehr, M. Langenhorst, R. Schmager, S. Kirner, U. Lemmer, B. S. Richards, C. Case and U. W. Paetzold, Sustainable Energy Fuels, 2018, 2, 2754–2761 RSC.
- E. Leccisi and V. Fthenakis, Prog. Energy, 2020, 2, 032002 CrossRef.
- M. Hauck, T. Ligthart, M. Schaap, E. Boukris and D. Brouwer, Renewable Energy, 2017, 111, 906–913 CrossRef CAS.
- G. Wernet, C. Bauer, B. Steubing, J. Reinhard, E. Moreno-Ruiz and B. Weidema, Int. J. Life Cycle Assess., 2016, 21, 1218–1230 CrossRef.
- T. Kupfer, B. Martin, C. M. Colodel, M. Kokborg, S. Schöll, M. Rudolf, L. Thellier, M. Gonzalez, O. Schuller, J. Hengstler, A. Stoffregen, A. Köhler and D. Thylmann, GaBi Database – Service Pack 40 (SP40), 2020 Search PubMed.
- Gabi, Gabi Software, http://www.gabi-software.com/international/index/ Search PubMed.
- M. A. Huijbregts, Z. Steinmann, P. M. F. Elshout, G. Stam, F. Verones, M. D. M. Vieira, A. Hollander, M. Zijp and R. van Zelm, ReCiPe 2016 v1. 1 a harmonized life cycle impact assessment method at midpoint and endpoint level report I characterization, RIVM Report 2016-0104a, 2019 Search PubMed.
- S. Maranghi, M. L. Parisi, R. Basosi and A. Sinicropi, Energies, 2019, 12, 3746 CrossRef CAS.
- R. Frischknecht, R. Itten, P. Sinha, M. de Wild-Scholten and J. Zhang, Life Cycle Inventories and Life Cycle Assessments of Photovoltaic Systems [IEA PVPS Task 12, Subtask 2.0, LCA Report IEA-PVPS 12-04:2015], 2015 Search PubMed.
- J. Zhang, X. Gao, Y. Deng, B. Li and C. Yuan, ChemSusChem, 2015, 8, 3882–3891 CrossRef CAS PubMed.
- UBA, Primärenergiegewinnung und -importe | Umweltbundesamt, https://www.umweltbundesamt.de/daten/energie/primaerenergiegewinnung-importe, accessed 7 June 2021.
- T. Baležentis and D. Štreimikiene, Energies, 2019, 12, 1142 CrossRef.
Footnote |
| † Electronic supplementary information (ESI) available. See https://doi.org/10.1039/d2se00096b |
| This journal is © The Royal Society of Chemistry 2022 |