 Open Access Article
Creative Commons Attribution 3.0 Unported Licence
Mesocrystal TiO2 films: in situ topotactic transformation and application in dye-sensitised solar cells†
Bingyu
Lei
a,
Arivazhagan
Valluvar Oli
b,
Aruna
Ivaturi
 b and
Neil
Robertson
 *a
*a
aSchool of Chemistry, The University of Edinburgh, David Brewster Road, Edinburgh EH9 3FJ, UK. E-mail: Neil.Robertson@ed.ac.uk
bSmart Materials Research and Device Technology (SMaRDT) Group, Department of Pure and Applied Chemistry, University of Strathclyde, Thomas Graham Building, Glasgow, G1 1XL, UK
First published on 17th December 2021
Abstract
Thin film ceramics and semiconductors play an important role in energy- and environment-related areas such as photovoltaics, energy storage and water purification. The morphology and structure of materials significantly affect their properties and performance in applications. Mesocrystal materials with a hierarchical structure and designable overall shape possess not only the properties from nanosized building-blocks but also collective functions from the crystallographically ordered assembly, meeting the criteria of high performance candidates in various applications. In this study, a facile and versatile method was developed to prepare mesocrystal films by simply making a printable paste of the topotactic precursor, followed by in situ topotactic transformation of printed films. Using TiO2 as the model material, mesocrystal TiO2 films made from NH4TiOF3 paste possess high surface area, crystallographic orientation of anatase nanoparticles and overall large particle size, performing well in dye-sensitised solar cells (DSSCs) as either single-layer photoanodes or additional scattering layers.
Introduction
Thanks to its elemental abundance, nontoxicity, low cost, high chemical stability and unique physicochemical properties, titanium dioxide (TiO2) has been intensively investigated in energy- and environment-related areas such as photocatalysis, hydrogen generation, Li-ion batteries, and solar cells.1–5 To satisfy the criteria for different applications, there has been a lot of effort on tuning the size, crystallinity, shape and architecture of TiO2 because these parameters can significantly affect its properties and performance. A very characteristic example is as photoanode for dye-sensitized solar cells (DSSCs).6–9 A good photoanode requires specifically high dye loading capacity, efficient electron collection and transport and also a pronounced light-scattering ability. In most of the DSSCs studies, mesoporous anatase TiO2 nanoparticle films made from commercially available TiO2 paste (Ti-Nanoxide T/SP, Solaronix) are widely used. The highly dispersed nanoparticles (15–20 nm) possess a high surface area leading to efficient dye loading and high transparency ensuring favourable light penetration.10,11 However, the negligible light scattering in nanoparticle films leads to a short pathway for incident light, limiting the photon absorption by the adsorbed dye molecules. To solve this problem, an additional scattering layer composed of large TiO2 particles is generally applied on top of the transparent active layer in many reports to improve the light harvesting in DSSCs.12 Another method is to develop hierarchical-structured TiO2 as photoanode such as mesoporous TiO2 microspheres,13 TiO2 nanoflowers14 and hierarchical TiO2 nanotube arrays.15 It is also not surprising that the combination of the above two strategies, using TiO2 with hierarchical structure as additional scattering layer has been shown to significantly enhance the light harvesting in DSSCs.16,17As a recently-developed hierarchical structure, mesocrystals, consisting of nanocrystals with common crystallographic orientation, have drawn a lot of attention since they were first proposed by Cölfen in 2005 as the metastable intermediates in non-classical crystallization processes.18 Over the past 16 years, mesocrystal structures were found or realized in a broad range of materials including biominerals and mimetics (e.g. sea urchin spines,19 vaterite CaCO3 (ref. 20)), metal oxides (e.g. ZnO,21 TiO2,22 Fe2O3,23 Co3O4 (ref. 24)), metal sulfide (e.g. ZnS25), etc., and have been demonstrated to bring the material not only properties associated with individual nanoparticles but also collective properties and functions. TiO2 mesocrystals (mcTiO2) have been investigated in many applications and showed excellent performance, considering their advanced properties from the unique structure.26–29 However, in most existing work, not only for mcTiO2 but also for other mesocrystals, lengthy hydrothermal or solvothermal treatments were always adopted to enable the ‘bottom-up’ nanocrystal oriented assembly.26,27,30,31 To make mesocrystals, another ‘top-down’ strategy via topotactic conversion has also been explored in some cases.32–34 This solid-to-solid transformation is based on crystallographic similarity between target product and the precursor, which is NH4TiOF3 in the case of anatase TiO2.22 Compared with a ‘bottom-up’ strategy, topotactic conversion uses a solid precursor as template, making it easier to design, control and predict the morphology and structure of the product. Considering the demands of TiO2 films in many applications, such as photoanodes for solar cells, electrodes for energy storage and immobilised photocatalysts for easier reuse, a general and simple method to make functional mcTiO2 films will broaden the application of mcTiO2 in energy- and environment-related areas and bring the specific properties from the unique structure of mesocrystals to those applications.
In this work, we report a facile method to prepare functional mcTiO2 films by making a printable paste of the NH4TiOF3 followed by in situ thermal topotactic transformation of printed NH4TiOF3 films, extending an approach that has received little prior attention.35 The NH4TiOF3 precursor is prepared through an HF free route at room temperature and mixed with organic binders to form a viscous paste. The topotactic conversion occurs simultaneously with the thermal removal of organic components after film printing, significantly simplifying the manufacturing steps of mcTiO2 films. The obtained mcTiO2 film was characterized by X-ray Diffraction (XRD), Scanning Electron Microscopy (SEM), Transmission Electron Microscopy (TEM), UV-Visible (UV-Vis) spectroscopy, Attenuated Total Reflection-Fourier Transmission Infrared (ATR-FTIR) analysis and tested in the example application of DSSCs to investigate the functions brought by the structural features. The mcTiO2 films were applied as either single-layer photoanode or additional scattering layer for DSSCs using the commercial dye LEG4 as the photo-sensitizer. Compared with commercial transparent TiO2 (Ti-Nanoxide T/SP, Solaronix), diffusing TiO2 (Ti-Nanoxide D/SP, Solaronix) and reflective TiO2 (Ti-Nanoxide R/SP, Solaronix), mcTiO2 prepared from NH4TiOF3 paste possesses not only properties from individual nanoparticles but also collective functions, leading to satisfactory performance in DSSCs and promising prospects for other potential applications.
Experimental
Synthesis of NH4TiOF3
NH4TiOF3 powder was prepared from a room temperature hydrolysis reaction of (NH4)2TiF6 with addition of ammonia solution, which is modified from a reported method.28 Typically, 3.959 g (NH4)2TiF6 (Acros Organics) was dissolved in 45 ml of H2O, and then the solution was mixed with 5 ml 3 M ammonia solution under magnetic stirring. After stirring the solution for 5 min and letting it stand for 6 h at room temperature, the precipitate was collected by centrifugation and washed sequentially with water and ethanol, and dried in ambient conditions.Preparation of NH4TiOF3 paste
The preparation of NH4TiOF3 paste follows a reported analogous method for TiO2 paste with a few modifications.36 Before making the paste, 1 g of two kinds of ethyl cellulose (EC) powders, i.e. EC (10 cP, Merck) and EC (30–70 cP, Merck) were dissolved in anhydrous ethanol respectively and stirred overnight at room temperature to get 10 g of EC stock solutions (10 wt%). They were labelled as EC-10 and EC-30 according to different viscosities. To prepare the paste, 0.278 g NH4TiOF3 was mixed with 0.65 g anhydrous terpineol solvent, 0.45 g EC-10 stock solution, 0.35 g EC-30 stock solution and 0.8 ml anhydrous ethanol. The amount of NH4TiOF3 was calculated to satisfy the Ti concentration as ∼10.8 wt%, the same as commercial titania pastes from Solaronix. After stirring overnight, the mixture was sonicated for 2 min and stirred at 13![[thin space (1/6-em)]](https://www.rsc.org/images/entities/char_2009.gif) 500 rpm for 1 min using an ultra-terrax mixer. The sonication and stirring procedure was repeated 3 times. Ethanol and water were then removed by rotary-evaporation at 40 °C.
500 rpm for 1 min using an ultra-terrax mixer. The sonication and stirring procedure was repeated 3 times. Ethanol and water were then removed by rotary-evaporation at 40 °C.
Preparation of TiO2 photoanodes
Fluorine-doped tin oxide (FTO)-coated glass substrates (TEC7, Merck) were cut into pieces of size 3 cm × 4 cm (for 4 cells), and sonicated in 2 vol% Hellmanex detergent solution for 30 min, DI water for 15 min and rinsed with ethanol. Then they were dried with hot air and treated by UV/ozone for 20 min. Prior to screen printing, FTO substrates were pre-treated by a 40 mM TiCl4 aqueous solution at 70 °C for 30 min, followed by a water rinse and a heat treatment at 500 °C for 30 min. For the single layer DSSCs, the NH4TiOF3 paste or commercial paste (nano-particle only paste Ti-Nanoxide T/SP, mixed titania particle paste Ti-Nanoxide D/SP, and large titania particle only paste Ti-Nanoxide R/SP) was screen-printed on top of TiCl4 treated FTO substrates through a 90 polyester screen with 4 circles (D = 6 mm). The films were sintered at 500 °C for 2 hours using different temperature ramps. The obtained TiO2 films were named as F (mesocrystal TiO2 from NH4TiOF3 paste), T (transparent TiO2 from Ti-Nanoxide T/SP), D (diffusing TiO2 from Ti-Nanoxide D/SP), and R (reflective TiO2 from Ti-Nanoxide R/SP). A numeric suffix will be used to note the heating rate. For example, F-2 means 1 layer of TiO2 film made from NH4TiOF3 paste with a heating rate of 2 °C min−1. For the two-layers cells, Ti-Nanoxide T/SP was used to print the transparent active TiO2 layer and sintered at 500 °C for 15 min. Additional scattering layers were prepared by depositing screen-printed NH4TiOF3 paste or commercial paste (Ti-Nanoxide D/SP or Ti-Nanoxide R/SP) on top of the transparent TiO2 layer, followed by sintering at 500 °C for 2 hours with a heating rate of 2 °C min−1. The obtained films were named as TF, TD, and TR respectively.Fabrication of dye-sensitized solar cell
The TiO2 films were pre-heated at 120 °C for 30 minutes before being immersed in a dye bath containing 0.2 mM LEG4 (Dyenamo, Fig. S1†) in acetonitrile/tert-butanol (1![[thin space (1/6-em)]](https://www.rsc.org/images/entities/char_2009.gif) :
:![[thin space (1/6-em)]](https://www.rsc.org/images/entities/char_2009.gif) 1, v/v). After sensitization for 20 hours, the electrodes were rinsed with acetonitrile and dried in air. Counter electrodes were prepared by doctor-blading platinum precursor paste (Solaronix Platisol-T) on FTO substrates followed by heating in air at 450 °C for 15 min. The working electrode and counter electrode were assembled together into a sandwich type cell and sealed with a hot-melt Surlyn film. An I−/I3− electrolyte solution was injected through a pre-drilled hole in the counter electrode by vacuum back filling and the hole was then sealed with Surlyn cover and a microscope coverslip. The electrolyte was composed of 0.1 M LiI, 0.05 M I2, 0.6 M 1,2-dimethyl-3-propylimidazolium iodide (DMPII), 0.5 M 4-tert-butylpyridine (tBP) in acetonitrile. Fig. S2† shows digital photos of the example DSSC devices.
1, v/v). After sensitization for 20 hours, the electrodes were rinsed with acetonitrile and dried in air. Counter electrodes were prepared by doctor-blading platinum precursor paste (Solaronix Platisol-T) on FTO substrates followed by heating in air at 450 °C for 15 min. The working electrode and counter electrode were assembled together into a sandwich type cell and sealed with a hot-melt Surlyn film. An I−/I3− electrolyte solution was injected through a pre-drilled hole in the counter electrode by vacuum back filling and the hole was then sealed with Surlyn cover and a microscope coverslip. The electrolyte was composed of 0.1 M LiI, 0.05 M I2, 0.6 M 1,2-dimethyl-3-propylimidazolium iodide (DMPII), 0.5 M 4-tert-butylpyridine (tBP) in acetonitrile. Fig. S2† shows digital photos of the example DSSC devices.
Characterization
XRD was carried out on a Bruker D2 PHASER using CuKα radiation. UV-Vis absorption/diffuse reflectance spectra (DRS) were obtained using a JASCO V-670 UV/Vis/NIR spectrophotometer. Infrared (IR) spectra from 4000 to 500 cm−1 were recorded on a PerkinElmer Spectrum 65 ATR-IR spectrometer. To prepare film samples for XRD, UV-Vis DRS and IR characterizations, NH4TiOF3 paste or commercial TiO2 pastes were doctor-bladed on glass slide with the thickness controlled by 1 layer of Scotch tape, followed by a drying process at 120 °C for 10 min and a sintering process if needed. Surface and cross-sectional SEM images of samples were collected using a ZEISS SIGMA Field Emission SEM, operated in SE2 mode with a 10 kV accelerating voltage. To prepare specimens for cross-section analysis, the substrates were scored before screen-printing. The substrates were broken along the score after preparation of films and adhered on a stub with the cross section facing up. TEM, Selected-Area Electron Diffraction (SAED) and Electron Dispersive Spectroscopy (EDS) were carried out using a FEI Titan Themis microscope. Photocurrent density–voltage (J–V) curves were recorded on an Autolab potentiostat (Metrohm) with class AAA SLB300A solar simulator (Sciencetech) as the light source. The light intensity was calibrated to AM1.5G using a silicon reference cell. The active area of the solar cell was fixed with a black metal mask with a circular aperture of 0.0707 cm2 (d = 3 mm). The frequency-modulated electrochemical impedance spectroscopy (EIS) was recorded with a similar setup to that of the J–V measurements. The frequency range was set to 1 MHz to 0.05 Hz with an AC voltage amplitude of 10 mV. The measurements were performed under white light emitting diode (LED) illumination with adjustable intensity. The plots were fitted using the ZView (Scribner Associates) software. Incident photon-to-current conversion efficiency (IPCE) was recorded with a photo-spectrometer setup (Bentham PVE300) by illuminating the solar cell with a modulated monochromatic light (xenon and quartz halogen lamps) through 1.85 mm slit. The incident light was calibrated with a reference silicon photodiode and the spectral resolution was set to 5 nm.Results & discussion
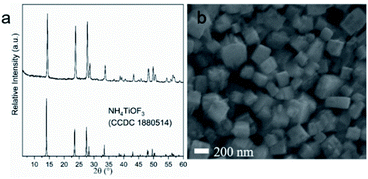
NH4TiOF3 powder samples were synthesized based on a reported method, modified to have an increased reaction volume.28 The XRD pattern in Fig. 1a matched well with the powder diffraction pattern of reported NH4TiOF3 (CCDC 1880514) simulated using Mercury software,37,38 indicating that phase-pure NH4TiOF3 was successfully obtained. Fig. 1b shows the SEM image of the NH4TiOF3 particles with a diameter range of 200–350 nm, in line with the size range for optimum visible light Mie scattering.39NH4TiOF3 powders were mixed with organic binders to prepare printable pastes. Doctor-bladed films with thickness controlled by 1 layer of Scotch tape were sintered at 500 °C for 2 hours with different heating rate, namely 1 °C min−1, 2 °C min−1, 5 °C min−1 and 10 °C min−1. Fig. S3† shows a digital photo of the doctor-bladed film on a piece of glass slide (1.8 cm × 2.6 cm). No cracking or flake-off was observed after the sintering procedure, indicating a good mechanical adhesion of the printed film. XRD patterns of the obtained films are shown in Fig. 2a, confirming that all samples were pure phase anatase (ICDD 86-1156). The crystallite domain size of each sample was calculated from the full width at half maxima (FWHM) of (101) diffraction peak (2-theta = 25.3°) using the Scherrer equation, and assuming negligible instrumental broadening (Table 1). In DSSCs, the crystallinity of TiO2 is associated with the trap states distribution of the photoanode, which will have influence on the charge recombination rate thereby affecting the power conversion efficiency (PCE).40 Sample F-2 under the heating rate of 2 °C min−1 shows the largest average crystal size among all the samples, which may lead to a relatively-lower charge recombination rate and higher photovoltages when applied in DSSCs. However, larger crystallite size may also result in smaller surface area therefore a lower dye coverage and current density. The performance of TiO2 in DSSCs requires an optimal balance between two parameters.
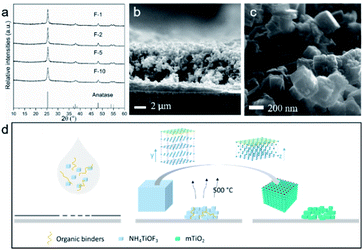 | ||
| Fig. 2 (a) XRD patterns of mcTiO2 films. (b) SEM and (c) TEM image of mcTiO2 under heating rate of 2 °C min−1. (d) Schematic illustration of the in situ topotactic transformation. | ||
| TiO2 photoanode | Composition | D[101] (nm) | Dye loading (nmol cm−2) | V OC (V) | J SC (mA cm−2) | FF | PCE (%) |
|---|---|---|---|---|---|---|---|
| a Mean values ± s.d. are obtained from 3–4 devices for each TiO2. | |||||||
| F-1 | mcTiO2 made from NH4TiOF3 paste | 17.93 | 56.28 | 0.69 (0.69 ± 0.01) | 8.77 (8.35 ± 0.31) | 0.70 (0.71 ± 0.02) | 4.26 (4.09 ± 0.15) |
| F-2 | 19.63 | 52.21 | 0.73 (0.72 ± 0.00) | 9.14 (9.10 ± 0.04) | 0.72 (0.69 ± 0.02) | 4.78 (4.57 ± 0.17) | |
| F-5 | 17.56 | 60.25 | 0.72 (0.71 ± 0.01) | 9.31 (9.19 ± 0.09) | 0.68 (0.68 ± 0.00) | 4.55 (4.49 ± 0.06) | |
| F-10 | 13.65 | 53.02 | 0.68 (0.68 ± 0.01) | 9.43 (8.62 ± 0.57) | 0.70 (0.67 ± 0.03) | 4.50 (3.90 ± 0.44) | |
| T-2 | Transparent TiO2 | 17.80 | 59.89 | 0.72 (0.72 ± 0.01) | 10.86 (10.66 ± 0.25) | 0.66 (0.63 ± 0.02) | 5.14 (4.81 ± 0.20) |
| D-2 | Diffusing TiO2 | 31.59 | 55.84 | 0.73 (0.73 ± 0.01) | 10.21 (9.95 ± 0.29) | 0.72 (0.70 ± 0.02) | 5.35 (5.04 ± 0.32) |
| R-2 | Reflective TiO2 | 56.43 | 16.27 | 0.74 (0.73 ± 0.01) | 3.49 (3.37 ± 0.19) | 0.71 (0.71 ± 0.01) | 1.84 (1.74 ± 0.10) |
To better evaluate the properties and performance of mcTiO2 made from NH4TiOF3 paste, three commercial available pastes were selected as references, namely nano-particle only paste Ti-Nanoxide T/SP, mixed titania particle paste Ti-Nanoxide D/SP, and large titania particle only paste Ti-Nanoxide R/SP. More details of commercial pastes and the comparison with NH4TiOF3 paste are listed in Table S1.† TiO2 films from commercial available pastes were also made by doctor-blading and sintering at 500 °C for 2 hours with a heating rate of 2 °C min−1. XRD patterns of obtained reference TiO2 (T-2, D-2 and R-2) are given in Fig. S4.† The crystallite domain size for these samples were also calculated from (101) diffraction peak and collected in Table 1, which shows a consistent order with the particle sizes. Compared with the crystallite size of the reference TiO2, mesocrystal F-2 sample is in the middle of the order, which may offer the possibility of a balanced crystallinity and surface area.
Also, the approximate 20 nm size of the crystallites has been generally regarded as optimal for the conventional I−/I3− electrolyte-based DSSCs.41
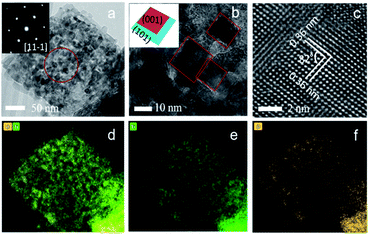
SEM images of mesocrystal TiO2 annealed under different heating rate are given in Fig. 2b, c and S5.† It is clear to see that after sintering at 500 °C, all samples retained the overall shapes and sizes of the original NH4TiOF3 powders, with 200–350 nm particle range which is beneficial for visible light scattering. The high-resolution images indicate that the cubic particles are built of smaller nanoparticles, consistent with the crystalline-domain size determined by the Scherrer equation. The most typical feature of a topotactic conversion is that the product keeps the overall shape and size of precursor but alters the crystal structure to a mesocrystal form, which means the building blocks of products from topotactic transformation should be crystallographically ordered.22 This can be proven by TEM. Fig. 3 shows the TEM images of a TiO2 sample sintered at 500 °C for 2 hours with a heating rate of 2 °C min−1. The TEM image of a typical particle shows a rhombus shape and the porous structure (Fig. 3a). The corresponding SAED pattern of the circled area shows a typical mesocrystal diffraction pattern (single-crystal like with minor distortion), which can be indexed to the [11−1] zone of anatase.42 From higher magnification in Fig. 3b, square facets of nanoparticles can be clearly recognised, corresponding to exposed {001} facets of truncated bipyramidal anatase (see inset of Fig. 3b). The size of nanoparticles is consistent with the crystalline domain size calculated from XRD results. The high resolution TEM image (Fig. 3c) shows planes with lattice spacing of 0.36 nm, corresponding to the (101) and (011) planes of the anatase phase, and the 82° angle between (101) and (011) matches the theoretical value calculated from the lattice constants of anatase (ICDD 86-1156). The EDS analysis (Fig. 3d–f) shows dominant Ti (44.4%) and O (54.5%) elements and homogeneous distribution. The negligible concentration of N (1.09%) and F (0.0147%) (see Fig. S6 and Table S2†) suggests the efficient removal of N and F after the sintering progress. Collectively, it can be confirmed that anatase TiO2 mesocrystals were successfully obtained.
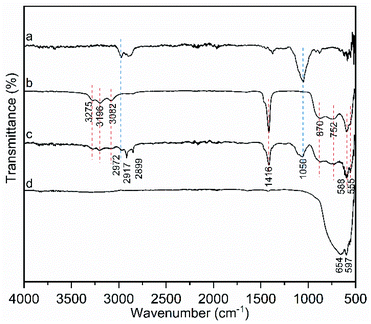
ATR-FTIR analysis was used to provide more information on the topotactic conversion process. Samples scratched from NH4TiOF3 doctor-bladed film which was only dried at 120 °C for 10 min and mcTiO2 film after sintering at 500 °C for 2 hours were measured, together with powder form NH4TiOF3 and ethyl cellulose as references (Fig. 4). Before sintering at 500 °C, NH4TiOF3 sample (Fig. 4c) showed absorption peaks of both NH4TiOF3 and organic binders. The bands at 3196 cm−1, 3082 cm−1 and 1416 cm−1 are attributed to the ν3, ν1 (or ν2 + ν4) and ν4 modes of NH4+ respectively.32 The disappearance of all these peaks in mcTiO2 sample (Fig. 4d) indicates the removal of ammonium after the topotactic conversion. Due to the hydroscopic nature of NH4TiOF3, deformation band of adsorbed water at 3275 cm−1 appeared in Fig. 4c, which was, however, not detected in the mcTiO2 sample. Other typical absorption peaks of NH4TiOF3 were observed between 1000 cm−1 to 500 cm−1. The band at 870 cm−1 is ascribed to ν (Ti![[double bond, length as m-dash]](https://www.rsc.org/images/entities/char_e001.gif) O) (terminal oxygen) or Ti–O–Ti antisymmetric stretching.43 The band at 752 cm−1 corresponds to a combination of lattice mode of Ti–O and Ti–F bands, which is a typical feature of oxofluorotitanates.44 The bands at 588 cm−1 and 555 cm−1 were due to Ti–F and Ti–O respectively.32,44 After calcination, the product mcTiO2 displayed only a broad stretching vibrational Ti–O–Ti absorption peak in this range, indicating the decomposition of Ti–F after topotactic conversion. The vibrations between 3000 cm−1 and 2840 cm−1 are associated with C–H stretching of either ethyl cellulose or terpineol added as organic binders,45,46 which are not observed in mcTiO2 sample, indicating the combustion of organic additives after the topotactic conversion. Another indicative absorption peak at 1050 cm−1, which may be from –C–O–C– stretching of the pyranose ring in ethyl cellulose,46 is also not found in the spectrum of mcTiO2 sample. In short, the NH4TiOF3 film made from NH4TiOF3 paste undergoes a topotactic transformation to form mesocrystal TiO2 and a simultaneous removal of organic binders. A schematic illustration of this in situ topotactic transformation process is given in Fig. 2e. More generally, this strategy could be transferrable to other functional ceramics as long as the thermal topotactic transformation can be applied.
O) (terminal oxygen) or Ti–O–Ti antisymmetric stretching.43 The band at 752 cm−1 corresponds to a combination of lattice mode of Ti–O and Ti–F bands, which is a typical feature of oxofluorotitanates.44 The bands at 588 cm−1 and 555 cm−1 were due to Ti–F and Ti–O respectively.32,44 After calcination, the product mcTiO2 displayed only a broad stretching vibrational Ti–O–Ti absorption peak in this range, indicating the decomposition of Ti–F after topotactic conversion. The vibrations between 3000 cm−1 and 2840 cm−1 are associated with C–H stretching of either ethyl cellulose or terpineol added as organic binders,45,46 which are not observed in mcTiO2 sample, indicating the combustion of organic additives after the topotactic conversion. Another indicative absorption peak at 1050 cm−1, which may be from –C–O–C– stretching of the pyranose ring in ethyl cellulose,46 is also not found in the spectrum of mcTiO2 sample. In short, the NH4TiOF3 film made from NH4TiOF3 paste undergoes a topotactic transformation to form mesocrystal TiO2 and a simultaneous removal of organic binders. A schematic illustration of this in situ topotactic transformation process is given in Fig. 2e. More generally, this strategy could be transferrable to other functional ceramics as long as the thermal topotactic transformation can be applied.
To evaluate the photovoltaic performance of anatase mcTiO2, the obtained anatase mcTiO2 films were firstly tested as single-layer photoanodes. Considering the low thickness of the single-layer TiO2 obtained from screen-printing (4–6 μm, Fig. 2b), LEG4 dye with high extinction coefficient was selected as the sensitizer.47 To investigate the light scattering effect and dye-loading capacity of single-layer mcTiO2 films, doctor-bladed films were tested by UV-Vis DRS before and after LEG4 dye adsorption. According to the UV-Vis DRS spectrum in Fig. 5a, before absorbing dye molecules, bare anatase mcTiO2 (sample F-2) has the highest reflectance compared with all samples from commercial pastes, indicating the highest light scattering ability. This is because of the optimal particle size of anatase mcTiO2 inherited from the precursor NH4TiOF3 after the topotactic conversion. After dye loading (Fig. 5b), the reflectance in the visible range of all the samples drastically decreased due to the light absorption by dye molecules. The lower decrease from R-2 sample indicates a poor dye uptake capability. Quantified dye coverage on different TiO2 films is collected in Table 1. It is shown that all mcTiO2 films made from NH4TiOF3 paste possess comparable dye uptake capability to that from Solaronix T and Solaronix D and much higher dye loading than Solaronix R, confirming the high surface area arising from individual nanoparticles in mcTiO2.
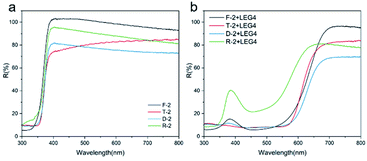 | ||
| Fig. 5 UV-Vis DRS spectrum of TiO2 films sintered from different paste at 500 °C for 2 hours with a heating rate of 2 °C min−1 (a) before dye sensitisation and (b) after sensitised by LEG4 dye. | ||
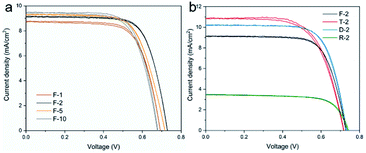
The single-layer DSSCs were characterized by measuring J–V behaviour under 1 sun illumination. The results are given in Fig. 6 and also summarized in Table 1. Fig. 6a shows the comparison among DSSCs with anatase mcTiO2 as photoanodes with different temperature ramp during the mcTiO2 film annealing process. In general, the performance of DSSCs under different conditions varies in a very small range in terms of all parameters. Among all the heating rate, the samples annealed with a ramp of 2 °C min−1 gave relatively higher PCE, resulting from the optimal balance between the open circuit voltage (VOC) and the short circuit current density (JSC), despite that samples annealed with a ramp of 5 °C min−1 possessed higher dye loading and correspondingly higher JSC. Films made from commercial pastes were also tested in DSSC devices to compare with the performance of mcTiO2 as single-layer photoanodes (Fig. 6b). Compared with Solaronix T and D, mcTiO2-based DSSCs F-2 showed comparable VOC and fill factor (FF) but a bit lower JSC. As a result, the PCE of F-2 (4.57 ± 0.17%) was lower than T-2 and D-2 by 0.24% and 0.47% respectively. The slight drop in photocurrent is attributed to the big particle size. Even though mcTiO2 can adsorb comparable amount of dye molecules to nanoparticle based films as discussed above, the excellent light scattering and reflection may lead to the waste of backward scattered light (see Fig. S7†), therefore reducing overall light harvesting. This is a drawback of mcTiO2 when applied in single-layer photoanodes, but can be utilized as a benefit when it is applied as the additional scattering layer, which will be discussed in the next section. Solaronix R was also used as the reference TiO2. The DSSCs based on large particle TiO2 (R-2) showed the highest VOC among all devices. However, this is with the sacrifice of JSC due to the lowest dye loading, which is not favourable for single-layer photoanodes. The mcTiO2 particles have similar overall particle size to R but higher porosity due to the mesocrystal structure. As a result, mcTiO2 DSSCs F-2 offer similar VOC, but much higher JSC than devices based on R, resulting in a better performance as single-layer photoanodes.
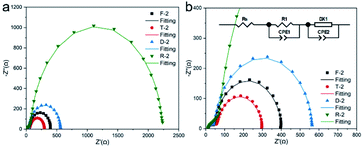
To better understand the interfacial charge transfer mechanism of mcTiO2 based single-layer DSSCs, EIS measurements were conducted under white LED illumination at open circuit conditions. By varying the light intensity, the VOC can be tuned and hence the quasi-Fermi level in the photoanode. During all measurements, a 10 mV perturbation was applied in the 0.05 to 1 MHz frequency range. Fig. 7a and b display examples of Nyquist plots for DSSCs based on different single-layer photoanodes under a bias of 0.7 V. There are two semicircles in each plot. The first one in the high-frequency region denotes the electron transfer at the Pt/electrolyte interface, and the other semicircle represents the electron recombination at the TiO2/dye/electrolyte interface. A transmission line equivalent circuit model48 shown in the inset of Fig. 7b was used to extract electron transfer parameters of cells from all Nyquist plots under a series of applied bias potentials. Examples of fitted results from plots under 0.7 V are shown in Table S3.†
The chemical capacitance, Cμ, provides information on the electronic structure of TiO2 in DSSCs as49
 | (1) |
 | (2) |
The recombination resistance (Rrec) at the TiO2/dye/electrolyte interface was plotted versus applied potential in Fig. 8b. The order of the Rrec for all TiO2 follows R > D ∼ F > T, consistent with the order of their VOC under 1 sun illumination. The potential dependence of Rrec follows the Buttler–Volmer relationship as49
 | (3) |
 | (4) |
In order to determine the effect of recombination kinetics on the cell performance, it is also useful to plot Rrecversus total electron density (n), which can be obtained from Cμ by the following equation57
 | (5) |
As shown in Fig. S8,† cell F shows slightly lower Rrec at a fixed n compared with cell D, suggesting slightly faster recombination at the surface of mcTiO2 in cell F. Also taking D as the reference, R showed similar kinetics and T showed the slowest. By comparing Rrecversus potential and Rrecversus n plots, one can observe an obvious shift of R and T, which means recombination kinetics is not the determinant of Rrec at fixed potential. One possible reason is that their different crystallinity and surface states (denoted by Ns) make more contributions to the value of R0 therefore Rrec. The smallest Ns for sample R leads to the highest Rrec among all TiO2, while the highest Ns for sample T due to the highest surface area drops off its Rrec in potential plots. This is also consistent with the conclusion based on the Cμ analysis. For cell F, considering the similar surface states between cell F and cell D, the slightly faster recombination kinetics results in slightly lower Rrec at high applied potential. However, at lower applied potential, Rrec of cell F becomes higher compared with cell D, which can be attributed to its shallower trap distribution. From eqn (2), the position of conduction band of TiO2 also alters the value of R0 therefore Rrec when different TiO2 is applied as photoanodes. Even though CB edge shifts of TiO2 with exposed {001} facets have been detected and reported in some published reports,58 the impact of this on Rrec is not significant here by comparing cell F and cell D. Electron lifetime calculated from τn = Rrec × Cμ was also plotted versus applied potential (Fig. 8c) and total electron concentration (Fig. S8†). The lifetime follows the same trends as Rrec in both plots, further supporting the discussion based on Rrec results.
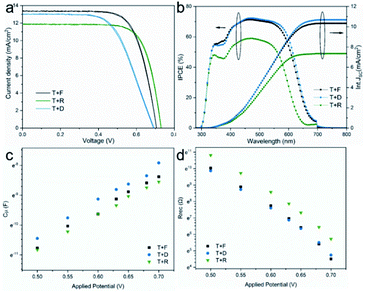
On the basis of the above characterization and analysis, it can be seen that mcTiO2 possesses similar dye uptake capability to commercial nanoparticle TiO2 due to the high surface area from nanosized building-blocks, excellent light scattering behaviour similar to commercial large-size particles because of the overall mesocrystal size, and reasonable electron transport ability and recombination resistance, resulting from the porous mesocrystal structure and the crystallographic order of nanoparticles. Such a combination of properties in one material makes TiO2 mesocrystals promising photoanodes for DSSCs and also prospective candidates in other applications. However, the high reflectance may limit its performance in single-layer photoelectrodes. To make the best use of all the properties from the specific structure, mcTiO2 was also tested as a scattering layer on top of transparent nanoparticle TiO2 films made from Solaronix T. In this configuration, as shown in the schematic illustration (Fig. S9†), the portion of light which passes through the transparent layer will be scattered for greater path length following Mie's scattering theory.39 As a result, optimal light harvesting can be reached when both layers possess excellent dye coverage. Compared with commercial reflective TiO2 in T+R, mcTiO2 in T + F has similar light scattering (see Fig. S9†) but higher dye loading in the scattering layer, leading to better utilization of forward scattered light therefore higher JSC as shown in Fig. 9a and Table 2. Compared with commercial diffuse TiO2 in T + D, mcTiO2 in T + F has higher light reflection. But the presence of the transparent layer avoids waste of the backward scattered light. As a consequence of the optimised light harvesting, T + F showed similar current to T + D. This was consistent with the recorded incident photon-to-current conversion efficiency (IPCE) spectra and integrated JSC from IPCE spectra (Fig. 9b), showing similar IPCE from T + F and T + D and lower maximum with T + R.
| TiO2 | Dye loading (nmol cm−2) | V OC (V) | J SC (mA cm−2) | FF | PCE (%) |
|---|---|---|---|---|---|
| a Mean values ± s.d. are shown, as obtained from 3 devices for T + R, and 5 devices for T + F. | |||||
| T + F | 108.78 | 0.71 (0.70 ± 0.01) | 13.42 (13.1 ± 0.18) | 0.71 (0.67 ± 0.04) | 6.73 (6.10 ± 0.47) |
| T + D | 105.03 | 0.69 (0.69 ± 0.01) | 13.04 (13.0 ± 0.12) | 0.61 (0.59 ± 0.01) | 5.53 (5.28 ± 0.15) |
| T + R | 71.36 | 0.73 (0.72 ± 0.01) | 11.89 (11.9 ± 0.07) | 0.74 (0.69 ± 0.03) | 6.43 (5.91 ± 0.33) |
The average VOC of DSSCs is 0.70 ± 0.01 V, 0.69 ± 0.01 V, and 0.72 ± 0.01 V for T + F, T + D and T + R, respectively. This is consistent with their inverse order of chemical capacitance and the order of recombination resistance, as shown in Fig. 9c and d. Exponential trap distribution parameter α for three two-layers photoanodes was also calculated based on Fig. 9c and listed in Table S4.† It is not surprising that they have similar α values, therefore similar trap distribution, since commercial nanoparticle TiO2 (T) was used as main working layer in all three photoanodes. The additional scattering layer modifies the electronic structure of the three photoanodes to varying degrees. In terms of Cμ, three photoelectrodes follow the order T + D > T + F > T + R. As discussed above, the lowest Cμ of T + R may come from the lowest total number of trap states, which is because of the high crystallinity of R. For T + F and T + D, considering their similar α and close crystallinity of mcTiO2 and diffractive TiO2 (D), the lower Cμ of T + F can be ascribed to the positive shift of CB edge according to eqn (2). This interpretation can be corroborated by Rrec analysis. From Fig. S10,† T + F has the lowest Rrec at fixed total electron concentration, indicating the recombination is faster on the surface of T + F, consistent with the observations in single-layer DSSCs. T + D and T + R have similar recombination kinetics. The smallest surface area of R leads to the lowest Ns therefore the highest Rrec at fixed potential, in line with the highest VOC of T + R. The Ns of T + F and T + D are regarded to be similar because of their similar surface area estimated from dye uptake and similar trap distribution depth from the same α value. In this case, there should be some impacts from other aspects to offset the fast recombination kinetics of T + F in order to endow it with comparable Rrec at fixed applied potential and slightly higher VOC under 1 sun illumination compared with T + D. According to eqn (4), the aforementioned positive CB edge shift of mcTiO2 in T + F may explain the results.
The long-term stability of DSSCs using different TiO2 as scattering layers was evaluated by recording the PCE of cells kept in dark and ambient condition. The results are given in Fig. S11.† After 92 days, the cell T + F still showed 96.8% of the initial efficiency, as good as the cells based on all commercial TiO2 photoanodes.
Conclusions
In summary, we have demonstrated a facile and versatile method to prepare mesocrystal films by making the printable paste of the topotactic precursor followed by in situ topotactic transformation of printed films. In this work we prove that this technique works very well for anatase TiO2. The obtained mcTiO2 from printed NH4TiOF3 films possesses typical structural features of mesocrystals, which brings properties associated with individual nanoparticles, advantages from the crystallographic orientation of nanoparticles and collective functions of the mesocrystal. In a specific application, DSSCs, we applied the mcTiO2 as single-layer photoanodes, in which the properties from the structural features were discussed and compared with commercial TiO2 in detail; and also as scattering layer to make better use of all the structural properties. Compared with commercial scattering TiO2, mcTiO2 showed a better performance as the scattering layer owing to its high dye loading capacity, superior visible light scattering and reasonable charge transport. We believe that the mcTiO2 films from in situ topotactic transformation could also make the best use of the structural features in other applications using porous TiO2. Furthermore, this method simplifies manufacturing processes for mesocrystal films and opens up general opportunities for other functional ceramic films.Author contributions
BL designed, carried out and analysed most of the practical work and drafted the manuscript. AVO carried out confirmatory PCE measurements and the IPCE measurements. NR directly supervised most of the work and both NR and AI inputted into manuscript preparation and results interpretation.Conflicts of interest
There are no conflicts to declare.Acknowledgements
The authors thank Dr Aaron Naden for TEM measurements in the University of St. Andrews. We thank Dr Nicola Cayzer for help with the SEM images acquisition. B. L. gratefully acknowledges China Scholarship Council and The University of Edinburgh for a PhD scholarship. A. I. acknowledges UK Research and Innovation (UKRI), Engineering and Physical Sciences Research Council (EPSRC) for the Fellowship grant (EP/P011500/1), the EPSRC ECR Capital Equipment grant and ScotCHEM for funding IPCE setup.References
- S. Franz, H. Arab, G. L. Chiarello, M. Bestetti and E. Selli, Adv. Energy Mater., 2020, 10, 2000652 CrossRef CAS.
- H. Wei, E. F. Rodriguez, A. F. Hollenkamp, A. I. Bhatt, D. Chen and R. A. Caruso, Adv. Funct. Mater., 2017, 27, 1703270 CrossRef.
- S. So, I. Hwang, J. Yoo, S. Mohajernia, M. Mačković, E. Spiecker, G. Cha, A. Mazare and P. Schmuki, Adv. Energy Mater., 2018, 8, 1800981 CrossRef.
- Z. Zheng, F. Zhuge, Y. Wang, J. Zhang, L. Gan, X. Zhou, H. Li and T. Zhai, Adv. Funct. Mater., 2017, 27, 1703115 CrossRef.
- A. H. Mamaghani, F. Haghighat and C. S. Lee, J. Photochem. Photobiol. Chem., 2019, 378, 156–170 CrossRef CAS.
- B. O'Regan and M. Grätzel, Nature, 1991, 353, 737–740 CrossRef.
- E. J. W. Crossland, N. Noel, V. Sivaram, T. Leijtens, J. A. Alexander-Webber and H. J. Snaith, Nature, 2013, 495, 215–219 CrossRef CAS PubMed.
- N. Vlachopoulos, A. Hagfeldt, I. Benesperi, M. Freitag, G. Hashmi, G. Jia, R. A. Wahyuono, J. Plentz and B. Dietzek, Sustain. Energy Fuels, 2021, 5, 367–383 RSC.
- M. Kokkonen, P. Talebi, J. Zhou, S. Asgari, S. A. Soomro, F. Elsehrawy, J. Halme, S. Ahmad, A. Hagfeldt and S. G. Hashmi, J. Mater. Chem. A, 2021, 9, 10527–10545 RSC.
- J. Maçaira, L. Andrade and A. Mendes, Sol. Energy Mater. Sol. Cells, 2016, 157, 134–138 CrossRef.
- S. Ashraf, R. Su, J. Akhtar, H. M. Siddiqi, A. Shuja and A. El-Shafei, Sol. Energy, 2020, 199, 74–81 CrossRef CAS.
- Q. Huaulmé, V. M. Mwalukuku, D. Joly, J. Liotier, Y. Kervella, P. Maldivi, S. Narbey, F. Oswald, A. J. Riquelme, J. A. Anta and R. Demadrille, Nat. Energy, 2020, 56(5), 468–477 CrossRef.
- Z.-Q. Li, Y.-P. Que, L.-E. Mo, W.-C. Chen, Y. Ding, Y.-M. Ma, L. Jiang, L.-H. Hu and S.-Y. Dai, ACS Appl. Mater. Interfaces, 2015, 7, 10928–10934 CrossRef CAS PubMed.
- F. Zhao, R. Ma and Y. Jiang, Appl. Surf. Sci., 2018, 434, 11–15 CrossRef CAS.
- N. Fu, Y. Liu, Y. Liu, W. Lu, L. Zhou, F. Peng and H. Huang, J. Mater. Chem. A, 2015, 3, 20366–20374 RSC.
- Z.-Q. Li, L.-E. Mo, W.-C. Chen, X.-Q. Shi, N. Wang, L.-H. Hu, T. Hayat, A. Alsaedi and S.-Y. Dai, ACS Appl. Mater. Interfaces, 2017, 9, 32026–32033 CrossRef CAS PubMed.
- X. Miao, K. Pan, Y. Liao, W. Zhou, Q. Pan, G. Tian and G. Wang, J. Mater. Chem. A, 2013, 1, 9853–9861 RSC.
- H. Cölfen and M. Antonietti, Angew. Chem., Int. Ed., 2005, 44, 5576–5591 CrossRef PubMed.
- J. Seto, Y. Ma, S. A. Davis, F. Meldrum, A. Gourrier, Y.-Y. Kim, U. Schilde, M. Sztucki, M. Burghammer, S. Maltsev, C. Jäger and H. Cölfen, Proc. Natl. Acad. Sci. U.S.A., 2012, 109, 3699–3704 CrossRef CAS PubMed.
- A.-W. Xu, M. Antonietti, H. Cölfen and Y.-P. Fang, Adv. Funct. Mater., 2006, 16, 903–908 CrossRef CAS.
- D. Wu, Y. Wang, N. Ma, K. Cao, W. Zhang, J. Chen, D. Wang, Z. Gao, F. Xu and K. Jiang, Electrochim. Acta, 2019, 305, 474–483 CrossRef CAS.
- L. Zhou, D. Smyth-Boyle and P. O'Brien, J. Am. Chem. Soc., 2008, 130, 1309–1320 CrossRef CAS PubMed.
- Z. Zhang, H. Nagashima and T. Tachikawa, Angew. Chem., 2020, 132, 9132–9139 CrossRef.
- W. Cao, W. Wang, H. Shi, J. Wang, M. Cao, Y. Liang and M. Zhu, Nano Res., 2018, 11, 1437–1446 CrossRef CAS.
- G. Zhu, J. Yang, C. Bao, X. Zhang, Z. Ji, S. Wu and X. Shen, J. Colloid Interface Sci., 2016, 468, 136–144 CrossRef CAS PubMed.
- D. Wu, K. Cao, H. Wang, F. Wang, Z. Gao, F. Xu, Y. Guo and K. Jiang, J. Colloid Interface Sci., 2015, 456, 125–131 CrossRef CAS PubMed.
- M. Di, Y. Li, H. Wang, Y. Rui, W. Jia and Q. Zhang, Electrochim. Acta, 2018, 261, 365–374 CrossRef CAS.
- Y. Guo, H. Li, J. Chen, X. Wu and L. Zhou, J. Mater. Chem. A, 2014, 2, 19589–19593 RSC.
- H. You, Q. Wu, J. Li, S. He, X. Li, X. Yang, J. Yang, Y. Meng, S. Tong and M. Wu, CrystEngComm, 2017, 19, 2456–2463 RSC.
- J. Ye, W. Liu, J. Cai, S. Chen, X. Zhao, H. Zhou and L. Qi, J. Am. Chem. Soc., 2011, 133, 933–940 CrossRef CAS PubMed.
- P. Liu, K. Zhu, K. Bian, Y. Xu, F. Zhang, W. Zhang, W. Huang and J. Zhang, J. Power Sources, 2018, 395, 158–162 CrossRef CAS.
- L. Zhou, D. S. Boyle and P. O'Brien, Chem. Commun., 2007, 144–146 RSC.
- T. Shinagawa, M. Watanabe, J. Tani and M. Chigane, Cryst. Growth Des., 2017, 17, 3826–3833 CrossRef CAS.
- X. Y. Kong, T. Tong, B.-J. Ng, J. Low, T. H. Zeng, A. R. Mohamed, J. Yu and S.-P. Chai, ACS Appl. Mater. Interfaces, 2020, 12, 26991–27000 CrossRef CAS PubMed.
- F. Xie, G. Dong, K. Wu, Y. Li, M. Wei and S. Du, Chem. Phys. Lett., 2020, 739, 136996 CrossRef CAS.
- S. Ito, T. N. Murakami, P. Comte, P. Liska, C. Grätzel, M. K. Nazeeruddin and M. Grätzel, Thin Solid Films, 2008, 516, 4613–4619 CrossRef CAS.
- O. Boytsova, I. Dovgaliuk, D. Chernyshov, A. Eliseev, P. O'Brien, A. J. Sutherland and A. Bosak, J. Appl. Crystallogr., 2019, 52, 23–26 CrossRef CAS.
- C. F. Macrae, I. Sovago, S. J. Cottrell, P. T. A. Galek, P. McCabe, E. Pidcock, M. Platings, G. P. Shields, J. S. Stevens, M. Towler and P. A. Wood, J. Appl. Crystallogr., 2020, 53, 226–235 CrossRef CAS PubMed.
- G. Mie, Ann. Phys., 1908, 330, 377–445 CrossRef.
- E. Hao, N. A. Anderson, J. B. Asbury and T. Lian, J. Phys. Chem. B, 2002, 106, 10191–10198 CrossRef CAS.
- Y. J. Son, J. S. Kang, J. Yoon, J. Kim, J. Jeong, J. Kang, M. J. Lee, H. S. Park and Y. E. Sung, J. Phys. Chem. C, 2018, 122, 7051–7060 CrossRef CAS.
- J. Zhu, S. Wang, Z. Bian, S. Xie, C. Cai, J. Wang, H. Yang and H. Li, CrystEngComm, 2010, 12, 2219–2224 RSC.
- Y. Liu, Y. Zhang and J. Wang, CrystEngComm, 2012, 15, 791–801 RSC.
- N. M. Laptash, I. G. Maslennikova and T. A. Kaidalova, J. Fluorine Chem., 1999, 99, 133–137 CrossRef CAS.
- R. Karthik, N. Karikalan and S. M. Chen, Carbohydr. Polym., 2017, 164, 102–108 CrossRef CAS PubMed.
- C. Yao, X. Yin, Y. Yu, Z. Cai and X. Wang, Adv. Funct. Mater., 2017, 27, 1700794 CrossRef.
- E. Gabrielsson, H. Ellis, S. Feldt, H. Tian, G. Boschloo, A. Hagfeldt, L. Sun, E. Gabrielsson, H. Tian, L. Sun, H. Ellis, S. M. Feldt, G. Boschloo and A. Hagfeldt, Adv. Energy Mater., 2013, 3, 1647–1656 CrossRef CAS.
- F. Fabregat-Santiago, J. Bisquert, G. Garcia-Belmonte, G. Boschloo and A. Hagfeldt, Sol. Energy Mater. Sol. Cells, 2005, 87, 117–131 CrossRef CAS.
- S. R. Raga, E. M. Barea and F. Fabregat-Santiago, J. Phys. Chem. Lett., 2012, 3, 1629–1634 CrossRef CAS PubMed.
- J. A. Anta, F. Casanueva and G. Oskam, J. Phys. Chem. B, 2006, 110, 5372–5378 CrossRef CAS PubMed.
- F.-S. Francisco, I. Mora-Seró, A. Germà Garcia-Belmonte and J. Bisquert, J. Phys. Chem. B, 2002, 107, 758–768 Search PubMed.
- W. Yan, M.-M. Huo, R. Hu and Y. Wang, RSC Adv., 2019, 9, 1734–1740 RSC.
- T. Berger, T. Lana-Villarreal, D. Monllor-Satoca and R. Gómez, J. Phys. Chem. C, 2007, 111, 9936–9942 CrossRef CAS.
- Z. M. Beiley, E. T. Hoke, R. Noriega, J. Dacuña, G. F. Burkhard, J. A. Bartelt, A. Salleo, M. F. Toney and M. D. McGehee, Adv. Energy Mater., 2011, 1, 954–962 CrossRef CAS.
- J. Lin, M. Guo, C. T. Yip, W. Lu, G. Zhang, X. Liu, L. Zhou, X. Chen and H. Huang, Adv. Funct. Mater., 2013, 23, 5952–5960 CrossRef CAS.
- Q. Wang, S. Ito, M. Grätzel, F. Fabregat-Santiago, I. Mora-Seró, J. Bisquert, B. Takeru and H. Imai, J. Phys. Chem. B, 2006, 110, 25210–25221 CrossRef CAS PubMed.
- P. R. F. Barnes, K. Miettunen, X. Li, A. Y. Anderson, T. Bessho, M. Gratzel and B. C. O'Regan, Adv. Mater., 2013, 25, 1881–1922 CrossRef CAS PubMed.
- J. De Peng, H. H. Lin, C. T. Lee, C. M. Tseng, V. Suryanarayanan, R. Vittal and K. C. Ho, RSC Adv., 2016, 6, 14178–14191 RSC.
Footnote |
| † Electronic supplementary information (ESI) available: Detail information of used dye and commercial pastes; XRD patterns of films from commercial pastes; SEM images of mcTiO2 films from more heating rate; EDS spectrum and elemental composition of mcTiO2; schematic illustrations of photoanodes; EIS parameters and plots as function of total electron concentration. See DOI: 10.1039/d1se01791h |
| This journal is © The Royal Society of Chemistry 2022 |

