 Open Access Article
Creative Commons Attribution 3.0 Unported Licence
Transparent porous polymer sheets for efficient product separation in solar water splitting†
Ciler
Özen
 a,
Keisuke
Obata
 a,
Peter
Bogdanoff
a,
Nursidik
Yulianto
bc,
Hutomo Suryo
Wasisto
bd and
Fatwa F.
Abdi
a,
Peter
Bogdanoff
a,
Nursidik
Yulianto
bc,
Hutomo Suryo
Wasisto
bd and
Fatwa F.
Abdi
 *a
*a
aInstitute for Solar Fuels, Helmholtz-Zentrum Berlin für Materialien und Energie GmbH, Hahn-Meitner-Platz 1, Berlin 14109, Germany. E-mail: fatwa.abdi@helmholtz-berlin.de
bInstitute of Semiconductor Technology (IHT) and Laboratory for Emerging Nanometrology (LENA), Technische Universität Braunschweig, Braunschweig 38106, Germany
cResearch Center for Physics, National Research and Innovation Agency (BRIN), Jl. Kawasan Puspiptek No. 441-442, South Tangerang 15314, Indonesia
dPT Nanosense Instrument Indonesia, Umbulharjo, Yogyakarta 55167, Indonesia
First published on 9th December 2021
Abstract
Efficient product separation is an essential requirement for the safe operation and implementation of solar water splitting devices. Ion exchange membranes are typically used, but for a device that requires sunlight illumination to travel from one electrode to the other, these membranes may introduce parasitic absorption and reduce the achievable device efficiency. Here, we investigate the feasibility of utilizing transparent polymer sheets as separators in solar water splitting devices. Porosity is introduced into the polymer sheets by femtosecond laser-patterned micropore arrays with various diameters and pitch distances. Our experimental data and numerical simulation results show that these polymer sheets not only have low parasitic absorption, but also lower resistances as compared to a commercial anion exchange membrane. Finally, product crossover through the transparent porous separators is evaluated using a particle tracing model under the realistic operation conditions of solar water splitting devices. Minimal crossover can be obtained by optimizing the separator as well as the operational parameters.
Introduction
Green hydrogen production technologies have received significant attention due to increasing environmental concerns over traditional energy production methods.1–4 One interesting method of producing green hydrogen is photoelectrochemical (PEC) water splitting, in which light-absorbing semiconductors, often coated with additional electrocatalysts, are immersed in aqueous solutions to drive the hydrogen evolution reaction (HER) and oxygen evolution reaction (OER). This approach is often compared with the indirect coupling of photovoltaic cells and electrolyzers, and it has been argued that PEC systems may be beneficial in terms of thermal integration and lower overall hydrogen cost due to fewer Balance of System (BOS) components.5–8 Solar-to-hydrogen (STH) efficiencies approaching 20% have been reported with devices based on high quality III–V photoabsorbers,9–11 while devices based on complex oxide absorbers have shown more modest efficiencies of ∼8%.12,13 With these appreciable efficiencies demonstrated, efforts on device engineering have been the focus of many studies, particularly in order to minimize device losses and to enable increasing scale and output power of the devices.14–19 Devices with total photoactive area as large as 6400 cm2 and output power up to 27 W have been reported.11,20One consideration especially important for large-scale implementation of PEC devices is efficient product separation. Several device architectures have been proposed in the literature, and an interesting one is the membrane-less configuration.14,21 In such a configuration, product separation is achieved through the hydrodynamic control of the device. It has been shown that minimal crossover can be achieved despite the absence of membrane.21,22 However, it is still not clear whether any safety regulators would allow large-scale implementation of membrane-less devices.23,24 For safe device operation and production of high purity products, ion exchange membranes are often employed as a separator between the anode and the cathode to avoid mixing of product gases (H2 and O2). Nonetheless, most membranes, especially the anion exchange ones, are not optically transparent.25–27 This is a problem especially for tandem devices—most demonstrated devices use tandem configuration—since the use of membranes will introduce parasitic absorption and decrease the number of photons that reach the photoelectrodes.
In this study, we propose the use of porous polymer sheets as transparent separators in a PEC water splitting device. We show that porous polymer sheets have higher transmittance compared with that of anion exchange membranes. At the same time, lower ohmic drop can be obtained with these porous polymer sheets. The relationship between the various properties of the transparent separators (e.g., porosity, pore diameter and thickness of separator) and the ohmic drop is revealed. A multi-physics numerical model is also developed to simulate this relationship, and we found a good agreement between the numerical simulation and the experimental results. Finally, the effectiveness of these transparent separators in preventing product crossover is assessed by performing numerical simulations based on a particle tracing two-phase flow model.
Experimental and numerical methods
Sample fabrication and characterization
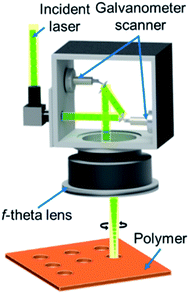
Transparent polyester (Mylar) and fluorinated ethylene propylene (FEP) films (RS Pro, RS Components GmbH) of various thicknesses were used as the starting point for the fabrication of the transparent porous separators. Mylar and FEP are structurally solid, and their yield strengths are ∼100 and 12 MPa, respectively, which is at least 2 orders of magnitude higher than the operating pressure of a standard solar water splitting cell (i.e., 1 bar). The transmission of these films was determined from UV-vis measurements using a PerkinElmer Lambda 950 spectrophotometer. The films were processed to become porous separators containing hole arrays utilizing a femtosecond laser micromachining technique, which offers several benefits during material ablation (i.e., low heat-affected zone production, fast and dry process, and high precision).28 Other than polymer structuring, this method has recently been implemented in the lift-off and transfer process of gallium nitride (GaN) thin-film and microscale light-emitting diodes (LEDs).29,30 Similar to the underlying mechanism for femtosecond laser lift-off of semitransparent semiconductor materials (e.g., InGaN/GaN LEDs), the use of laser enables the processing of transparent polymers via nonlinear optical interaction, which prevents heating effect surrounding the microholes during the laser ablation process.31–33 The ultra-fast laser system based on an Yb-based commercial femtosecond laser source (SPIRIT-1040, Newport Spectra-Physics GmbH, Germany) was used in this study. This laser has constant parameters, i.e., a center wavelength of 520 nm, a pulse width of 350 fs, and a repetition rate of 200 kHz. The laser beam passed through a galvanometer scanner (IntelliSCAN III, SCANLAB GmbH, Germany) onto a telecentric f-theta objective lens and the sample positioner underneath, which is controlled by an integrated software to produce various micropatterns on the sample workpiece (see Fig. 1). The diameter and pitch of the microholes on the polymer sheets were measured using ImageJ software from the captured optical microscopic images.In order to measure the resistance of the separators, electrochemical impedance measurements were performed in a two-electrode configuration using a VersaSTAT 3 potentiostat. Both the anode and cathode were 200 nm Pt electrodes (active area 6 cm2) on FTO substrates that were pre-deposited with 5 nm Ti as an adhesion layer. Pt and Ti depositions were carried out by electron beam evaporation in a high vacuum deposition chamber pumped by a typical dry turbo molecular pumping set with a typical base pressure of 2 × 10⁻⁷ mbar. The Ti and Pt deposition rates were 0.15 and 0.65 nm s−1, respectively, as controlled during the deposition using a quartz crystal microbalance. The surface of Pt electrodes was connected to an electrical wire with a conductive tape, which was afterwards insulated using an epoxy resin. Impedance measurements were carried out with these two electrodes, separated at 1.8 cm, with and without the porous separator in the middle of the cell. The resistance of the porous separator (Rsep) was determined by taking the difference between these two measurements. For each configuration, at least 5 different measurements were performed, and the obtained values were averaged and presented with error bars in this paper. Prior to each impedance measurements, the porous separators were submerged several times. 0.2 M potassium phosphate (KPi) buffer (pH 7) solutions were used as the electrolytes, which were prepared by dissolving KH2PO4 (Sigma-Aldrich, 99.0%) and K2HPO4·3H2O (Sigma-Aldrich, 99.0%) in Milli-Q water (18.2 MΩ cm). The conductivity of the electrolyte was ∼20 mS cm−1.
As reference, the properties (e.g., transmission, resistance) of a commercial anion exchange membrane (100 μm, 551642S, Lot no. 105849, VWR Chemicals) were also measured and compared to those of the transparent porous separators. Anion exchange membrane was used here instead of a more common cation exchange membrane (e.g., Nafion) since it has been reported that the use of cation exchange membranes in phosphate buffer electrolytes resulted in larger concentration overpotentials due to pH gradient as compared to when anion exchange membranes was used.34
Model description
The numerical model used in this study considers the following processes: (i) oxygen evolution reaction (OER) at the anode, (ii) hydrogen evolution reaction (HER) at the cathode, (iii) ionic and dissolved gas transport within the electrolyte solution, (iv) continuous supply of the electrolyte and (v) transport and removal of gaseous hydrogen and oxygen. Since the focus of this study is on the separator and its impact on additional ohmic losses and product crossover, we ignored transport of holes and electrons within the electrode, i.e., the electrode is assumed to be extremely thin and only the electrode surface is considered. Ohmic losses and product crossover through the separator were analyzed in two separate models as described below. COMSOL Multiphysics® 5.6 was used as the numerical tool for the solution of both models.Electrochemistry: modeling of ohmic losses
A 2D electrochemical model domain is used in this study, as illustrated in Fig. S1.† The domain consists of two face-to-face electrodes (i.e., anode and cathode) and a separator that separates the product gases (i.e., O2 and H2). The dimensions used were chosen, so that they mimic the experimental setup as close as possible. A constant average current density (japp) was applied at the anode, and the potential at the cathode was set to be zero. OER at the anode and HER at the cathode were modeled with Butler–Volmer equation,35,36 considering the parameters listed in Table S2.† Ionic transport in the electrolyte solution (diffusion, migration, and convection) was modeled using Nernst–Planck equation. A continuous inflow of the electrolyte from the bottom of the cell was considered, and the velocity profile of electrolyte flow was assumed to be laminar and calculated using the mass and momentum conservation (Navier–Stokes equation). Detailed mathematical description of the system, the optimized mesh configurations of the computational domain and COMSOL implementation are presented in the ESI, Note 1. Steady-state solutions were carried out using the multifrontal massively parallel sparse (MUMPS) direct solver.The initial validity of the 2D model described above and in ESI, Note 1 was tested by several comparisons. First, the electrolyte potential distribution obtained using a more computationally expensive 3D model (with smaller domain sizes) and the 2D model was compared (see Fig. S3†). Good agreement was found, suggesting that the 2D model can sufficiently represent the system. The 2D model was therefore employed throughout the study.
Next, two different approaches of introducing the separator porosity into the model were considered. The first approach considered individual pores of the separator introduced into the structure (i.e., the separator was divided into solid and liquid domains, and only the liquid domain was evaluated in the simulation) (Fig. S4†). As an alternative, the second approach only considered a single domain for the separator, and the porosity was included by introducing Bruggeman correction for the diffusion coefficients of ions and dissolved gases.37
| Di,eff = ε3/2Di | (1) |
Particle tracing: modeling of product crossover throughout separator
Gas bubble crossover and dissolved gas crossover were analyzed for all the different separator configurations by means of numerical model. We took into account the realistic configuration of a solar water splitting cell that will be oriented at an angle facing the sunlight illumination. A fixed tilt angle of 30° was considered (0° corresponds to horizontal orientation and 90° vertical orientation), based on the reported optimal angle for PV panels in Europe.38 It was recently shown that higher product crossover is obtained when the anode is considered as the upward-facing electrode, due to the gas–liquid interaction.22,39 In this model, we therefore only consider oxygen gas bubble movement from the upward-facing electrode, which was calculated considering the drag and gravity forces (eqn (2)). | (2) |
Here, mp, and v are particle mass and particle velocity vector, respectively. FD and Fg are the drag and gravity forces, respectively. The drag force was calculated using the Hadamard–Rybczynski equation. Constant fluxes of gas bubbles and dissolved gasses were assumed to be perpendicular on the anode surface, which were calculated based on the current density and the bubble formation efficiency (ηbubble) of 0.5.21,39 The bubble diameter was considered to be constant at 100 μm.21 Similar to the electrochemistry model above, the bottom of the cell was taken as the inlet of the electrolyte, and the velocity profile of electrolyte flow was assumed to be laminar and calculated using the mass and momentum conversation (Navier–Stokes equation). A one way coupling between the laminar flow and the particle tracing was assumed (i.e., bubble movement impact on the electrolyte velocity profile was ignored). Detailed boundary conditions, parameters used, optimized mesh configurations of the computational domain and detailed model implementation in COMSOL are explained in ESI, Note 2. Direct method (PARDISO) for laminar flow and iterative generalized minimum residual (GMRES) method for time dependent particle tracing model were carried out. The product crossover was quantified by integrating the amount of particle (i.e., product gas bubble) and concentration of dissolved gas that crosses the anolyte into the catholyte chamber through the separators. Preliminary crossover experiments to validate the model was performed; the description and the results are shown in ESI, Note 2.
Results and discussion
Porous polymer sheets as transparent separators
The transparency of polyester (Mylar) and FEP films was first evaluated by performing UV-vis transmission measurements. Fig. 2 shows the transmittance spectra of both polymer sheets, which are also compared with that of anion exchange membrane (AEM). At wavelengths >600 nm, Mylar and AEM have similar transmittance, but Mylar films transmit more light than AEM at lower wavelengths. This is important, since the peak irradiance of the solar spectrum lies within this wavelength range (∼500–600 nm). The transmission of FEP films is even higher than both AEM and Mylar films across all wavelength range. The spectra for AM1.5 intensity transmitted through these films are also plotted in Fig. 2. Overall, both polymer sheets (i.e., Mylar and FEP) demonstrate a good potential to be used as more transparent separators than AEM.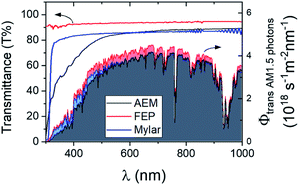 | ||
| Fig. 2 Transmittance spectra (left y-axis) of polyester films (Mylar, ∼23 μm), fluorinated ethylene propylene films (FEP, ∼25 μm) and anion exchange membrane (AEM). The spectra for AM1.5 photon intensity transmitted through these films (right y-axis) are also shown accordingly. Transmittance spectra for FEP and Mylar films of other thicknesses are shown in Fig. S6.† | ||
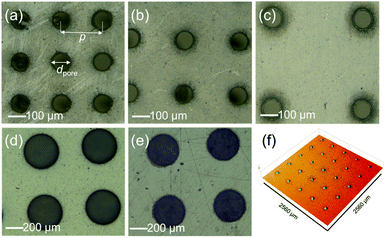
The polymer sheets were then processed to introduce the porosity using laser micromachining. The ablation thresholds or the minimal energy densities required to initiate removal for different materials (i.e., Mylar and FEP films) were first determined. Other studies have reported that the ablation threshold fluence might vary between ∼0.2 and ∼0.8 J cm−2 depending on the target polymer films.31,40 Here, the ablation threshold for FEP and PET were investigated at 0.6 and 0.84 J cm−2, respectively.41,42 Although such low fluence levels can modify the polymer surfaces, only minor ablated marks are created on those films. In our case, to drill through the whole film thickness and to fabricate homogenous micro-hole arrays in an area of 5 × 5 cm2, a constant average laser power of 4 W having a peak fluence of ∼7.7 J cm−2 was required during laser processing. Note that this value is lower than the energy to drill through a ceramic and soda lime glass of 9.14 and 26.0 J cm−2, respectively.43,44 In this experiment, a laser scanning speed of 0.5 m s−1 was used with 15× repetition. The circular microhole arrays having various diameters (dpore = 100–400 μm) and pitches (p = 200–800 μm) were created by laser drilling through the polymer films (see Fig. 3). The laser beam has a diameter of ∼20 μm when focused on the target surface. To perforate the polymer sheets, the laser beam erodes the circle edge area. Here, the process results in abrasive deviation in the circle edge during the laser micro-cutting process through several repetitions. Therefore, the fabricated holes possess slightly larger diameters than initially intended, as listed in Table S1.†
Ohmic resistance of transparent porous separators
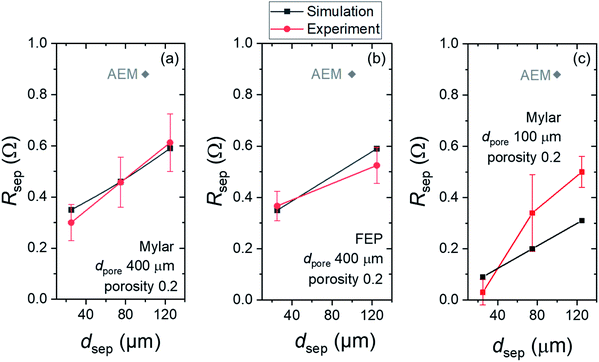
The contribution of separators to the total ohmic losses was calculated numerically and measured experimentally. All parameters used in the simulation are listed in Table S2.† In the numerical model, the electrical potential differences between the anode and cathode surfaces were simulated with and without the various separators. These potential differences were transformed to resistances by considering the applied current density and the respective size of the separators. Experimentally, impedance measurements were carried out with and without separator to determine the separator resistance. The numerical results were then quantitatively compared with the experimental data.Fig. 4a shows the experimentally obtained and simulated resistances (Rsep) of Mylar films with various thicknesses (dsep) but the same dpore of 400 μm and porosity of 0.2. As expected, experimentally obtained Rsep rises with increasing dsep, from a value of 0.30 ± 0.07 Ω for the 25 μm-thick films to 0.61 ± 0.1 Ω for the 125 μm-thick films. These values agree very well with the simulated values. The same dataset for FEP films (dpore of 400 μm and porosity of 0.2) is plotted in Fig. 4b. Again, we observe the same trend, and the Rsep values seem to be independent of the type of polymer sheets (Mylar vs. FEP). As a comparison, the Rsep value of a commercial AEM is also indicated. For both Mylar and FEP, even the thickest films studied here have lower Rsep than that of AEM. This indicates not only that these polymer films introduce lower parasitic absorption (vide supra) but using them as separators will also result in lower ohmic losses in the overall device. It should also be noted that a reduction of ∼0.3–0.5 Ω may seem to be trivial, but in large-scale devices where the operating current can reach several hundreds of mA or even several A,11,18,45,46 the impact on the resulting ohmic losses can be very significant.
We also evaluate the impact of varying dpore to the resulting Rsep values. Fig. 4c shows Rsepvs. dsep for Mylar films with dpore of 100 μm. The same trend of increasing Rsep with thicker dsep is observed. However, the overall values are lower than those films with dpore of 400 μm despite having the same dsep and porosity. Simulated and experimentally obtained values show reasonable agreement, but a larger deviation than those in Fig. 4a and b is observed. We attribute this to the larger relative errors of dpore and pitch p—and thus the porosity—in the fabricated films (Table S1†).
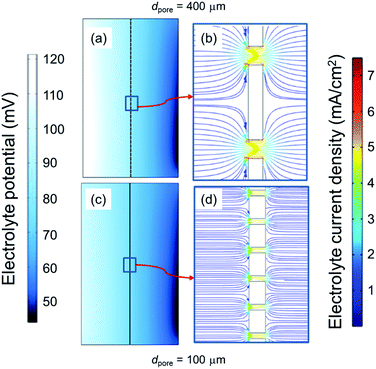
In order to understand the reason behind the lower Rsep values for smaller dpore, a closer look at the electrolyte potential and current density distribution between the electrodes is needed. In the numerical model, we therefore modified the pore diameter of the separator but kept the porosity and thickness constant. Fig. 5 compares the electrolyte potential and current density distribution in systems with separators of different dpore, 400 μm and 100 μm. Lower dpore results in lower electrical potential difference (see Fig. 5a and c). We attribute this to the more uniform current density distribution as the pores become more closely packed. Indeed, as shown in Fig. 5b and d, decreasing dpore from 400 to 100 μm lowers the maximum electrolyte current density in the pores by ∼15% (7 vs. 6 mA cm−2).
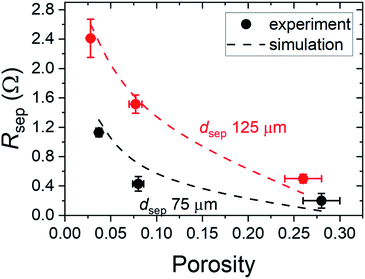
Finally, the influence of porosity on Rsep is shown in Fig. 6 for Mylar films with dpore of 100 μm. For films with the thickness of 125 μm, Rsep decreases from 2.4 to 0.5 Ω by increasing the porosity from 0.03 to 0.28. The same trend is observed for films with lower thickness showing overall lower Rsep. The simulated values also agree well with the experimental data.
Product crossover of transparent porous separators
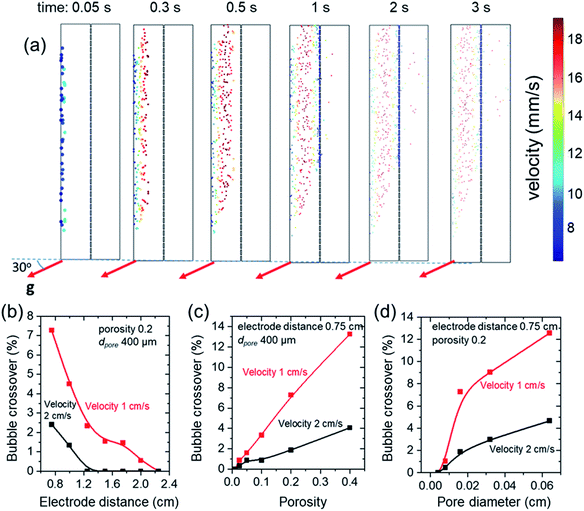
Upon establishing that the transparent porous separators can offer lower ohmic losses in solar water splitting systems, we now turn our attention to the effectiveness of these separators to prevent product crossover. Using our particle tracing model (see Model description section and ESI, Note 2), we simulated the product gas bubbles and dissolved gas crossover through the separator with various parameters, i.e., electrode distance, porosity, pore diameters. The model was validated by performing preliminary product gas crossover experiments, as described and shown in the ESI, Note 2. As mentioned earlier, we consider a device tilt angle of 30° from the horizontal orientation, as it corresponds to the optimal angle for sunlight utilization in Europe,38 and the anode is the upward-facing electrode as this represents the more conservative condition (i.e., higher product crossover).22 We found that due to the laminar flow present in the cell dissolved O2 does not cross from the anolyte to the catholyte even in the most pessimistic case considered here, such as shortest electrode distance, lower velocity, largest pore diameter and porosity (see Fig. S8†). This is in contrast to the case where no electrolyte flow is introduced into the cell (see Fig. S9†); in this case, significant crossover is expected, which highlights the importance of electrolyte flow in minimizing crossover. Since we always introduce inlet velocity in our simulations, we therefore discuss only the product gas bubble crossover from the particle tracing simulation in the remainder of this study.Fig. 7a illustrates the simulated release of O2 bubbles from the anode surface at different time values. With increasing time, it can be clearly seen that bubbles move away from the electrode and picked up their velocities (due to gravity and drag forces), up to the point where they reach the separator. Due to the porous nature of the separator (in this case, dpore is 400 μm and porosity is 0.2), most O2 bubbles remain in the anolyte and only several of them cross to the catholyte. The impact of the pore diameters and porosity to the amount of bubble crossing to the catholyte can be qualitatively observed in the ESI, Movies S1–S3.† As expected, a higher number of bubbles can be observed in the catholyte when a separator with larger pore diameter or higher porosity is used.
The bubble crossover is quantified by integrating the ratio of O2 bubbles in the catholyte to the total produced O2 bubbles at time >3 s (after this point, the amount of crossover already saturates). The bubble crossover is shown in Fig. 7b–d as a function of the distance between electrodes, separator porosity and pore diameters at two different electrolyte inlet velocity values. As expected, product bubble crossover can be suppressed by increasing electrode distance, decreasing porosity, and reducing pore diameter. When the inlet electrolyte velocity is 2 cm s−1, the product bubble crossover is found to be negligible when the electrode distance is >1.2 cm, and no safety concern (i.e., bubble crossover >4%) is observed for almost all different cases of separator porosity and pore diameters. Decreasing the inlet electrolyte velocity to 1 cm s−1 increases the crossover, since the lower electrolyte velocity close to the anode allows for higher flux of O2 bubbles to reach the separator. Safe conditions were achieved for electrode distance larger than 1 cm (porosity = 0.2 and dpore = 400 μm, see Fig. 7b), for porosity equal to or lower than 0.1 (electrode distance/cell width = 0.75 cm, dpore = 400 μm, see Fig. 7c), and for pore diameter lower than 400 μm (electrode distance/cell width = 0.75 cm, porosity = 0.2, see Fig. 7d).
Optimization of porosity for minimum power losses
Finally, we can now summarize the overall impact of tailoring the physical properties of the polymer sheets on their efficiency as product separators in a solar water splitting cell. Fig. 6 and 7 indicate that increasing porosity of the separator decreases the ohmic loss but increases the product bubble crossover. This trade-off suggests that an optimum porosity exists that minimizes the overall loss within the solar water splitting cell. We define the ohmic power loss (Ploss,ohmic) and product bubble crossover power loss (Ploss,crossover) by the following equations:| Ploss,ohmic = japp2 × ρsep × dsep | (3) |
| Ploss,crossover = jcrossover × V0 | (4) |
ρ sep is the resistivity of the separator (calculated based on the experimentally obtained Rsep and the separator area), jcrossover is the portion of japp that is lost due to product bubble crossover, and V0 is water splitting redox potential (i.e., 1.23 V). By dividing each of these power losses with the power input of sunlight irradiation (100 mW cm−2), the ohmic and crossover efficiency losses (ηohmic/solar and ηcrossover/solar) can then be calculated. In the case of the oxygen producing electrode as the upward-facing electrode, which is the condition simulated in our study, we note that we already assume any O2 bubble crossover to be completely lost and decreasing the H2 production at the cathode. In other words, the worst-case scenario is considered in terms of the efficiency loss in eqn (4).
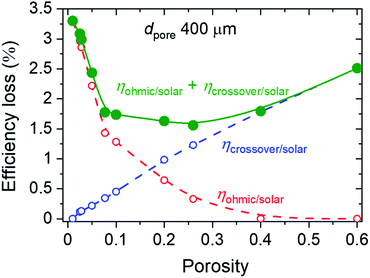
Fig. 8 illustrates the influence of porosity on ηohmic/solar (red squares) and ηcrossover/solar (blue triangles) for japp = 10 mA cm−2, dpore = 400 μm, and dsep of 125 μm. The anode-to-cathode distance was set to be 0.75 cm. By increasing the porosity, ηohmic/solar decreases from values above 3% to practically zero for porosity larger than 0.4, while ηohmic/solar increases to >2%. The combination of these two losses (green circles) is also shown in Fig. 8, and a minimum total efficiency loss of ∼1.5% is observed at the porosity of ∼0.25. This analysis highlights that optimization is necessary, also depending on other parameters of the cell design and operation (e.g., pore diameter, electrode distance, and current density), in order to determine the porosity at which the loss is minimized. For example, when all parameters in the previous analysis is maintained but the pore diameter is decreased to 100 μm, the total efficiency loss monotonously decreases with increasing porosity (Fig. S10†), since the product bubble crossover is negligible for all porosity values and the total loss is only determined by the ohmic loss.
Finally, we briefly compare the efficiency losses with that of AEM. Since no product bubble crossover is expected when AEM is used, the total efficiency loss is only composed of the ohmic loss. Based on the Rsep value in Fig. 4, the ηohmic/solar of AEM is ∼0.5%. This value is lower than the total efficiency losses when porous separators with dpore = 400 μm and any porosity are used (Fig. 8), but higher than those when separators with dpore = 100 μm and porosity >0.2 are used (Fig. S10†). In the end, the choice of the transparent separator vs. AEM should consider these losses as well as the parasitic absorption loss (Fig. 2), which largely depends on the bandgap of the photoabsorber used in the solar water splitting cell.
Conclusions
In summary, we have investigated the potential of using polymer sheets, specifically polyester (Mylar) and fluorinated ethylene propylene (FEP), as transparent separators in solar water splitting devices. Both sheets have higher transmittance than commercial anion exchange membranes; FEP especially transmits >90% of the light across the UV-vis-NIR wavelength range. Using a combination of experiments and numerical simulations, we have also shown that not only these polymer sheets have low parasitic absorption, but they also have lower resistances as compared to commercial anion exchange membranes when microarrays of pores are introduced by laser micromachining onto these polymer sheets. A thorough parametric analysis was done to show the influence of e.g., porosity, pore diameter, thickness on the added ohmic loss by introducing these transparent porous separators, and a good agreement was achieved between the simulation and experimental results. Finally, the product crossover in a solar water splitting cell that uses the transparent porous separators was evaluated using particle tracing simulations under realistic device conditions, e.g., relevant current density and device tilted at 30° to face the sunlight irradiation. As expected, increasing the porosity of the separators increases the product bubble crossover, which competes with the advantageous effect of decreased ohmic loss. Based on this trade-off relationship, an optimization study was carried out and we have shown that a particular porosity exists at which the total efficiency loss (i.e., product bubble crossover + ohmic loss) can be minimized. Similar optimization efforts would be needed for systems with other device operational and design parameters. Overall, our study demonstrates that transparent porous polymer sheets can be used as efficient product separators in solar water splitting devices.Author contributions
F. F. A. conceived the idea of the study, obtained the funding and supervised the project. C. Ö. performed all the electrochemical measurements, developed the numerical model and performed the simulations with the help of K. O. F. F. A. and P. B. performed and analyzed the crossover validation experiments. N. Y. and H. S. W. fabricated the transparent porous polymer sheets using femtosecond laser and characterized them. C. Ö. wrote the first draft of the manuscript. All authors contributed to the scientific discussion and editing of the manuscript.Conflicts of interest
There are no conflicts to declare.Acknowledgements
We thank Karsten Harbauer for the preparation of the electrodes used in this study. K. O. and F. F. A. acknowledge support from the Deutsche Forschungsgemeinschaft (DFG, German Research Foundation) under Germany's Excellence Strategy – EXC 2008/1 (UniSysCat) – 390540038 and from the German Helmholtz Association – Excellence Network – ExNet-0024-Phase2-3. N. Y. and H. S. W. acknowledge the financial support from the Lower Saxony Ministry for Science and Culture (N-MWK) for LENA-OptoSense and the German Federal Ministry of Education and Research (BMBF) for SiNanoBatt project under the Southeast Asia – Europe Joint Funding Scheme for Research and Innovation. This work was carried out with the support of the Helmholtz Energy Materials Foundry (HEMF), a large-scale distributed research infrastructure founded by the German Helmholtz Association, through the use of the Solar Fuels Testing Facility and Solar Fuels Devices Facility. N. Y. and H. S. W thank Prof Andreas Waag for providing the research infrastructure at Institute of Semiconductor Technology (IHT) and Laboratory for Emerging Nanometrology (LENA), TU Braunschweig.Notes and references
- R. S. El-Emam and H. Ozcan, J. Cleaner Prod., 2019, 220, 593–609 CrossRef CAS.
- I. Dincer and C. Acar, Int. J. Energy Res., 2015, 39, 585–606 CrossRef.
- S. Dutta, Energy Fuels, 2021, 35, 11613–11639 CrossRef CAS.
- S. Atilhan, S. Park, M. M. El-Halwagi, M. Atilhan, M. Moore and R. B. Nielsen, Curr. Opin. Chem. Eng., 2021, 31, 100668 CrossRef.
- M. R. Shaner, H. A. Atwater, N. S. Lewis and E. W. McFarland, Energy Environ. Sci., 2016, 9, 2354–2371 RSC.
- R. R. Gutierrez and S. Haussener, Sustainable Energy Fuels, 2021, 5, 2169–2180 RSC.
- E. Nurlaela, T. Shinagawa, M. Qureshi, D. S. Dhawale and K. Takanabe, ACS Catal., 2016, 6, 1713–1722 CrossRef CAS.
- R. van de Krol and B. A. Parkinson, MRS Energy & Sustainability, 2017, 4, E13 Search PubMed.
- M. M. May, H.-J. Lewerenz, D. Lackner, F. Dimroth and T. Hannappel, Nat. Commun., 2015, 6, 8286 CrossRef CAS PubMed.
- W.-H. Cheng, M. H. Richter, M. M. May, J. Ohlmann, D. Lackner, F. Dimroth, T. Hannappel, H. A. Atwater and H.-J. Lewerenz, ACS Energy Lett., 2018, 3, 1795–1800 CrossRef CAS.
- S. Tembhurne, F. Nandjou and S. Haussener, Nat. Energy, 2019, 4, 399–407 CrossRef CAS.
- X. Shi, H. Jeong, S. J. Oh, M. Ma, K. Zhang, J. Kwon, I. T. Choi, I. Y. Choi, H. K. Kim and J. K. Kim, Nat. Commun., 2016, 7, 11943 CrossRef CAS PubMed.
- J. H. Kim, J.-W. Jang, Y. H. Jo, F. F. Abdi, Y. H. Lee, R. van de Krol and J. S. Lee, Nat. Commun., 2016, 7, 13380 CrossRef CAS PubMed.
- F. F. Abdi, R. R. G. Perez and S. Haussener, Sustainable Energy Fuels, 2020, 4, 2734–2740 RSC.
- C. Carver, Z. Ulissi, C. K. Ong, S. Dennison, G. H. Kelsall and K. Hellgardt, Int. J. Hydrogen Energy, 2012, 37, 2911–2923 CrossRef CAS.
- X. Yao, D. P. Wang, X. Zhao, S. S. Ma, P. S. Bassi, G. Yang, W. Chen, Z. Chen and T. Sritharan, Energy Technol., 2018, 6, 100–109 CrossRef CAS.
- A. Hankin, F. E. Bedoya-Lora, C. K. Ong, J. C. Alexander, F. Petter and G. H. Kelsall, Energy Environ. Sci., 2017, 10, 346–360 RSC.
- I. Y. Ahmet, Y. Ma, J.-W. Jang, T. Henschel, B. Stannowski, T. Lopes, A. Vilanova, A. Mendes, F. F. Abdi and R. van de Krol, Sustainable Energy Fuels, 2019, 3, 2366–2379 RSC.
- I. Holmes-Gentle, H. Agarwal, F. Alhersh and K. Hellgardt, Phys. Chem. Chem. Phys., 2018, 20, 12422–12429 RSC.
- K. R. Tolod, S. Hernández and N. Russo, Catalysts, 2017, 7, 13 CrossRef.
- I. Holmes-Gentle, F. Hoffmann, C. A. Mesa and K. Hellgardt, Sustainable Energy Fuels, 2017, 1, 1184–1198 RSC.
- K. Obata, A. Mokeddem and F. F. Abdi, Cell Rep. Phys. Sci., 2021, 2, 100358 CrossRef CAS.
- A. Berger, R. A. Segalman and J. Newman, Energy Environ. Sci., 2014, 7, 1468–1476 RSC.
- E. Verlage, S. Hu, R. Liu, R. J. R. Jones, K. Sun, C. Xiang, N. S. Lewis and H. A. Atwater, Energy Environ. Sci., 2015, 8, 3166–3172 RSC.
- S. Chabi, A. G. Wright, S. Holdcroft and M. S. Freund, ACS Appl. Mater. Interfaces, 2017, 9, 26749–26755 CrossRef CAS.
- W. White, C. D. Sanborn, D. M. Fabian and S. Ardo, Joule, 2018, 2, 94–109 CrossRef CAS.
- S. Chabi, K. M. Papadantonakis, N. S. Lewis and M. S. Freund, Energy Environ. Sci., 2017, 10, 1320–1338 RSC.
- P. Zhang, L. Chen, J. X. Chen and Y. L. Tu, Opt Laser. Eng., 2017, 98, 69–75 CrossRef.
- H. S. Wasisto, J. D. Prades, J. Gulink and A. Waag, Appl. Phys. Rev., 2019, 6, 041315 Search PubMed.
- S. Bornemann, N. Yulianto, H. Spende, Y. Herbani, J. D. Prades, H. S. Wasisto and A. Waag, Adv. Eng. Mater., 2020, 22, 1901192 CrossRef CAS.
- S. Ravi-Kumar, B. Lies, X. Zhang, H. Lyu and H. T. Qin, Polym. Int., 2019, 68, 1391–1401 CrossRef CAS.
- N. Yulianto, G. T. M. Kadja, S. Bornemann, S. Gahlawat, N. Majid, K. Triyana, F. F. Abdi, H. S. Wasisto and A. Waag, ACS Appl. Electron. Mater., 2021, 3, 778–788 CrossRef CAS.
- N. Yulianto, A. D. Refino, A. Syring, N. Majid, S. Mariana, P. Schnell, R. A. Wahyuono, K. Triyana, F. Meierhofer, W. Daum, F. F. Abdi, T. Voss, H. S. Wasisto and A. Waag, Microsyst. Nanoeng., 2021, 7, 32 CrossRef CAS PubMed.
- E. A. Hernandez-Pagan, N. M. Vargas-Barbosa, T. Wang, Y. Zhao, E. S. Smotkin and T. E. Mallouk, Energy Environ. Sci., 2012, 5, 7582–7589 RSC.
- S. Haussener, C. X. Xiang, J. M. Spurgeon, S. Ardo, N. S. Lewis and A. Z. Weber, Energy Environ. Sci., 2012, 5, 9922–9935 RSC.
- Electrochemical Methods – Fundamentals and Applications, ed. A. J. Bard and L. R. Faulkner, John Wiley & Sons, New York, 2000 Search PubMed.
- D. Bruggeman, Ann. Phys., 1935, 24, 636–679 CrossRef CAS.
- M. Z. Jacobson and V. Jadhav, Sol. Energy, 2018, 169, 55–66 CrossRef.
- K. Obata and F. F. Abdi, Sustainable Energy Fuels, 2021, 5, 3791–3801 RSC.
- S. Lazare and P. Benet, J. Appl. Phys., 1993, 74, 4953–4957 CrossRef CAS.
- A. Bartnik, H. Fiedorowicz, R. Jarocki, J. Kostecki and M. Szczurek, Appl. Phys. A, 2009, 98, 61 CrossRef.
- Y. Sato, M. Tsukamoto, T. Shinonaga and T. Kawa, Appl. Phys. A, 2016, 122, 184 CrossRef.
- Y. Chen, Y. Cao, Y. Wang, L. Zhang, G. Shao and J. Zi, Ceram. Int., 2020, 46, 9741–9750 CrossRef CAS.
- H. Huang, L.-M. Yang and J. Liu, Opt. Eng., 2014, 53, 051513 CrossRef.
- A. Landman, H. Dotan, G. E. Shter, M. Wullenkord, A. Houaijia, A. Maljusch, G. S. Grader and A. Rothschild, Nat. Mater., 2017, 16, 646–651 CrossRef CAS.
- A. Fallisch, L. Schellhase, J. Fresko, M. Zedda, J. Ohlmann, M. Steiner, A. Bosch, L. Zielke, S. Thiele, F. Dimroth and T. Smolinka, Int. J. Hydrogen Energy, 2017, 42, 26804–26815 CrossRef CAS.
Footnote |
| † Electronic supplementary information (ESI) available: Supplementary Fig. S1–S7, supplementary Tables S1–S3, supplementary Notes 1 and 2, supplementary Movies S1–S3. See DOI: 10.1039/d1se01475g |
| This journal is © The Royal Society of Chemistry 2022 |

