
 Open Access Article
 This Open Access Article is licensed under a
 Creative Commons Attribution 3.0 Unported Licence
Reflective leaky waveguide gratings (LWGs) with internal referencing for sensing
Ruchi
Gupta
 *a and
Nicholas J.
Goddard
b
*a and
Nicholas J.
Goddard
b
aSchool of Chemistry, University of Birmingham, Birmingham, B15 2TT, UK. E-mail: r.gupta.3@bham.ac.uk
bProcess Instruments (UK) Ltd, Turf Street, Burnley, BB11 3BP, UK. E-mail: nick.goddard@processinstruments.net
First published on 3rd March 2022
Abstract
Current transmission grating sensors are unsuitable for use in typical samples that absorb and scatter light. To overcome this limitation, we report leaky waveguide gratings (LWGs), which operate in reflective mode. The LWGs comprising alternating strips with and without recognition elements (herein, streptavidin) in (chitosan) hydrogel films were deposited on glass substrates. The strips were fabricated by laser interference lithography using a photocleavable biotin linker. The strips of LWGs were parallel to the plane of incidence, which contrasts with widely known waveguide grating couplers and surface plasmon resonance gratings. Hence, two-dimensional (2D) diffraction patterns were observed in the orthogonal spaces of angles of diffraction and incidence. Plots of intensity profiles of first diffracted orders of LWGs versus angles of incidence showed peaks close to resonance angles of LW strips without and with streptavidin. Differential measurements between these peaks allowed sensing of exemplar analytes, biotin–protein A and immunoglobulin G, and suppressed changes in sample composition by between 94.1 and 99.9%, providing a high degree of internal referencing.
I. Introduction
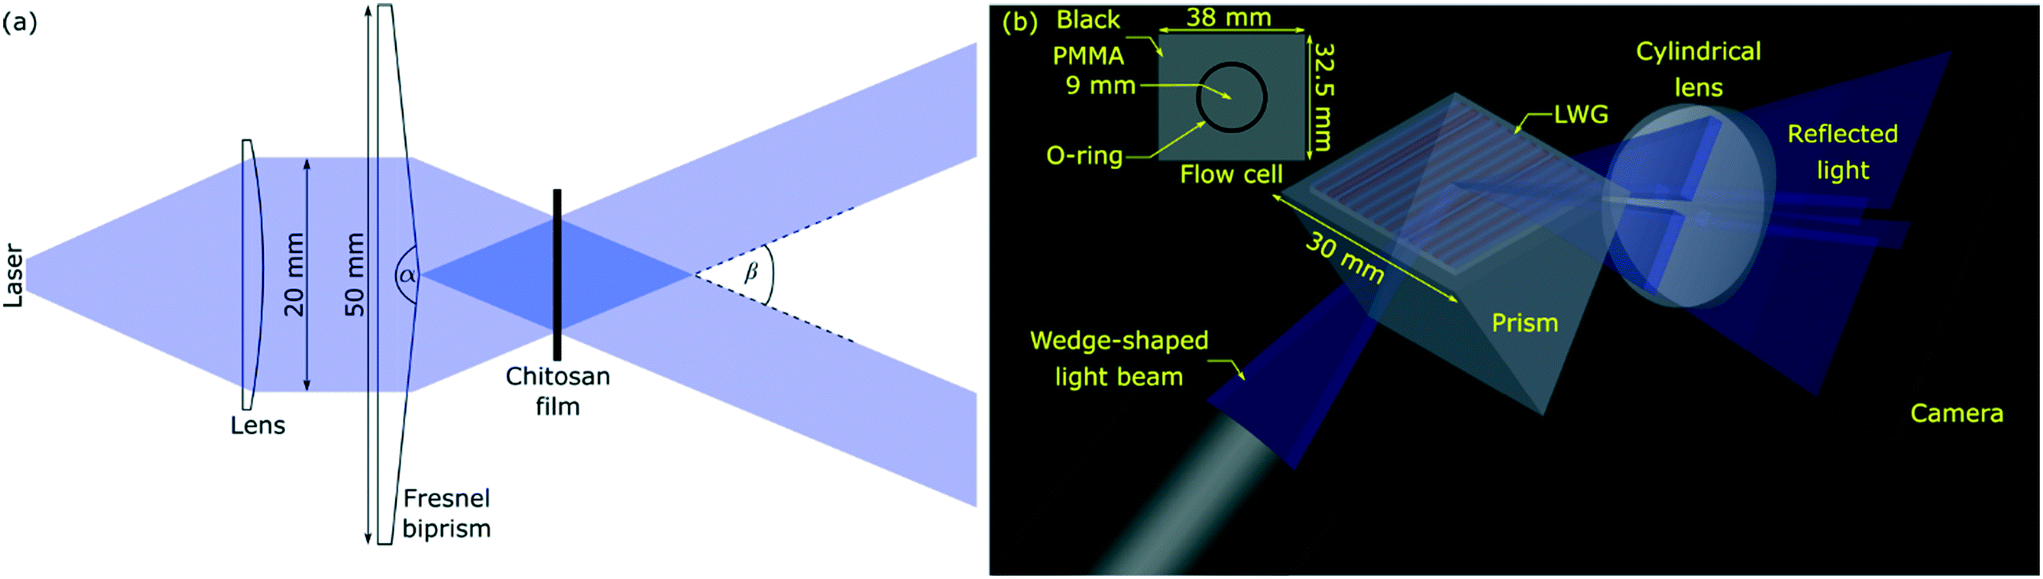
Hydrogel gratings have been used to sense a wide variety of analytes including microorganisms,1 proteins,2–5 glucose,6 pH,7,8 metal ions,9,10 and volatiles.11,12 In comparison to other label-free optical sensors,13–15 hydrogel gratings can provide more effective referencing because sensor and reference regions are closely spaced. Equally, hydrogel gratings are internally referenced, which means they comprise inherent features allowing analyte binding to be separated from common-mode effects such as interferents in sample solutions. Hydrogel gratings are a periodic array of hydrogel strips containing recognition elements (REs) in the form of antibodies,2,4,5 aptamers,3 and molecularly imprinted polymers (MIPs).1 Interactions of target analytes with REs change refractive index (RI) and/or geometrical parameters of hydrogel strips. As a result, diffraction efficiency2–5,9,10 and/or angular separation between zeroth and first diffracted orders change,1 one of which is measured to sense and quantify analytes. As shown in Fig. 1(a), current hydrogel gratings operate in transmission mode, which implies that light must pass through sample solutions on top of hydrogel gratings, and the diffraction pattern is captured on the opposite side of gratings and sample solutions to the incoming beam. Often sample solutions are “dirty” complex mixtures, and hence can absorb/scatter incoming light, which in turn can distort diffraction patterns of hydrogel gratings. Equally, being able to operate in transmission mode requires that microfluidic flow cells integrated with gratings are made of optically non-absorbing materials, and hence the choice of materials is restricted. For example, microfluidic flow cells made of commercial poly(methyl methacrylate) (PMMA), which contains UV-absorbing additives to prevent degradation by sunlight, can only be used for light with wavelength ≥400 nm.16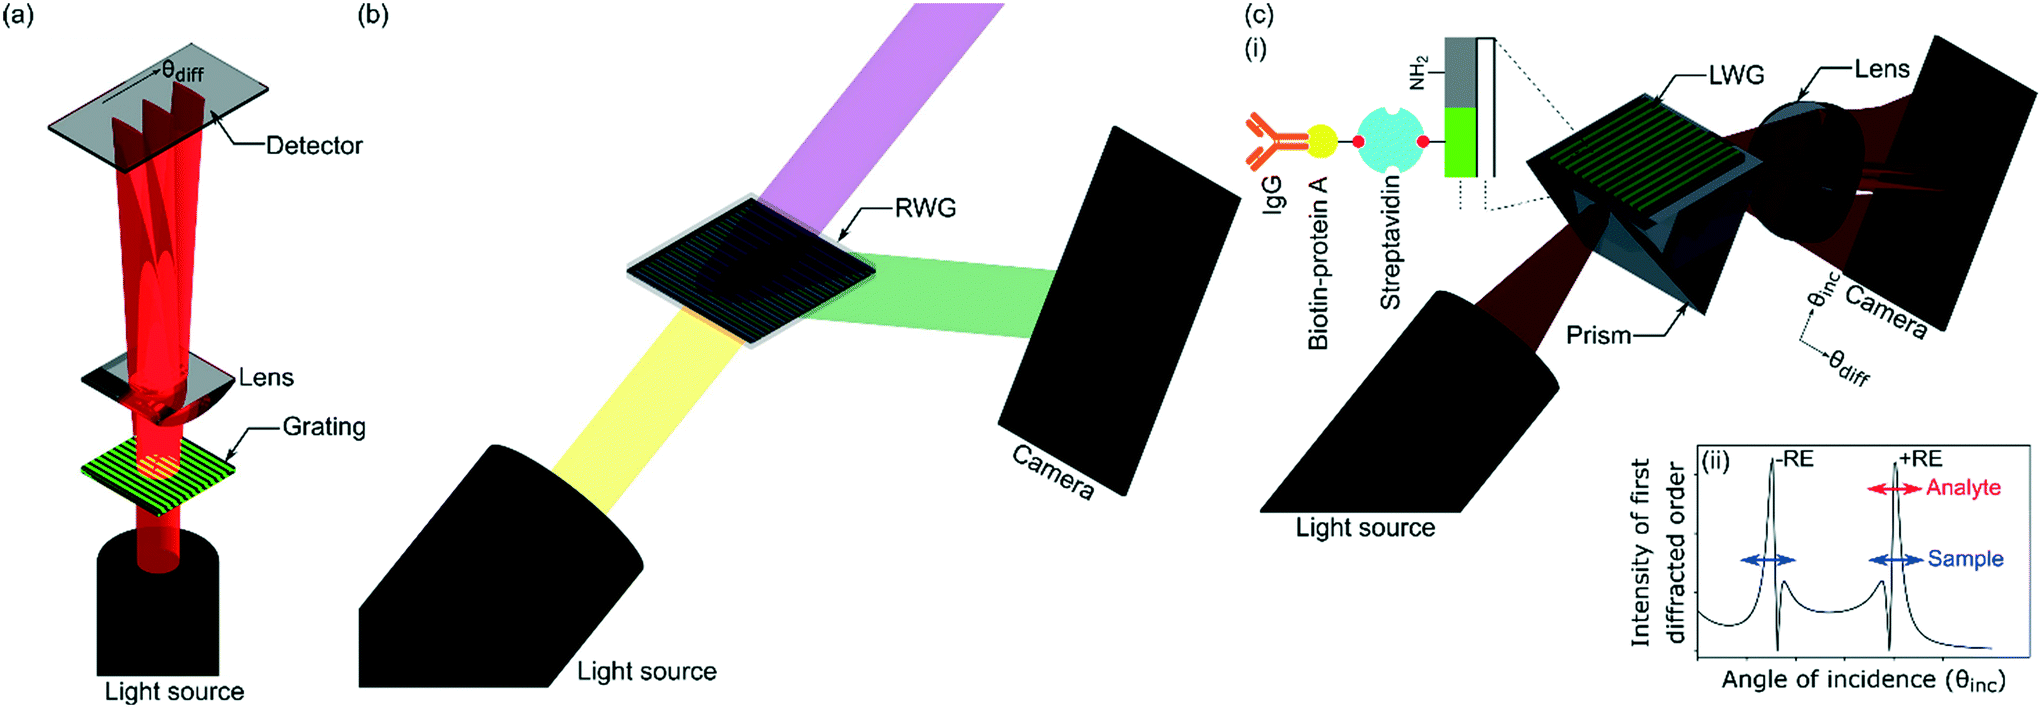 | ||
| Fig. 1 Schematics of (a) current transmission gratings, (b) previously reported resonant waveguide gratings (RWGs), and (c) herein reported reflective leaky waveguide gratings (LWGs) where inset (i) zoomed view of alternating strips, and (ii) plot of intensity of first diffracted orders versus angle of incidence (θdiff and θinc are angles of diffraction and incidence, −RE and +RE corresponds to position of first diffracted order to LW strips without and with recognition elements, exemplar RE was biotin/streptavidin complex, and exemplar analytes were biotin–protein A and IgG). | ||
To address the above limitations, we report leaky waveguide gratings (LWGs), which operate in reflective mode. As shown in Fig. 1, the operation principle of LWGs is different to previously reported waveguide grating couplers (WGCs)17–20 including resonant waveguide gratings (RWGs),21–23 surface plasmon resonance gratings (SPGs),24–28 and focal molography (FM)29,30 because leaky waveguide (LW) strips are parallel to the plane of incidence. Equally, light is coupled in/out of LWGs using a prism, but gratings are used in case of WGCs, RWGs, and some implementations of SPGs. FM shows some similarities to the present work, in that the REs are patterned using a photocleavable linker, and will provide internal referencing as common-mode effects will not significantly affect the output. The main differences between FM and LWG are that FM is an evanescent technique using a thin high RI waveguide and a monolayer of REs, the patterned REs are substantially perpendicular to the light propagating in the waveguide, and LWGs do not need sub-micron patterning. LWs show high sensitivity because they are not evanescent field sensors. In LWs, the optical mode is propagating in a low RI material that is porous to the analytes, which means that about 90% of the optical mode overlaps with the sensing chemistry. LWs are designed to reduce the evanescent field as much as possible. In contrast, high RI evanescent wave sensors such as RWGs and other grating-based guided mode resonance structures need to enhance the evanescent field to increase sensitivity as the guiding layer is non-porous to analytes. Typically, the fraction of the total field extending into the evanescent sensing region at resonance ranges from about 25% to 45%.31 Goddard et al. showed theoretically and experimentally that porous, low RI LWs (anti-resonant reflecting optical waveguides, ARROW) gave higher sensitivity, by a factor of about 3, than a resonant mirror (RM) evanescent sensor using a high RI silicon nitride guiding layer.32
As shown in inset (i) in Fig. 1(c) LWGs reported in this work are glass substrates underneath chitosan hydrogel films with an array of alternating microstrips of REs (in this case, streptavidin) and primary amines. As shown in Fig. 1(c), in LWGs, strips are parallel to the plane of incidence and two-dimensional (2D) diffraction patterns are observed in the orthogonal spaces of angles of diffraction and incidence. The inset (ii) in Fig. 1(c) is a plot of intensity profile of first diffracted orders of LWGs versus angle of incidence, which shows that peaks are observed close to each resonance angle of LW strips without and with REs. As shown by the red arrow in inset (ii) in Fig. 1(c), only the peak position of the first diffracted order corresponding to resonance angles of LW strips with REs changed because of analyte binding. In contrast, as shown by blue arrows in inset (ii) in Fig. 1(c), similar shifts in the peak positions of the first diffracted orders corresponding to LW strips without and with REs were observed because of changes in sample matrices. Thus, at equilibrium, differential measurements between the peaks of first diffracted orders corresponding to LW strips without and with REs of LWGs allowed analyte sensing with internal referencing. As shown in inset (i) in Fig. 1(c), we used biotin-protein A and immunoglobulin G (IgG) as exemplar analytes, and internal referencing capabilities of LWGs were demonstrated using sample solutions containing different concentrations of glycerol.
The key differences between this and our previous work on different types of LWs are summarised in Table 1 and discussed below.
| Diffraction-based leaky waveguides (LWs), 2021 (ref. 35–36) and 2020 (ref. 33) | Leaky waveguide gratings (LWGs) | ||
|---|---|---|---|
| 2013 (ref. 34) | Present work | ||
| Schematic | Unpatterned films or macrostrips of LWs without and with REs | Array of alternating microstrips of LWs and gaps | Array of alternating microstrips of LWs without and with REs |
|
|
|
|
| Operation principle | Interference between light reflected from LW at resonance and other angles. Light reflected from LW strips without and with REs do not interfere with each other | Interference between light reflected from LW strips and gaps | Interference between light reflected from LW strips without and with REs |
| Output | Interference fringes at resonance angles of LWs. No visible diffraction pattern | Only one diffraction pattern at resonance angle of LW strips | Two diffraction patterns at resonance angles of LW strips without and with REs |
| Materials | Chitosan films without and with strips of REs on glass substrates | Silica sol–gel strips and gaps on glass substrates | Chitosan films without and with strips of REs on glass substrates |
| Application | Sensing with internal referencing | Absorption spectroscopy without requiring an external spectrometer | Sensing with internal referencing |
• In this work, the strips with and without REs have been reduced in width by a factor of 65.5 compared to the report published in 2020,33 meaning that the diffraction angle out of the plane of incidence at a wavelength of 475 nm has been increased from 0.014 to 1.78 degrees. With the wider strips, no diffraction pattern is visible, and each strip effectively acts as an independent LW. The narrower strips are not visible as independent LWs, but instead give a diffraction pattern at resonance angles where the reflected light is undergoing a rapid 2π phase shift.
• In addition to the observation of diffraction out of the plane of incidence, the narrower strips will result in much more rapid thermal and chemical equilibration between adjacent strips, in this case by a factor of ∼4300. For example, in water the thermal diffusion time for the narrower strips is about 0.8 ms compared to about 3.5 s for the wider strips.
• The hydrogel layer of the current work is continuous, so the strips without REs act as reference waveguides, unlike the earlier work from 2013 (ref. 34) where the gaps between the waveguide strips do not support a LW mode and therefore cannot act as a reference. The earlier work did not describe the use of the LWG as a biosensor; it was concerned with using the LWG as a spectroscopic sensor.
II. Experimental
Chemicals and materials
Ethanol, 1 M acetic acid, 25% (v![[thin space (1/6-em)]](https://www.rsc.org/images/entities/char_2009.gif) :v) glutaraldehyde (GA), (4-(2-hydroxyethyl)-1-piperazineethanesulfonic acid) (HEPES), semicarbazide hydrochloride (ScZ·HCl), biotin-protein A (P2165), and rabbit immunoglobulin G (IgG, I5006) were bought from Sigma-Aldrich. Phosphate buffered saline (PBS, 10×), pH 7.4 was bought from Generon. Decon 90, glycerol (Mw: 92) and chitosan (Mw: 100000–300000, 90% deacetylated) were purchased from Fisher Scientific. Microscope glass slides and NHS-(PEG)12-biotin were bought from VWR. Streptavidin (2-0203-100) was purchased from IBA Lifesciences. NHS-PEG3-PC-biotin (PC-biotin, BP-24161) was bought from BroadPharm where the photocleavable (PC) group was 4,5-dimethoxy-2-nitrobenzyl chloroformate (NVOC). Materials used to make fluidic flow cells consisted of 3 mm thick black PMMA sheets, bootlace ferrules (211-4252), and nitrile O-rings (01-08-01801), which were purchased from Fred Aldous, RS Components, and Ashton Seals, respectively.
:v) glutaraldehyde (GA), (4-(2-hydroxyethyl)-1-piperazineethanesulfonic acid) (HEPES), semicarbazide hydrochloride (ScZ·HCl), biotin-protein A (P2165), and rabbit immunoglobulin G (IgG, I5006) were bought from Sigma-Aldrich. Phosphate buffered saline (PBS, 10×), pH 7.4 was bought from Generon. Decon 90, glycerol (Mw: 92) and chitosan (Mw: 100000–300000, 90% deacetylated) were purchased from Fisher Scientific. Microscope glass slides and NHS-(PEG)12-biotin were bought from VWR. Streptavidin (2-0203-100) was purchased from IBA Lifesciences. NHS-PEG3-PC-biotin (PC-biotin, BP-24161) was bought from BroadPharm where the photocleavable (PC) group was 4,5-dimethoxy-2-nitrobenzyl chloroformate (NVOC). Materials used to make fluidic flow cells consisted of 3 mm thick black PMMA sheets, bootlace ferrules (211-4252), and nitrile O-rings (01-08-01801), which were purchased from Fred Aldous, RS Components, and Ashton Seals, respectively.
Fabrication
Glass microscope slides were cut into ∼25.4 × 25.4 mm2 squares, and sonicated in Decon 90, de-ionised water, and ethanol for 30 min each. 1.1% (w:v) solution of purified chitosan37,38 prepared in 0.1 M acetic acid was spin coated at 1000 rpm with an acceleration of 100 rpm s−1 for 30 s. Each slide with spin coated chitosan film was dried for 3 min at 75–80% humidity and 25 °C, immersed in 0.03125% (v:v) GA solution for 10 min, washed with, and stored in, 100 mM HEPES buffer, pH 7.4.
All solutions used for patterning chitosan films were prepared in 100 mM HEPES buffer, pH 7.4. The amines in chitosan films were reacted with 1 mg ml−1 of PC-biotin solution for 30 min.33 Buffer washes were performed after each step. The films were immersed in 1.25% (w:v) ScZ·HCl solution (pH adjusted to 7.4) for 20 min. ScZ·HCl solution scavenges by-products produced during photo removal of NVOC.39 Finally, chitosan films were exposed to a laser interference lithography (IL) set-up (see Fig. 2(a)) for 10 min to generate an array of alternating strips without and with biotin. Resulting chitosan films were washed and stored in buffer under dark.
 | ||
| Fig. 2 Schematics of (a) laser IL (α and β are apex and crossing angles, respectively) and (b) LWG set-ups where, inset in (b) shows the dimensions of the flow cell. | ||
Instrumentation
The details of key instrumentation used in this work are provided below.Laser IL set-up
A schematic of the IL set-up used in this work is shown in Fig. 2(a). Light from a laser (L375P70MLD Thorlabs) with a peak wavelength (λIL) of 375 nm and power of 70 mW was passed through a collimating lens (63DQ25, Comar Optics) to obtain a beam with a diameter of 20 mm. The power density of the expanded laser beam was ∼22 mW cm−2. The beam was split into two converging beams by passing through a silica Fresnel biprism (FB) with an apex angle of 177 deg (Newlight Photonics). The two beams interfered to produce an interference pattern with cosinusoidally varying light intensity.40 This interference pattern was projected on chitosan films, which had been previously reacted with PC-biotin, and while being immersed in ScZ·HCl solution.Set-up for LWG studies
Light from a blue LED with peak wavelength of 475 nm (Lumileds LUXEON Z LXZ1-PB01, RS Components) was passed through an achromatic doublet (63DQ25, Comar Optics) to obtain an unpolarised collimated beam. The collimated beam was passed through a cylindrical lens (63YD25, Comar Optics) to obtain a wedge beam as shown in Fig. 2(b). The beam aperture was ∼5.5 mm wide. Chitosan film with an array of alternating strips of biotin deposited on a glass substrate was placed on an equilateral prism with 30 × 30 mm2 faces. The array of strips was parallel to the plane of incidence as shown in Fig. 2(b). Reflected light was captured on a camera (Mercury Daheng MER-2000-19U3M, GeT Cameras BV) to obtain two-dimensional (2D) reflectivity curves either without or with a 160 mm focal length cylindrical lens placed in front of the camera. In both cases, the camera was placed 210 mm away from the centre of the LWG.A black PMMA sheet (38 × 32.5 × 3 mm3) with a circular cavity of 9 mm radius surrounded by a groove 1 mm wide and 0.75 mm deep to mount an O-ring served as flow cell. The flow cell was mounted on top of a LWG, and solutions were pumped using a MINIPULS 3 peristaltic pump (Gilson) at a volumetric flow rate of 3 μL s−1. The RI of solutions was measured using RFM900-T refractometer (Bellingham and Stanley). All protein solutions were prepared in 10 mM PBS, pH 7.4.
III. Results and discussion
Theoretical diffraction patterns of LWGs
As LWGs were fabricated by exposing chitosan films with PC-biotin to interference fringes of the IL set-up, the expected grating pitch (Λexp) is given by eqn (1).41,42 | (1) |
| β = α − 2cos−1(nFBcos(α/2)) | (2) |
 | (3) |
| ηm = J2m(Δφ) | (4) |
LWGs are cosinusoidally varying phase gratings because the distribution of PC-biotin and hence streptavidin in chitosan films was cosinusoidal. This cosinusoidal distribution of PC-biotin was verified by fluorescence imaging of fluorescein isothiocyanate bound to the freed amines.51 Thus, the ηm of LWGs can be estimated by eqn (4). However, unlike transmission gratings, LWGs are illuminated with a range of angles of incidence and the phase of light reflected from strips without and with streptavidin is a function of angle of incidence. To determine Δφ between light reflected from strips without and with streptavidin versus angles of incidence, it was essential to estimate the thickness and RI of chitosan strips without and with streptavidin.
To estimate the thickness and RI of chitosan strips without and with streptavidin, we used non-patterned chitosan LWs. 2D reflectivity curves were captured while PBS, NHS-(PEG)12-biotin, PBS, and streptavidin solutions were introduced sequentially. A 2D reflectivity curve while the chitosan LW was being irrigated with PBS is shown in Fig. 3(a) where a dip-peak pair was observed at each resonance angle.35,36 As two sets of dip-peak were observed, it implies that the chitosan film supported two optical LW modes, which are marked as LW0 and LW1 in Fig. 3(a). The optical modes are leaky because the RI of chitosan films is lower than glass substrates.36 The leaky optical modes were coupled in and out of chitosan films on glass substrates using a prism. The observed reflectivity curve is the average of the TE and TM reflectivity curves as unpolarised light was used. Fig. 3(b) shows the corresponding 1D reflectivity curve, which is a plot of an average reflectivity along the width of the fluidic channel versus angle of incidence.
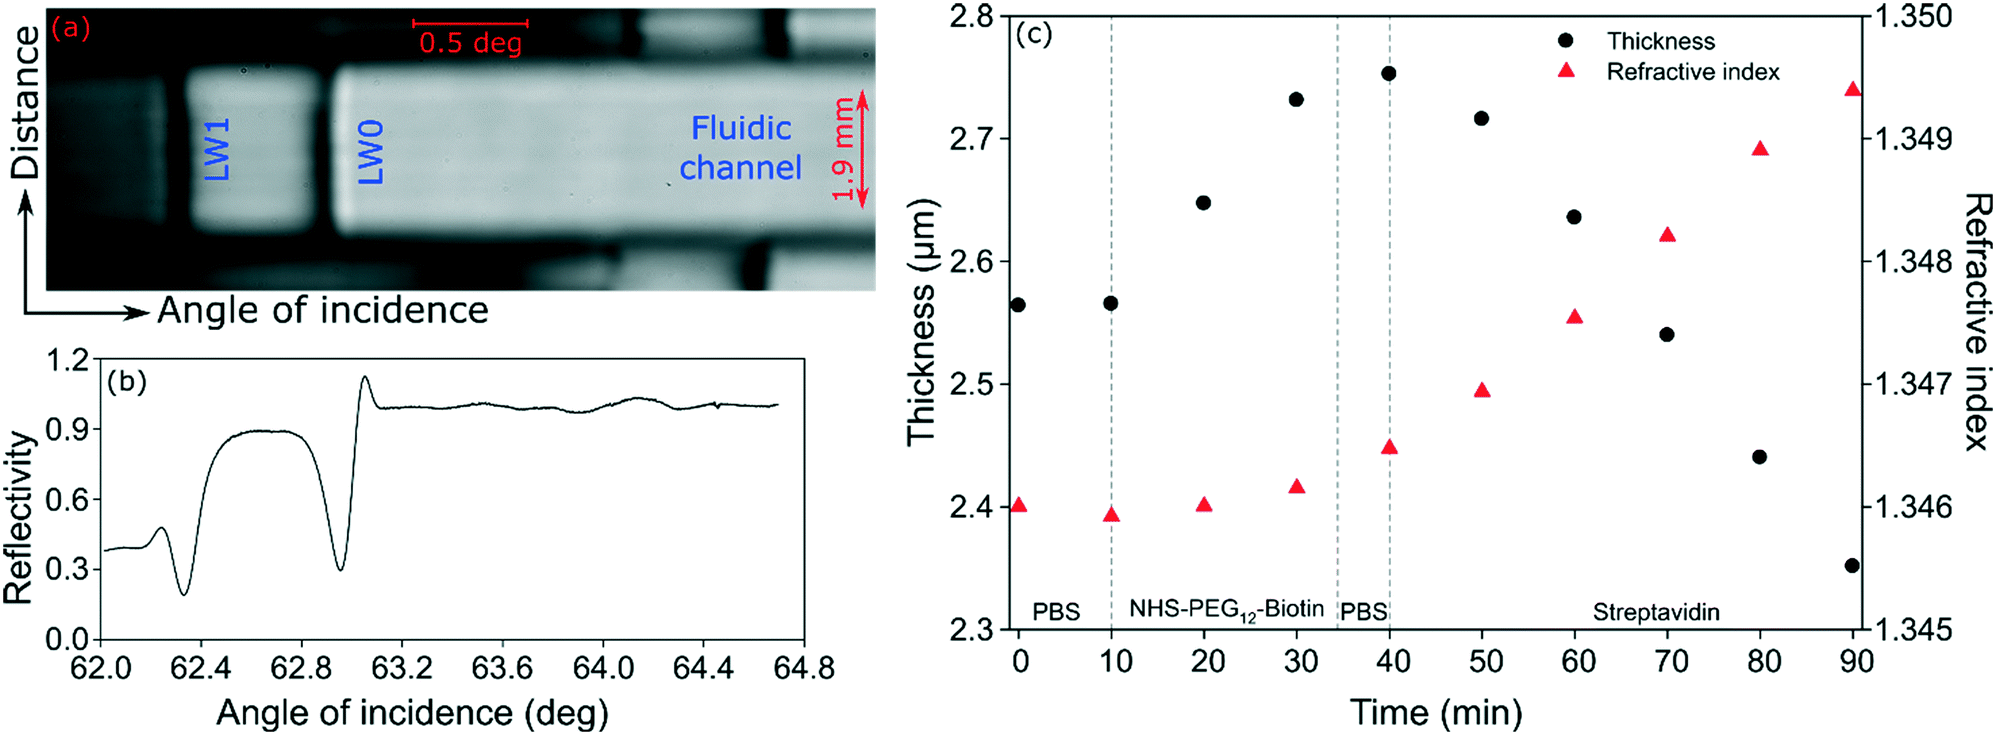 | ||
| Fig. 3 (a) 2D and (b) 1D reflectivity curves of a chitosan LW with PBS, and (c) plot of thickness and RI of the chitosan film versus time as the LW was irrigated with different solutions. | ||
Experimental 1D reflectivity curves were fitted to theory using an in-house written transfer matrix48 programme integrated with Fresnel diffraction49 and simplex optimisation50 to estimate the thickness and RI of chitosan films as the LW was irrigated with different solutions. As shown in Fig. 3(c), during the initial PBS wash, the thickness and real RI of chitosan film was 2.56 μm and 1.34592, respectively. After the LW was irrigated with NHS-(PEG)12-biotin for 30 min and PBS for 10 min, the thickness of the chitosan film was increased to 2.75 μm, but the RI did not change significantly. Finally, the thickness of the chitosan was reduced to 2.35 μm and RI was increased to 1.34939 after streptavidin binding to immobilised NHS-(PEG)12-biotin for 50 min. This decrease in thickness and increase in RI of chitosan is attributed to crosslinking of the film because of the binding of immobilised biotin to multiple sites in each streptavidin.
We then determined the phase of light reflected from LWs comprising of chitosan films with thickness and RI values obtained at 10 and 90 min in Fig. 3(c) because they correspond to chitosan films without and with streptavidin, respectively. As shown in Fig. 4(a), there is an overall 2π radians phase shift in the reflected light as the angle of incidence changed from below to above the resonance angles (marked by green dashed lines in Fig. 4) of LW0 and LW1 modes. Fig. 4(a) shows that resonance angles of LW modes for chitosan films without streptavidin is lower than with streptavidin. The angular separation between resonance angles of chitosan films without and with streptavidin for LW0 mode is higher than LW1 modes.
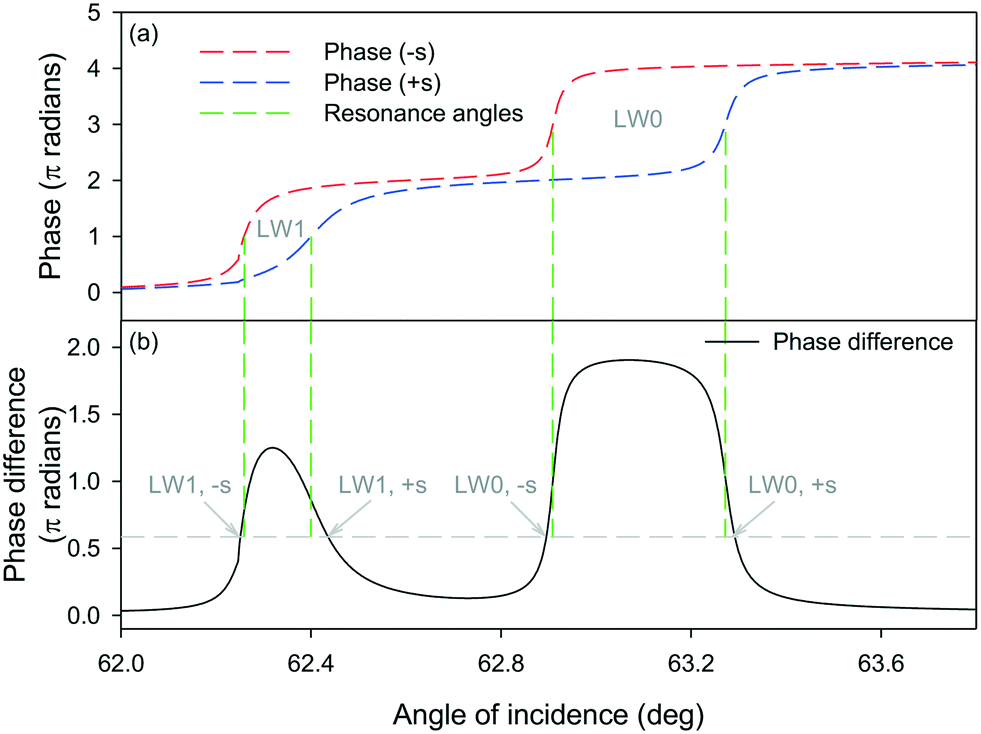 | ||
| Fig. 4 (a) Phase of light reflected from chitosan LW without and with streptavidin, and (b) phase difference between the two light beams versus angle of incidence (LW0 and LW1 corresponds to zero and first order LW modes, and −s and +s corresponds to chitosan without and with streptavidin). The horizontal dashed line is at 0. 586π radians where the first order diffraction efficiency is a maximum. | ||
The phase difference between light reflected from chitosan LW without and with streptavidin was then calculated as a function of angle of incidence (see Fig. 4(b)). The phase difference shown in Fig. 4(b) served as a proxy for Δφ for light reflected from alternating strips of LWGs. Fig. 4(b) shows that at four angles of incidence, Δφ is 0.586π radians, which is the value where the diffraction efficiency of first diffracted order is maximum. Thus, for the LWGs reported in this work, we expect four peaks in the intensity profile of first diffracted orders of LWGs versus angle of incidence. Furthermore, the four angles of incidence at which Δφ is 0.586π radians, are close to the resonance angles of LW0 and LW1 modes of strips without and with streptavidin. Thus, resonance angles of LW0 and LW1 modes of strips without and with streptavidin, can be monitored by tracking the positions of the peaks of the first diffracted order of LWGs.
To obtain plots of intensity profile of zeroth and first diffracted orders of LWGs versus angle of incidence, Δφ values in Fig. 4(b) were inputted into eqn (4). The resulting plots are provided in Fig. 5, and show that for the estimated thickness and RI values of chitosan films without and with streptavidin, the zeroth diffracted order gives rise to a single broad dip for each LW mode whilst the first diffracted order splits into two peaks for each LW mode.
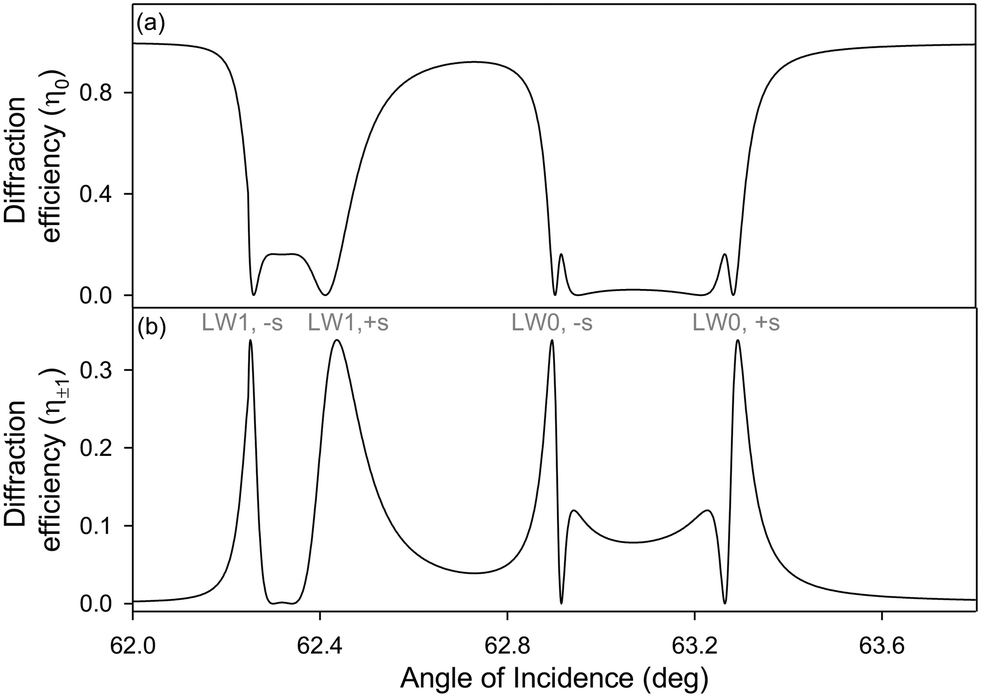 | ||
| Fig. 5 Theoretical diffraction efficiency versus angle of incidence for (a) zeroth and (b) first diffracted orders of LWGs (LW0 and LW1 corresponds to zero and first order LW modes, and −s and +s corresponds to chitosan without and with streptavidin). | ||
Equally, we modelled the effect of difference in RI between alternating strips on intensity profiles of first diffracted orders of LWGs as a function of angle of incidence. As shown in Fig. 6, when the difference in RI between alternating strips was ≤5 × 10⁻⁴, peaks of first diffracted orders corresponding to LW0 of strips without and with streptavidin were well separated. However, peaks of first diffracted orders corresponding to LW1 of strips without and with streptavidin were not resolved. For both LW0 and LW1 modes, as shown in Fig. 6, the separation between peaks corresponding to strips without and with streptavidin increased as the difference in RI between alternating strips was changed from 5 × 10⁻⁴ to 2 × 10⁻³.
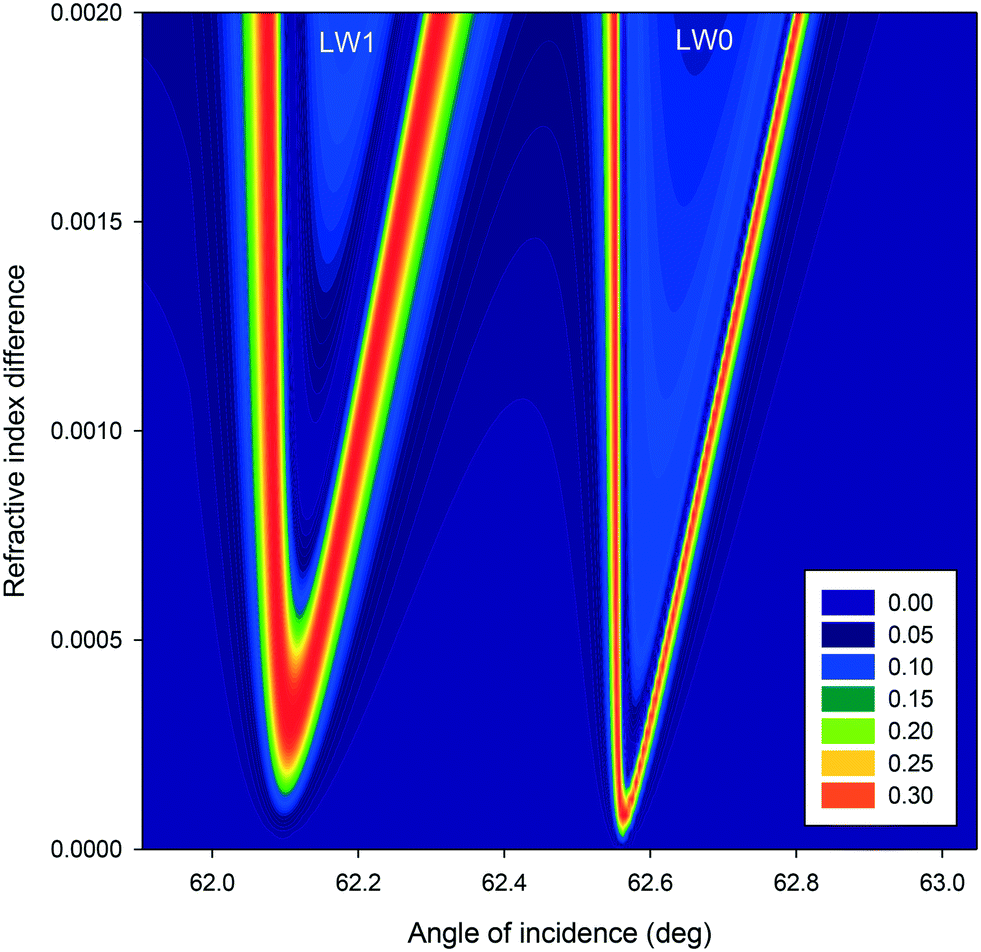 | ||
| Fig. 6 Contour plot of theoretical diffraction efficiency of first diffracted order of LWGs as a function of angle of incidence and the RI difference between alternating strips without and with streptavidin (LW0 and LW1 corresponds to zero and first order LW modes). | ||
Experimental diffraction patterns of LWGs
Initial photopatterning of chitosan films deposited on glass substrates resulted in an array of alternating strips without and with PC-biotin. An exemplar 2D reflectivity profile of such a chitosan film micropatterned with PC-biotin is shown in Fig. 7(a) where the vertical axis is angle of diffraction because a cylindrical lens was placed in front of the camera. No diffraction pattern was observed because the difference in RI between strips without and with PC-biotin was minimal, resulting in insignificant phase difference between light reflected from the two types of strips.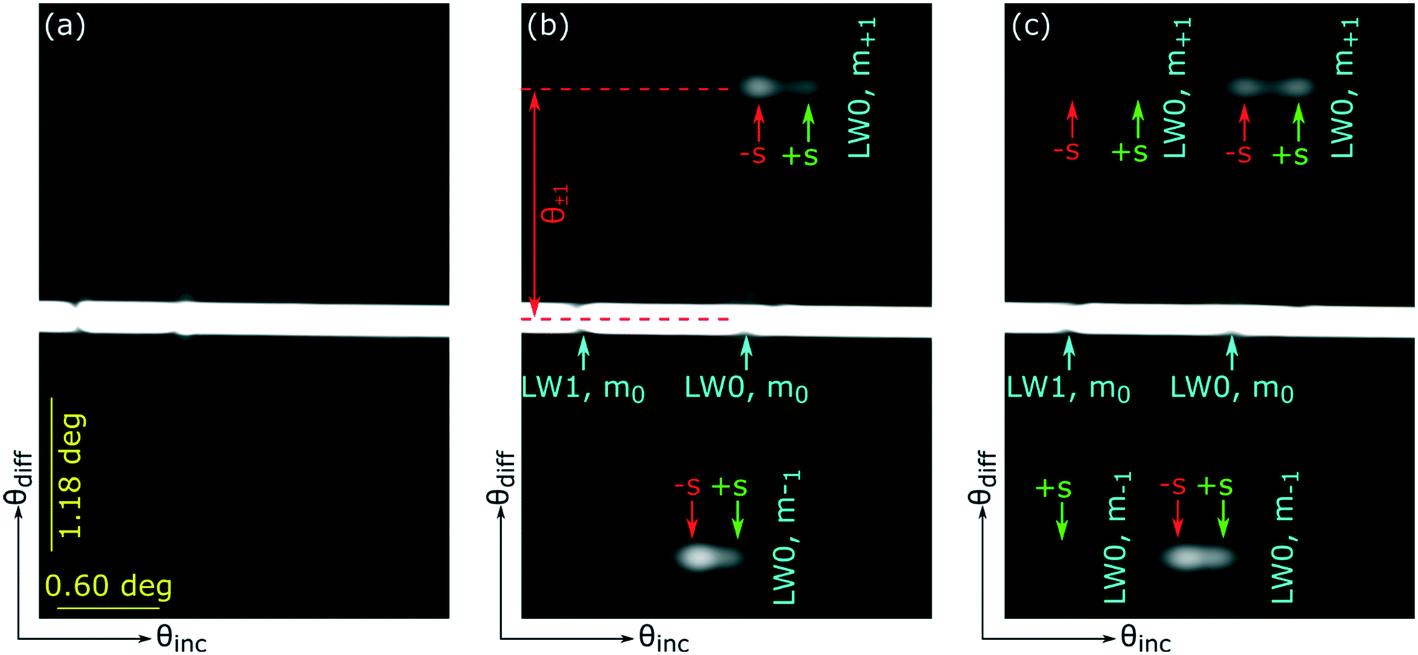 | ||
| Fig. 7 2D reflectivity curves after flowing streptavidin solution on chitosan films with alternative strips of PC-biotin for (a) 0, (b) 85, and (c) 120 min (θinc and θdiff are angles of incidence and diffraction, LW0 and LW1 corresponds to zero and first order LW modes, −s and +s corresponds to chitosan without and with streptavidin, θ±1 is angular separation between zeroth and first diffracted orders, and m+1 and m−1 are plus/minus first diffracted orders). | ||
10 μg ml−1 of streptavidin solution was then flowed on top of the chitosan film with alternating strips of PC-biotin, and 2D reflectivity profiles were observed in real-time. Streptavidin binding to PC-biotin increased the difference in RI between alternating strips. After ∼85 min of streptavidin binding, the difference in RI between alternating strips was sufficient for first diffracted orders corresponding to LW0 mode to become visible as shown in Fig. 7 (b). However, the difference in RI between alternating strips was insufficient for first diffracted orders corresponding to LW1 to become visible. Nevertheless, the angular separation between the zero and first diffracted orders (marked by θ±1 in Fig. 7(b)) corresponding to LW0 mode was ∼1.74 deg, which is in good agreement with the expected value of 1.80 deg (calculated using eqn (3)).
After 120 minutes of streptavidin binding to PC-biotin in alternating strips, first diffracted orders of LWGs corresponding to both LW0 and LW1 modes were visible and were split into two peaks each. The zeroth order only showed single dips, one corresponding to LW0 and the other corresponding to LW1, as expected from the theoretical plot shown in Fig. 5(a). Because of non-uniformities in the film, experimental dips and peaks were considerably broader than predicted from theory (Fig. 7versusFig. 5).
Cross-sectional profiles of zero and first (+1) diffracted orders were then plotted as a function of angles of incidence, and resulting plots are shown in Fig. 8. Fig. 8(b) shows that peak heights of first diffracted orders corresponding to LW1 are lower than LW0. This observation contrasts with theory, which suggests that peaks heights of first diffracted orders of LW0 and LW1 should be the same in the absence of optical losses in chitosan films. Alternatively, theory suggests that the peak height of first diffracted orders of LW0 should be lower than LW1 in the presence of optical losses in chitosan films. This discrepancy between theory and experimental plots (Fig. 5(b)versusFig. 8(b)) may be because our current models assume that each strip of LWGs act as a slab waveguide and there is no crosstalk between neighbouring strips. More accurate models will require finite-difference time domain simulations. Nevertheless, the simplified models developed in this work, are valuable because they provided insights into the operation of LWGs and the effect of different parameters on their 2D diffraction patterns.
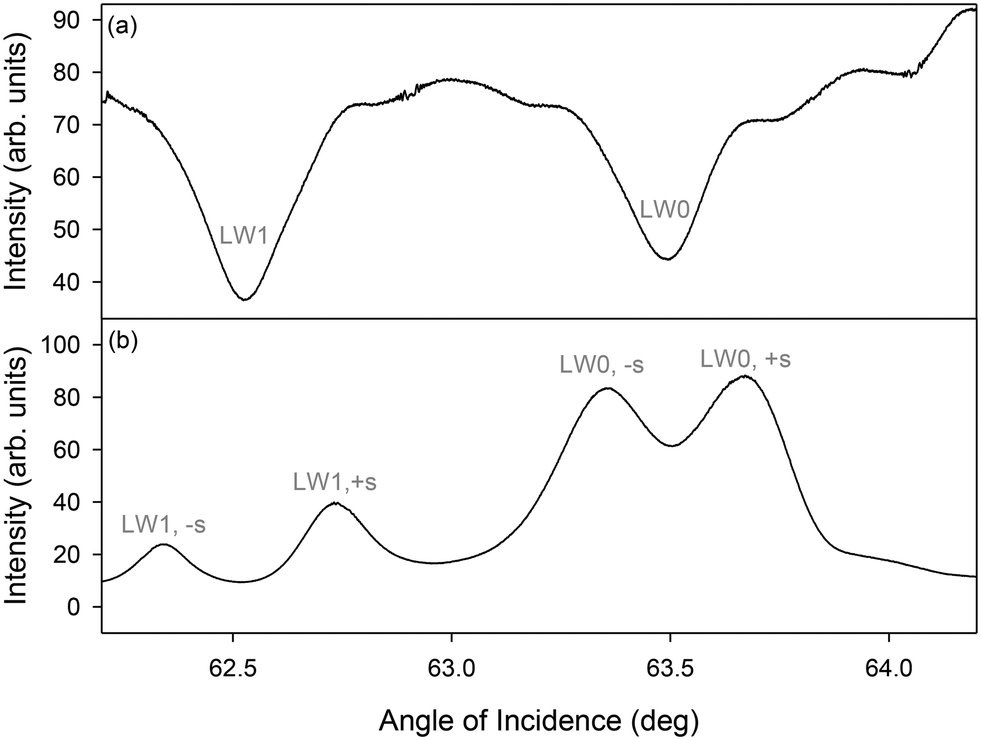 | ||
| Fig. 8 Intensity profiles of (a) zeroth and (b) first diffracted orders versus angle of incidence for LWGs obtained by reacting streptavidin with alternative strips of PC-biotin for 120 min (LW0 and LW1 corresponds to zero and first order LW modes, and −s and +s corresponds to chitosan without and with streptavidin). | ||
Protein sensing
After streptavidin, the LWG was irrigated with 25 nM biotin–protein A, PBS, and 200 nM IgG. Peak positions corresponding to LW0,−s/LW0,+s and LW1,−s/LW1,+s were monitored as different solutions were introduced on LWGs. Fig. 9(a) shows that first order diffraction peaks corresponding to LW0 responded more than LW1 to protein binding. However, as shown in Fig. 9(b), differential shift between first order diffraction peaks corresponding to LW0 was smaller than LW1. This may be because of the difficulty of tracking the less well resolved first order diffraction peaks corresponding to LW0 using the centre of gravity algorithm. Thus, differential shifts between first order diffracted peaks corresponding to LW1 were thought to be ideal for protein sensing.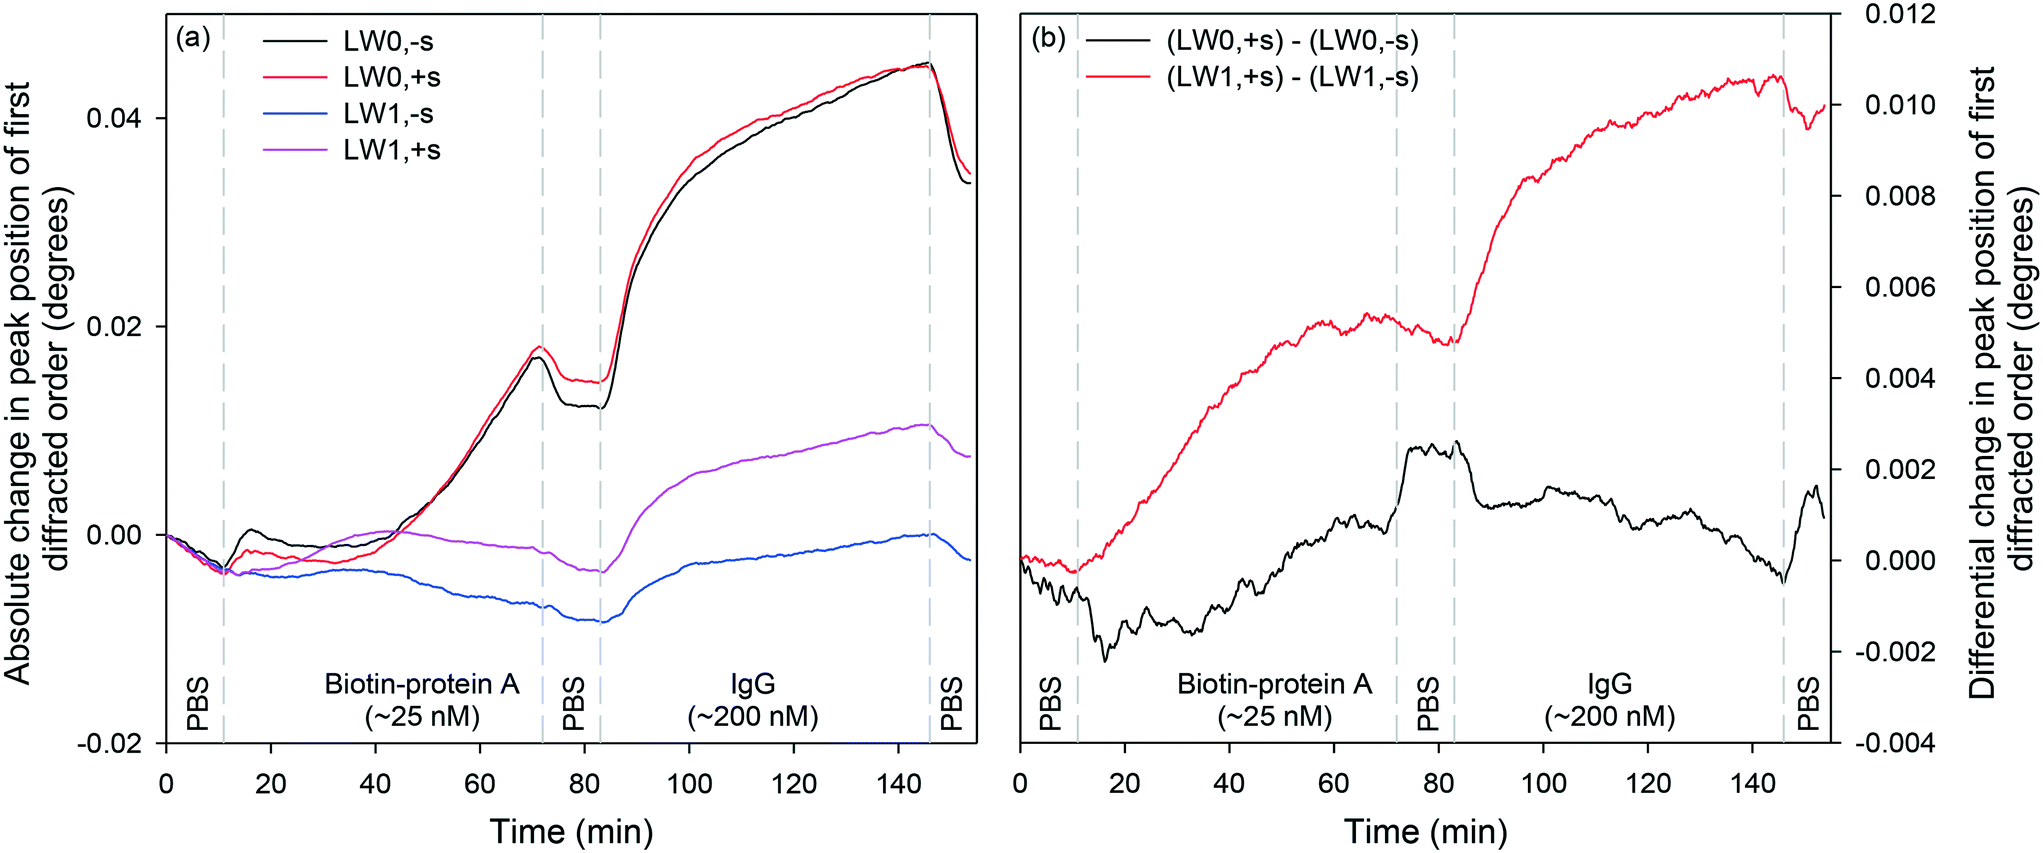 | ||
| Fig. 9 (a) Absolute and (b) differential change in peak positions of first diffracted orders of LWGs for different proteins (LW0 and LW1 corresponds to zero and first order LW modes, and −s and +s corresponds to chitosan without and with streptavidin). | ||
A comparison of Fig. 9(a) and (b) highlights that the differential shifts between first order diffracted peaks of LW1 is slightly lower than absolute shifts in their positions. This implies that differential measurements offer slightly lower sensitivity to protein sensing than absolute measurements. This reduction in sensitivity of differential measurements may be because not all the PC-biotin could be removed after 10 min exposure to the IL set-up.51 This means that the distribution of biotin/streptavidin complex in strips exposed to high and low intensity fringes of the IL set-up was low and high, respectively, but not 0 and 100%. Thus, biotin-protein A and IgG could bind to both types of strips, reducing the differential sensitivity. However, differential shifts between first order diffracted peaks of LW1 largely eliminated downward baseline drift, which is often caused by changes in ambient temperature. Furthermore, differential measurements largely eliminate the effect of changes in sample composition as discussed below. These benefits offered by differential measurements far outweigh their limitation of slightly reduced sensitivity for protein sensing.
Refractive index sensitivity (RIS) and limit of detection (LOD)
LWG was then irrigated with different concentrations of glycerol in PBS to determine absolute RIS and RI LOD. Glycerol is a low molecular mass species that does not interact strongly with chitosan or proteins, so simply acts to change the RI of sample solutions and LWG strips as glycerol diffuses in. As shown in Fig. 10(a), absolute peak positions of first diffracted orders of LW0 and LW1 without and with streptavidin shifted to higher angles as solutions were changed from PBS to 2% (v:v) glycerol. The inset in Fig. 10(a) is a plot of shifts in absolute peak positions of the first diffracted orders at equilibrium versus RI of different concentrations of glycerol solutions. The slopes of each trace in the inset in Fig. 10(a) is the RIS of each mode and the values are summarised in Table 2.
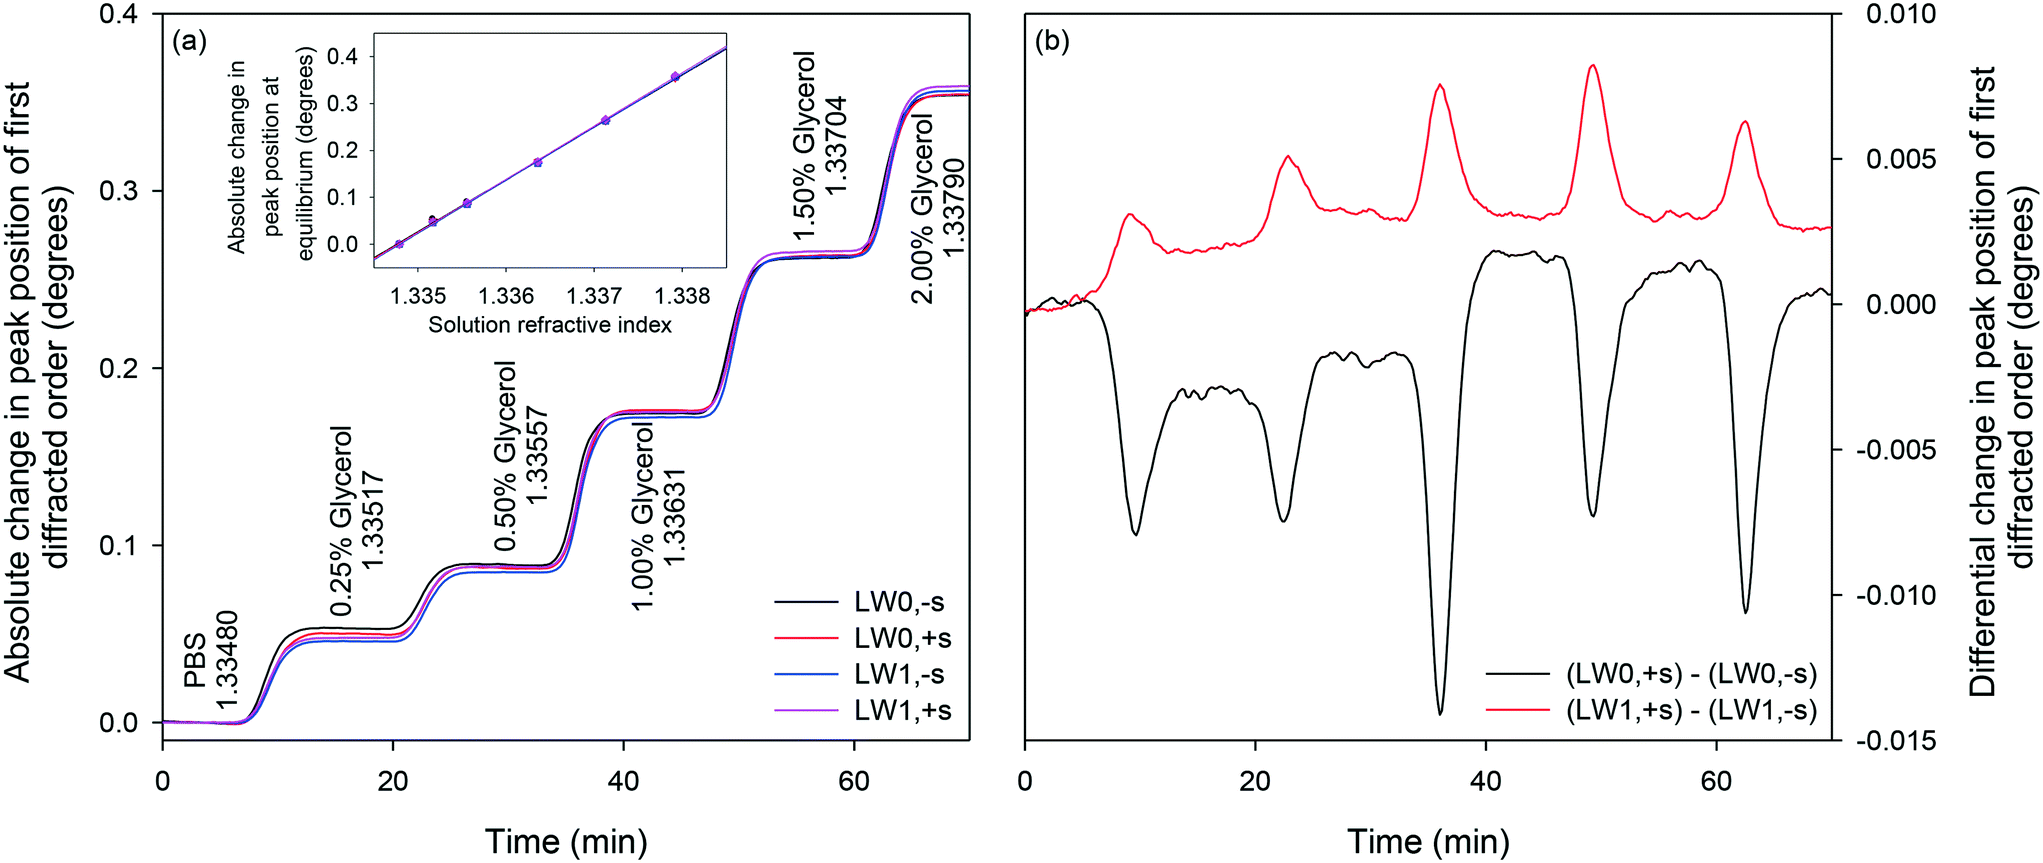 | ||
| Fig. 10 Absolute (a) and differential (b) shifts in peak positions of first diffracted orders of LWGs to glycerol solutions of different concentrations in PBS buffer. | ||
| Type of first diffracted order | RIS (deg RIU−1) at equilibrium |
|---|---|
| LW0, −s | 111.1 ± 1.7 |
| LW0, +s | 112.0 ± 1.2 |
| LW1, −s | 113.1 ± 1.3 |
| LW1, +s | 113.7 ± 1.1 |
To determine the RI LOD, the standard deviation of shifts in first diffracted orders of LW0 and LW1 for PBS was calculated. These standard deviations multiplied by three were divided by RIS of the device to obtain the RI LOD, which was 1.73 × 10⁻⁵ RIU and 4.09 × 10⁻⁶ RIU for LW0 and LW1, respectively. A comparison of RI LOD of LWG and selected label-free optical sensors is provided in Table 3. Based on the RIS, RI LOD, and the observed peak shifts for streptavidin, we estimate that the surface mass sensitivity of the LWG is 1.46 ng mm−2 for LW0 and 0.34 ng mm−2 for LW1. The surface mass sensitivity of LWG is worse than other sensors because the latter rely on interaction of evanescent field with molecules immobilised on surfaces. In contrast, in LWGs, molecules are immobilised and detected throughout a ∼2.6 μm thick hydrogel film.
| Type of label-free optical sensor | RI LOD (or surface mass sensitivity) | |
|---|---|---|
| LWG (this work) | LW0: 1.73 × 10⁻⁵ RIU (or 1.46 ng mm−2) | |
| LW1: 4.09 × 10⁻⁶ RIU (or 0.34 ng mm−2) | ||
| Surface plasmon resonance (SPR)52 | ∼10−6 RIU (∼1 pg mm−2) | |
| Resonant waveguide grating53 | ∼10−6 RIU (∼1 pg mm−2) | |
| Interferometry | Young54 | ∼10−8 RIU (∼10 fg mm−2) |
| Bimodal55 | 10−7 RIU | |
| Grating coupled56 | 0.01 pg mm−2 | |
| Photonic crystals57 | 10−5 RIU | |
| Transmission gratings58 | ~10−6 RIU | |
Internal referencing
Subsequently, the extent to which changes in sample composition can be removed by differential measurements was investigated. Fig. 10(b) shows the differential response of LW modes with and without streptavidin. As the absolute RIS of LW0 and LW0 without and with streptavidin were very similar at equilibrium, differential measurements are suitable for largely eliminating the effect of changes in sample composition. Although absolute shifts in peak positions of first diffracted orders of LWG strips without and with streptavidin were comparable at equilibrium, their transient responses were different as suggested by the presence of dips/peaks in differential responses as solutions were changed. The presence of transient dips in differential LW0 measurements may be because of slower diffusion of glycerol in strips with streptavidin than without streptavidin. This is to be expected because strips with streptavidin are likely to be crosslinked because of the binding of immobilised PC-biotin to multiple sites in each streptavidin. In contrast, slow diffusion of glycerol in strips without streptavidin and our theoretical models have so far not been able to explain the presence of transient peaks in LW1 differential response. Further investigations must be conducted to eliminate transient dips/peaks in differential responses.An overall summary of absolute and differential measurements at equilibrium is provided in Table 4. As indicated in Table 4, as solutions were changed from PBS to 2% (v:v) glycerol, RI was increased by 3.13 × 10⁻³. This is a significant increment in the RI of sample solutions considering that 100 nM of proteins typically result in a RI change59 of 10−6. As a result, absolute measurements are often swamped by changes in sample composition, limiting the utility of current label-free sensors for measuring analytes in real samples. In contrast, as summarised in Table 4, differential measurements between first diffracted orders of LWGs removed between 94.1 and 99.9% of changes in sample composition at equilibrium.
| RI of glycerol solutions | Absolute shifts at equilibrium (mdeg) | Differential shifts at equilibrium (mdeg) | Removal of effects of sample RI (%) | |||||
|---|---|---|---|---|---|---|---|---|
| LW0,+s | LW0,−s | LW1,+s | LW1,−s | (LW0,+s) – (LW0,−s) | (LW1,+s) – (LW1,−s) | LW0 | LW1 | |
| 1.334790 | 0 | 0 | 0 | 0 | 0 | 0 | — | — |
| 1.335170 | 50.0 | 53.1 | 47.8 | 45.8 | −3.1 | 2.0 | 94.1 | 95.8 |
| 1.335560 | 87.2 | 89.0 | 87.9 | 84.8 | −1.9 | 3.1 | 98.9 | 97.9 |
| 1.336360 | 176.2 | 174.5 | 173.3 | 172.2 | 1.7 | 3.0 | 99.0 | 99.0 |
| 1.337130 | 263.4 | 262.1 | 265.8 | 262.7 | 1.3 | 3.0 | 99.5 | 99.5 |
| 1.337920 | 354.4 | 354.0 | 359.0 | 356.3 | 0.4 | 2.6 | 99.9 | 99.9 |
IV. Conclusions
We report leaky waveguide gratings (LWGs), which have been designed to operate in reflective mode to enable their applications for sensing of analytes in optically absorbing and scattering samples. In addition, the developed LWGs were internally referenced, which means baseline drifts and effects of changes in sample composition were largely eliminated, for reliable sensing of analytes. LWGs were called so because each strip, where adjacent strips had different refractive index, supported leaky waveguide (LW) modes.LWGs operate on a different principle to current waveguide grating couplers and surface plasmon resonance gratings. Thus, we developed models to provide insights into the operating principle of LWGs and parameters affecting their diffraction patterns. Our models show that LWGs produce two-dimensional diffraction patterns in the orthogonal spaces of angles of diffraction and incidence. Equally, our models show that peaks in intensity of first diffracted orders versus angles of incidence were observed close to resonance angles of LW modes confined in strips without and with streptavidin. However, not all the behaviour of the LWGs could be explained by current approximate models and hence a full numerical simulation using finite-difference time-domain methods will be required.
In this work, LWGs were fabricated in continuous chitosan hydrogel films by selective removal of a photocleavable biotin linker using laser interference lithography followed by sequential binding of streptavidin, which served as an exemplar recognition element. We demonstrated that differential measurements between first diffracted order peaks of LW1 modes in strips without and with streptavidin allowed sensing of at least 25 nM biotin–protein A followed by at least 200 nM IgG. Finally, we demonstrated that differential measurements eliminated the effect of change in sample composition introduced by adding different glycerol volumes in buffer by between 94.1 and 99.9%. The ability to reject sample composition changes means that herein reported LWGs have a high potential for analyte sensing in real samples of variable composition.
Author contributions
Both authors contributed equally to the work.Conflicts of interest
Authors declare no conflict of interest.Acknowledgements
RG acknowledges the funding support from the Engineering and Physical Sciences Research Council (EPSRC, Grant EP/N02074X/2).References
- W. Bai and D. A. Spivak, A Double-Imprinted Diffraction-Grating Sensor Based on a Virus-Responsive Super-Aptamer Hydrogel Derived from an Impure Extract, Angew. Chem., Int. Ed., 2014, 53, 2095 CrossRef CAS PubMed.
- Y. Gang, C. Yang and X. Wang, Sensing Diffraction Gratings of Antigen-Responsive Hydrogel for Human Immunoglobulin-G Detection, Macromol. Rapid Commun., 2010, 31, 1332 CrossRef PubMed.
- X. Wang and X. Wang, Aptamer-Functionalized Hydrogel Diffraction Gratings for the Human Thrombin Detection, Chem. Commun., 2013, 49, 5957 RSC.
- J.-J. Zhao, W. J. Wang, F. Wang, Y. Zhao, Q.-W. Cai, R. Xie, X.-J. Ju, Z. Liu, Y. Faraj and L.-Y. Chu, Smart Hydrogel Grating Immunosensors for Highly Selective and Sensitive Detection of Human-IgG, Ind. Eng. Chem. Res., 2020, 59, 10469 CrossRef CAS.
- M. I. Lucío, A. H. Montoto, E. Fernández, S. Alamri, T. Kunze, M. J. Bañuls and A. Maquieira, Label-free Detection of C-Reactive Protein using Bioresponsive Hydrogel-based Surface Relief Diffraction Gratings, Biosens. Bioelectron., 2021, 193, 113561 CrossRef PubMed.
- G. Ye and X. Wang, Glucose Sensing through Diffraction Grating of Hydrogel Bearing Phenylboronic Acid Groups, Biosens. Bioelectron., 2010, 26, 772 CrossRef CAS PubMed.
- A. K. Pal, E. Labella, N. J. Goddard and R. Gupta, Photofunctionalizable Hydrogel for Fabricating Volume Optical Diffractive Sensors, Macromol. Chem. Phys., 2019, 220, 1900228 CrossRef.
- R. Gupta, S. El Sayed and N. J. Goddard, Hydrogel Gratings with Patterned Analyte Responsive Dyes for Spectroscopic Sensing, RSC Adv., 2021, 11, 40197 RSC.
- X. Wang, G. Ye and X. Wang, Hydrogel Diffraction Gratings Functionalized with Crown Ether for Heavy Metal Ion Detection, Sens. Actuators, B, 2014, 193, 413 CrossRef CAS.
- H.-Y. Peng, W. J. Wang, F.-H. Gao, S. Lin, L.-Y. Liu, X.-Q. Pu, Z. Liu, X.-J. Ju, R. Xie and L.-Y. Chu, Ultrasensitive Diffraction Gratings Based on Smart Hydrogels for Highly Selective and Rapid Detection of Trace Heavy Metal Ions, J. Mater. Chem. C, 2018, 6, 11356 RSC.
- H.-Y. Peng, W. J. Wang, F.-H. Gao, S. Lin, X.-J. Ju, R. Xie, Z. Liu, Y. Faraj and L.-Y. Chu, Smart Hydrogel Gratings for Sensitive, Facile, and Rapid Detection of Ethanol Concentration, Ind. Eng. Chem. Res., 2019, 58, 17833 CrossRef CAS.
- X. Li, B. Tang, B. Wu, C. Hsu and X. Wang, Highly Sensitive Diffraction Grating of Hydrogels as Sensors for Carbon Dioxide Detection, Ind. Eng. Chem. Res., 2021, 60, 4639 CrossRef CAS.
- R. Gupta and N. J. Goddard, Leaky Waveguides (LWs) for Chemical and Biological Sensing − A Review and Future Perspective, Sens. Actuators, B, 2020, 322, 128628 CrossRef CAS.
- N. Khansili, G. Rattu and P. M. Krishna, Label-free Optical Biosensors for Food and Biological Sensor Applications, Sens. Actuators, B, 2018, 265, 35 CrossRef CAS.
- R. Gupta and N. J. Goddard, A Polymeric Waveguide Resonant Mirror (RM) Device for Detection in Microfluidic Flow Cells, Analyst, 2013, 138, 3209 RSC.
- K. G. de CastroMonsores, A. O. daSilva, S. de Sant’ Ana, O. Gabriel, P. Rodrigues and R. P. Weber, Influence of Ultraviolet Radiation on Polymethylmethacrylate (PMMA), J. Mater. Res. Technol., 2019, 8, 3713 CrossRef.
- L. T. Neustock, S. Jahns, J. Adam and M. Gerken, Optical Waveguides with Compound Multiperiodic Grating Nanostructures for Refractive Index Sensing, J. Sens., 2016, 2016, 6174527 Search PubMed.
- K. Tiefenthaler and W. Lukosz, Sensitivity of Grating Couplers as Integrated-Optical Chemical Sensors, J. Opt. Soc. Am. B, 1989, 6, 209 CrossRef CAS.
- F. F. Bier and R. D. Schmid, Real Time Analysis of Competitive Binding Using Grating Coupler Immunosensors for Pesticide Detection, Biosens. Bioelectron., 1994, 9, 125 CrossRef CAS.
- J. Voros, J. J. Ramsden, G. Csucs, I. Szendro, S. M. De Paul, M. Textor and N. D. Spencer, Optical Grating Coupler Biosensors, Biomaterials, 2002, 23, 3699 CrossRef CAS PubMed.
- D. Rosenblatt, A. Sharon and A. A. Friesem, Resonant Grating Waveguide Structures, IEEE J. Quantum Electron., 1997, 33, 2038 CrossRef CAS.
- G. Quaranta, G. Basset, O. J. F. Martin and B. Gallinet, Recent Advances in Resonant Waveguide Gratings, Laser Photonics Rev., 2018, 12, 1800017 CrossRef.
- Y. Fang, A. M. Ferrie, N. H. Fontaine, J. Mauro and J. Balakrishnan, Resonant Waveguide Grating Biosensor for Living Cell Sensing, Biophys. J., 2006, 91, 1925 CrossRef CAS PubMed.
- F. Yu and W. Knoll, Immunosensor with Self-Referencing Based on Surface Plasmon Diffraction, Anal. Chem., 2004, 76, 1971 CrossRef CAS PubMed.
- P. Adam, J. Dostálek and J. Homola, Multiple Surface Plasmon Spectroscopy for Study of Biomolecular Systems, Sens. Actuators, B, 2006, 113, 774 CrossRef CAS.
- M. Abutoama and I. Abdulhalim, Self-referenced Biosensor Based on Thin Dielectric Grating Combined with Thin Metal Film, Opt. Express, 2015, 23, 28667 CrossRef CAS PubMed.
- F. Bahrami, J. S. Aitchison and M. Mojahedi, Dual-Wavelength Spectroscopy of a Metallic-Grating-Coupled Surface Plasmon Resonance Biosensor, IEEE Photonics J., 2015, 7, 4800507 Search PubMed.
- M. Abutoama and I. Abdulhalim, Angular and Intensity Modes Self-Referenced Refractive Index Sensor Based on Thin Dielectric Grating Combined With Thin Metal Film, IEEE J. Sel. Top. Quantum Electron., 2017, 23, 4600309 Search PubMed.
- C. Fattinger, Focal Molography: Coherent Microscopic Detection of Biomolecular Interaction, Phys. Rev. X, 2014, 4, 031024 CAS.
- V. Gatterdam, A. Frutiger, K.-P. Stengele, D. Heindl, T. Lübbers, J. Vörös and C. Fattinger, Focal Molography is a New Method for the In Situ Analysis of Molecular Interactions in Biological Samples, Nat. Nanotechnol., 2017, 12, 1089 CrossRef CAS PubMed.
- V. Pandey and S. Pal, Investigating the Performance of Metal-Assisted Guided Mode Resonance Based Structures for Biosensing Applications, IEEE Sens. J., 2019, 19, 4412 CAS.
- N. J. Goddard, J. Hulme, C. Malins, K. Singh and P. R. Fielden, Asymmetric Anti-Resonant Reflecting Optical Waveguides (ARROW) as Chemical Sensors, Analyst, 2002, 127, 378 RSC.
- A. K. Pal, N. J. Goddard, H. J. Dixon and R. Gupta, A Self-Referenced Diffraction-Based Optical Leaky Waveguide Biosensor Using Photofunctionalised Hydrogels, Biosensors, 2020, 10, 134 CrossRef CAS PubMed.
- R. Gupta and N. J. A Goddard, Novel Leaky Waveguide Grating (LWG) Device for Evanescent Wave Broadband Absorption Spectroscopy in Microfluidic Flow Cells, Analyst, 2013, 138, 1803 RSC.
- N. J. Goddard and R. Gupta, 3-D Printed Analytical Platform for Automation of Fluid Manipulation Applied to Leaky Waveguide Biosensors, IEEE Trans. Instrum. Meas., 2021, 70, 7502612 Search PubMed.
- R. Gupta and N. J. Goddard, A Study of Diffraction-Based Chitosan Leaky Waveguide (LW) Biosensors, Analyst, 2021, 146, 4964 RSC.
- R. Signini and S. P. Campana, On the Preparation and Characterization of Chitosan Hydrochloride, Polym. Bull., 1999, 42, 159 CrossRef CAS.
- N. J. Goddard, H. J. Dixon, N. Toole and R. Gupta, 3-D Printed Instrumentation for Point-of-Use Leaky Waveguide Biochemical Sensor, IEEE Trans. Instrum. Meas., 2020, 69, 6390 CAS.
- A. Isidro-Llobet, M. Álvarez and F. Albericio, Amino Acid-Protecting Groups, Chem. Rev., 2009, 109, 2455 CrossRef CAS PubMed.
- D. J. Kang, J.-K. Kim and B.-S. Bae, Simple Fabrication of Diffraction Gratings by Two-Beam Interference Method in Highly Photosensitive Hybrid Sol-Gel Films, Opt. Express, 2004, 12, 3947 CrossRef CAS PubMed.
- H. C. Guo, D. Nau, A. Radke, X. P. Zhang, J. Stodolka, X. L. TYnag, S. G. Tikhodeev, N. A. Gippius and H. Giessen, Large-area Metallic Photonic Crystal Fabrication with Interference Lithography and Dry Etching, Appl. Phys. B: Lasers Opt., 2005, 81, 271 CrossRef CAS.
- G. M. Burrow and T. K. Gaylord, Multi-Beam Interference Advances and Applications: Nano-Electronics, Photonic Crystals, Metamaterials, Subwavelength Structures, Optical Trapping, and Biomedical Structures, Micromachines, 2011, 2, 221 CrossRef.
- R. Gupta, E. Labella and N. J. Goddard, An Optofluidic Young Interferometer Sensor for Real-Time Imaging of Refractive Index in μTAS Applications, Sens. Actuators, B, 2019, 321, 128491 CrossRef.
- J. Cohen, D. Lee, V. Chauhan, P. Vaughan and R. Trebino, Highly Simplified Device for Measuring the Intensity and Phase of Picosecond Pulses, Opt. Express, 2010, 18, 17484 CrossRef PubMed.
- G. Fortin, Graphical Representation of the Diffraction Grating Equation, Am. J. Phys, 2008, 76, 43 CrossRef.
- S. Li, R. A. Lessard and P. Galarneau, Diffraction Efficiency of a Thin Amplitude-phase Holographic Grating: A Convolution Approach, J. Mod. Opt., 1990, 37, 1319 CrossRef.
- H. Kogelnik, Coupled Wave Theory for Thick Hologram Gratings, Bell Syst. Tech. J., 1969, 48, 2909 CrossRef.
- J. Chilwell and I. Hodgkinson, Thin-Films Field-Transfer Matrix Theory of Planar Multilayer Waveguides and Reflection from Prism-loaded Waveguides, J. Opt. Soc. Am. A, 1984, 1, 742 CrossRef.
- N. J. Goddard and R. Gupta, A Novel Manifestation at Optical Leaky Waveguide Modes for Sensing Applications, Sens. Actuators, B, 2020, 309, 127776 CrossRef CAS.
- M. A. Bezerra, Q. O. dos Santos, A. G. Santos, C. G. Novaes, S. L. C. Ferreira and V. S. de Souza, Simplex Optimization: A Tutorial Approach and Recent Applications in Analytical Chemistry, Microchem. J., 2016, 124, 45 CrossRef CAS.
- R. Gupta, S. ElSayed and N. J. Goddard, Hydrogel Gratings with Patterned Analyte Responsive Dyes for Spectroscopic Sensing, RSC Adv., 2021, 11, 40197 RSC.
- J. Homola, Surface Plasmon Resonance Sensors for Detection of Chemical and Biological Species, Chem. Rev., 2008, 108, 462 CrossRef CAS PubMed.
- N. Orgovan, B. Kovacs, E. Farkas, B. Szabo, N. Zaytseva, Y. Fang and R. Horvath, Bulk and Surface Sensitivity of a Resonant Waveguide Grating Imager, Appl. Phys. Lett., 2014, 104, 083506 CrossRef.
- K. Schmitt, B. Schirmer, C. Hoffmann, A. Brandenburg and P. Meyrueis, Interferometric Biosensor Based on Planar Optical Waveguide Sensor Chips for Label-Free Detection of Surface Bound Bioreactions, Biosens. Bioelectron., 2007, 22, 2591 CrossRef CAS PubMed.
- A. F. Gavela, D. G. García, J. C. Ramirez and L. M. Lechuga, Last Advances in Silicon-Based Optical Biosensors, Sensors, 2016, 16, 285 CrossRef PubMed.
- H. Jankovics, B. Kovacs, A. Saftics, T. Gerecsei, É. Tóth, I. Szekacs, F. Vonderviszt and R. Horvath, Grating-Coupled Interferometry Reveals Binding Kinetics and Affinities of Ni Ions to Genetically Engineered Protein Layers, Sci. Rep., 2020, 10, 22253 CrossRef CAS PubMed.
- Y.-N. Zhang, Y. Zhao and R.-Q. Lv, A Review for Optical Sensors Based on Photonic Crystal Cavities, Sens. Actuators, A, 2015, 233, 374 CrossRef CAS.
- N. Kumawat, P. Pal and M. Varma, Diffractive Optical Analysis for Refractive Index Sensing using Transparent Phase Gratings, Sci. Rep., 2015, 5, 16687 CrossRef CAS PubMed.
- C.-Y. Tan and Y.-X. Huang, Dependence of Refractive Index on Concentration and Temperature in Electrolyte Solution, Polar Solution, Nonpolar Solution, and Protein Solution, J. Chem. Eng. Data, 2015, 60, 2827 CrossRef CAS.
| This journal is © The Royal Society of Chemistry 2022 |