
 Open Access Article
 This Open Access Article is licensed under a Creative Commons Attribution-Non Commercial 3.0 Unported Licence
Ligand-binding assay based on microfluidic chemotaxis of porphyrin receptors†
Bin
Li‡
a,
Kejiao
Gao‡
a,
Yurong
Li
a,
Yuansheng
Li
a,
Longyi
Zhu
 *b,
Xuanyu
Fu
a,
Xiyong
Zhuo
a,
Ying
Wu
a,
Ying
Wan
*c and
Shengyuan
Deng
*a
*b,
Xuanyu
Fu
a,
Xiyong
Zhuo
a,
Ying
Wu
a,
Ying
Wan
*c and
Shengyuan
Deng
*a
aSchool of Environmental and Biological Engineering, Nanjing University of Science and Technology, Nanjing 210094, P. R. China. E-mail: sydeng@njust.edu.cn
bSchool of Chemistry and Chemical Engineering, Nanjing University of Science and Technology, Nanjing 210094, P. R. China. E-mail: lyzhu@njust.edu.cn
cIntelligent Microsystem Technology and Engineering Center, School of Mechanical Engineering, Nanjing University of Science and Technology, Nanjing 210094, P. R. China. E-mail: wanying@njust.edu.cn
First published on 9th November 2022
Abstract
Recent studies have shown that enzymes undergo chemotaxis up substrate gradients during catalysis. One important avenue to identify the molecular level origins of this phenomenon is the ligand–protein binding that occurs even in the absence of catalytic turnover. Here, the chemotaxis of zinc porphyrin as a cofactor mimic was observed by imposing a concentration gradient of organic amines in the microfluidic device. Their axial ligations led to the directed motions of porphyrin receptors. The dissociation constant for selected recognition could be obtained by measuring the chemotactic shift as a function of ligand content, which is associated with both the binding strength and the steric hindrance of the specific ligand. Finally, a statistical thermodynamic model was derived, relating the change of Gibbs free energy (ΔG) in the binding process to the directional migration of receptors. The theoretical model agreed quantitatively with experimental results, elucidating that ΔG of reversible binding essentially drives molecular chemotaxis.
Introduction
Chemotaxis originally referred to the automatic shift of a motile organism towards or away from higher contents of specific stimuli.1,2 Despite the signaling complexity in such a natural stress reaction,3 it is basically triggered by affinity events on the cytomembrane,4 thereby inspiring a rudimentary question of whether mere nonliving biomolecules like receptors could also behave in a chemotactic way. In response to this curiosity, recent studies have discovered the biased migration of urease, catalase, etc. up their respective substrate gradient during catalytic turnover,5–7 as do a multiplexed ensemble of enzyme-cascading metabolons plus the cell-mimicking vesicles.8,9 However, the detailed mechanism of these phenomena remains an open question.10 Besides, although the analytical expression of colloidal diffusiophoresis was adapted for balance with the enhanced diffusion term of enzymatic chemotaxis,11,12 at present there is still no existing model that reaches quantitative agreement with real sets of experimental results.13 Together, both issues are not only of fundamental significance, but to unravel the underlying principle would have profound implications for a broad scope of applications. This includes assisting in the navigation across the blood–brain barrier for targeted drug delivery,14 improving directed draining of DNA strands down through nanopores,15 preconcentrating hydrophobic dialysates in Ficoll solutions,16 separating antibodies of high activity from those that are isostructural yet denatured,17 self-assembling reticular nanomaterials in a lab-on-a-chip,18 and even purifying water.19 All these processes are currently subject to the limitations of passive diffusion-driven kinetics, which could further be boosted by directional impetus.Reviewing the classic Michaelis–Menten theory,20 identification of the molecular level origins of enzyme chemotaxis will require untangling and understanding the contributions of several putative pathways.21 One important avenue to consider is the ligand-receptor coupling that occurs even in the absence of biocatalytic turnover.22,23 To help explore the role that pure recognition can play in the chemotaxis of small species, we devised a fluorescent porphyrin system, zinc(II) meso-tetrakis{4-[3,4,5-tris((S-3,7-dimethyl-octyl)oxy) aniline]acylphenyl}porphine (ZnTCPP-TOA), which serves as a simplistic binding model without involving catalysis (Fig. 1 upper left).24 Specifically, its interactions with organic amines take place based on the axial ligation of multichelate Zn2+ with the lone-pair electrons of nitrogen atoms on either a heterocyclic or an alkyl chained moiety.25 The resulting complex is typically 1![[thin space (1/6-em)]](https://www.rsc.org/images/entities/char_2009.gif) :1 in stoichiometry,24 rendering a five-coordinated motif (Fig. 1) with high reversibility due to the innate labile ligand exchange dynamics of d10 Zn2+ complexes.23,24 A remarkable advantage of choosing this probe for the ligand-receptor interplay is that ZnTCPP-TOA emits photo-luminescence (PL),25 which allows its concentration profile to be in situ imaged via epifluorescence microscopy in microfluidic channels. The observed distribution change as a function of the ligand amount enables the extraction of equilibrium dissociation constants (KD) from binding assays. Moreover, monitoring the extent of lateral translation offers a new approach to evaluate the nucleophilic strength of homologues along with the aggregate state of ZnTCPP-TOA. By using a thermodynamic binding model, a microscopic derivation of the chemotactic force was developed, revealing a “cross-diffusional” coefficient that was regulated by KD. The modelling and simulation results were in quantitative consistence with experimental measurements.
:1 in stoichiometry,24 rendering a five-coordinated motif (Fig. 1) with high reversibility due to the innate labile ligand exchange dynamics of d10 Zn2+ complexes.23,24 A remarkable advantage of choosing this probe for the ligand-receptor interplay is that ZnTCPP-TOA emits photo-luminescence (PL),25 which allows its concentration profile to be in situ imaged via epifluorescence microscopy in microfluidic channels. The observed distribution change as a function of the ligand amount enables the extraction of equilibrium dissociation constants (KD) from binding assays. Moreover, monitoring the extent of lateral translation offers a new approach to evaluate the nucleophilic strength of homologues along with the aggregate state of ZnTCPP-TOA. By using a thermodynamic binding model, a microscopic derivation of the chemotactic force was developed, revealing a “cross-diffusional” coefficient that was regulated by KD. The modelling and simulation results were in quantitative consistence with experimental measurements.
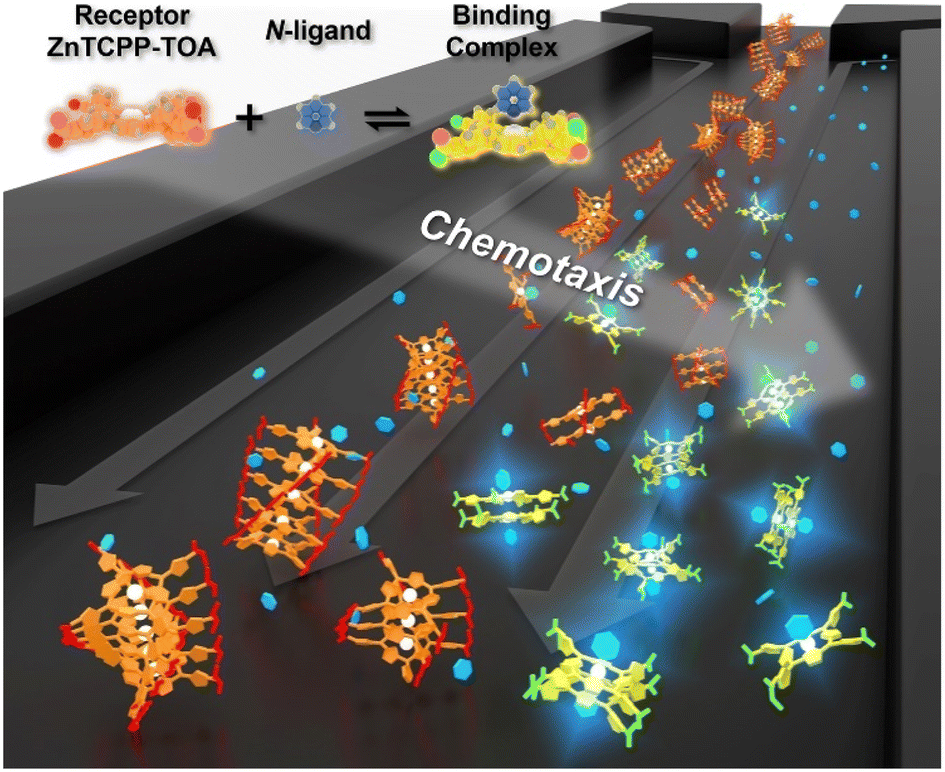 | ||
| Fig. 1 Schematic illustration showing the chemotaxis of a receptor molecule, ZnTCPP-TOA, towards the ligand pyridine in a microfluidic channel. As the cross-channel vague arrow indicates, both receptor and ligand migrate up the gradient of the other, whose direction is perpendicular to the flow. The upper left schematic depicts the 3D-rendered chemical models in the axial-ligated binding. | ||
Results and discussion
Ligand binding induced chemotaxis of ZnTCPP-TOA
Experiments were conducted inside a trident-shaped micro-channel with three inlet ports meeting at a junction to form a single main conduit. This platform was tailor-made using hard lithography (details on the device and platform fabrication are provided in the (ESI) as Fig. S1†). In a first set of experiments, methylcyclohexane (MCH) containing 100 μM ZnTCPP-TOA (synthesis and structural validation are shown in Fig. S2 and S3†) was introduced into the middle inlet at an optimal flow speed of 50 μL h−1 (Fig. S4†), while blank solvent was input through the two side lanes at the same rate (Fig. S1B†). The lateral diffusion profile of the fluorescent porphyrin macromolecule was detected at the confluence (upper ROI, Fig. 2C) and again 18.5 mm downstream near the outlet (lower ROI, Fig. 2D). It took 11.2 s for the solution to cover this distance. The dashed vertical lines in Fig. 2C and D highlight the maximum ZnTCPP-TOA concentration that is in the middle of the symmetric PL profiles. As can be seen, these distributions become widened and more Gauss-function like as ZnTCPP-TOA flowed downstream, yet symmetry remains. As such, there was no obvious shift in the position of the dashed line.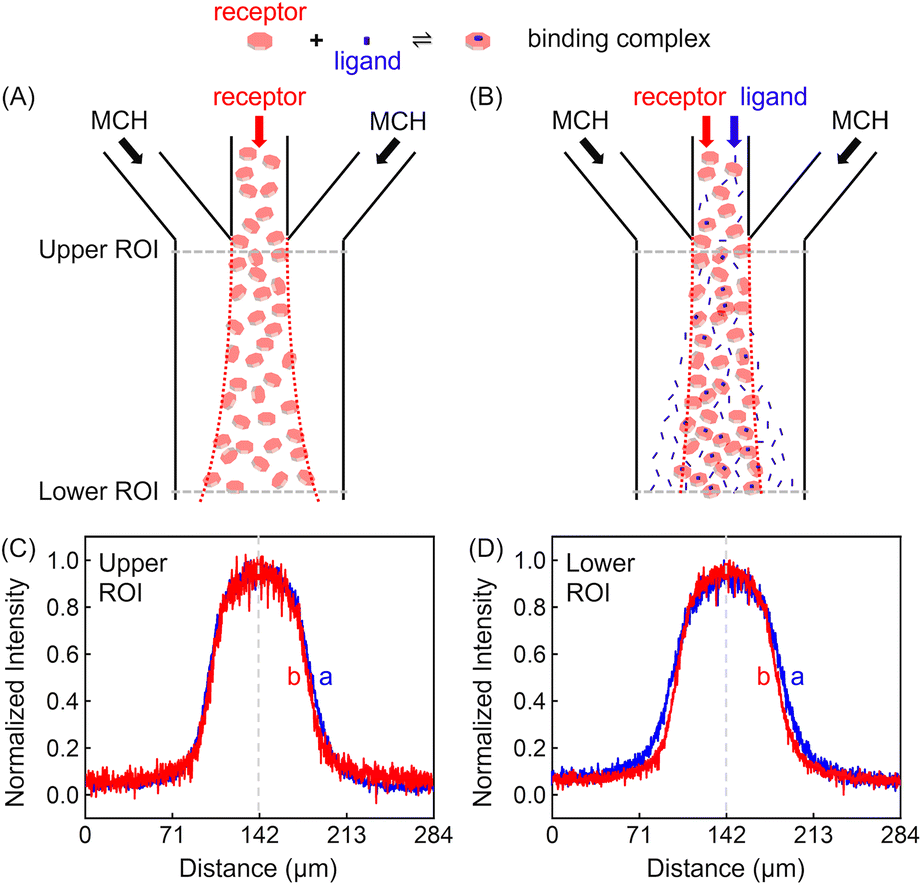 | ||
| Fig. 2 (Upper panel) Illustrated channel inflows and diffusion status of (A) the basic set or the blank control of MCH/receptor/MCH, and (B) the focusing regime of MCH/receptor + ligand/MCH. (Lower panel) The red dotted lines denote the sampled Regions of Interest (ROIs) near the entry (Upper) and the exit (Lower) ports, respectively. Plots of the mean normalized intensity profiles as a function of the lateral position across the channel width when viewed at (C) the upper and (D) the lower ROIs of (B), which was 18.5 mm downstream. The dashed vertical lines denote the middle of the symmetric concentration distributions. The red and blue fluorescence profiles represent conditions where 100 mM pyridine was present and absent, respectively. | ||
Two different sets of data are shown in Fig. 2C and D. The blue profiles correspond to conditions without pyridine, while the red ones represent those where 100 mM pyridine was also syringed into the middle inlet. The initial full width at half maximum (FWHM) value was 69 μm in the upper ROI whether pyridine was present or not. This value increased to 99 μm in the lower ROI in the absence of the ligand, simply due to Fickian diffusion. Notably, however, the FWHM in the lower ROI was only 84 μm when 100 mM pyridine was added in the central inlet. This means a 15 μm contraction. Indeed, the presence of the ligand helped to counteract the outward diffusion of ZnTCPP-TOA under these conditions. In this way, the porphyrin molecules appeared to chemotax up the ligand gradient that formed as the two species travelled downstream.
Next, 100 μM ZnTCPP-TOA was injected into the centre channel, while 100 mM pyridine was flowed through both the left and the right channels. The red curve in Fig. S5B† depicts the concentration profile of ZnTCPP-TOA in the lower ROI in the presence of pyridine. A control without pyridine from the same area is displayed in blue. Again, the presence of pyridine was found to affect the FWHM of the line profile. In this case, putting pyridine in the outer channels caused the FWHM value to expand from 90 to 98 μm. By contrast, when the ligand was simultaneously deployed via all three channels, no change was observed among the FWHMs (Fig. S5A†).
In addition to the focusing and defocusing/spreading regimes (Fig. S6†), the ZnTCPP-TOA profile could also migrate collectively to the left or right. To do this, 100 μM ZnTCPP-TOA was added in the central channel, meanwhile 100 mM pyridine was passed through either the left (Fig. 3A) or right (Fig. 3B) lane. Noticeably, the peak in the concentration profile moved by around 16 μm to the left side when this was done at the lower ROI, as indicated by the offset of the profile from the dashed perpendicular line in the presence of pyridine. These results offer extra evidence that ZnTCPP-TOA chemotaxes up a gradient of the pyridine ligand. It should be noted that all profiles at the upper ROI were identical to the one showcased in Fig. 2D in the focusing experiment (Fig. S5C†).
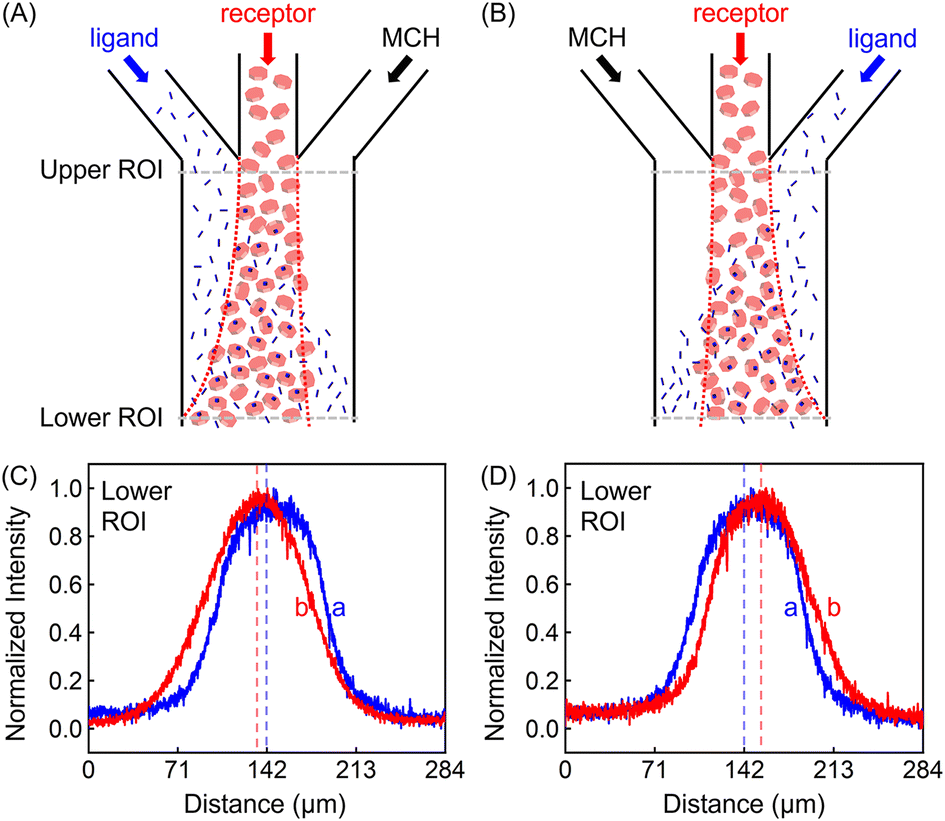 | ||
| Fig. 3 (Upper panel) Illustrated channel inflows and diffusion status in the regime of (A) the leftward collective migration (ligand/receptor/MCH) and (B) the rightward collective migration (MCH/receptor/ligand). (Lower panel) Normalized intensity profiles of 100 μM ZnTCPP-TOA in contact with 100 mM pyridine placed in the (C) left and (D) right channels, respectively. The red dashed lines represent the conditions with pyridine, while the blue ones represent control experiments in the absence of the ligand. | ||
The discrepancy in the PL profiles of Fig. 3D can be used to define a new quantity, the chemotactic shift: 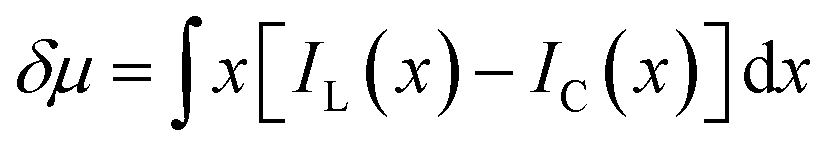 , where IL(x) and IC(x) represent the normalized intensity profiles with and without the ligand, respectively, while δμ is the net chemotactic shift of the PL signals (detailed definition and deduction are provided in the ESI†). This variable can be employed to glean quantitative information about the ligand–receptor binding interaction. To do this, 100 μM ZnTCPP-TOA was flow-injected into the centre, while varying concentrations of pyridine (cligand) were introduced in the left channel. As shown in Fig. 4B, the chemotactic mobility depended strongly on cligand, and the variable of chemo-tactic shift (δμ) is plotted as a function of cligand in Fig. 4C (black points). These data can be fitted to a binding isotherm.26 In this case, δμ on the y-axis is used as a parameter for the fraction of ligand-bound receptors (black curve):
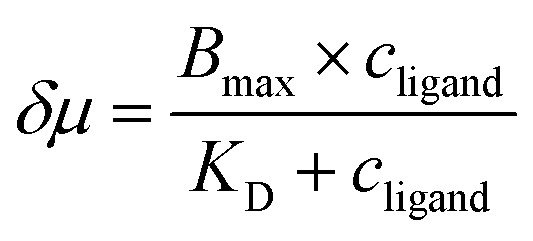 | (1) |
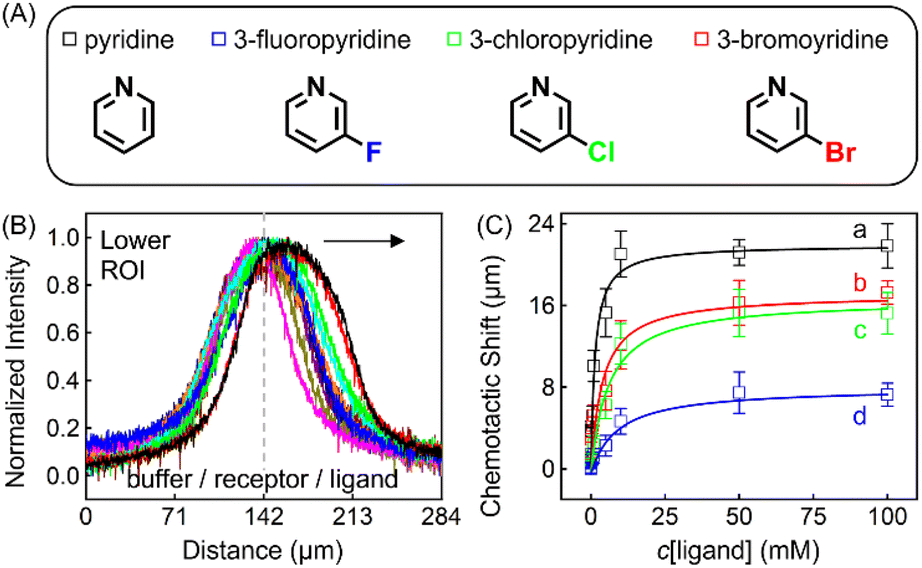 | ||
| Fig. 4 (A) Molecular structures of each ligand. (B) Normalized PL intensity profiles for 100 μM ZnTCPP-TOA in the presence of varying concentrations of pyridine. The arrow specifies the leftward trend of profiles with increasing ligand concentration. (C) The peak displacements for four different pyridyl derivatives: (a) pyridine (Py), (b) 3-fluoropyridine (3-PyF), (c) 3-chloropyridine (3-PyCl), and (d) 3-bromo-pyridine (3-PyBr). The solid lines represent the best fits to eqn (1). The chemotactic profiles for the latter three titrants are supplied in Fig. S8.† | ||
To ensure the receptor shifting was due to its binding with ligands, pyridine was replaced with methylbenzene, an analogue of MCH with no binding site for ZnTCPP-TOA. As shown in Fig. S7A,† even if ctoluene increases up to 100 mM, there is still no appreciable δμ for ZnTCPP-TOA (Fig. S7B†), thus providing another piece of circumstantial evidence for the binding-induced molecular chemotaxis. Next, ligand-binding experiments were carried out with a series of halogenated pyridines including 3-fluoro-, 3-chloro-, and 3-bromo-pyridines. These data-points are also plotted in Fig. 4C and the ligand structures are depicted in Fig. 4A. The extracted fits for Bmax and KD are summarized in Table 1. The KD ordering of Py < 3-PyBr < 3-PyCl < 3-PyF matches the inverse relationship of their nucleophilicity.30,31 To be exact, molecules with stronger nucleophilicity such as Py and 3-PyBr bound more tightly to ZnTCPP-TOA, as compared to 3-PyCl and 3-PyF.32,33
| Ligand | Chemotaxis | Absorbance | ||
|---|---|---|---|---|
| K D (mM) | B max (μm) | K D (mM) | B max (a.u.) | |
| Py | 1.81 ± 0.37 | 33.49 ± 1.41 | 1.98 ± 0.21 | 1.11 ± 0.06 |
| 2-PyBr | 9.93 ± 3.04 | 16.17 ± 1.38 | 4.22 ± 6.43 | 1.03 ± 0.28 |
| 2-PyCl | 18.93 ± 3.14 | 13.65 ± 0.71 | 15.08 ± 11.06 | 1.09 ± 0.01 |
| 2-PyF | 35.51 ± 7.25 | 6.29 ± 1.17 | 34.48 ± 22.04 | 1.20 ± 0.11 |
| 3-PyBr | 2.72 ± 0.61 | 23.20 ± 1.12 | 1.94 ± 0.71 | 1.44 ± 0.11 |
| 3-PyCl | 6.63 ± 1.09 | 22.05 ± 0.93 | 3.94 ± 1.63 | 1.34 ± 0.15 |
| 3-PyF | 7.16 ± 1.01 | 9.22 ± 0.34 | 5.38 ± 2.49 | 1.26 ± 0.12 |
| NH(octyl)2 | 0.13 ± 0.05 | 13.89 ± 0.67 | 0.11 ± 0.09 | 1.10 ± 0.11 |
| N(octyl)3 | 0.007 ± 0.003 | 13.58 ± 0.56 | 0.003 ± 0.002 | 1.11 ± 0.08 |
Noteworthily, the extent of chemotactic shift, (δμ)max = Bmax, for the four ligands follows a reverse sequence of Py > 3-PyBr > 3-PyCl > 3-PyF. Pyridine has the largest (δμ)max of ∼21 μm above all, almost 1.5 times that of 3-PyBr and 3-PyCl, whereas 3-PyF moved the shortest distance. As can be observed from the structures shown at the top of Fig. 4, the electronic withdrawal of halogen atoms (i.e. F > Cl > Br) at the meta-position weakens to various degrees the electron-donating capacity of N that can bind to the metal site on the porphyrin.30 In this sense, the origin of the chemotactic shift towards similar ligands should be correlated to their binding strengths.
As well as the three meso-halogenated pyridyl derivatives, their ortho-counterparts, i.e., 2-PyF, 2-PyCl, and 2-PyBr, were also tested as ligands (Fig. S9E†). Furthermore, using the fits between δμ and cligand in Fig. S9D,†Bmax and KD for the set of 2-position pyridines were calculated and included in Table 1 as well. Clearly, the KD value of each kind of 2-halopyridine is unanimously greater than that of its corresponding 3-substituent. Precisely, it is the steric hindrance around the heterocyclic N that suppressed these ligand affinities and concurrently the chemotactic shifts.
To further explore the role that other types of ligands may play in the receptor chemotaxis, we studied the chemotactic behaviour of ZnTCPP-TOA with two soluble aliphatic amines, di-n-octyl-amine (NH(octyl)2) and trioctylamine (N(octyl)3). Unlike N-doped hetero-cycles, the secondary and tertiary alkyl Ns bound much tighter, as manifested in the chemotactic shifts of Fig. 5D and E, respectively. In both cases, the coloured data-points and grey curves depict the chemotaxis responses of ZnTCPP-TOA. As compiled in Table 1, the KD values for NH(octyl)2 and N(octyl)3 were found to be lower by at least one order of magnitude compared to those of the pyridyl series, highlighting the much tighter binding to the receptor. Nonetheless, the (δμ)max values of the two are essentially the same within experimental error and fall between that of 3-PyF and 3-PyCl. The reason for this could be explained, as shown in Fig. S10A–D,† by the fact that a split Söret band emerges and is preserved with the increase of all four cpyridine, whereas for both NH(octyl)2 and N(octyl)3, only one spike remains at 428 nm (Fig. S10E and F†). Likewise, each 2-halopyridine-dependent KD was obtained from Fig. S11A–C,† and compared with that from Fig. S9,† and they do not differ much between the two methods. The absorptions jump at higher c2-PyF, c2-PyCl and c2-PyBr, making the fits conspicuously deviate from the standard Langmuir isotherm. According to Meijer et al.,31 pyridine is capable of inducing a spontaneous dimerization forming a 2:2 complex with ZnTCPP-TOA in which two porphyrins inter-stacked with a mono-valent ligand on both sides, whereas NH(octyl)2 and N(octyl)3 always form the regular 1:1 complex (Fig. 5A).32,34 The former could be treated like a divalent binding complex, which means the KD value for ZnTCPP-TOA and pyridine binding should be an apparent one out of a net binding reaction. In light of this, the ligand-receptor stoichiometry (SRL) also contributes to the chemo-tactic amplitude. Altogether, including the ligand size (VL, i.e. the volume exclusion), an empirical dependency of (δμ)max on the known factors can be formulated as:
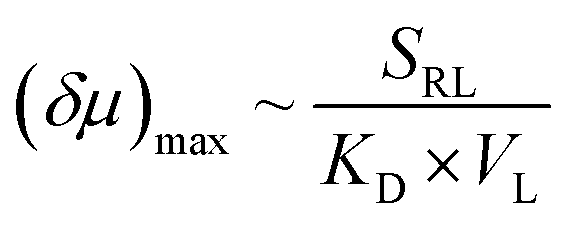 | (2) |
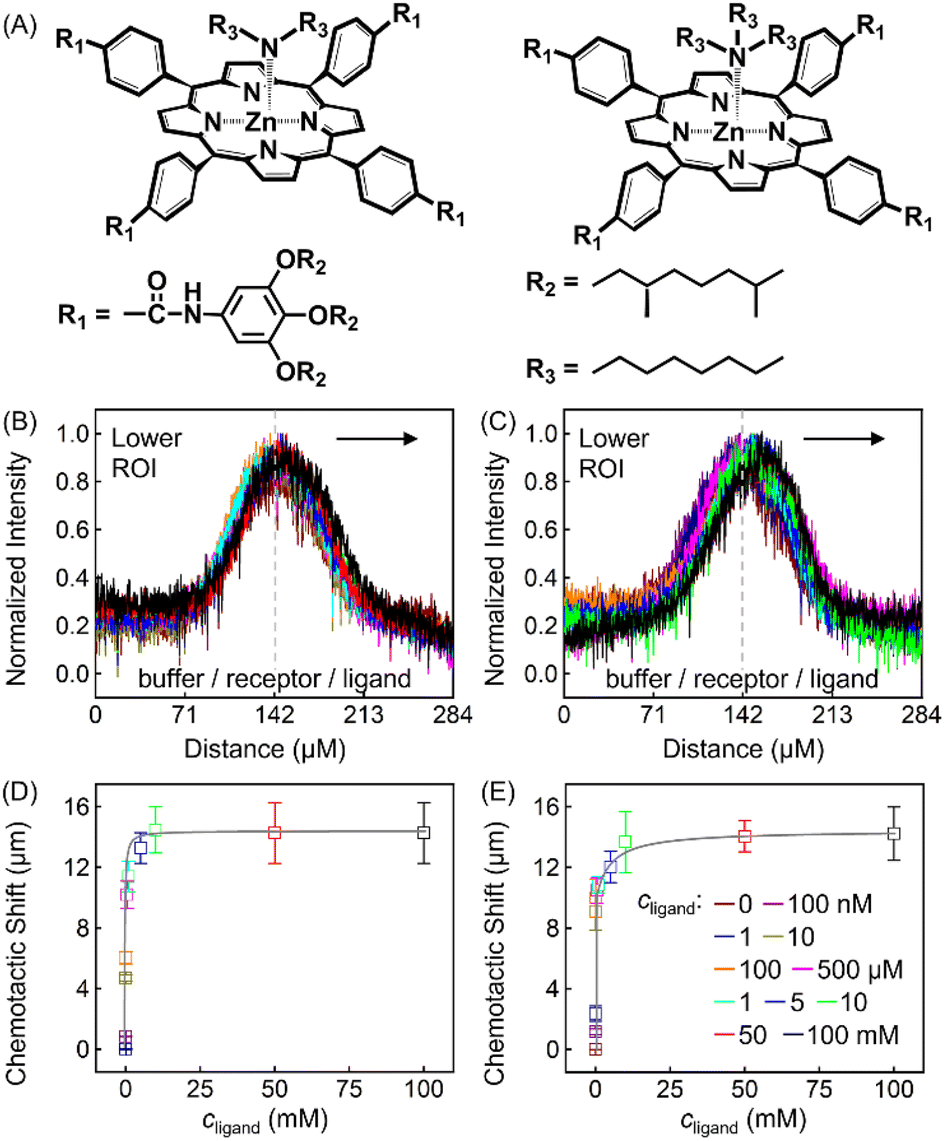 | ||
| Fig. 5 (A) Molecular structures of singlet ZnTCPP-TOA vs. NH(octyl)2 (left) and N(octyl)3 (right). Normalized line profiles for 100 μM ZnTCPP-TOA in the presence of varying concentrations of (B) NH(octyl)2 and (C) N(octyl)3. Arrows suggest that the distribution shifts to the right with increasing ligand concentration. The grey solid lines in (D) and (E) are the corresponding nonlinear fittings of the peak shift of PL intensity distribution from (B) and (C), respectively. | ||
Mechanism for chemotaxis
Diffusion-ordered NMR spectroscopy (NMR-DOSY, Fig. S13†) was applied to study the effect of pyridine on the diffusivity of ZnTCPP-TOA using the chemical shift of deuterated MCH (MCD) as a marker.35 Detections were made with cpyridine ranging from 0 to 100 mM. The diffusion constant (D) values as a function of cpyridine are listed in Table 2. This tendency deviates from the notion that the diffusion constant of porphyrins should be nearly completely unperturbed by the binding of pyridine, because ZnTCPP-TOA could self-assemble into labile H-aggregate-like oligomers.36 Binding with pyridine continuously depolymerized them while the subsequent solvation in MCH of weak polarity led to a slightly enhanced diffusion at low cpyridine; whereas a high cpyridine inter-spaced ZnTCPP-TOA thoroughly into free dimers, as corroborated in Fig. 6A.| c pyridine | 0 | 10 μM | 1 mM | 10 mM | 100 mM |
|---|---|---|---|---|---|
| D ZnTCPP-TOA (×10−6 cm2 s−1) | 3.20 ± 0.19 | 3.26 ± 0.21 | 3.36 ± 0.25 | 3.38 ± 0.24 | 3.42 ± 0.24 |
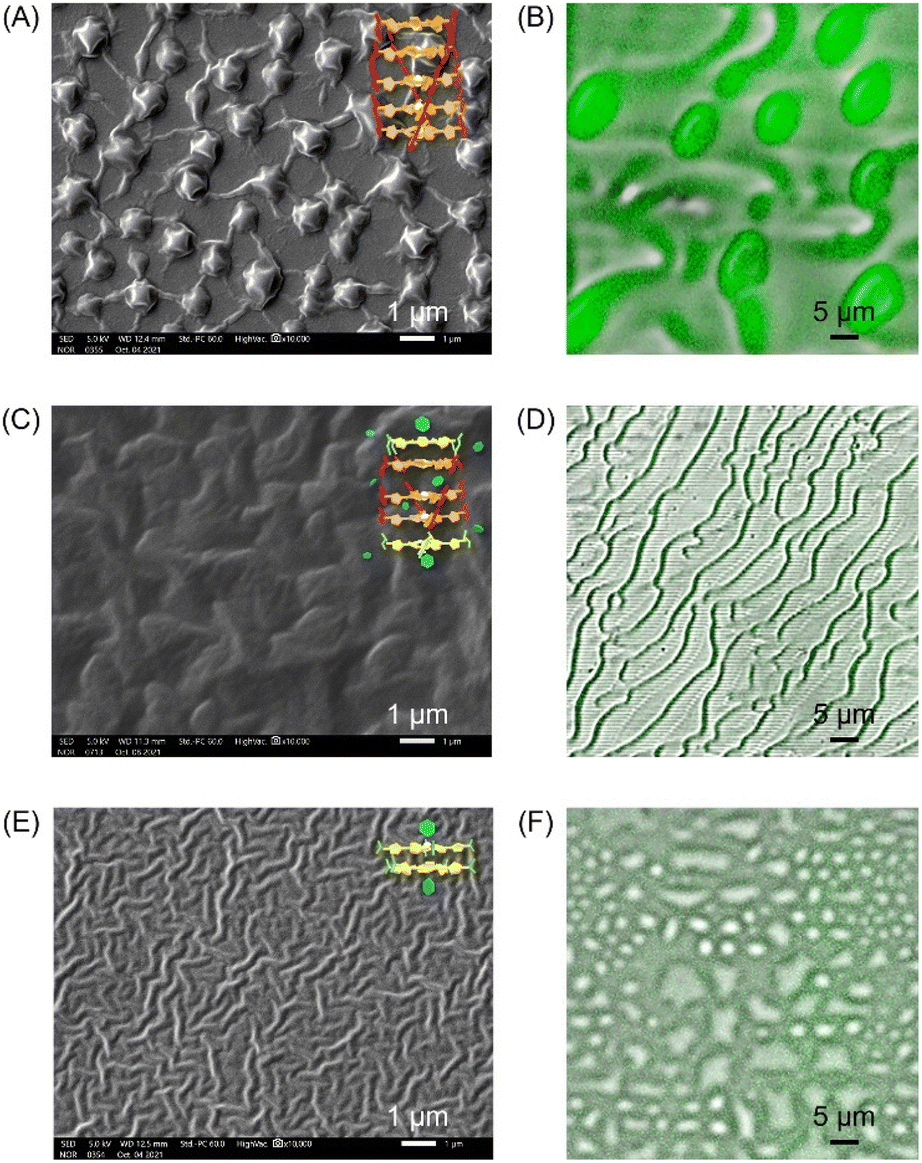 | ||
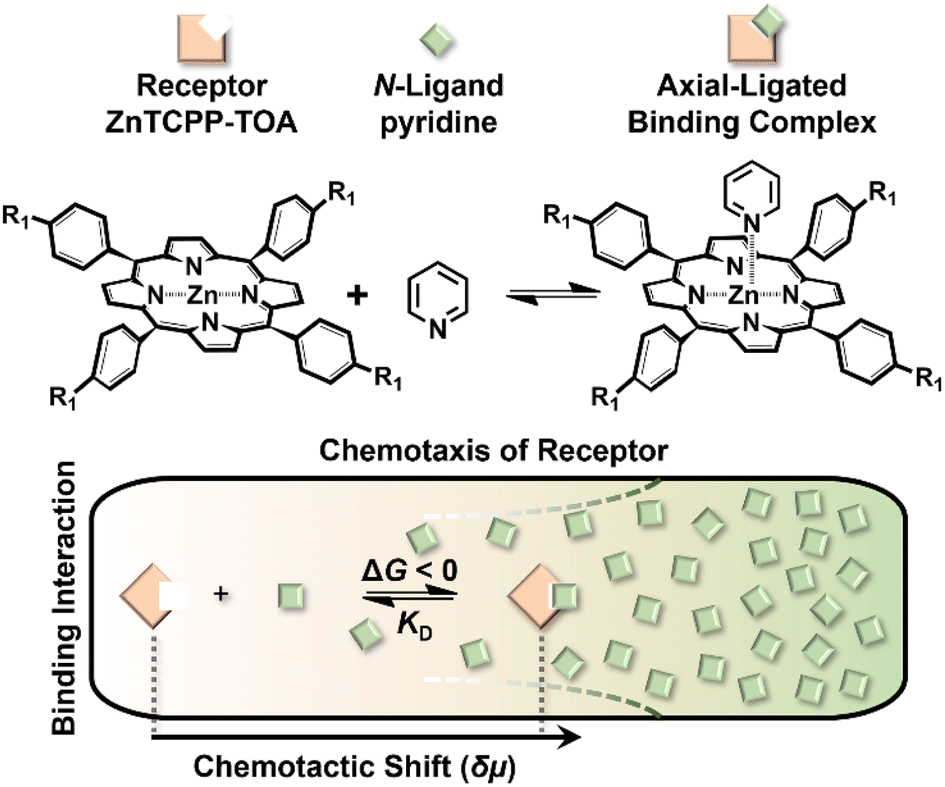
| Fig. 6 Morphology characterization using SEM (left column, scale bar: 1 μm) and confocal microscopy (right column, scale bar: 5 μm) of a solid mixture of 100 μM ZnTCPP-TOA with (A and B) 0, (C and D) 5 mM, and (E and F) 100 mM pyridine. The SEM insets show the structural evolution of ZnTCPP-TOA at the three cligand checkpoints. | ||
D pyridine was examined separately by using DOSY as well. The diffusion constant of this small molecule was (2.28 ± 0.15) × 10−5 cm2 s−1 in the absence of ZnTCPP-TOA. After the introduction of 100 mM ZnTCPP-TOA, this value was found to decrease to (1.85 ± 0.21) × 10−5 cm2 s−1, which proves that the small ligands were substantially slowed down by the binding process. Here, it is worth noting that except for the collective adsorption of tiny dyes on a polymer,5 the bacteria-liked chemotaxis of a relatively large entity induced by its pure binding with smaller ligands is observed for the first time here without the help of either (bio)catalysis or diffusiophoresis.37,38
The binding process was further visualized using scanning electron microscopy (SEM) and confocal microscopy. As shown in Fig. 6, 100 μM ZnTCPP-TOA collapsed to self-agglomerates in the shape of (0.94 ± 0.10) μm knots during evaporation of MCH (the solvent, Fig. 6A and B), mainly because of its TOA peripherals that facilitated hydrophobic bundling among ZnTCPPs.39 In stark contrast, the presence of 5 mM pyridine unfolded the coils partially (Fig. 6C and D), followed by total dissociation into long but loose strings in the dry state with the addition of excessive pyridine (Fig. 6E and F). These variations in morphology illuminate and justify the growth in diffusivity shown in Table 2 as well as the UV spectral changes upon gradual addition of pyridyl compounds shown in Fig. S10.† As shown in Fig. 5A, the complex unit would likely chain up to form a thin nanowire via ligand–ligand interaction during the desolvation.28 By and large, the overall chemotaxis of ZnTCPP-TOA towards the gradient of pyridine can be illustrated in Fig. 7.
 | ||
| Fig. 7 A general scheme for the binding-induced chemotaxis of the receptor. The chemotactic shift δμ of ZnTCPP-TOA as a function of ligand concentration can be used to extract the equilibrium dissociation constant KD. | ||
Thermodynamic model
The microfluidic and diffusion constant data point to the idea that the free energy of binding is sufficient to cause chemotaxis, as has been previously suggested by Schurr.2,40 In essence, chemotactic drift arises from a thermodynamic driving force that lowers the overall chemical potential of the system due to favourable ligand binding. Therefore, we designed a model to test whether the free energy of binding could elucidate the directed motion observed in this ligand–porphyrin system. To begin, we note that the binding interaction between receptor and ligand should generate a thermodynamic force that drives the two in tandem.40 We derived this force by applying McMillan-Mayer solution theory for dilute solutes with a binding equilibrium.41Considering a solution with three dilute species: free receptor (R0), free ligand (L0), and a receptor-ligand (RL) complex, we assume that at every point, R, in solution, the ligand and receptor are in binding equilibrium with an equilibrium dissociation constant, KD:
 | (3) |
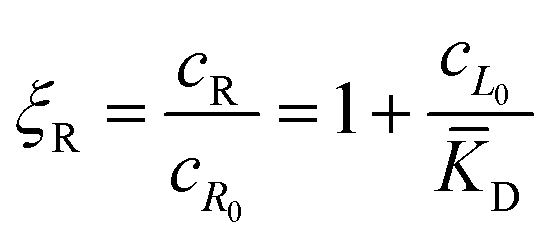
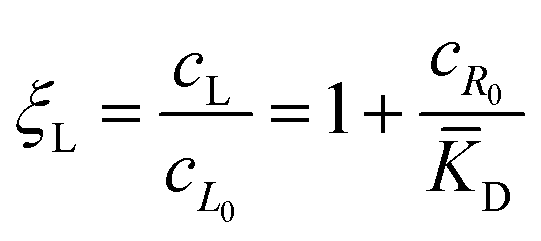
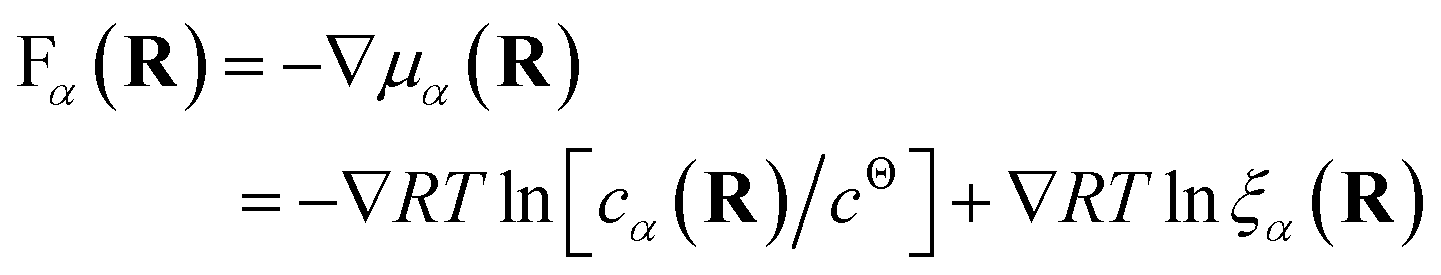
![[K with combining macron]](https://www.rsc.org/images/entities/i_char_004b_0304.gif) D = cΘ × KD is the dimensionless binding constant and cΘ is a reference concentration. We define cR = cR0 + cRL and cL = cL0 + cRL as the total receptor and ligand contents, respectively, and μR and μL as the corresponding effective chemical potentials that govern the equilibrium distribution of cR and cL. For each total species, α = R or L, the effective chemical potential may be expressed as:
D = cΘ × KD is the dimensionless binding constant and cΘ is a reference concentration. We define cR = cR0 + cRL and cL = cL0 + cRL as the total receptor and ligand contents, respectively, and μR and μL as the corresponding effective chemical potentials that govern the equilibrium distribution of cR and cL. For each total species, α = R or L, the effective chemical potential may be expressed as: | (4) |
In this equation, the first term is the standard state chemical potential of the free species in solution; the second is the standard contribution from the translational entropy; while the last reduces the chemical potential due to the binding interaction, whose contribution is expressed in terms of a binding polynomial,42,43 which for the receptor and ligand may be expressed as:
 | (5) |
 | (6) |
Both effective species, α = R and L, will experience a thermo-dynamic force driving them towards regions of reduced chemical potential:
 | (7) |
The first contribution to the force drives diffusion away from regions of high concentration in order to maximize the translational entropy. The second contribution drives the molecules towards their free binding partners in order to minimize their binding free energy.
Assuming that the solute motion is in an overdamped regime, the net fluxes are
| JR(R) = −DR∇cR(R) + DRb(R)∇cL0(R) | (8) |
| JL(R) = −DL∇cL(R) + DLb(R)∇cR0(R) | (9) |
The first term corresponds to Fick's law where DR and DL are effective diffusion constants for the total receptor and ligand concentrations, respectively. In principle, these effective diffusion constants depend upon the varying ratio of free and bound molecules,44 though such complications are neglected here. The second term describes the flux towards the free binding partners with an apparent “cross-diffusional” constant that reflects the binding constant:
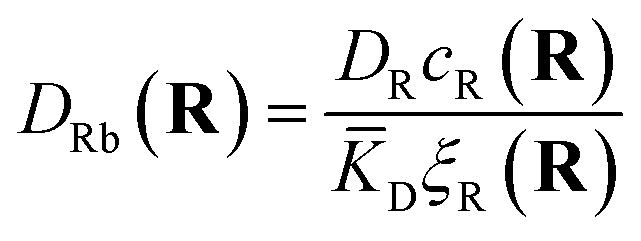 | (10) |
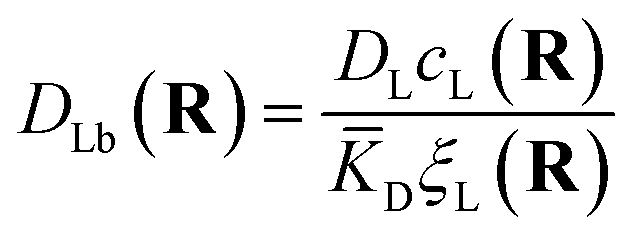 | (11) |
Note that, though previous studies proposed cross-diffusion of this form,2,5 the present derivation clarifies that the cross-diffusion reflects a thermodynamic force generated by equilibrium binding interactions rather than more complicated non-equilibrium phoretic or hydrodynamic phenomena.44 Finally, conservation of mass implies that the effective concentrations evolve according to:
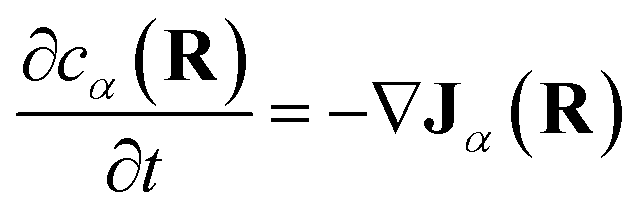 | (12) |
Despite its simplicity, this thermodynamic model nicely describes and predicts the experimental observations of chemotactic movement. Specifically, we considered the case that 100 μM receptor (i.e. ZnTCPP-TOA) enters the centre channel of the microfluidic device, while varying concentrations of ligand (i.e. pyridine) enter into the right channel. We simulated the concentration profile of each species as it flowed through the channel, and compared the output lateral profile for the total concentration of free and bound receptors with the observed fluorescence at the lower ROI.
We adopted a “plug-flow” approximation for the fluids of ZnTCPP-TOA and pyridine down the channel, while modelling the evolution of concentration profiles transverse to the flow via the 1-dimensional Smoluchowski equation established from eqn (7)–(11) with a non-flux boundary condition at the channel walls.45 This kernel function was enacted in a simple explicit forward-time centred-space differencing scheme, while using an integration time step of 15 μs and a mesh of 720637 grid points. We numerically integrated these equations for 11.2 s, corresponding to the time for solutes to swim down the channel. The source code (SI) underwent rigorous bench-mark tests with respect to the integration time step and grid spacing. Since the entering profile of nonradiative ligands was difficult to probe in situ, the initial concentration of each species was hypothesized to be invariant across the channel. Nevertheless, we slightly smoothed the concentration profiles at the entrance channel boundaries for numerical stability.
This thermodynamic binding model is dictated by three key parameters: the equilibrium dissociation constant (KD) and the effective diffusion constants of the receptor (DR) and the ligand (DL). Note that the three were taken as independent of solution composition to reproduce the experimental fluorescence distributions. In particular, DR = 3.20 × 10⁻⁶ cm2 s−1 being the exact value determined from NMR-DOSY was input to fit the signal of ZnTCPP-TOA in the absence of pyridine, as tabulated in Table 2. Besides, DL = 2.28 × 10⁻⁵ cm2 s−1 according to NMR-DOSY at intermediate cpyridine, since the receptor fluorescence responds most sensitively in this regime (Fig. S12A†). Fig. 8A shows the simulated profiles for total concentration of ZnTCPP-TOA after 11.2 s. The simulated profile shifts towards the ligand with increasing ligand density. Fig. 8B compares simulated and measured chemotactic shifts over a range of cpyridine. Furthermore, the magnitudes of the simulated and measured chemotactic shifts agree very well, both being well fit by nearly identical curves corresponding to eqn (1). The computational KD is 1.87 mM, very close to the range of values, i.e., from 1.81 to 1.98 mM, already mentioned in the above context from various approaches. In view of these results, given the simplicity of this thermo-dynamic model, the few assumptions regarding the program initialization, and the similarities between the experimental and simulative conditions, such agreement is quite encouraging.
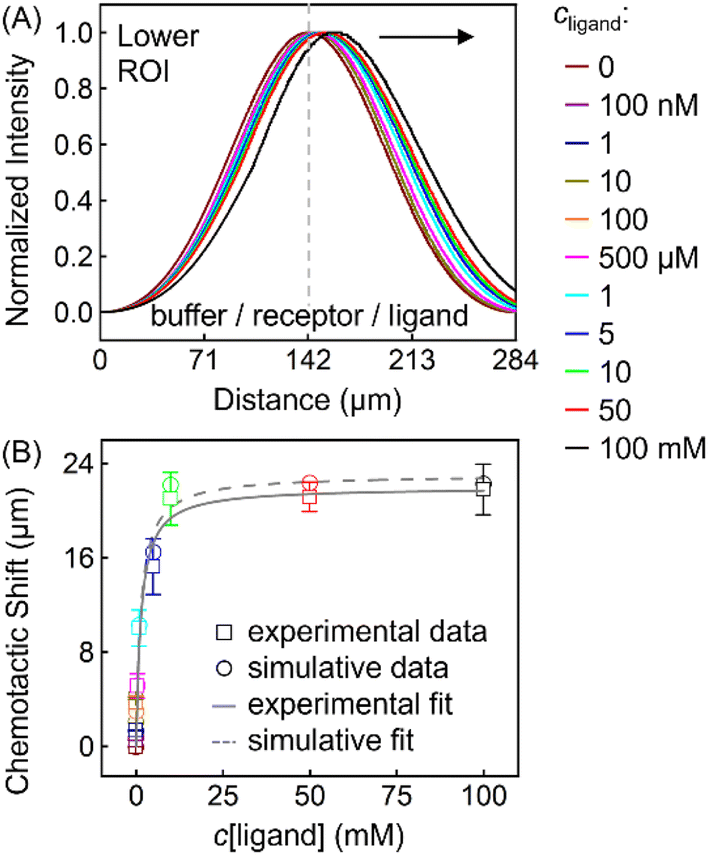 | ||
| Fig. 8 (A) Normalized simulated gradient profiles of 100 μM ZnTCPP-TOA at different cpyridine (MCH/ZnTCPP-TOA/pyridine) (from the middle to the right: 0; 100 nM; 1, 10, 100, 500 μM; 1, 5, 10, 50, 100 mM) as a function of lateral position along the channel width. (B) The relationship between the peak shift relative to the blank (MCH/ZnTCPP-TOA/MCH) and cpyridine, and its fit to eqn (1). | ||
This thermodynamic formalism can be extended to more complicated binding scenarios, e.g., the case involving multivalent ligand-receptor binding, and the interaction among receptors (aggregation) as characterized before. The latter will then cause additional restraint on the diffusion of total receptor species and, accordingly, withhold the thermodynamic propulsion for porphyrin chemotaxis,46 which will shrink the FWHM of the profiles in Fig. 8A closer to those in Fig. 4B.
Based on both simulations and experiments, it is clear that thermodynamically favourable binding alone can lead to the chemotactic movement of receptor molecules up a concentration gradient of ligands. The close quantitative agreement between theory and experiments suggested that other factors, such as nonspecific phoretic interactions, viscosity changes (Fig. S16†), or hydrodynamic forces,44–46 played at most only a minor role in the chemotactic migration of such small molecules. Additionally, a concomitant smaller change in the diffusivity occurred for the receptor upon ligand binding, which may not necessarily be a prerequisite for chemotaxis,47 though both of these factors have been invoked appreciably in previous mechanistic models for enzyme chemotaxis.18 Of course, the type of free energy-driving force found here requires equilibrium binding to occur, and binding that is irreversible on the timescale of these measurements (i.e. 11.2 s, Fig. S12B†) would not necessarily produce similar results.
Conclusions
Chemotaxis may play a hitherto unsuspected role in promoting processes involving interactions that are free energy favourable. For example, the kinetics of mixing may be faster in solutions involving components that interact with one another in a manner that is free energy favourable. Such reactions may take place in a wide variety of contexts from the interactions of proteins with metal ions to the interactions of colloidal particles in coatings.47,48 Such forces can therefore be additive in a multivalent binding ensemble. As such, proteins with multivalent binding sites may be employed to enhance chemotaxis.46 Additionally, systems with many favourable specific solute recognitions or nonspecific solvation would be expected to undergo large shifts.4,9,49Data availability
Data regarding structure and diffusion characterization, calculation of chemotactic shift, modeling details, etc., can be found in the ESI.†Author contributions
The manuscript was written through contributions of all authors. All authors have given approval to the final version of the manuscript.Conflicts of interest
The authors declare no competing financial interests.Acknowledgements
This project was financially supported by the National Key Research and Development Program of China for International Science & Innovation Cooperation Major Project between Governments (Grant No. 2018YFE0113200), National Natural Science Foundation of China (21874071 and 22104058), and Fundamental Research Funds for the Central Universities (30921013112, 30920021125, and 30922010501).Notes and references
- C. Zhou, C. Gao, Y. Wu, T. Si, M. Yang and Q. He, Angew. Chem., Int. Ed., 2022, 61, e202116013 Search PubMed
.
- X. Zhao, H. Palacci, V. Yadav, M. M. Spiering, M. K. Gilson, P. J Butler, H. Hess, S. J. Benkovic and A. Sen, Nat. Chem., 2018, 10, 311–317 CrossRef PubMed
- G. Salinas, A. L. Dauphin, S. Voci, L. Bouffier, N. Sojic and A. Kuhn, Chem. Sci., 2020, 11, 7438–7443 RSC
- C. Zhang, A. Sitt, H.-J. Koo, K. V. Waynant, H. Hess, B. D. Pate and P. V. Braun, J. Am. Chem. Soc., 2015, 137, 5066–5073 CrossRef PubMed
- R. Guha, F. Mohajerani, M. Collins, S. Ghosh, A. Sen and D. Velegol, J. Am. Chem. Soc., 2017, 39, 15588–15591 CrossRef
- B. Wang, K. Kostarelos, B. J. Nelson and L. Zhang, Adv. Mater., 2021, 33, e2002047 CrossRef
- A.-Y. Jee, S. Dutta, Y.-K. Cho, T. Tlusty and S. Granick, Proc. Natl. Acad. Sci. U. S. A., 2018, 115, 14–18 CrossRef CAS
- R. D. Astumian, Proc. Natl. Acad. Sci. U. S. A., 2018, 115, 9405–9413 CrossRef CAS PubMed
- S. P. Afrose, C. Ghosh and D. Das, Chem. Sci., 2021, 12, 14674–14685 RSC
- K. K. Dey, S. Das, M. F. Poyton, S. Sengupta, P. J. Butler, P. S. Cremer and A. Sen, ACS Nano, 2014, 8, 11941–11949 CrossRef PubMed
- A. Senoussi, J. C. Galas and A. Estevez-Torres, Sci. Adv., 2021, 7, eabi9865 CrossRef
- G. Lee, G. Leech, M. J. Rust, M. Das, R. J. McGorty, J. L. Ross and R. M. Robertson-Anderson, Sci. Adv., 2021, 7, eabe4334 CrossRef
- Y. Fang, X. Yang, Y. L. Lin, J. Y. Shi, A. Prominski, C. Clayton, E. Ostroff and B. Z. Tian, Chem. Rev., 2022, 122, 5233–5276 CrossRef PubMed
- K. Das, L. Gabrielli and L. J. Prins, Angew. Chem., Int. Ed., 2021, 60, 20120–20143 CrossRef CAS
- Z. Zhao, J. L. Fu, S. Dhakal, A. Johnson-Buck, M. H. Liu, T. Zhang, N. W. Woodbury, Y. Liu, N. G. Walter and H. Yan, Nat. Commun., 2016, 10, 1–9 Search PubMed
- L. C. Seefeldt, Z. Y. Yang, D. A. Lukoyanov, D. F. Harris, D. R. Dean, S. Raugei and B. M. Hoffman, Chem. Rev., 2020, 120, 5082–5106 CrossRef CAS
- L. Su, J. Mosquera, M. F. J. Mabesoone, S. M. C. Schoenmakers, C. Muller, M. E. J. Vleugels, S. Dhiman, S. Wijker, A. R. A. Palmans and E. W. Meijer, Science, 2022, 377, 213–218 CrossRef CAS
- P. Illien, X. Zhao, K. K. Dey, P. J. Butler, A. Sen and R. Golestanian, Nano Lett., 2017, 17, 4415–4420 CrossRef CAS
- M. Hanna, H.
M. Key, P. Dydio, D. S. Clark and J. F. Hartwig, Nature, 2016, 534, 534–537 CrossRef PubMed
- C. J. Kingsbury and M. O. Senge, Coord. Chem. Rev., 2021, 431, 213760 CrossRef
- M. Wehner and F. Würthner, Nat. Rev. Chem., 2020, 4, 38–53 CrossRef
- L. Favereau, A. Cnossen, J. B. Kelber, J. Q. Gong, R. M. Oetterli, J. Cremers, L. M. Herz and H. L. Anderson, J. Am. Chem. Soc., 2015, 137, 14256–14259 CrossRef PubMed
- S. Shao, J. M. Geng, H. A. Yi, S. Gogia, S. Neelamegham, A. Jacobs and J. F. Lovell, Nat. Chem., 2015, 7, 438–446 CrossRef
- E. Weyandt, L. Leanza, R. Capelli, G. M. Pavan, G. Vantomme and E. W. Meijer, Nat. Commun., 2022, 248, 1–9 Search PubMed
- A. A. Ensign, I. J. Ilyas Yildirim, T. D. Krauss and K. L. Bren, Proc. Natl. Acad. Sci. U. S. A., 2008, 105, 10779–10784 CrossRef CAS PubMed
- C. D. Davies and R. M. Crooks, Chem. Sci., 2020, 11, 5547–5558 RSC
- G. Z. Ma, G.-D. Syu, X. N. Shan, B. Henson, S. P. Wang, P. J. Desai, H. Zhu and N. J. Tao, J. Am. Chem. Soc., 2018, 140, 11495–11501 CrossRef CAS
- F. Helmich, C. C. Lee, M. M. Nieuwenhuizen, J. C. Gielen, P. C. Christianen, A. Larsen, G. Fytas, P. E. Leclère, A. P. Schenning and E. W. Meijer, Angew. Chem., Int. Ed., 2010, 49, 3939–3942 CrossRef CAS
- E. Weyandt, I. A. W. Filot, G. Vantomme and E. W. Meijer, Chem.–Eur. J., 2021, 27, 9700–9707 CrossRef CAS
- N. Abuhafez, A. Perennes and R. Gramage-Doria, Synthesis, 2022, 54, 3473–3481 CrossRef CAS
- M. Kadri, J. R. Hou, V. Dorcet, T. Roisnel, L. Bechki, A. Miloudi, C. Bruneau and R. Gramage-Doria, Chem.–Eur. J., 2017, 23, 5033–5043 CrossRef CAS
- A. Nakai, J. Kim, T. Tanaka, D. Kim and A. Osuka, Angew. Chem., Int. Ed., 2021, 60, 26540–26544 CrossRef CAS PubMed
- Y. Kuroda, A. Kawashima, Y. Hayashi and H. Ogoshi, J. Am. Chem. Soc., 1997, 119, 4929–4933 CrossRef
- N. Leblanc, S. Sproules, K. Fink, L. Sanguinet, O. Alévêque, E. Levillain, P. Rosa and A. K. Powell, Chem. Sci., 2016, 7, 3820–3828 RSC
- S. Hirayama, K. Oohora, T. Uchihashi and T. Hayashi, J. Am. Chem. Soc., 2020, 142, 1822–1831 CrossRef PubMed
- F. Yang, X. Y. Liu and Z. J. Yang, Angew. Chem., Int. Ed., 2021, 60, 14671–14678 CrossRef PubMed
- X. Arqué, T. Patino and S. Sánchez, Chem. Sci., 2022, 13, 9784–9786 RSC
- S. Shim, Chem. Rev., 2022, 122, 6986–7009 CrossRef CAS
- L. MacFarlane, C. Zhao, J. Cai, H. Qiu and I. Manners, Chem. Sci., 2021, 12, 4661–4682 RSC
- A. S. Saglam and L. T. Chong, Chem. Sci., 2018, 10, 2360–2372 RSC
- K. K. Dey, F. Y. Pong, J. Breffke, R. Pavlick, E. Hatzakis, C. Pacheco and A. Sen, Angew. Chem., Int. Ed., 2016, 128, 1125–1129 CrossRef
- J. M. Schurr, B. S. Fujimoto, L. Huynh and D. T. Chiu, J. Phys. Chem. B, 2013, 117, 7626–7652 CrossRef CAS PubMed
-
T. L. Hill, An Introduction to Statistical Thermodynamics, Dover Publications, Inc., Mineola, NY, 1987 Search PubMed
- D. Ni, J. C. Wei, X. H. He, A. U. Rehman, X. Y. Li, Y. R. Qiu, J. Pu, S. Y. Lu and J. Zhang, Chem. Sci., 2020, 12, 464–476 RSC
- F. Noé, A. Tkatchenko, K. R. Müller and C. Clementi, Annu. Rev. Phys. Chem., 2020, 71, 361–390 CrossRef
- S. Saha, G. Gangopadhyay and D. S. Ray, J. Biosci., 2022, 47, 1–17 CrossRef
- X. Wang and D. W. Jing, J. Phys. D: Appl. Phys., 2022, 55, 145401 CrossRef CAS
- G. C. Gschwend, M. Kazmierczak, A. J. Olaya, P. F. Brevet and H. H. Girault, Chem. Sci., 2019, 10, 7633–7640 RSC
- V. Kirejev, B. A. Doosti, M. Shaali, G. D. M. Jeffries and T. Lobovkina, Small, 2018, 14, 1703541 CrossRef PubMed
Footnotes |
| † Electronic supplementary information (ESI) available. See DOI: https://doi.org/10.1039/d2sc04849c |
| ‡ These authors contributed equally to this work. |
| This journal is © The Royal Society of Chemistry 2022 |