
 Open Access Article
 This Open Access Article is licensed under a Creative Commons Attribution-Non Commercial 3.0 Unported Licence
Insights into the importance of WPD-loop sequence for activity and structure in protein tyrosine phosphatases†
Ruidan
Shen
a,
Rory M.
Crean
b,
Keith J.
Olsen
a,
Marina
Corbella
 b,
Ana R.
Calixto
b,
Teisha
Richan
a,
Tiago A. S.
Brandão
c,
Ryan D.
Berry
a,
Alex
Tolman
a,
J. Patrick
Loria
de,
Sean J.
Johnson
*a,
Shina C. L.
Kamerlin
*bf and
Alvan C.
Hengge
*a
b,
Ana R.
Calixto
b,
Teisha
Richan
a,
Tiago A. S.
Brandão
c,
Ryan D.
Berry
a,
Alex
Tolman
a,
J. Patrick
Loria
de,
Sean J.
Johnson
*a,
Shina C. L.
Kamerlin
*bf and
Alvan C.
Hengge
*a
aDepartment of Chemistry and Biochemistry, Utah State University, Logan, Utah 84322-0300, USA
bScience for Life Laboratory, Department of Chemistry – BMC, Uppsala University, BMC, Box 576, S-751 23 Uppsala, Sweden
cDepartamento de Química, ICEX, Universidade Federal de Minas Gerais, Belo Horizonte, Minas Gerais 31270-901, Brazil
dDepartment of Chemistry, Yale University, 225 Prospect Street, New Haven, CT 06520, USA
eDepartment of Molecular Biophysics and Biochemistry, Yale University, 266 Whitney Avenue, New Haven, CT 06520, USA
fSchool of Chemistry and Biochemistry, Georgia Institute of Technology, 901 Atlantic Drive NW, Atlanta, GA 30332-0400, USA
First published on 26th October 2022
Abstract
Protein tyrosine phosphatases (PTPs) possess a conserved mobile catalytic loop, the WPD-loop, which brings an aspartic acid into the active site where it acts as an acid/base catalyst. Prior experimental and computational studies, focused on the human enzyme PTP1B and the PTP from Yersinia pestis, YopH, suggested that loop conformational dynamics are important in regulating both catalysis and evolvability. We have generated a chimeric protein in which the WPD-loop of YopH is transposed into PTP1B, and eight chimeras that systematically restored the loop sequence back to native PTP1B. Of these, four chimeras were soluble and were subjected to detailed biochemical and structural characterization, and a computational analysis of their WPD-loop dynamics. The chimeras maintain backbone structural integrity, with somewhat slower rates than either wild-type parent, and show differences in the pH dependency of catalysis, and changes in the effect of Mg2+. The chimeric proteins' WPD-loops differ significantly in their relative stability and rigidity. The time required for interconversion, coupled with electrostatic effects revealed by simulations, likely accounts for the activity differences between chimeras, and relative to the native enzymes. Our results further the understanding of connections between enzyme activity and the dynamics of catalytically important groups, particularly the effects of non-catalytic residues on key conformational equilibria.
1 Introduction
Reversible phosphorylation is a common post-translational modification seen in over 30% of eukaryotic proteins.1–5 Phosphatases work in tandem with kinases to regulate this process in a broad spectrum of organisms.3 Among the protein phosphatase families, protein tyrosine phosphatases (PTPs) are defined by the active site signature motif called the P-loop (HCX5R) that includes a cysteine residue required for catalysis. Among the subclass of classical, pTyr-specific PTPs, protein tyrosine phosphatase 1B (PTP1B) and Yersinia outer protein H (YopH) are the most studied. PTP1B is a human PTP whose best-known biological role is that of a negative regulator in the insulin signaling pathway,3,4,6–15 while YopH is the virulence factor of Yersinia pestis, responsible for the bubonic plague.8,9PTPs catalyze dephosphorylation through a two-step mechanism involving the nucleophilic cysteine in the P-loop. Another catalytic residue, an aspartic acid, resides on a different conserved structural loop found among the classical PTPs. This is a mobile loop consisting of about a dozen residues called the WPD-loop, defined by the conserved residues tryptophan, proline, and aspartate found near its center. While mobile loops in proteins are common, PTPs are unusual in having a key catalytic residue residing on such a mobile element. This loop remains mobile upon substrate binding, but favors a closed conformation approximately 8 Å closer to the P-loop,16–18 bringing the aspartic acid into position to protonate the leaving group in the first step of catalysis (Fig. 1). In this step the nucleophilic cysteine attacks the phosphate ester while the aspartic acid protonates the aryl leaving group. This step is followed by hydrolysis of the cysteinyl-phosphate intermediate, using a water molecule that is activated by the same aspartate, now acting as a general base; both steps require the WPD-loop to be closed. Positioning of the nucleophilic water is assisted by a glutamine residue on the Q-loop, another conserved protein element in classical PTPs. Another loop common to the classical PTPs is the E-loop, which contains a conserved glutamate residue that is usually found in an electrostatic interaction with the conserved P-loop arginine, which provides hydrogen bonding interactions for substrate binding and transition state stabilization.19
 | ||
| Fig. 1 (Top) PTPs harbor a number of conformationally flexible loops decorating the active site, including the phosphate-binding P-loop (shown in green) and the WPD-loop (shown in orange). The WPD-loop exhibits two distinct conformations: an open, non-catalytic conformation, and a closed, catalytically active one, shown here complexed with the transition state analog (TSA) vanadate. The vanadate ion is shown in spheres and key catalytic side chains are shown in sticks. (Bottom) during the PTPase-catalyzed reaction, which involves a two-step reaction mechanism, the WPD-loop closes toward the P-loop. This brings a conserved aspartic acid into position to protonate the leaving group, followed by a subsequent rate-determining step where the same residue acts as a general base to activate a water molecule in the hydrolysis of the phosphocysteine intermediate. This figure is adapted from ref. 20. Copyright 2021 American Chemical Society. | ||
The rate-determining step in the PTP reaction is hydrolysis of the phosphoenzyme,21,22 making kcat independent of the original phosphoester substrate. Members of the PTP superfamily share the same catalytic residues, highly superimposable active site structures, and the same mechanism and transition state for both chemical steps. Yet, their rates vary over several orders of magnitude and exhibit different pH-rate dependencies. For example, at 25 °C, YopH and PTP1B exhibit kcat values for the substrate p-nitrophenyl phosphate (pNPP) of 720 s−1, and 52 s−1, respectively, at their pH optima23,24 and PTP1B has a significantly broader pH-rate profile25 than YopH.26 Other PTP superfamily members such as VHR, VHZ and SsoPTP have lower kcat values of 3–4 s−1 at 25 °C and pH 5.5.27 If not active site or mechanistic differences, what, then, gives rise to the highly variable kinetics found among PTPs? In light of recent findings of significant protein dynamics in PTPs,28–33 it is likely that differences in loop dynamics play a major role.
NMR dynamics experiments and molecular dynamics simulations with YopH and PTP1B have shown the acid loop samples both open and closed conformations throughout the catalytic cycle, although the equilibrium poise changes from favoring the loop-open form in the free enzymes, to the closed state when a ligand is bound. NMR data also reveal a correlation between the respective rates of WPD-loop closure and the cleavage rate (step 1 in Fig. 1) in YopH and PTP1B.33
The conserved Asp residue in the WPD loop serves critical roles in both chemical steps; as an acid in the first step, and a general base in the second. Why should an enzyme family evolve with a catalytic residue on a mobile loop? Evolutionarily, factors that affect loop motion could serve a regulatory purpose at the cost of maximally efficient catalysis. YopH, the fastest PTP yet characterized, exhibits the fastest WPD-loop dynamics measured to date. However, the “fastest” positioning of the Asp residue would be to place it on a non-mobile element, permanently in the optimal catalytic position. Such a stationary positioning is thought to be the case in many PTP family members on the basis of X-ray structures that show only a single conformation, although future work may reveal unsuspected mobility.34 Yet, those enzymes exhibit turnover numbers in the single digits, an order of magnitude slower than PTP1B, and two orders of magnitude slower than YopH. Variation in the rate of phosphoenzyme hydrolysis could reflect differences in optimal positioning of the Asp carboxylate, as well as the obvious role played by dynamics. Because only the WPD-loop closed conformation can perform catalysis, factors affecting the dynamic equilibria in Scheme 1, such as amino acid sequence within the WPD-loop, or interactions of the loop with surrounding regions of the protein, will affect both catalytic steps.
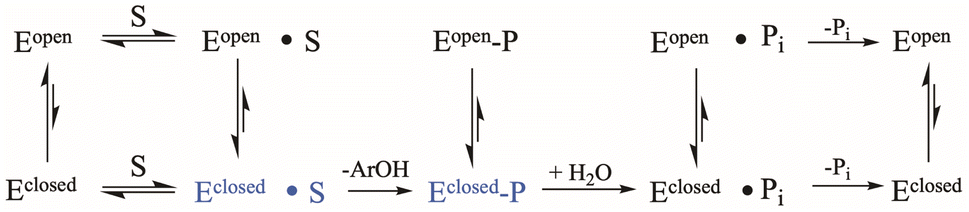 | ||
| Scheme 1 Kinetic scheme for the PTP catalytic cycle including WPD-loop equilibria. The catalytically functional WPD-loop closed conformational states are shown in blue. | ||
The creation of loop-grafted chimeras is a proven tool to study key mobile portions of proteins, providing valuable insight into protein function and evolvability. In addition, it is an increasingly popular tool to generate new enzymes with novel reactivities and specificities.35 For example, the grafting of multiple loops has been used to design and evolve β-lactamase activity in glyoxalase II36 and the role of protein motions in β-lactamase activity has been studied using chimeras of two class-A β-lactamases, TEM-1 and PSE-4.37 A chimera of ribonuclease A and a homologue was used to identify the role of protein flexibility in the rate-determining step38 and to identify conserved dynamical traits in the RNAse superfamily.39 The exchange of surface loops was shown to convert trypsin to a chymotrypsin-like protease.40 Chimeras of the Pseudomonas and Burkholderia homologs of the Rh1A enzyme have been a key tool in protein engineering and directed evolution studies.41 Related to this, modifications to a key active site loop in the (βα)8-barrel isomerase of histidine biosynthesis HisA during a real time evolution experiment allow this enzyme to diverge into HisA specialists, bifunctional HisA/TrpF specialists (the latter being an important step of tryptophan biosynthesis), and TrpF specialists.35,42 Finally, there is growing interest in the role of loop dynamics in protein evolvability43,44 and loop engineering and grafting as a tool for protein design.35,45–47
Most of the work in the field of loop dynamics has centered on surface and lid loops that cover the active site and their functional role in substrate and cofactor binding, protein–protein interaction, and stability.35 Crystal structures with bound analogs of peptide substrates23 show the WPD-loop does not act as a lid covering the PTP1B active site, and loop closure does not prohibit diffusion of the substrate and product (or water molecules) in and out of the enzyme. Rather, the primary purpose of WPD-loop motion is positioning of the key catalytic Asp residue into the active site from the side, allowing substrate binding or leaving group departure after the first step to occur from either loop position. But, as highlighted in the kinetic scheme (Scheme 1), only the loop-closed states perform catalysis.
This is unique to the best of our knowledge, and provides a direct linkage between loop dynamics and the chemical steps of catalysis in PTPs. The work reported here is part of our broader efforts to understand factors affecting WPD-loop dynamics in the PTP family. Only the three WPD residues are highly conserved within the ∼12-residues comprising this loop. To explore the role of non-conserved residues in the WPD-loop on catalysis and pH dependency, we have created and characterized a series of loop-swapped chimeras. In a previous report, we described chimeras in which the WPD-loop of PTP1B was exchanged into YopH, which resulted in unexpected and counterintuitive kinetic and structural results.48 Here, we report the characterization of reverse chimeras, based on the transposition of the faster, YopH enzyme loop into the slower enzyme, PTP1B. We began with a chimera consisting of the full YopH WPD-loop transposed into PTP1B, followed by a stepwise mutation back toward the native PTP1B loop sequence. Not all the chimeras proved to be soluble and amenable for study, and we include those findings in the interest of including negative results. For the soluble, active chimeras, enzymatic functions were examined by steady-state kinetics to obtain kcat values, and kinetic isotope effects with the substrate pNPP, which report on transition state details of the first step of catalysis. Degradation in the correct positioning of the Asp residue due to an altered WPD-loop conformation will affect the coordination of leaving group protonation with P–O bond fission in the first step of catalysis, and its role as a general base in the second step.
Enzyme structures and dynamic behavior were characterized by X-ray crystallography, empirical valence bond simulations, and both conventional and enhanced molecular dynamics simulations, the former of which were in turn used to construct Markov state models49–51 with which to compare loop transitions in the different enzyme variants. PTP1B is more tolerant of chimera substitutions than YopH, and these chimeras do not exhibit the structural disruptions found in the YopH-based chimeras.48 The combined results show how the non-catalytic amino acids within this mobile element of classical PTPs affect catalysis, particularly by altering WPD-loop mobility and the equilibrium between open and closed states. More generally, the results highlight the potential for targeting non-catalytic residues as hotspots for manipulating the conformational equilibria of catalytic loops and thus regulating enzyme activity.35,36,52,53
2 Materials and methods
2.1 Chemicals
Dithiothreitol (DTT) and ampicillin (AMP) were purchased from GoldBio. Restriction enzymes and primers were purchased from Integrated DNA Technologies. Protease-inhibitor tablets were purchased from Sigma-Aldrich. All other buffers and reagents were purchased from Sigma-Aldrich or Fisher. The substrate p-nitrophenyl phosphate (pNPP) was synthesized using published methods.24 Crystallography screens, trays, and coverslips were purchased from Hampton Research.2.2 Mutagenesis, expression, and protein purification
The plasmid pEt-19b encoding the 37 kDa form of wild-type human protein PTP1B (residues 1 to 321) was provided by Dr N. K. Tonks. The first chimera, designated Chimera 0, was made by substituting loop residues of wild-type PTP1B via the Q5-SDM kit (New England Biolabs), replacing with residues HVGNWPDQTAVS from the YopH WPD-loop in the corresponding region (Table 1). Chimera 0 was used as the DNA template for the subsequent chimeras. Chimeras 1 to 7 were created using the polymerase chain reaction (PCR) with primers encoding residues before the mutation and the target mutation itself. The chimera DNA was then cleaved using restriction enzyme DpnI and ligated into the pEt-19b vector using T4 ligase. Each subsequent chimera was made using the previous chimera DNA as a template. The primers used are listed in Table S1.†| Enzyme | WPD-loop sequence | Solubility | Activity |
|---|---|---|---|
| a PTP1B residues are shown in red, YopH residues are shown in blue. Residues common to both are shown in black. Chimeras studied in detail in this work are underlined in column 1. The designation “—” in the activity column indicates an insoluble chimera for which activity could not be assessed. | |||

|

|
Soluble | Active |

|

|
Soluble | Active |
| Chimera 0 |

|
Insoluble | — |
| Chimera 1 |

|
Soluble | Inactive |
| Chimera 2 |

|
Insoluble | — |

|

|
Soluble | Active |

|

|
Soluble | Active |
| Chimera 5 |

|
Insoluble | — |
| Chimera 6 |

|
Insoluble | — |

|

|
Soluble | Active |
The DNA was transformed into BL21-DE3 cells and grown overnight at 37 °C on an LB culture plate containing 100 μg mL−1 ampicillin. One colony was selected and placed into 10 mL SOC media containing 100 μg mL−1 ampicillin and grown overnight. The following morning, 1 L LB media containing 100 μg mL−1 ampicillin was inoculated with the 10 mL overnight growth and shaken at 170 rpm at 37 °C until the OD600 reached 0.6–0.8 Abs. After reaching the optimal OD, the 1 L growth was induced by 0.1 mM isopropyl β-D-thiogalactoside (IPTG) and shaken at 170 rpm at room temperature overnight. The cells were harvested by centrifugation at 12![[thin space (1/6-em)]](https://www.rsc.org/images/entities/char_2009.gif) 000g for 30 minutes at 4 °C and stored at −80 °C.
000g for 30 minutes at 4 °C and stored at −80 °C.
All chimeras were expressed and purified as follows, based on the WT PTP1B protocol.54 The cells were thawed on ice and resuspended in 10× their equivalent volume of a lysis buffer, consisting of 50 mM imidazole pH 7.5, 1 mM EDTA, 3 mM DTT, and 10% glycerol with one crushed protease-inhibitor tablet for every 50 mL of solution. The cells were lysed by sonication at 60% power for 10 pulses then mixed on ice for 1 minute and repeated 4–6 times until completely lysed. The cell lysate was centrifuged at 4 °C at 29000g for 30 minutes. The supernatant was filtered with a 0.45 micron syringe filter.
The filtrate was purified via a 5 mL HiTrap™ Q HP column attached above a 5 mL HiTrap™ SP HP column using an FPLC filtration system. Both columns were equilibrated with lysis buffer. The cell lysate was loaded onto the columns at 1.5 mL min−1, and the columns were washed with lysis buffer until the absorbance at 280 nm baselined. Elution was processed using a 100% gradient with elution buffer containing 500 mM NaCl, 50 mM imidazole pH 7.5, 1 mM EDTA, 3 mM DTT, and 10% glycerol. Eluted fractions exhibiting absorbance at 280 nm were collected and tested for phosphatase activity by addition of a few microliters of each fraction to a solution of p-nitrophenylphosphate (pNPP), where an absorption increase at 400 nM indicated formation of p-nitrophenol. Fractions that showed activity were assayed for purity on a 15% SDS-PAGE gel.
The pooled fractions were loaded onto a desalting column and buffer exchanged into S-loading buffer (50 mM Bis–Tris pH 6.5, 1 mM EDTA, 3 mM DTT, and 10% glycerol). This solution was then loaded at 1.5 mL min−1 onto the equilibrated HiTrap™ SP HP column. The column was washed with the loading buffer until Abs280 nm baselined, then eluted with S-elution buffer containing 500 mM NaCl, 50 mM Bis–Tris pH 6.5, 1 mM EDTA, 3 mM DTT, and 10% glycerol. Fractions with absorbance at 280 nm were collected and assayed for activity with pNPP, the fractions that showed activity were checked for purity on a 15% SDS-PAGE gel.
The active fractions were pooled (ranging from 30–40 mL) and concentrated to <12 mL, loaded onto a pre-equilibrated HiLoad 26/60 Superdex 200 prep grade column (GE) and purified using 10 mM Tris buffer pH 7.5, with 25 mM NaCl, 0.2 mM EDTA, and 3 mM DTT. Fractions were assayed with pNPP for activity and for purity on a 15% SDS-PAGE gel. Pure protein was concentrated to 10–35 mg mL−1, and either immediately used for crystallization experiments or diluted with 10% glycerol and frozen with liquid nitrogen and stored in aliquots at −80 °C.
2.3 X-ray crystallography
Crystals for Chimera 3 and Chimera 4 were grown by hanging drop vapor diffusion at 4 °C using 10–15 mg mL−1 protein and a precipitant solution of 0.1 M Tris hydrochloride pH 6.5–8.5, 0.2 M magnesium acetate tetrahydrate, and 20–25% PEG 8000 at a 2:2:0.5 protein:well:20% benzamidine hydrochloride drop ratio. Both the tungstate and vanadate bound structures were obtained by adding either 3.9 mM sodium tungstate (Na2WO4) or 1 mM sodium metavanadate (Na3VO4) to the protein for co-crystallization. Crystals grew in 24 hours and were transferred to a cryo-protectant solution containing mother liquor, 20% benzamidine hydrochloride, and 50% sucrose before flash freezing in liquid nitrogen.
Crystals for Chimera 7 were grown by sitting drop vapor diffusion at 4 °C using 12 mg mL−1 protein. The crystallization drop was prepared by mixing 2 μL of protein solution, 0.5 μL sucrose 30% (w/v) and 3 μL of precipitant solution (0.1 M HEPES pH 7.5, 0.2 M magnesium acetate and 15–20% polyethylene glycol 8000). Single crystals were visible after three days. Cryoprotection was performed by transferring crystals stepwise into stabilization solution with increasing glycerol amounts to a final concentration of 15% and the respective initial concentrations of ligands present in the protein and precipitant solutions, and then flash-cooled in liquid nitrogen.
Diffraction data for Chimeras 3 and 4 were collected on the Stanford Synchrotron Radiation Lightsource (SSRL) beamline 9-2, and diffraction data for Chimera 7 were collected on a home source (Rigaku Micromax 007/Raxis IV++) (Table S2†). Data were indexed and processed using DENZO and SCALEPACK in the HKL2000 program suite.55 Molecular replacement was performed with Phaser-MR56 as implemented in Phenix57 and CCP4 (ref. 55) using WT PTP1B (PDB ID 3I80 (ref. 23)) with active-site water molecules manually removed as a search model. Phenix.refine was used for refinement.58 Model building was performed using Coot.59 All figures of the enzyme structures and structural alignments therein were made using PyMOL (The PyMOL Molecular Graphics System, Version 1.2r3pre, Schrödinger, LLC.).
2.4 Steady-state kinetics
Steady-state kinetic parameters were measured at 25 °C. Concentrated protein aliquots were thawed on ice and diluted with a buffer base mix (BBM) containing 50 mM sodium acetate, 100 mM Tris, and 100 mM Bis–Tris from pH 4.35–7.5. This buffer system maintains constant ionic strength throughout the pH range examined. A 50 mM solution of the dicyclohexylammonium salt of pNPP was prepared in the buffer base mix. Reactions were run on 96-well plates, diluted enzymes were added to reactions with substrate concentrations from 0.76–22.73 mM and allowed to proceed for 10 minutes. The reactions were quenched using 50 μL of 10 M NaOH, and the amount of the product was assayed from the absorption at 400 nm using the molar extinction coefficient of 18300 M−1 cm−1 for p-nitrophenolate. Reaction blanks were made using identical conditions replacing the enzyme with buffer, to correct for non-enzymatic hydrolysis of the substrate. The amount of product released and elapsed time were used to calculate the initial rates. The data were fitted to the Michaelis–Menten equation to obtain steady-state kinetic parameters. Kinetic data were obtained on Chimeras 3, 4, and 7 as a function of pH to obtain pH rate profiles. The bell-shaped pH rate profiles were fitted to eqn (1) and (2) for two ionizable residues, one protonated and the other deprotonated. In eqn (2), KS2 was set to the second ionization constant of the substrate pNPP (pKa = 4.96).60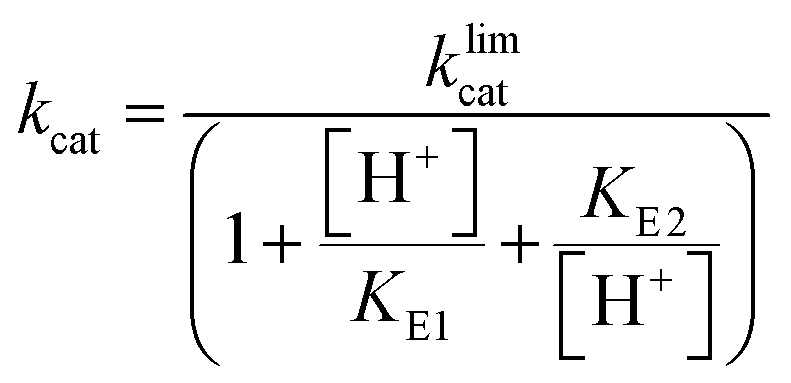 | (1) |
 | (2) |
Magnesium inhibition assays were carried out with pNPP as the substrate using the same methods, using enzyme that was incubated with 0–4.55 mM magnesium acetate on ice for 5 minutes prior to the assay.
2.5 Kinetic isotope effects (KIEs)
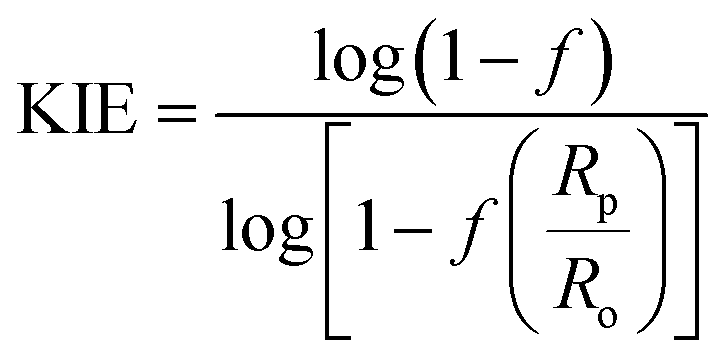
The 18O KIE in the scissile P–O bond and the 15N KIE in the leaving group were measured using the competitive method and isotope ratio mass spectrometry.23,24 Fig. S1† shows the positions in the substrate where KIEs were measured and the isotopic isomers used. KIEs measured by the competitive method are isotope effects on V/K, the part of the mechanism up to the first irreversible step, which is the first step shown in Fig. 1, cleavage of the pNPP substrate.24,26Concentrated protein aliquots were thawed on ice and diluted to 9.26 and 17.45 μM for Chimera 3 and Chimera 4 respectively in reaction with the buffer base mix. Natural abundance pNPP was used for measurements of 15(V/K). 15N, 18O-labeled pNPP used for measurement of 18O isotope effects by the remote label method were synthesized using previously published methods.61 Isotope effect determinations were carried out in triplicate, at 25 °C in 100 mM Bis–Tris at pH 5.5, by adding 200 μL enzyme and 108 micromoles pNPP in 5 mL of buffer and allowed to react until approximately 50% completion, approximately 2–3 hours. The enzymatic reactions were then stopped by titration to pH 4 with HCl, and the p-nitrophenol product extracted using diethyl ether and purified by sublimation. The residual substrate in the aqueous layer was completely hydrolyzed using bovine alkaline phosphatase at pH 9, and the p-nitrophenol released was isolated in the same way. The KIEs were calculated from the nitrogen isotopic ratios in the p-nitrophenol product at partial reaction (Rp), in the residual substrate (Rs), and the starting reactant (Ro). Eqn (3) was used to calculate the observed KIE from Rs and Ro at fraction of reaction f, and eqn (4) from Rp and Ro. These were the same within experimental error and averaged to give the final results.
 | (3) |
 | (4) |
2.6 Molecular dynamics simulations and Markov state model construction
Molecular dynamics (MD) simulations of wild-type (WT) PTP1B as well as the soluble proteins Chimeras 1, 3, 4 and 7, were performed using the Amber 2018 (ref. 62) simulation package. All simulations were performed in the phosphoenzyme intermediate, which represents the reactive species for the rate-determining second chemical step (Fig. 1). NMR dynamics measurements on this species are not feasible due to its transient existence in solution. Simulations were performed for each enzyme starting from both the WPD-loop closed and open conformational states, using the PDB63 structures outlined in Table S3† for each system and state. Simulation starting structures of WT PTP1B were prepared as described previously,29 and Chimeras 1, 3, 4 and 7 were also prepared using the available crystal structures from both this and a previous study64 where possible. For simulations of systems with no available crystal structure, the most closely related (in terms of WPD-loop sequence) crystal structure was modified (through PyMOL mutagenesis) to generate the starting structure (no more than three mutations were required for any system, see Table S3† for further details).All simulations were performed under periodic boundary conditions with octahedral water boxes using the ff14SB65 force field and TIP3P66 water model alongside our previously developed parameters to describe the phosphorylated cysteine.29 Following the equilibration of each system in the NPT ensemble (298 K, 1 atm, see the ESI†), an initial round of production MD simulations of each enzyme in both WPD-loop conformational states were performed of each enzymes for twenty replicas of 1 μs length. Following this, k-means clustering was performed on the Cα RMSD of the WPD-loop of each system to identify 25 unique clusters. The most representative structure from each cluster (centroid) was then subjected to a 400 ns long production MD simulation. This round of sampling in combination with the prior gave rise to 50 μs of aggregated sampling per enzyme, which was used to generate the Markov state models (MSMs). We note that no restraints were used in our production MD simulations (and that the phosphoenzyme intermediate is covalently linked to the enzyme).
MSMs were generated using PyEMMA,67 with the inter- and intra-Cα-atom distances between the WPD- and E-loop residues of each system (for all pairs of residues that were at least 3 residues apart from one another) used as input features. Simulations from all 5 systems (WT PTP1B and all 4 Chimeras) were combined for dimensionality reduction analysis via time-lagged independent component analysis (TICA),68 meaning all systems share the same time-lagged independent components (TICs). At this point each system was analyzed separately, first by clustering each system using the k-means clustering algorithm to produce between 125 and 200 clusters/microstates (depending on the system, see Table S4†). The MSMs generated were then validated by analysis of their implied timescales plots (Fig. S2†), and this was also used to select an appropriate lag-time and number of metastable states for each system.
Lag-times were between 25 and 100 ns whilst the number of metastable states chosen were between 4 and 7, see Table S4.† These parameters were validated by a Chapman–Kolmogorov test for each system (Fig. S3–S7†). Metastable states were identified using the perron-cluster cluster analysis (PCCA+)69 method, as implemented in PyEMMA. The metastable states identified were further discretized by visual inspection to determine if they described a closed, intermediate, or open WPD-loop conformation. These three metastable states (closed, intermediate, or open WPD-loop) were then used to determine the mean first passage times (MFPTs) for each system as implemented in PyEMMA.67 The free energy differences were obtained from the MFPTs by calculating the equilibrium constants from the forward and backward rates (and, from that, ΔG). The error estimates for the ΔG of each state were obtained by calculating the maximum and minimum possible ΔG value (using the errors in the MFPT) and using the largest absolute difference between the calculated average ΔG and these two values.
MD simulation analysis was performed using a combination of CPPTRAJ and PyEMMA.67,70 The WPD-loop (for Cα-atom RMSD calculations) was defined as residues 176–190 of PTP1B. Hydrogen bonds were defined as being present if the donor–acceptor distance was ≤3.5 Å and if the donor-hydrogen-acceptor angle was 180 ± 45°.
2.7 EVB simulations
Following from our prior simulation study of PTP1B and YopH,29 we have performed empirical valence bond (EVB) simulations71 of the rate-limiting hydrolysis step (Fig. 1) catalyzed by Chimeras 1, 3, 4 and 7. All simulation setup, equilibration and EVB simulations were performed using the same setup as in our prior work,29 using the revised parameters provided as ESI† to ref. 29. The starting point for all simulations was crystal structures of each relevant chimera in its respective closed conformation, using the structures summarized in Table S3.†In a few cases, where a side chain was missing in the corresponding crystal structures, it was built using another chimera as a template. The phosphoenzyme intermediate and nucleophilic water molecule were constructed/placed manually into the active site in order to optimize the position of the water molecule for nucleophilic attack on the phosphate. In Chimera 3, the catalytic aspartic was found in the crystal structure in an unproductive conformation and thus was rotated into a productive conformation taking the highest probability rotamer from the Dynameomics rotamer library72 (probability 0.66, top-ranked out of 9 possible rotamers) as implemented in UCSF Chimera, v. 1.14.73 In addition, the side chain of Gln261 was rotated to match the rotamer found in PDB ID 3I80,23 which is the conformation it is expected to take during the hydrolytic step of catalysis.
A complete list of all ionized residues and histidine protonation patterns for each system can be found in the ESI (Table S5).† Empirical valence bond (EVB)71 calculations performed using the Q6 simulation package74 and the OPLS-AA75 force field, for consistency with our previous work.29 Each reaction step/system was simulated for 30 replicas, using an initial 30 ns of equilibration starting from the approximate transition state (λ = 0.5, Fig. S8†). Production simulations were then propagated downhill from the transition state using 51 mapping windows in total, each with a simulation time of 200 ps. Simulation analysis was performed using CPPTRAJ.70
3 Results and discussion
The presence of a key catalytic residue on the WPD-loops of classic PTPs provides a direct link between loop motion and chemistry, and previous results have shown a correlation between WPD-loop dynamics and catalysis in YopH and PTP1B.20,29,33 Enzymes in the PTP family have variable residues within this mobile loop except for the WPD-residues themselves (Fig. S9†). A suggestive hypothesis is that the identity of the intervening residues affects loop dynamics, and thus the catalytic rate, by altering hydrogen bonding interactions. Changes in populations of catalytically functional and nonfunctional states can also alter pH-rate dependencies, protonic equilibria, and the relative contribution of individual steps to the rate across the pH range.20One goal of this study was to ascertain whether a WPD loop can be transposed intact into a related PTP and bring with it the rate and pH dependency of its source. If so, exchanging the YopH WPD-loop into PTP1B should confer a faster rate and altered pH dependency. Or, if interactions with neighboring regions of the protein are important, such a chimera might differ from either parent. In this study, the initial Chimera 0 with the YopH WPD-loop residues transposed into PTP1B was systematically restored to the native PTP1B.
3.1 Chimera construction
Table 1 shows which residues were initially swapped from YopH and their mutation back to native PTP1B residues in subsequent chimeras; the active site hydrogen bonding patterns in wild-type PTP1B are shown in Fig. 2. In the initial chimera construct, designated Chimera 0, eleven residues in the PTP1B WPD-loop region were swapped for the corresponding residues from YopH. This protein was insoluble, potentially due to unfavorable interactions involving the hydrophobic sidechain of Val176. The corresponding residue in native PTP1B is Tyr176, whose hydroxyl group forms a hydrogen bond with the sidechain of Ser190. Val176 was restored to Tyr as is native in PTP1B, yielding Chimera 1, which was soluble but inactive. Some of the subsequent chimeras were insoluble, for reasons that are not evident, and were not characterized. Chimeras 3, 4 and 7 were soluble, catalytically active, and were kinetically and structurally characterized. These chimeras have 5, 4 and 1 amino acid substitutions, respectively, as shown in Table 1. The final Chimera 7 carries a single amino acid substitution F182Q. This residue is adjacent to the general acid; previous work has hypothesized that the reorientation of the peptide bond joining these residues affects the energy barrier for loop movement.76,77 | ||
| Fig. 2 Active site hydrogen bonding differences between (A) ligand-free (PDB ID 2CM2 (ref. 78)) and (B) ligand-bound (PDB ID 3I80 (ref. 23)) WT PTP1B. The WPD-loop is shown in orange, and the phosphate-binding P-loop is shown in green. The sidechain conformation of E186 changes between the open and closed forms of the WPD-loop. | ||
3.2 Chimera crystallographic differences from WT parents
Fig. 3 shows the P-loops and WPD-loops of Chimeras 3, 4 and 7 alongside those of native PTB1B and YopH. In their vanadate complexes, the WPD-loops of Chimeras 3 and 4 are in the closed conformation and are highly superimposable with WT PTP1B. Unlike the extended α-helix and hyper-open loop position observed in chimeras of YopH,48 Chimeras 3, 4 and 7 maintained structural integrity, further confirming that PTP1B is more tolerant to mutations than YopH.79 | ||
| Fig. 3 Structural differences in chimeras compared to parent enzymes. WT PTP1B and YopH structures are shown in panels (A), (C) and (E), while Chimera 3, 4, and 7 structures are shown in panels (B), (D) and (F). WT PTP1B is colored in orange, WT YopH in dark green, Chimera 3 in blue, Chimera 4 in tan, and Chimera 7 in light green. (A) PTP1B and YopH have very similar active site secondary structures, except for the loop structure containing K116 in PTP1B that is absent in YopH. (B) Chimeras 3, 4, and 7 have retained structural integrity in the active site relative to the parents; however, unlike the parent enzymes, the ligand-free form of Chimera 3, but not 4, indicates a shift to a more thermodynamically favorable closed conformation of the WPD loop. The loop of Chimera 7 is also closed, but, as discussed in the text, this likely results from the presence of a molecule of HEPES buffer in the active site. (C and D) Structures of WT PTP1B and YopH, as well as Chimeras 3, 4 and 7, in complex with VO4 revealed the formation of transition state analogs (TSAs) for the second hydrolysis step (Fig. 1). These TSAs possess a trigonal bipyramidal geometry, in which the active site cysteine is one of the apical ligands. The similarity of these transition state analogs shows the chimeras are able to assume analogous conformations to those of the parents to stabilize the associated transition states. (E and F) A comparison of WO4-bound structures of (E) WT PTP1B and YopH and (F) Chimeras 3 and 4 show a different sidechain conformation of Asp181 than the corresponding residue in native YopH. The sidechain of K116 and the presence of a magnesium ion is suspected to direct the Asp carboxylate away from the active site in the chimera structures. | ||
The crystal structure of Chimera 7 showed the presence of a HEPES molecule from the crystallization buffer at the active site (Fig. S10†). The sulfonyl group makes hydrogen bonds to P-loop residues and to Arg221, analogous to those of a phosphate ester substrate, and the WPD-loop is in the closed conformation. The alkyl ring of the HEPES molecule is in a position that would clash with the side chain of F182 in native PTP1B. Other details of HEPES interactions are shown and discussed in the ESI.†
This led us to consider the possibility that these chimeras might exhibit inhibition by Mg2+, in contrast with the accelerating effect of Mg2+ion for WT PTP1B.81 The interaction of Asp181 with Mg2+ ion is not seen in WT PTP1B tungstate-bound structure, nor with the corresponding Asp356 in tungstate-bound YopH.16 To assess whether this unproductive conformation of Asp181 occurs in solution, and whether the presence of magnesium ion contributes to its population, kinetic data were collected on Chimera 4 in the presence of Mg2+ and showed an inhibitory effect (Fig. S11†). The inhibition data were fitted to the competitive, uncompetitive, and mixed inhibition models. The mixed inhibition model gave the best fit results and yielded a Ki value of 4.8 ± 0.2 mM. The structural data explain why this nonproductive conformation is unique to the chimeras. In WT YopH, the Lys loop providing one of the Mg2+-coordinating residues is absent, and no other residue is in close proximity for hydrogen bonding with this nonproductive conformation of Asp181. In WT PTP1B, residue 182 is phenylalanine, which lacks a hydrogen bond acceptor for this conformation of the Asp sidechain. Hence, the network for coordinating a magnesium ion can only occur in the chimeras. Only Chimera 4 was tested, but Mg2+ inhibition is expected in both Chimeras 3 and 4 based on their structural data. This is another example of how changes to residues in the WPD-loop that are not directly catalytic can indirectly affect catalytic characteristics with potential regulatory consequences.
3.3 Catalytic characteristics of the chimeras
Chimeras 3, 4 and 7 are slower than either of the parent enzymes, but all exhibit the bell-shaped pH-rate profile characteristic of the PTP family22 (Fig. 4). In Table 2, the pH optima and kinetic constants for the chimeras are compared with their parent enzymes, and with the most active YopH-based chimera from a previous investigation.48 The Chimera 3 and 4 turnover rates (kcat) differ by approximately 10-fold despite differing by a single residue in position 177 (Table 1). The residue at this position was recently shown to affect the conformational dynamics of native PTP1B, causing a population shift towards the catalytically-active closed conformation of the WPD loop even in the ligand-free form of the enzyme.31 Chimera 7 (the F182Q point mutant) is about an order of magnitude slower than WT PTP1B in kcat, with no shift in the pH optimum but a broader maximum. | ||
| Fig. 4 The pH rate profiles for WT PTP1B, WT YopH, and Chimeras 3, 4 and 7. Retained bell-shaped profiles for the chimeras imply maintained general acid catalysis and therefore functional WPD-loop closure. Note the logarithmic scale on the y-axis. Kinetic data for the PTP1B chimeras and WT enzyme were all obtained from thawed aliquots of protein that had been frozen and stored under the conditions described in Materials and methods. | ||
| Enzyme | pH optimum | k limcat (s−1) | K M (mM) | k cat/KlimM (mM−1 s−1) | Reference |
|---|---|---|---|---|---|
| a The kcat and kcat/KM numbers are the limiting values obtained from eqn (1) and (2). KM values are obtained at the pH optimum for each enzyme. | |||||
| PTP1B | 5.5 | 24.4 ± 0.4 | 0.58 ± 0.01 | 37.7 ± 1.9 | 23 |
| YopH | 5.5 | 750 ± 25 | 0.98 ± 0.11 | 735 | 48 |
| YopH Chimera 3 | 5.5 | 5.10 | 5.69 | 0.90 | 48 |
| Chimera 3 | 6.0 | 1.8 ± 0.1 | 6.9 ± 2.0 | 0.26 ± 0.02 | This work |
| Chimera 4 | 5.5 | 15.4 ± 0.8 | 8.7 ± 3.2 | 5.54 ± 0.77 | This work |
| Chimera 7 | 5.5 | 2.5 ± 0.4 | 0.39 ± 0.02 | 11.4 ± 4.0 | This work |
The kinetic pKa values obtained from fits of the pH-rate data using eqn (1) reflect the nucleophilic Cys215 (pKa1), and the general acid, Asp181 (pKa2). The kinetic pKa values for the Cys residues in both native enzymes (5.1 in PTP1B, 4.6 in YopH, Table S6†) are reduced from that of cysteine in solution by a hydrogen bonding network that stabilizes the thiolate anion.82 The kinetic pKa values of the aspartic acid in PTPs are less perturbed from the solution value. The kinetic pKa values of the chimeras differ from those of the WT parent PTP1B (Table S6†), particularly for the aspartic acid. Several factors can cause kinetic pKa values extracted from pH-rate data to be distorted from the true thermodynamic pKa values of ionizable catalytic residues.83 Because WPD-loop motions correlate with catalysis in PTP1B and YopH, mutations that affect loop motion may not only affect the rates of the chemical steps, but also change the degree to which particular steps are rate-limiting within the pH range examined, leading to changes in pH-rate profiles such as those observed. The modest changes in the kinetic pKa values of the Cys residue in the chimeras are most likely due to such effects. The greater differences in the D181 data (Table S6†) arise from differences in the hydrogen bonding network to D181, due to changes within the grafted loop that affect its thermodynamic pKa. The results here are consistent with the notion that differences in the loop residues and the altered hydrogen bonding patterns affect loop dynamics, and thereby alter the pH profile in ways that include broadening or moving the pH optimum. This provides an explanation for the fact that the broadness/narrowness and the optima of pH-rate profiles within the PTP family vary despite conservation of their ionizable catalytic residues.
3.4 Kinetic isotope effects
Loop closure is necessary for general acid catalysis, and the pH-rate profiles indicate the chimeras retain this function. The 18O kinetic isotope effect (KIE) in the scissile P–O bond and the 15N KIE in the leaving group provide more detail on the positioning of the general acid/base residue D181 in the closed loop. A loop that is closed but with a less optimal positioning of Asp181 than in the WT would affect both steps: in the first, by disrupting the synchronicity of protonation with P–O bond fission; and in the second, where the Asp carboxylate acts as a general base. The KIEs reflect the extent of leaving group protonation in the transition state of the first chemical step, i.e. aryl phosphate cleavage.The 15N isotope effect detects charge delocalization into the aryl ring, assessing the synchronization of protonation with P–O bond fission. The major contribution to the 18O KIE is the extent of P–O bond fission, but is also affected by protonation of the oxygen. In native PTP1B and YopH reactions, the 15N KIEs are unity, within experimental error, reflecting full neutralization of the leaving group with protonation synchronized with P–O bond fission. Some native PTP family members, including DSPs that utilize the same active site, catalytic machinery, and mechanism, exhibit small normal 15N KIEs indicating a partial charge on the leaving group in the transition state, which would arise if the extent of proton transfer lags slightly behind P–O bond fission (Table 3). Some PTPs with very similar kcat values show 15N KIEs of unity, while others have small normal 15N KIEs. In other words, small normal values are not indicative of a failure of general acid catalysis, only that protonation lags behind P–O bond fission in the transition state. Loss of general acid catalysis (as seen in D to N mutants, Table 3) produces larger 15N KIEs of approximately 1.0030, indicative of a nearly full negative charge on the leaving group in the transition state.84
| Enzyme | 15(V/K) | 18(V/K)bridge | Reference |
|---|---|---|---|
| a The range of KIEs is provided for a broader set of enzymes in the PTP superfamily including dual-specificity phosphatases; the specific enzymes are given in the reference indicated. The values in parenthesis are the standard errors in the last decimal place. The D to N mutant entries show how the isotope effects are affected when general acid catalysis is lost. | |||
| PTP1B | 1.0004(2) | 1.0121(9) | 23 |
| YopH | 0.9999(3) | 1.0152(6) | 24 |
| Range of WT PTPs | 0.9999–1.0013 | 1.0118–1.0152 | 84 |
| D to N mutants | 1.0024–1.0030 | 1.0275–1.0297 | 84 |
| Chimera 3 | 1.0001(5) | 1.0138(8) | This work |
| Chimera 4 | 1.0011(6) | 1.0129(25) | This work |
| Chimera 7 | 1.0004(1) | 1.0146(5) | This work |
The KIEs for the chimeras are within the bounds of past results from WT PTPs,84 indicating a functional general acid, consistent with the retention of the basic limbs of their pH-rate profiles. The synchronicity of leaving group protonation with P–O bond fission, although slightly variable among the chimeras, remains within the range of values seen among native PTPs. The extent of P–O bond fission in the transition state is not significantly different in the chimeras and WT enzymes. It can be concluded that the chimeras' lower catalytic rates relative to their parent enzymes do not result from an altered transition state or loss function of the Asp181 residue. Taken together, this is consistent with the structural data that shows the chimeras are able to adopt a normal, catalytically active WPD-loop closed conformation, although they have altered open-closed equilibria and thermodynamics.
Computational analysis of the reaction energetics by EVB calculations, and molecular dynamics to compare conformational differences between the chimeras, provided insight into the origins of the experimental observations.
3.5 Empirical valence bond analysis
Fig. 5, S12, Tables S7 and S8† show a summary of experimental and calculated free energies for the rate-limiting hydrolysis of the phosphocysteine intermediate (Fig. 1) by PTP1B, YopH and each of Chimeras 1, 3, 4 and 7, obtained from EVB calculations, as well as the corresponding electrostatic contributions to the calculated activation free energies. Fig. S13 and Table S9† show the structures of representative stationary points from calculations for each chimera, as well as key distances at each stationary point. From this data, it can be seen that all chimeras are less active than the parent enzymes, although, similarly to our prior work, the changes in the calculated values are not large enough to account for the larger observed changes in kcat (Table 2), further indicating the putative importance of dynamical effects, as in our study of the two parent enzymes.29 In particular, of the residues identified from our EVB simulations as having larger differences in their electrostatic contributions to catalysis (Fig. 5B), R112, E115, K116 and K120 are all residues found on the E-loop. As in our prior computational work, the calculated transition states for each system are very similar; however, as can be seen from Fig. 5B, there are in particular differences in the electrostatic contributions from the side chains of K120 and F182/Q182, as well as the side chain of E115. We note the presence of additional residues, such as S216, G218 and S222 on the P-loop, that provide notable contributions to TS stabilization, with similar contributions to catalysis across the WT and chimeras (irrespective of substitutions on the WPD-loop, see Fig. S12†).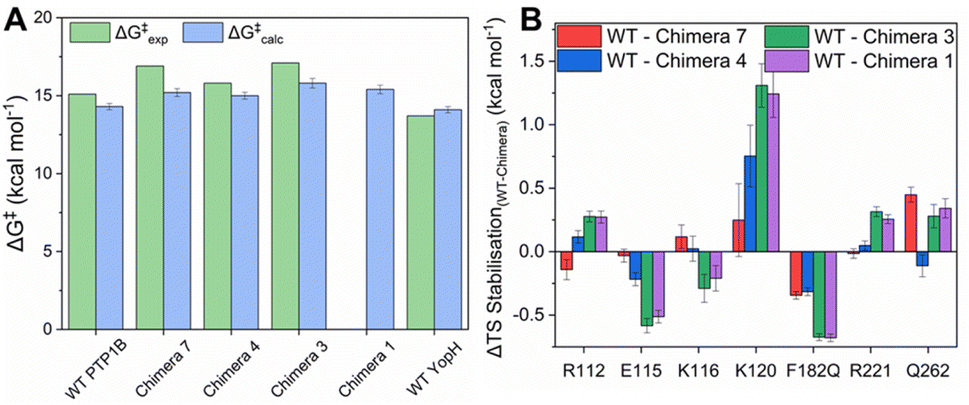 | ||
| Fig. 5 (A) Experimental and calculated reaction free energies for WT PTP1B and YopH and the four chimeras studied in this manuscript. Experimental values are obtained from the kcat values whilst calculated values are obtained from our EVB simulations of the hydrolysis reaction (see the Materials and methods). Errors for the calculated values are the standard errors of the mean from 30 EVB replicas per system. (B) The largest per residue differences in electrostatic contributions to transition state (TS) stabilization (difference between the residue contribution in each chimera relative to WT PTP1B) as determined by our EVB calculations. The absolute values of all significant (>0.1 kcal mol−1) side chain contributions to TS stabilization can be found in Fig. S12 and Table S8.† | ||
We note here that the EVB approach is an extensively validated approach for studying chemical reactivity in enzymatic systems, and a well-calibrated EVB potential typically provides activation free energies within 1–2 kcal mol−1 from experimental values across enzyme (variants).85,86 Our group has substantial experience of applying this approach to a range of phosphotransferases,87–91 including PTP1B and YopH,29 and the fact that we obtain lower activation free energies than would be expected from the changes in turnover number is unlikely to be a computational artefact of model parameterization. Taken together, this further emphasizes that the contribution of the E-loop to catalysis is both dynamic and electrostatic,29 and that factors such as WPD-loop sequence that alter E-loop dynamics also alter the electrostatic contributions of key E-loop residues, thus impacting activity.
3.6 Molecular dynamics
Molecular dynamics simulations provide insight into how the conformational dynamics of the WPD-loops in the chimeras differ from the WT enzymes, and to the origins of their slower catalytic rates. The simulations (Fig. 6, 7 and S14–S17†) indicate specific differences in WPD-loop flexibility and related interaction networks, that could account for the observed changes in the experimental pH rate profiles. Generally speaking, our simulations indicate that the more mutations that are accumulated on the WPD-loop the less stable the open WPD-loop conformation becomes. This is in alignment with our EVB simulations, performed on the WPD-loop closed state, which indicate that the more mutations are accumulated on the WPD-loop, the more stable the closed conformations become (Fig. S8†). The changes in stability of the open state are especially visible in the case of going from Chimera 7 to Chimera 4 and again when going from Chimera 4 to 3 (which differ only by the point mutation T177G), where a relatively large reduction in stability of the open WPD-loop was observed. Simulation data indicate that destabilization of the open WPD-loop conformation (relative to WT PTP1B) of Chimera 3 is responsible for the experimentally observed crystal structure in which the ligand-free form of Chimera 3 was observed in the closed WPD-loop state, consistent with the crystal structures. | ||
| Fig. 6 (A–E) Free energy landscapes for each enzyme projected from the first two time-lagged independent components (TICs), which describe the slowest motions of the WPD-loop and E-loop residues (all enzymes are projected on the same TICs). The centroid of the clusters determined from our Markov state models (MSMs) are indicated on each plot with Cx and Ox referring to a closed and open WPD-loop conformation respectively, and Intx for an intermediate between the closed and open states. (F) Representative structures of the 7 clusters identified from the MSM generated for WT PTP1B, with structures colored according to whether they belong to the closed, open or an intermediate WPD-loop conformational state. The P-loop is colored in yellow for reference. | ||
 | ||
| Fig. 7 (Left panels) color mapping of the differences (WT–chimera) in the calculated per residue Cα RMSF (ΔRMSF) for the simulations of the closed WPD-loop. Color mapping was performed from blue (positive ΔRMSF) through to white (0 ΔRMSF) to red (negative ΔRMSF). In practice, a blue residue would mean increased rigidity for the given chimera over WT PTP1B and vice versa (see Fig. S16† for this data in graphical form). Note, however, that the differences observed in simulations initiated from the closed conformation, shown here, are far more subtle than those observed in simulations initiated from the open conformation of the WPD-loop, shown in Fig. S14 and S15.† (Right panels) differences in the hydrogen bonding network between WT PTP1B and each chimera for simulations of the closed WPD-loop conformation. Hydrogen bonds with a higher occupancy in the WT are shown as black cylinders between the donor and acceptor atoms, with red cylinders used to indicate H-bonding interactions which have a higher occupancy in a given chimera. The width of the dash indicates the magnitude of the difference in the occupancy of the hydrogen bond between the two enzymes. The P-, Q- and E-loops are colored green, magenta, and orange respectively, with the WT PTP1B WPD-loop colored cyan and the chimera WPD-loops colored yellow. | ||
Focusing first on Chimera 7, our ΔRMSF data from our MD simulations demonstrate the flexibility/rigidity of the WPD-loops of Chimera 7 and WT PTP1B to be highly similar in their open conformations (Fig. S15†). Likewise, our H-bonding analysis only identifies one major difference, which is the newly formed hydrogen bond (H-bond) between F182Q and D181 in Chimera 7. This new H-bond does not appear to notably alter the conformational dynamics or protein interaction network in PTP1B, however given its direct interaction with the catalytic acid/base, it may have an important electrostatic effect on both chemical steps of catalysis, as also suggested from our EVB simulations (Fig. 5B). Chemical intuition would suggest that mutation to glutamine would increase the acidity of the catalytic aspartic acid by placing more negative change on the acid's oxygen atoms through a side chain H-bond. This would be expected to have a beneficial effect on the rate of the first step in which the WPD-loop acts as an acid. However, in the second (rate-limiting) step where the WPD-loop acts as a base, the decreased basicity on the aspartic acids' oxygen due to mutation of the adjacent residue to glutamine could ultimately result in an increased activation free energy, which would explain the decreased kcat values observed for Chimera 7 compared to the WT PTP1B. Indeed, our EVB simulations (Fig. 5A and Table S7†) suggest the activation free energy for the hydrolysis step catalyzed by Chimera 7 is increased by ∼1 kcal mol−1 compared to the corresponding reaction catalyzed by wild-type PTP1B and YopH.
Our simulation data do not reveal why Chimera 1 is catalytically inactive, as the closed WPD-loop is predicted to be substantially more stable than the open WPD-loop conformation (Table 4). Furthermore, were the WPD-loop able to close normally, our EVB simulations predict the hydrolysis step of catalysis catalyzed by Chimera 1 to have a similar activation free energy to that of other Chimeras modeled here (Fig. 5A and Table S7†). It is possible, however, that the WPD-loop of Chimera 1 can adopt another conformation that is more favorable than the closed WPD-loop conformation (that is separated by a reasonably large energetic barrier), which would preclude it from being able to attain a catalytically competent loop-closed conformation.
| Enzyme | Mean free passage time (μs) | ΔG (closed–open) (kcal mol−1) | |
|---|---|---|---|
| Closed → open | Open → closed | ||
| a Errors for the MFPTs are the standard deviations obtained from the Bayesian calculation. Free energy differences were obtained by calculating the equilibrium constants from the MFPTs with errors calculated by propagating the errors in the MFPTs to the free energy calculations and taking the largest possible difference (see the Materials and methods). b The MFPTs for Chimera 1 could not be reliably determined as the WPD-loop open state has too small a population for a cluster center to be placed there. | |||
| WT PTP1B | 1.6 ± 0.1 | 0.7 ± 0.02 | −0.5 ± 0.1 |
| Chimera 7 | 9.7 ± 0.9 | 1.1 ± 0.3 | −1.3 ± 0.2 |
| Chimera 4 | 171.6 ± 31.7 | 0.9 ± 0.1 | −3.1 ± 0.2 |
| Chimera 3 | 48.6 ± 8.3 | 0.3 ± 0.01 | −3.0 ± 0.1 |
| Chimera 1b | N.D. | N.D. | N.D. |
3.7 Markov State Models of WPD- and E-loop sampling
Molecular dynamics (MD) simulations (50 μs of accumulated sampling per system) were used to generate Markov State Models (MSMs) describing how the conformational sampling of the WPD-loop is altered for each chimera. The MD simulations were performed at the phosphocysteine intermediate (the starting point for the rate-limiting hydrolysis step of the reaction, Fig. 1); we note that WPD-loop closure is essential for correct positioning of the catalytic aspartic acid (Fig. 1) in the active site, therefore conformational fluctuations of the WPD-loop at this intermediate have the potential to adversely affect turnover. MSMs for each system were constructed using the Cα-atom distances of the WPD-loop and neighboring E-loop residues. The E-loop residues were included due to the importance of the “correct” sampling of several E-loop residues to provide transition state stabilization to WT-PTP1B.29MSMs for each system are shown in Fig. 6, with the free energy landscapes (FELs) of each system described by the first two time-lagged independent components (TICs), which represent the slowest motions of the systems (see the Materials and methods). We note that the TICs used to describe each system are identical (i.e., TIC1 in WT-PTP1B is identical to that of TIC1 in all the chimeras). TIC1 describes the transition between the closed and open WPD-loop states (and vice versa), with more negative values corresponding to a more closed WPD-loop conformation, whereas TIC2 primarily describes the relative positioning of the N-terminal and central portions of the WPD-loop as well as the E-loop conformations.
Analysis of the FELs of WT-PTP1B and Chimera 7 (which differ only by the F182Q substitution, see Table 1) appear highly similar, suggesting no substantial change in the conformational sampling of the WPD-loop has occurred as result of this mutation. In contrast, a clear population shift towards the WPD-loop closed state can be seen for Chimeras 4, 3 and 1. While the population difference between the closed and open states of WT PTP1B and Chimera 7 is estimated to be ∼1 kcal mol−1 in favor of the closed state, this increases by approximately 2 kcal mol−1 to ∼3 kcal mol−1 for both Chimeras 4 and 3 and even further in the case of Chimera 1 (see Fig. 6 and Table 4, in the case of Chimera 1 the loop open state was barely sampled in our simulations).
Analysis of the WPD-loop conformation over the course of our MD trajectories which started from either the closed or open conformation show this population shift is driven by a destabilization of the open WPD-loop conformation in Chimeras 4, 3 and 1 (Fig. S14†). This is evidenced by the fact that many replicas of Chimeras 4, 3 and 1 which began in the open conformation transition to the closed conformation over the course of the simulation. In contrast, this is a much rarer event for WT PTP1B and Chimera 7. Finally, the FELs shown in Fig. 6 all show a clear pattern for the WPD-loop closing and opening processes, which is that as the WPD-loop opens (left to right along TIC1), the value of TIC2 first decreases before again increasing, meaning the E-loop must first move away from the WPD-loop in order for the WPD-loop conformational transition to occur.
3.8 Alterations in the active site environment across the chimeras
Changes in active site environment between the closed and open WPD-loop states of WT PTP1B and the chimeras were analyzed by determining the flexibility of the active site residues across the different enzymes. The Cα-atom root mean squared fluctuations (RMSF) of these residues are shown in Fig. 7 and S15–S17.† To relate any identified ΔRMSF values to changes in the protein interaction network, we also calculated how the hydrogen bonding (H-bonding) network differed for WT PTP1B to each chimera.Focusing first on changes in the closed WPD-loop conformation for each chimera as compared to the WT (Fig. 7); the ΔRMSF values between WT PTP1B and Chimera 7 which differ from one another by a single point mutation (F182Q) are highly similar with the exception of the E-loop. The H-bonding analysis identifies a newly formed hydrogen bond (H-bond) between the side chains of F182Q and D181 in Chimera 7 (Fig. 7) and a reduction in the occupancy of the H-bonds between D181 to R221 (on the P-loop) and K120 (on the E-loop), which may have therefore altered the stability of the E-loop. For Chimeras 1, 3 and 4, however, there are differences in the rigidity of several regions around the WPD-loop as well as the WPD-loop itself, including the E-loop, loop 11 and the N-terminal section of the α7-helix (Fig. 7). Both loop 11 and α7-helix are known parts of the PTP1B allosteric network that regulates the WPD-loop conformation,30,32 suggesting the mutations present in these chimeras have also impacted this allosteric network. The new intra WPD-loop H-bond between G183T and P180 is likely partially responsible for this rigidification alongside the new side chain H-bond between T178N and T177 (Fig. 7).
Chimeras 3 and 4 differ only in the identity of residue 177 (G from YopH in Chimera 3; T from PTP1B in Chimera 4). We have recently studied the impact of the single point mutation T177G on wild-type PTP1B.20 This mutation was observed to induce a population shift towards the closed state through a combination of interactions that stabilize the closed conformation and destabilize the open conformation of the loop. This mutation appears to exert the same population shift effect as seen in wild-type PTP1B vs. T177G-PTP1B and in Chimera 3 vs. Chimera 4. This mutation increases the flexibility of both the N-terminal portion of the WPD-loop and the nearby loop 11 (Fig. 7). This is likely due both to the nature of the mutation (to glycine) and the loss of the stabilizing side chain H-bond present on T177 Chimera 4 to the backbone of the loop 11 residue Y152. Chimeras 1 and 3 are separated by only two point mutations, P185V and E186S located on the C-terminal portion of the WPD-loop. These mutations do not appear to have notably impacted either the rigidity or H-bonding networks present in both enzymes.
This important role of residue 177 is depicted in Fig. S18.† In Chimera 4, the sidechain of Thr177 forms a 2.9 Å hydrogen bond with the backbone carbonyl of Tyr152 in the loop-closed conformation. This interaction is absent in Chimera 3, which has glycine at this position. Backbone shifts were only seen in the WPD-loop region (from Asn178 to Pro188); compared to Chimera 4, Pro180 in Chimera 3 was shifted 3.4 Å towards the P-loop, and the catalytic Asp181 was brought in 5.5 Å closer. The one-residue-difference between these two chimeras showed almost no discrepancy in ligand-free secondary structures besides the WPD-loop; and besides residue 177, the rest of the hydrogen bonding pattern in the active site has no observable change. The loss of this hydrogen bond could affect loop dynamics. It was recently shown that mutation of residue 177 to alanine shifts the equilibrium of the WPD-loop in favor of the closed conformation.31 That is consistent with the finding that Chimera 3, with glycine rather than the native threonine in this position, adopts a loop-closed conformation even in ligand-free crystal structures.
Fig. S15† shows analysis of the analogous flexibility and H-bonding networks of the open WPD-loop conformation. Excluding the E-loop, Chimera 7 and WT PTP1B have highly similar RMSFs in the open WPD-loop conformation and their H-bonding interaction networks are virtually identical (Fig. S15†). Given the single point mutation separating the two enzymes (F182Q) points out to solvent in this conformation, these results are perhaps unsurprising. Significant differences in both the flexibility and hydrogen bonding network were observed for Chimeras 1, 3 and 4, and these changes were not just limited to the WPD-loop, but also some surrounding regions, most notably the E-loop and loop 11 compared to WT PTP1B (Fig. 6 and S14†). The similar stability observed for the WPD-loop across the WT and chimeras is likely an artifact of the measurement process, in which only frames with a WPD-loop RMSD ≤ 1.5 Å to the open crystal structure conformation was taken forward for the RMSF calculations (Fig. S15†). Analysis of the differences in the H-bonding networks of these chimeras to WT PTP1B (Fig. S15†) suggest the mutation G183T (present in Chimeras 1, 3 and 4) is primarily responsible for altering the stability of these regions through a new hydrogen bond between the side chain alcohol of G183T to D265. This appears to “pull” the WPD-loop, E-loop and loop 11 apart, substantially weakening many key interactions (relative to WT PTP1B) between these loops (Fig. S15†), thereby increasing their observed flexibility, and likely giving rise to the overall reduced stability of this conformation as seen in our Markov state models (Fig. 6 and Table 4).
The sensitivity of the E-loop to changes in the WPD-loop is consistent with a recent NMR study32 and our recent work29 in which we identified that the dynamics of these loops were correlated with one another. Likewise, loop 11 is part of a previously characterized allosteric network28 which modulates the WPD-loop conformation. Moving from Chimera 4 to Chimera 3, we observe further destabilization of both the WPD- and E-loop, and in particular at the N-terminal portion of the WPD-loop. Given the nature and location of the mutation that separates Chimeras 4 and 3 (T177G, located at the N-terminus of the WPD-loop) it is perhaps not surprising to see this effect. Finally, differences in stability are observed between Chimera 3 and Chimera 1 and are located towards loop 11 and the α7-helix. It is unclear from the H-bond networks how these two mutations (P185V and E186S) that separate Chimera 3 and Chimera 1 have resulted in altered stabilities at loop 11 and the α7-helix, these changes may be due to alterations in a different type of non-covalent interaction(s).
4 Conclusions
The presence of a key catalytic residue on the WPD-loop makes the connections between loop sequence and its dynamics (and therefore catalysis) particularly important in the PTP family. Although the WPD-loop backbones in the open and closed conformations of YopH and PTP1B are highly superimposable in crystal structures, our results show that the WPD-loops are not simple transposable elements. The sequence variation within the WPD-loops of various PTPs is a source of variations observed in the pH dependency and maximal catalysis rates in this enzyme family. The “information” that programs their loop dynamics is not contained within their sequences alone. The exchange of the WPD-loop from the faster YopH enzyme into the corresponding loop of PTP1B does not result in a faster enzyme; all the PTP1B chimeras exhibited slower rates than either WT parent (Table 2).The kinetics and KIE data indicate that their reduced catalytic rates compared to the parent enzymes, and differences between the chimeras themselves, do not arise from changes in the mechanism or to the rate-determining step of catalysis. Even moderate differences in WPD-loop sequence between the chimeras and native PTP1B result in significant effects on their kinetics and computed molecular dynamics. Residue 177, in particular, plays an important role in controlling loop dynamics and catalytic rate via a crucial hydrogen bond,20 that causes a population shift from a preferentially open to a preferentially closed conformation of the WPD-loop in even the unliganded form of the enzyme. The chimera loops also differ in their stability and rigidity. The most stable open WPD-loops are found in WT and Chimera 7. The loops in WT and Chimera 7 are also the most similar in rigidity in both open and closed states. The open-loop conformations in the other chimeras were less stable, resulting in more frequent transitions to the closed conformation. Chimeras 1, 3, and 4 also have differences in rigidity of not only the WPD-loop, but in their E-loop and in loop 11. The motions in the WPD and E-loops are likely coupled, as previously found in the native enzymes.29
Molecular dynamics calculations find that while the closed loops in the chimeras have similar stability, the conformational space sampled by the open loops differ between these systems, and exhibit multiple conformationally distinct metastable open states. Because only the closed state is catalytically competent, sampling between these open states, and between the open and closed state, affects catalytic turnover, as was similarly observed, for instance, in prior work on TIM-barrel proteins.92,93 By influencing the population of catalytically competent enzyme–substrate complexes, the pH profile of catalysis can be affected, as well as the maximum rate. Thus, variations in sequence of noncatalytic residues within the WPD-loop provides a means for nature to fine tune these enzymes, and likely contributes to the variation in rate and pH-dependency (broad versus narrow) in the PTP family despite strict conservation of the ionizable residues directly involved in the chemical steps. In another example, the change of the residue following the general acid from phenylalanine to glycine, the residue found in this position in WT YopH, switches the effect of Mg2+ from an activator to an inhibitor.
Finally, we demonstrate that although the WPD-loop may appear to be a simple decorating loop that positions a key catalytic residue, in fact, changes in one part of the protein (substitutions on this loop) affect dynamics of other parts of the protein (e.g. the coupled dynamics of the E-loop and loop 11). The impact of these altered dynamics on the catalytic activity of the chimeras was measured through our EVB calculations, in which the electrostatic contributions of many non-WPD-loop residues to transition state stabilization were notably altered as a result of the mutations. The key role the electrostatic environment plays in regulating the catalytic rate85,94–97 could therefore be exploited through mutations such as those seen on the chimeras. That is, the mutations (excluding F182Q) did not directly impact the electrostatic environment of the active site, instead, they (through coupled dynamics) altered the conformational sampling of other active site residues.
Such coupled dynamics as those observed here can potentially be exploited in protein engineering through the introduction of mutations distal to the active site, that can shift the overall conformational ensemble of the protein, including potentially controlling the dynamics of key catalytic loops.42,98 For instance, in recent work, we demonstrated that a single mutation on the WPD-loop can be sufficient to shift the equilibrium population of the loop to a closed conformation and alter the pH-dependency of catalysis.20 There exist a variety of computational tools that could be used to characterize and predict mutation hotspots and regions to target to manipulate loop dynamics.42 This observation is also significant in light of increased awareness of the role of the dynamics of decorating loops in the natural evolution of enzyme function, and the potential of altering loop dynamics and loop grafting as a powerful tool in protein design.35,36,52,53 Here, we demonstrate that non-catalytic loop residues are potential mutational targets for manipulating the conformational equilibria of key catalytic loops in PTPs, in addition to analogous effects from mutation of allosteric residues.30
Data availability
The coordinates for all protein crystal structures have been deposited in the Protein Data Bank, http://www.rcsb.org, under the PDB ID codes 6XE8, 6XED, 6XEA, 6XEE, 6XEG, 6XEF, and 7S4F. Starting structures for all simulations in Amber readable format, parameter files, MD simulation input files, corresponding files for our EVB simulations, and structural information have been deposited to Zenodo: https://doi.org/10.5281/zenodo.6525328. See https://doi.org/10.1039/d2sc04135a.Author contributions
Protein purifications, kinetic, and crystallography data were collected and analyzed by RS, KJO, TR, TASB, RDB, and AT, under the supervision of ACH and SJJ. Computational work was performed by RMC, MC, and ARC under the supervision of SCLK. Project conceptualization was contributed by JPL, ACH, and SCLK. Writing and editing were carried out by ACH, SCLK, RS, RMC, SJJ, JPL, and TASB. All authors have given approval to the final version of the manuscript.Conflicts of interest
There are no conflicts to declare.Acknowledgements
This work was supported by a research grant from the National Institutes of Health (GM112781). This work was also supported by the Carl Tryggers Foundation for Scientific Research (postdoctoral fellowship to R. M. C., Grant No. CTS 19:172), the Knut and Alice Wallenberg Foundation (Wallenberg Academy Fellowship and Wallenberg Scholar grants to S. C. L. K., Grant No. 2018.0140 and 2019.0431, respectively), the Human Frontier Science Program (Grant No. RGP0041/2017), and the Swedish Research Council (Grant No. 2019-03499). Computational resources were provided by the Swedish National Infrastructure for Computing (Grant No. 2019/2-1, 2019/3-258, and 2020/5-250), and simulations were performed on the Tetralith (NSC) and Kebnekaise (UPPMAX) computing clusters in Sweden through resources provided by the Swedish National Infrastructure for Computing (SNIC). Funding for the in-house X-ray generator was provided by NSF-MRI award DBI1228874. Use of the Stanford Synchrotron Radiation Lightsource, SLAC National Accelerator Laboratory, is supported by the U.S. Department of Energy, Office of Science, Office of Basic Energy Sciences under Contract No. DE-AC02-76SF00515. The SSRL Structural Molecular Biology Program is supported by the DOE Office of Biological and Environmental Research, and by the National Institutes of Health, National Institute of General Medical Sciences (including P41GM103393).References
- Z. Y. Zhang, Crit. Rev. Biochem. Mol. Biol., 1998, 33, 1–52 CrossRef PubMed.
- M. D. Jackson and J. M. Denu, Chem. Rev., 2001, 101, 2313–2340 CrossRef CAS PubMed.
- T. Hunter, Cell, 2000, 100, 113–127 CrossRef CAS PubMed.
- T. Hunter, Cell, 1995, 80, 225–236 CrossRef CAS PubMed.
- A. Bhaduri and R. Sowdhamini, Gene, 2006, 366, 246–255 CrossRef CAS PubMed.
- N. K. Tonks, FEBS Lett., 2003, 546, 140–148 CrossRef CAS PubMed.
- N. K. Tonks, C. D. Diltz and E. H. Fischer, J. Biol. Chem., 1988, 263, 6731–6737 CrossRef CAS.
- Z. Y. Zhang, J. C. Clemens, H. L. Schubert, J. A. Stuckey, M. W. Fischer, D. M. Hume, M. A. Saper and J. E. Dixon, J. Biol. Chem., 1992, 267, 23759–23766 CrossRef CAS.
- Z. Y. Zhang and J. E. Dixon, Adv. Enzymol. Relat. Areas Mol. Biol., 1994, 68, 1–36 CAS.
- F. G. Haj, B. Markova, L. D. Klaman, F. D. Bohmer and B. G. Neel, J. Biol. Chem., 2003, 278, 739–744 CrossRef CAS.
- T. O. Johnson, J. Ermolieff and M. R. Jirousek, Nat. Rev. Drug Discov., 2002, 1, 696–709 CrossRef CAS PubMed.
- A. Ostman, C. Hellberg and F. D. Bohmer, Nat. Rev. Cancer, 2006, 6, 307–320 CrossRef PubMed.
- F. H. Westheimer, Science, 1987, 235, 1173–1178 CrossRef CAS PubMed.
- S. Zhang and Z. Y. Zhang, Drug Discov. Today, 2007, 12, 373–381 CrossRef CAS PubMed.
- Z. Y. Zhang, Annu. Rev. Pharmacol. Toxicol., 2002, 42, 209–234 CrossRef CAS PubMed.
- E. B. Fauman, C. Yuvaniyama, H. L. Schubert, J. A. Stuckey and M. A. Saper, J. Biol. Chem., 1996, 271, 18780–18788 CrossRef CAS PubMed.
- M. R. Groves, Z. J. Yao, P. P. Roller, T. R. Burke Jr and D. Barford, Biochemistry, 1998, 37, 17773–17783 CrossRef CAS PubMed.
- J. A. Stuckey, H. L. Schubert, E. B. Fauman, Z. Y. Zhang, J. E. Dixon and M. A. Saper, Nature, 1994, 370, 571–575 CrossRef CAS PubMed.
- L. Tautz, D. Critton and S. Grotegut, Methods Mol. Biol., 2013, 1053, 179–221 CrossRef CAS PubMed.
- R. Shen, R. M. Crean, S. J. Johnson, S. C. L. Kamerlin and A. C. Hengge, JACS Au, 2021, 1, 646–659 CrossRef CAS PubMed.
- Z. Y. Zhang, B. A. Palfey, L. Wu and Y. Zhao, Biochemistry, 1995, 34, 16389–16396 CrossRef CAS PubMed.
- Z. Y. Zhang, J. Biol. Chem., 1995, 270, 11199–11204 CrossRef CAS PubMed.
- T. A. Brandao, A. C. Hengge and S. J. Johnson, J. Biol. Chem., 2010, 285, 15874–15883 CrossRef CAS PubMed.
- A. C. Hengge, G. A. Sowa, L. Wu and Z. Y. Zhang, Biochemistry, 1995, 34, 13982–13987 CrossRef CAS PubMed.
- G. H. Peters, S. Branner, K. B. Moller, J. N. Andersen and N. P. Moller, Biochimie, 2003, 85, 527–534 CrossRef CAS PubMed.
- Z.-Y. Zhang, W. P. Malochowski, R. L. Van Etten and J. E. Dixon, J. Biol. Chem., 1994, 269, 8140–8145 CrossRef CAS PubMed.
- V. I. Kuznetsov and A. C. Hengge, Biochemistry, 2013, 52, 8012–8025 CrossRef CAS PubMed.
- M. S. Choy, Y. Li, L. E. Machado, S. F. Kunze, B. A. Micha, C. R. Connors, W. Xingyu, K. Lindorff-Larsen, R. Page and P. Peti, Mol. Cell, 2017, 65, 644–658 CrossRef CAS PubMed.
- R. M. Crean, M. Biler, M. W. van der Kamp, A. C. Hengge and S. C. L. Kamerlin, J. Am. Chem. Soc., 2021, 143, 3830–3845 CrossRef CAS PubMed.
- D. S. Cui, V. Beaumont, P. S. Ginther, J. M. Lipchock and J. P. Loria, J. Mol. Biol., 2017, 429, 2360–2372 CrossRef CAS PubMed.
- D. S. Cui, J. M. Lipchock, D. Brookner and J. P. Loria, J. Am. Chem. Soc., 2019, 141, 12634–12647 CrossRef CAS PubMed.
- K. R. Torgeson, M. W. Clarkson, G. S. Kumar, R. Page and W. Peti, J. Biol. Chem., 2020, 295, 13829–13837 CrossRef CAS PubMed.
- S. K. Whittier, A. C. Hengge and J. P. Loria, Science, 2013, 341, 899–903 CrossRef CAS PubMed.
- V. A. Beaumont, K. Reiss, Z. Qu, B. Allen, V. S. Batista and J. P. Loria, Biochemistry, 2020, 59, 1896–1908 CrossRef CAS PubMed.
- B. M. Nestl and B. Hauer, ACS Catal., 2014, 9, 3201–3211 CrossRef.
- H.-S. Park, S.-H. Nam, J. K. Lee, C. N. Yoon, B. Mannervik, S. J. Benkvic and H.-S. Kim, Science, 2006, 311, 535–538 CrossRef CAS PubMed.
- C. M. Clouthier, S. Morin, S. M. C. Gobeil, N. Doucet, J. Blanchet, J. Blanchet, E. Nguyen, S. M. Gagné and J. N. Pelletier, PLoS One, 2012, 7, e52283 CrossRef CAS.
- N. Doucet, E. D. Watt and J. P. Loria, Biochemistry, 2009, 48, 7160–7168 CrossRef CAS PubMed.
- C. Narayanan, D. N. Bernard, K. Bafna, D. Gagné, C. S. Chennubhotla, N. Doucet and P. K. Agarwal, Structure, 2018, 26, 426–436 CrossRef CAS PubMed.
- L. Hedstrom, L. Szilagyi and W. J. Rutter, Science, 1992, 255, 1249–1253 CrossRef CAS PubMed.
- C. E. Dulcey, Y. López de Los Santos, M. Létourneau, E. Déziel and N. Doucet, FEBS J., 2019, 286, 4036–4059 CrossRef CAS PubMed.
- R. M. Crean, J. M. Gardner and S. C. L. Kamerlin, J. Am. Chem. Soc., 2020, 142, 11324–11342 CrossRef CAS PubMed.
- L. Afriat-Jurnou, C. J. Jackson and D. S. Tawfik, Biochemistry, 2012, 51, 6047–6055 CrossRef CAS PubMed.
- S. T. Dan, Science, 2006, 311, 475–476 CrossRef.
- R. Otten, L. Liu, L. R. Kenner, M. W. Clarkson, D. Mavor, D. S. Tawfik, D. Kern and J. S. Fraser, Nat. Commun., 2018, 9, 1314 CrossRef PubMed.
- J. F. Ripka, A. Perez-Riba, P. K. Chaturbedy and L. S. Itzhaki, Curr. Opin. Struct. Biol., 2021, 3, 30–40 CrossRef CAS.
- A. Schenkmayerova, G. P. Pinto, M. Toul, M. Marek, L. Hernychova, J. Planas-Iglesias, V. Daniel Liskova, D. Pluskal, M. Vasina, S. Emond, M. Dörr, R. Chaloupkova, D. Bednar, Z. Prokop, F. Hollfelder, U. T. Bornscheuer and J. Damborsky, Nat. Commun., 2021, 12, 3616 CrossRef CAS.
- G. Moise, Y. Morales, V. Beaumont, T. Caradonna, J. P. Loria, S. J. Johnson and A. C. Hengge, Biochemistry, 2018, 57, 5315–5326 CrossRef CAS PubMed.
- J. D. Chodera and F. Noé, Curr. Opin. Struct. Biol., 2014, 25, 135–144 CrossRef CAS PubMed.
- B. E. Husic and V. S. Pande, J. Am. Chem. Soc., 2018, 140, 2386–2396 CrossRef CAS PubMed.
- W. Wang, S. Cao, L. Zhu and X. Huang, Wiley Interdiscip. Rev.: Comput. Mol. Sci., 2018, 8, e1343 Search PubMed.
- A. S. El Hawrani, K. M. Moreton, R. B. Sessions, A. R. Clarke and J. J. Holbrook, Trends Biochem. Sci., 1994, 12, 207–211 CAS.
- N. Kreß, J. M. Halder, L. R. Rapp and B. Hauer, Curr. Opin. Chem. Biol., 2018, 47, 109–116 CrossRef PubMed.
- D. Barford, J. C. Keller, A. J. Flint and N. K. Tonks, J. Mol. Biol., 1994, 239, 726–730 CrossRef CAS PubMed.
- Z. Otwinowski and W. Minor, Methods Enzymol., 1997, 276, 307–326 CAS.
- P. V. Afonine, R. W. Grosse-Kunstleve, N. Echols, J. J. Headd, N. W. Moriarty, M. Mustyakimov, T. C. Terwilliger, A. Urzhumtsev, P. H. Zwart and P. D. Adams, Acta Crystallogr., Sect. D: Biol. Crystallogr., 2012, 68, 352–367 CrossRef CAS PubMed.
- D. Liebschner, P. V. Afonine, M. L. Baker, G. Bunkoczi, V. B. Chen, T. I. Croll, B. Hintze, L. W. Hung, S. Jain, A. J. McCoy, N. W. Moriarty, R. D. Oeffner, B. K. Poon, M. G. Prisant, R. J. Read, J. S. Richardson, D. C. Richardson, M. D. Sammito, O. V. Sobolev, D. H. Stockwell, T. C. Terwilliger, A. G. Urzhumtsev, L. L. Videau, C. J. Williams and P. D. Adams, Acta Crystallogr., Sect. D: Biol. Crystallogr., 2019, 75, 861–877 CrossRef CAS PubMed.
- P. D. Adams, R. W. Grosse-Kunstleve, L. W. Hung, T. R. Ioerger, A. J. McCoy, N. W. Moriarty, R. J. Read, J. C. Sacchettini, N. K. Sauter and T. C. Terwilliger, Acta Crystallogr., Sect. D: Biol. Crystallogr., 2002, 58, 1948–1954 CrossRef PubMed.
- P. Emsley, B. Lohkamp, W. G. Scott and K. Cowtan, Acta Crystallogr., Sect. D: Biol. Crystallogr., 2010, 66, 486–501 CrossRef CAS PubMed.
- N. Bourne and A. Williams, J. Org. Chem., 1984, 49, 1200–1204 CrossRef CAS.
- A. C. Hengge, W. A. Edens and H. Elsing, J. Am. Chem. Soc., 1994, 116, 5045–5049 CrossRef CAS.
- D. A. Case, I. Y. Ben-Shalom, S. R. Brozell, D. S. Cerutti, T. E. Cheatham III, V. W. D. Cruzeiro, T. A. Darden, R. E. Duke, D. Ghoreishi, M. K. Gilson, H. Gohlke, A. W. Goetz, D. Greene, R. Harris, N. Homeyer, Y. Huang, S. Izadi, A. Kovalenko, T. Kurtzman, T. S. Lee, S. LeGrand, P. Li, C. Lin, J. Liu, T. Luchko, R. Luo, D. J. Mermelstein, K. M. Merz, Y. Miao, G. Monard, C. Nguyen, H. Nguyen, I. Omelyan, A. Onufriev, F. Pan, R. Qi, D. R. Roe, A. Roitberg, C. Sagui, S. Schott-Verdugo, J. Shen, C. L. Simmerling, J. Smith, R. SalomonFerrer, J. Swails, R. C. Walker, J. Wang, H. Wei, R. M. Wolf, X. Wu, L. Xiao, D. M. York and P. A. Kollman, AMBER 2018, University of California, San Francisco, 2018 Search PubMed.
- H. M. Berman, J. Westbrook, Z. Feng, G. Gilliland, T. N. Bhat, H. Weissig, I. N. Shindyalov and P. E. Bourne, Nucleic Acids Res., 2000, 28, 235–242 CrossRef CAS PubMed.
- D. A. Keedy, Z. B. Hill, J. T. Biel, E. Kang, T. J. Rettenmaier, J. Brandao-Neto, N. M. Pearce, F. von Delft, J. A. Wells and J. S. Fraser, eLife, 2018, 7, e36307 CrossRef PubMed.
- J. A. Maier, C. Martinez, K. Kasavajhala, L. Wickstrom, K. E. Hauser and C. Simmerling, J. Chem. Theory Comput., 2015, 11, 3696–3713 CrossRef CAS PubMed.
- W. L. Jorgensen, J. Chandrasekhar, J. D. Madura, R. W. Impey and M. L. Klein, J. Chem. Phys., 1983, 79, 926–935 CrossRef CAS.
- M. K. Scherer, B. Trendelkamp-Schroer, F. Paul, G. Pérez-Hernández, M. Hoffmann, N. Plattner, C. Wehmeyer, J.-H. Prinz and F. Noé, J. Chem. Theory Comput., 2015, 11, 5525–5542 CrossRef CAS PubMed.
- G. Pérez-Hernández, F. Paul, T. Giorgino, G. De Fabritiis and F. Noé, J. Chem. Phys., 2013, 139, 015102 CrossRef PubMed.
- S. Röblitz and M. Weber, Adv. Data Anal. Classif., 2013, 7, 147–179 CrossRef.
- D. R. Roe and T. E. Cheatham 3rd, J. Chem. Theory Comput., 2013, 9, 3084–3095 CrossRef CAS PubMed.
- A. Warshel and R. M. Weiss, J. Am. Chem. Soc., 1980, 102, 6218–6226 CrossRef CAS.
- A. D. Scouras and V. Daggett, Protein Sci., 2011, 20, 341–352 CrossRef CAS PubMed.
- E. F. Pettersen, T. D. Goddard, C. C. Huang, G. S. Couch, D. M. Greenblatt, E. C. Meng and T. E. Ferrin, J. Comput. Chem., 2004, 25, 1605–1612 CrossRef CAS PubMed.
- P. Bauer, A. Barrozo, M. Purg, B. A. Amrein, M. Esguerra, P. B. Wilson, D. T. Major, J. Åqvist and S. C. L. Kamerlin, SoftwareX, 2018, 7, 388–395 CrossRef.
- W. L. Jorgensen, D. S. Maxwell and J. Tirado-Rives, J. Am. Chem. Soc., 1996, 118, 11225–11236 CrossRef CAS.
- H. L. Schubert, E. B. Fauman, J. A. Stuckey, J. E. Dixon and M. A. Saper, Protein Sci., 1995, 4, 1904–1913 CrossRef CAS PubMed.
- J. Yang, X. Liang, T. Niu, W. Meng, Z. Zhao and G. W. Zhou, J. Biol. Chem., 1998, 273, 28199–28207 CrossRef CAS PubMed.
- P. J. Ala, L. Gonneville, M. C. Hillman, M. Becker-Pasha, M. Wei, B. G. Reid, R. Klabe, E. W. Yue, B. Wayland, B. Douty, P. Polam, Z. Wasserman, M. Bower, A. P. Combs, T. C. Burn, G. F. Hollis and R. Wynn, J. Biol. Chem., 2006, 281, 32784–32795 CrossRef CAS PubMed.
- T. A. Brandao, S. J. Johnson and A. C. Hengge, Arch. Biochem. Biophys., 2012, 525, 53–59 CrossRef CAS PubMed.
- A. K. Pedersen, G. G. Peters, K. B. Moller, L. F. Iversen and J. S. Kastrup, Acta Crystallogr., Sect. D: Biol. Crystallogr., 2004, 60, 1527–1534 CrossRef PubMed.
- E. Bellomo, A. Abro, C. Hogstrand, W. Maret and C. Domene, J. Am. Chem. Soc., 2018, 140, 4446–4454 CrossRef CAS PubMed.
- R. L. Stone and J. E. Dixon, J. Biol. Chem., 1994, 269, 31323–31326 CrossRef CAS PubMed.
- J. R. Knowles and W. P. Jencks, CRC Crit. Rev. Biochem., 1976, 4, 165–173 CrossRef CAS PubMed.
- A. C. Hengge, Biochim. Biophys. Acta, 2015, 1854, 1768–1775 CrossRef CAS PubMed.
- A. Warshel, P. K. Sharma, M. Kato, Y. Xiang, H. Liu and M. H. Olsson, Chem. Rev., 2006, 106, 3210–3235 CrossRef CAS PubMed.
- A. Shurki, E. Derat, A. Barrozo and S. C. L. Kamerlin, Chem. Soc. Rev., 2015, 44, 1037–1052 RSC.
- A. Barrozo, F. Duarte, P. Bauer, A. T. P. Carvalho and S. C. L. Kamerlin, J. Am. Chem. Soc., 2015, 137, 9061–9076 CrossRef CAS PubMed.
- A. Barrozo, Q. Liao, M. Esguerra, G. Marloie, J. Florián, N. H. Williams and S. C. L. Kamerlin, Org. Biomol. Chem., 2018, 16, 2060–2073 RSC.
- D. Blaha-Nelson, D. M. Krüger, K. Szeler, M. Ben-David and S. C. L. Kamerlin, J. Am. Chem. Soc., 2017, 139, 1155–1167 CrossRef CAS PubMed.
- M. Pfeiffer, R. M. Crean, C. Moreira, A. Parracino, G. Oberdorfer, L. Brecker, F. Hammerschmidt, S. C. L. Kamerlin and B. Nidetzky, ACS Catal., 2022, 12, 3357–3370 CrossRef CAS PubMed.
- M. Purg, M. Elias and S. C. L. Kamerlin, J. Am. Chem. Soc., 2017, 139, 17533–17546 CrossRef CAS PubMed.
- Q. Liao, Y. Kulkarni, U. Sengupta, D. Petrovic, A. J. Mulholland, M. W. van der Kamp, B. Strodel and S. C. L. Kamerlin, J. Am. Chem. Soc., 2018, 140, 15889–15903 CrossRef CAS PubMed.
- A. Romero-Rivera, M. Corbella, A. Parracino, W. M. Patrick and S. C. L. Kamerlin, JACS Au, 2022, 2, 943–960 CrossRef CAS PubMed.
- A. Warshel, Proc. Natl. Acad. Sci. U. S. A., 1978, 75, 5250–5254 CrossRef CAS PubMed.
- P. Hanoian, C. T. Liu, S. Hammes-Schiffer and S. Benkovic, Acc. Chem. Res., 2015, 48, 482–489 CrossRef CAS PubMed.
- S. D. Fried and S. G. Boxer, Annu. Rev. Biochem., 2017, 86, 387–415 CrossRef CAS PubMed.
- M. R. Hennefarth and A. N. Alexandrova, Curr. Opin. Struct. Biol., 2022, 72, 1–8 CrossRef CAS PubMed.
- S. Osuna, Wiley Interdiscip. Rev.: Comput. Mol. Sci., 2021, 11, e1502 CAS.
Footnote |
| † Electronic supplementary information (ESI) available: Additional simulation methodology and simulation analysis. Starting structures for all simulations in Amber readable format, parameter files with examples, MD simulation input files, corresponding files for our EVB simulations, and structural information have been deposited to Zenodo: https://doi.org/10.5281/zenodo.6525328. See DOI: https://doi.org/10.1039/d2sc04135a |
| This journal is © The Royal Society of Chemistry 2022 |