 Open Access Article
Subtly tuning intermolecular hydrogen bonds in hybrid crystals to achieve ultrahigh-temperature molecular ferroelastic†
Hui
Ye
,
Xiao-Xian
Chen
,
De-Xuan
Liu
,
Bing-Qing
Zhao
,
Yao-Bin
Li
,
Ying
Zeng
,
Wei-Xiong
Zhang
 * and
Xiao-Ming
Chen

MOE Key Laboratory of Bioinorganic and Synthetic Chemistry, School of Chemistry, Sun Yat-Sen University, Guangzhou 510275, China. E-mail: zhangwx6@mail.sysu.edu.cn
First published on 8th November 2022
Abstract
Molecular-based ferroic phase-transition materials have attracted increasing attention in the past decades due to their promising potential as sensors, switches, and memory. One of the long-term challenges in the development of molecular-based ferroic materials is determining how to promote the ferroic phase-transition temperature (Tc). Herein, we present two new hexagonal molecular perovskites, (nortropinonium)[CdCl3] (1) and (nortropinium)[CdCl3] (2), to demonstrate a simple design principle for obtaining ultrahigh-Tc ferroelastic phase transitions. They consist of same host inorganic chains but subtly different guest organic cations featuring a rigid carbonyl and a flexible hydroxyl group in 1 and 2, respectively. With stronger hydrogen bonds involving the carbonyl but a relatively lower decomposition temperature (Td, 480 K), 1 does not exhibit a crystalline phase transition before its decomposition. The hydroxyl group subtly changes the balance of intermolecular interactions in 2via reducing the attractive hydrogen bonds but increasing the repulsive interactions between adjacent organic cations, which finally endows 2 with an enhanced thermal stability (Td = 570 K) and three structural phase transitions, including two ferroelastic phase transitions at ultrahigh Tc values of 463 K and 495 K, respectively. This finding provides important clues to judiciously tuning the intermolecular interactions in hybrid crystals for developing high-Tc ferroic materials.
Introduction
Ferroelastic materials are expected to be promising materials in developing mechanical sensors, switches, and memory based on their unique properties, such as spontaneous strain, domain conversion, and strain–stress hysteresis.1–6 Ferroelastic phase transition from a paraelastic phase to a ferroelastic phase by reducing symmetry is accompanied by the appearance of a ferroelastic domain,7,8 and theoretically, the generation of ferroelasticity must meet the strict crystallographic requirements of the 94 species of ferroelastic phase transitions reported by Aizu.9 Traditional inorganic ferroelastics, such as BiVO4,10 Gd2(MoO4)3,11 SrBi2Ta2O9,12 and PbZr1−xTixO3,13 usually run into technical problems in the synthetic process, requiring complicated, high-cost, or highly energy-consuming fabrication. In the past decades, the exploration of ferroelastics has been extended to organic–inorganic hybrid materials, which have the advantages of low weight, low acoustical impedance, nontoxicity, and, especially, potential large responses to mechanical stress benefiting from the orientational or conformation changes of the flexible organic cations.14–20In recent years, studies on hybrid ferroelastics have made great progress, with numerous instances being synthesized and studied in depth, such as [Fe(Cp)2][FeCl4]21 with a narrow band gap of 1.61 eV, (Me3NOH)2[ZnCl4]22 with a large spontaneous strain of 0.129, (Me3NNH2)2[Na(H2O)Co(CN)6]23 with a large entropy change of 146 J K−1 kg−1, and chiral (R-3-chloro-2-hydroxypropyltrimethylammonium)2CuCl4 with seven physical channel switches.24 However, hybrid ferroelastics displaying a high phase-transition temperature (Tc) are scarce, with the majority below 400 K (Table S1†). In order to improve the ferroelastic Tc, it is very critical to take into account the delicate intermolecular interactions and crystal packing via rational choice of the components, especially the organic ones. Halogen modification of organic cations is usually employed to promote Tc through increasing the molecular weight and/or adding intermolecular interactions involving halogens. For instance, replacing an H atom with F atom in (Me4P)[Cd(SCN)3] results in an increase in the ferroelastic Tc from 308 K to 318 K.25 By introducing F, Cl, and Br atoms, respectively, to the dimethyl-isopropyl-ethyl-ammonium (DMIE+) cation in (DMIE)[Cd(SCN)3], Fu et al. obtained three molecular ferroelastics in which the Tc values gradually increased from 249 to 368 K, benefiting from the enhanced energy barriers caused by the increased molecular weight of the organic cations.26 By introducing a Br atom to the Me4N+ cation, Liao et al. obtained a ferroelastic material, (Me3NCH2Br)2[ZnBr4], with a high Tc of 387 K arising from the enhanced intermolecular interactions due to additional Br⋯Br interactions.27
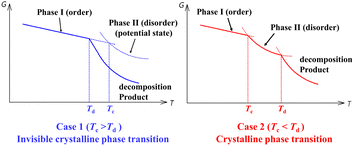
Nevertheless, halogen modification is usually accompanied by an undesired reduction in the decomposition temperature (Td) in the modified compound compared to the parent one.28–32 Noteworthily, a high Td is an important prerequisite for achieving a high Tc. As shown in Scheme 1, a crystalline phase transition could be only observed for case 2 (Td > Tc), and not for case 1, in which the decomposition occurs before the potential order–disorder crystalline phase transition. To obtain an experimentally observable high Tc, components with high thermal stability should be selected as possible (Scheme 1) to achieve a high Td; meanwhile, appropriate competition and balance between intermolecular interactions are needed to establish multiple interconvertible crystalline states with suitable activation energy barriers to give structural phase transitions before decomposition.
To demonstrate this design principle through subtle molecular design, as one of our ongoing studies on multi-component hybrid crystals based on hydroxyl-containing polar cations,22,33–36 herein we present two nice examples of hexagonal perovskites (Scheme 2), (Hnto)[CdCl3] (1, Hnto+ = nortropinonium) and (Hntp)[CdCl3] (2, Hntp+ = nortropinium). They consist of the same inorganic components but different organic cations featuring a rigid carbonyl group in 1 and a flexible hydroxyl group in 2. We found that 2 exhibits high thermal stability (Td = 570 K) and three phase transitions including two ferroelastic transitions with high Tc values of 463 K and 495 K, respectively, whereas 1 does not undergo crystalline phase transition before its relatively lower Td (480 K). By means of thermal analysis, X-ray single-crystal/powder structural analyses, dielectric measurement, polarization microscopy measurement, and Hirshfeld surface analyses, the underlying mechanism for their different phase-transition behaviours and thermal stabilities has been disclosed; this mechanism is strongly associated with the delicate difference in the interactions between adjacent organic cations.
Experimental section
Materials and instruments
All chemicals were commercially available and were used without further purification. Powder X-ray diffraction (PXRD) patterns were recorded using a Bruker D8 ADVANCE X-ray powder diffractometer (Cu Kα, λ = 1.54184 Å). Thermogravimetric analysis (TGA) was performed using a TG 209 F3 Tarsus system with a heating rate of 10 K min−1 under a nitrogen atmosphere. Differential scanning calorimetry (DSC) was carried out on a TA DSC Q2000 instrument by heating and cooling the powder sample at a sweep rate of 10 K min−1 in the temperature ranges of 193–470 K and 193–523 K for 1 and 2, respectively. The dielectric measurement for 2 was carried out on a TH2838 Impedance Analyser at frequencies from 0.5 MHz to 1 MHz with an applied voltage of 1.0 V and a temperature sweep rate of 3 K min−1 in the range of 273–518 K in a Mercury iTC cryogenic environment controller from Oxford Instruments. The pressed-powder pellets were fixed by two magnetic sheets acting as electrodes. The observation of ferroelastic domains for 2 was performed using an OLYMPUS BX41 polarizing microscope with a Linkam cooling/heating stage THMSE 600 at a temperature sweep rate of 2 K min−1.Synthesis
1 and 2 were synthesized by adding CdCl2·2.5H2O (0.228 g, 1.0 mmol) to a stirred aqueous solution of nortropinone hydrochloride (0.162 g, 1.0 mmol) or nortropine hydrochloride (0.164 g, 1.0 mmol), respectively, at room temperature. Colourless rod crystals were obtained by slow evaporation for several days at room temperature, in a yield of 85% for 1 and 90% for 2, based on CdCl2·2.5H2O. The purities of the bulk samples were verified from their PXRD patterns (Fig. S1 and S2†).X-ray crystallography
Diffraction data for 1 and 2α at 298(2) K were collected on a Rigaku XtaLAB P300DS single-crystal diffractometer using graphite-monochromated Cu Kα (λ = 1.54184 Å) radiation. Absorption corrections were applied using the multi-scan program CrysAlisPro. The structures were solved by the direct method and refined by the full-matrix least-squares method with the SHELX program package on Olex2.37,38 The hydrogen atoms were generated geometrically. All non-hydrogen atoms were refined with anisotropic thermal parameters. The positions of the hydrogen atoms were generated geometrically. Detailed crystallographic data and structural refinement parameters are listed in Table 1.| Complex | (Hnto)CdCl3 (1) | (Hntp)CdCl3 (2) | |||
|---|---|---|---|---|---|
| a R 1 = ∑||Fo| − |Fc||/∑|Fo|. b wR 2 = [∑w(Fo2 − Fc2)2/∑w(Fo2)2]1/2. c R p = ∑|cYsim(2θi) − Iexp(2θi) + Yback(2θi)|/∑|Iexp(2θi)|. d R wp = {wp[cYsim(2θi) − Iexp(2θi) + Yback(2θi)]2/∑wp[Iexp(2θi)2]}1/2, and wp = 1/Iexp(2θi). | |||||
| Formula weight | 344.93 | 346.94 | |||
| Phase | — | 2α | 2β | 2γ | 2δ |
| Temperature (K) | 298(2) | 298(2) | 452(2) | 488(2) | 533(2) |
| Crystal system | Monoclinic | Monoclinic | Monoclinic | Orthorhombic | Hexagonal |
| Space group | P21/n | P21/n | C2/c | Cmcm | P63/mmc |
| a/Å | 18.738(1) | 9.0993(3) | 9.285(6) | 9.463(3) | 9.9173(6) |
| b/Å | 9.0561(5) | 17.7320(7) | 17.781(1) | 18.001(6) | 9.9173(6) |
| c/Å | 6.7101(3) | 6.7684(3) | 6.699(4) | 6.787(2) | 6.7900(4) |
| β/° | 108.749(4) | 84.417(4) | 87.304(5) | 90 | 90 |
| γ/° | 90 | 90 | 90 | 90 | 120 |
| V/Å3 | 1078.2(1) | 1086.89(7) | 1104.78(1) | 1156.12(1) | 578.35(1) |
| Z | 4 | 4 | 4 | 4 | 2 |
| D c (g cm−3) | 2.125 | 2.120 | 2.087 | 1.994 | 1.993 |
| R 1 [I > 2σ(I)]a | 0.0401 | 0.0478 | R p = 0.0522 | R p = 0.0473 | R p = 0.0423 |
| wR 2 [I > 2σ(I)]b | 0.0743 | 0.1319 | R wp = 0.0777 | R wp = 0.0660 | R wp = 0.0583 |
| R int | 0.0266 | 0.0546 | — | — | — |
| GOF | 1.077 | 1.103 | — | — | — |
| CCDC number | 2179537 | 2179538 | 2179539 | 2179540 | 2179541 |
The PXRD patterns of 2 for the Pawley and Rietveld refinements were collected on a Bruker D8 Advance with Cu Kα X-ray radiation (40 kV, 40 mA) at 452 K (2β), 488 K (2γ), and 533 K (2δ), respectively. Indexing and refinement of the PXRD patterns was carried out using the Reflex module of Material Studio 5.0. By using the peak profile parameters from the Pawley refinement, automatic space group determination was performed, indicating that C2/c, Cmcm, and P63/mmc were the most probable space groups for 2β, 2γ, and 2δ, respectively (for details, see the ESI†). Hexagonal perovskite structural models at these space groups were built as the initial structural models for Rietveld refinement. Pseudo-Voigt profile parameters, background parameters, cell constants, the zero point of the diffraction pattern, global isotropic atom displacement parameters, Berar–Baldinozzi asymmetry correction parameters, and March–Dollase preferred orientation correction parameters were optimized step-by-step to improve the agreement between the calculated and experimental powder diffraction patterns. The final Rietveld refinement plots are shown in Fig. S3,† and the relevant cell parameters and R-factors are listed in Table 1. CCDC numbers: 2179537 for 1 and 2179538–2179541 for 2α, 2β, 2γ, and 2δ, respectively.
Results and discussion
Thermal analyses
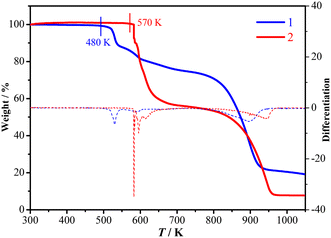
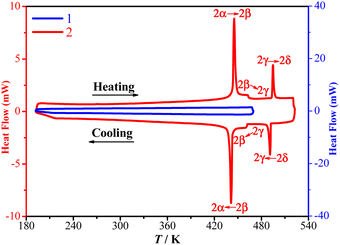
TGA and DSC measurements showed that 1 is stable up to 480 K under a nitrogen atmosphere (Fig. 1) and does not exhibit a crystalline phase transition before decomposition (Fig. 2). In contrast, 2 is stable up to 570 K under a nitrogen atmosphere (Fig. 1) and exhibits three structural phase transitions, which were detected using DSC (Fig. 2) as three pairs of reversible thermal anomalies at 445/441 K (Tc1), 463/461 K (Tc2), and 495/491 K (Tc3) during the heating/cooling runs, respectively. The reversible crystalline phase transitions in 2 were further confirmed from the variable-temperature PXRD patterns (Fig. S4†). For convenience, we labelled the phases below Tc1, between Tc1 and Tc2, between Tc2 and Tc3, and above Tc3 as 2α, 2β, 2γ, and 2δ, respectively.Structural analyses
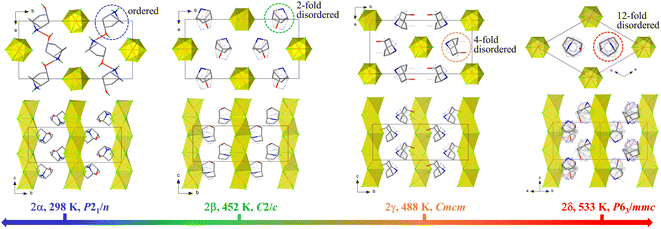
The structures of 1 and 2 were studied using single-crystal or powder X-ray diffraction. As illustrated in Fig. 3 and 4, all the crystalline phases for 1 and 2 can be described as a hexagonal perovskite structure consisting of inorganic chains formed by face-sharing [CdCl6] octahedra with organic cations filling the interchain space. In detail, 1 crystallizes in the monoclinic space group P21/n with half of a CdCl6 octahedron and one ordered Hnto+ cation in the asymmetric unit at 298 K. Each Hnto+ cation forms a N–H⋯Cl hydrogen bond [H-bond, N⋯Cl distance dN⋯Cl = 3.301(3) Å] to interact with the Cl− bridges from the adjacent inorganic chain, and moreover, interacts with two adjacent cations via N–H⋯O![[double bond, length as m-dash]](https://www.rsc.org/images/entities/char_e001.gif) C H-bonds [dN⋯O = 2.855(4) Å] to form one-dimensional supramolecular chains in a head-to-tail arrangement along the c axis, i.e., parallel to the inorganic chain (Fig. 3b). In contrast, in 2α, additional O–H⋯Cl H-bonds are formed between the hydroxyl group of the organic cation and the Cl− bridge from inorganic chain; additionally, each Hntp+ interacts with two adjacent cations via two N–H⋯O H-bonds [dN⋯O = 2.941(4) Å] to form H-bonded chains along the a axis, i.e., perpendicular to the inorganic chain (Fig. 4). The three phase transitions in 2 are accompanied by changes in the space group: P21/n (at 298 K) → C2/c (at 450 K) → Cmcm (at 463 K) → P63/mmc (at 495 K), obeying the group–supergroup relationship step-by-step. The average Cd–Cl bond distances in these phases vary within a narrow range of 2.639–2.707 Å, indicating that no obvious change occurs within the inorganic chains. In contrast, the molecular dynamics of the Hntp+ cation reveal significant changes during the phase transitions, i.e., changing from a crystallographically ordered state in 2α, to a 2-fold disordered state about the 2-fold axis along the b axis in 2β, a 4-fold disordered state about the two mirror planes perpendicular to the a and c axes, respectively, in 2γ, and finally a 12-fold disordered state about the 6-fold axis along the c axis and inversion centre in 2δ.
C H-bonds [dN⋯O = 2.855(4) Å] to form one-dimensional supramolecular chains in a head-to-tail arrangement along the c axis, i.e., parallel to the inorganic chain (Fig. 3b). In contrast, in 2α, additional O–H⋯Cl H-bonds are formed between the hydroxyl group of the organic cation and the Cl− bridge from inorganic chain; additionally, each Hntp+ interacts with two adjacent cations via two N–H⋯O H-bonds [dN⋯O = 2.941(4) Å] to form H-bonded chains along the a axis, i.e., perpendicular to the inorganic chain (Fig. 4). The three phase transitions in 2 are accompanied by changes in the space group: P21/n (at 298 K) → C2/c (at 450 K) → Cmcm (at 463 K) → P63/mmc (at 495 K), obeying the group–supergroup relationship step-by-step. The average Cd–Cl bond distances in these phases vary within a narrow range of 2.639–2.707 Å, indicating that no obvious change occurs within the inorganic chains. In contrast, the molecular dynamics of the Hntp+ cation reveal significant changes during the phase transitions, i.e., changing from a crystallographically ordered state in 2α, to a 2-fold disordered state about the 2-fold axis along the b axis in 2β, a 4-fold disordered state about the two mirror planes perpendicular to the a and c axes, respectively, in 2γ, and finally a 12-fold disordered state about the 6-fold axis along the c axis and inversion centre in 2δ.
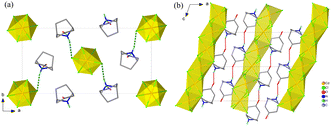 | ||
| Fig. 3 Crystal structures of 1 viewed along the c axis (a) and the b axis (b), respectively. For clarity, some hydrogen atoms are omitted. | ||
Multi-step thermosensitive dielectric responses of 2
The dynamic changes of organic cations during the phase transition were well reflected in the temperature-dependent dielectric permittivities (ε = ε′ − iε′′, where ε′ and ε′′ are the real and imaginary parts, respectively) of 2 measured using the pressed-powder samples. As shown in Fig. 5, from 273 K to 518 K, three stepwise enhanced dielectric responses were found over the thermal evolution process, coinciding well with the three DSC thermal anomalies (2α → 2β → 2γ → 2δ). Taking the ε′ value measured with a frequency of 1 MHz as example, in a heating run, ε′ increases from ca. 2.1 at 420 K (2α) to ca. 3.2 at 465 K (2β), then to ca. 3.7 at 485 K (2γ), and finally to ca. 8.1 at 510 K (2δ). It is worth noting that the increase in the amplitude of the ε′ value during the 2γ → 2δ transition is much larger than those during the 2α → 2β and 2β → 2γ transitions, well reflecting the more drastic motional changes of the Hntp+ cations during the 2γ → 2δ transition. In the following cooling run, the reverse drops in ε′ could be observed (Fig. 5, insert). These reversible multi-step thermosensitive dielectric anomalies arise from the order–disorder motional changes of the organic cations, suggesting a potential application as a switchable dielectric material for 2.39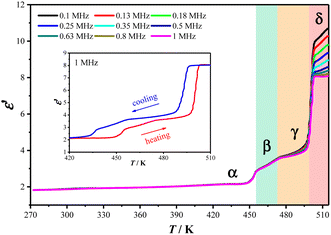 | ||
| Fig. 5 ε′ values measured at different frequencies in heating mode for 2. Inset: ε′ values measured at 1 MHz over a heating and cooling cycle. | ||
Temperature-dependent lattice parameters in 1 and 2
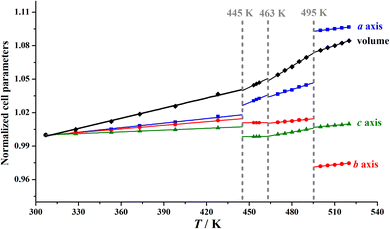
Pawley refinements were performed on variable-temperature PXRD patterns to obtain the temperature-dependent lattice parameters (Tables S2 and S3†) in the temperature ranges of 303–453 K for 1 and 307–520 K for 2, and the program PASCal40 was then utilized to calculate the thermal expansion coefficient for each phase (Tables S4 and S5†). The volume expansion coefficient is +97(3) × 10−6 K−1 for 1, which falls within the normal range commonly observed in most crystals.41,42 In contrast, the volume expansion coefficient increases from +305(9) × 10−6 K−1 (2α) to +585(9) × 10−6 K−1 (2β), and +740(8) × 10−6 K−1 (2γ), and then decreases to +395(6) × 10−6 K−1 (2δ); all these values are much larger than that of 1. These distinct volume expansion coefficients imply that the intermolecular interactions in 1 are stronger than those in 2 (vide infra).It is worth noting that, as shown in Fig. 6, upon heating from 2α to 2β at 445 K, only slight changes of 0.1% in the cell volume and 0.4–0.8% in the crystallographic axes were observed. Upon further heating to 2γ, the three axes and cell volume show slight changes (<0.2%), indicating that the second phase transition is accompanied by an inconspicuous lattice change, consistent with the observed small enthalpy change and dielectric anomaly. In contrast, upon heating from 2γ to 2δ at 495 K, a large increase in the a-axis length of ca. 4.2% and a large decrease in the b-axis length of ca. 4.4% were observed. These large changes in the a-axis and b-axis lengths during the 2γ → 2δ transition should be attributed to the notable interchain displacement accompanied by the significant change in molecular dynamics of the Hntp+ cations between a 4-fold disordered state and a 12-fold highly disordered state.
Ferroelastic phase transitions and spontaneous strains of 2
During the phase transitions from P63/mmc (2δ) to Cmcm (2γ) and then to C2/c (2β), the number of symmetry elements varies from 24 (E, i, σh, 3σv, 3σd, C2, 3C2′, 3C2′′, 2C3, 2S3, 2C6, and 2S6) to 8 (E, i, σh, σv, σv′, C2, C2′, and C2′) and then to 4 (E, i, σh, and C2), due to two successive ferroelastic phase transitions with Aizu notations of 6/mmmFmmm and mmmF2/m, respectively.9 To inspect these ferroelastic transitions, variable-temperature polarization microscopy was performed on a single crystal viewed perpendicular to the (110) plane, i.e., along the inorganic chain (Fig. S5†). In the temperature range of 298–473 K, as illustrated in Fig. 7a, a monodomain state was observed at 298 K as no external strain was applied to the as-grown single crystal. Upon heating to 460 K, striped patterns arose and gradually grew to cover the whole surface of the crystal. With further heating to 473 K (paraelastic 2γ), the striped patterns faded away. When the sample was cooled to 459 K (ferroelastic 2β), clear striped patterns reappeared and rapidly grew to recover the monodomain state. This change in the domain structures was repeatable when the crystal was further heated to 2γ (see Movie S1†), confirming the 2γ → 2β ferroelastic transition at around 463 K.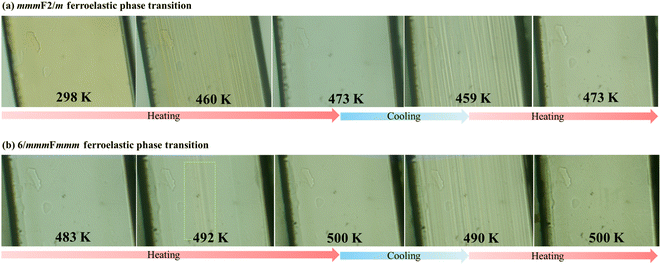 | ||
| Fig. 7 Variation of domain structures during the heating–cooling cycles between 298–473 K for mmmF2/m species (a) and 483–500 K for 6/mmmFmmm species (b). | ||
For the 2δ → 2γ ferroelastic transition, as shown in Fig. 7b, when the crystal was heated to 492 K, a few striped patterns again arose and rapidly grew to cover the whole surface of crystal. Upon further heating to 500 K, no observable domain structures were present in the paraelastic 2δ phase. After cooling to 490 K, clear striped patterns were observed, and the ferroelastic domains disappeared when the crystal was heated to 500 K again (see Movie S2†), confirming the ferroelastic transition at around 495 K. Moreover, based on the cell parameters at 463 and 495 K deduced by extrapolating the fitting lines of variable-temperature cell parameter (Table S6†), the total spontaneous strains were estimated to be 0.018 and 0.061 for the present mmmF2/m and 6/mmmFmmm ferroelastic transitions, respectively (for details, see the ESI†).43,44
It should be emphasized that the ferroelastic Tc values of 463 and 495 K in 2 are much higher than those in other molecular perovskite ferroelastics (Table S7†), such as (1-fluoro-4-methyl-1,4-diazoniabicyclo[2.2.2]octanium)Rb(BF4)3 (ref. 45) (231 and 310 K), (Me3NCH2CH2OH)4[Ni(NCS)6]33 (269 and 360 K), and (cyclopentyltrimethylphosphonium)[Cd(SCN)3]46 (335 and 349 K). On the basis of the comparison between 1 and 2, it is clear that the high thermal stability (Td = 570 K) of 2 paves the way for the multi-step tumbling motions of the organic cations to promote its ultrahigh-Tc ferroelastic transitions. The higher Td of 2 could be ascribed to the higher thermal stability of the Hntp+ cation itself, by considering the fact that (Hntp)Cl has a higher Td (433 K) than (Hnto)Cl (393 K, Fig. S6†).
Hirshfeld surface analyses
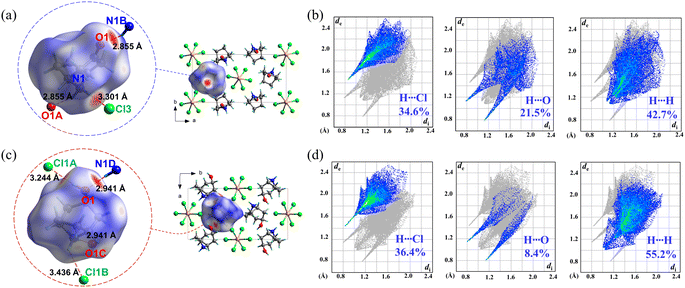
Considering the fact that 1 and 2 have almost the same host inorganic chains but different guest organic cations, their distinct phase-transition behaviours should be mainly attributed to the different intermolecular interactions involving the guests. Therefore, Hirshfeld surface analyses47 were performed on Hnto+ in 1 and Hntp+ in 2α, respectively. As shown in the decomposed fingerprint plots (Fig. 8b and d), approximately 34.6% and 36.4% of the Hirshfeld surface area was associated with H⋯Cl contacts in 1 and 2α, respectively, representing attractive host–guest interactions between the inorganic chains and organic cations. Among them, as indicated by the red spots on the Hirshfeld surface (Fig. 8a and c), the strongest host–guest interaction in 1 is a N–H⋯Cl H-bond with a dN⋯Cl of 3.301 Å, whereas a N–H⋯Cl H-bond with a longer dN⋯Cl of 3.436 Å and an additional O–H⋯Cl H-bond (dO⋯Cl = 3.244 Å) are the main host–guest interactions in 2α. These facts suggest that the host–guest interactions in 1 and 2α are not significantly different.On the other hand, the guest–guest interactions between the adjacent organic cations in 1 and 2α are quite different. As revealed by the decomposed fingerprint plots, the proportion of attractive H⋯O contacts decreases from 21.5% in 1 to 8.4% in 2α, while the proportion of repulsive H⋯H contacts increases from 42.7% in 1 to 55.2% in 2α. In addition, the N⋯O distances of the N–H⋯O H-bonds, which are the strongest attractive guest–guest interaction, are 2.855 Å and 2.941 Å in 1 and 2α, respectively. That is, the subtle change in the organic cations of 1 and 2, i.e., from Hnto+ with a carbonyl group to Hntp+ with a hydroxyl group, weakens the attractive interactions while enhancing the repulsive ones for the adjacent guest cations.
It seems that the stronger intermolecular interactions in 1 establish higher energy barriers for the free rotation of the Hnto+ cation and should yield a higher Tc for the order–disorder transition. However, this potential Tc is higher than the relatively low Td (480 K), and thus the crystalline phase transition could not be observed before decomposition. In contrast, the introduction of a hydroxyl group subtly changes the guest–guest interactions and brings about appropriately competitive but balanced intermolecular interactions to establish multiple interconvertible crystalline states with proper activation energy barriers to yield structural phase transitions for 2.
Conclusions
In summary, by presenting two new hexagonal molecular perovskites, i.e., 1 and 2, we demonstrate a simple design principle to obtain ultrahigh-Tc ferroelastic phase transitions. They consist of the same host inorganic chain but subtly different guest organic cations, i.e., Hnto+ in 1 and Hntp+ in 2. In comparison to the rigid carbonyl group that participates in stronger H-bonds in 1, the flexible hydroxyl group subtly changes the guest–guest interactions to yield a delicate balance of intermolecular interactions, finally endowing 2 with an enhanced thermal stability and multiple crystalline phase transitions. In detail, 2 exhibits three structural phase transitions, including two ferroelastic transitions with ultrahigh Tc values of 463 K and 495 K, respectively, whereas 1 does not undergo crystalline phase transition before its decomposition at a relatively lower Td. In this sense, compared with halogen modification, which usually causes a decrease in Td, hydroxyl modification may be more reliable to maintain a high Td while also facilitating phase transition owing to the complicated intermolecular interactions involving the hydroxyl group. This work not only presents a rare example of dual ferroelasticity with ultrahigh Tc values, but also demonstrates that the molecular modification strategy of hydroxyl introduction has a positive effect in designing high-Tc ferroic materials in hybrid crystals.Data availability
The data that support the findings of this study are available from the corresponding author upon reasonable request.Author contributions
W.-X. Zhang, X.-M. Chen, and H. Y. conceived the idea, designed the experiments, and co-wrote the manuscript. H. Y. performed the synthesis experiments, the Hirshfeld analysis, and the measurement of DSC, dielectric permittivity, crystal structure, and ferroelastic domains. X.-X. Chen and L.-D. Xuan assisted in the Pawley and Rietveld refinements. Y.-B. Li, B.-Q. Zhao and Y. Z. offered advice on experimental design.Conflicts of interest
There are no conflicts to declare.Acknowledgements
This work was supported by NSFC (22071273 and 21821003) and Local Innovative and Research Teams Project of Guangdong Pearl River Talents Program (2017BT01C161).Notes and references
- E. K. H. Salje, Annu. Rev. Mater. Res., 2012, 42, 265–283 CrossRef CAS.
- S. H. Baek, H. W. Jang, C. M. Folkman, Y. L. Li, B. Winchester, J. X. Zhang, Q. He, Y. H. Chu, C. T. Nelson, M. S. Rzchowski, X. Q. Pan, R. Ramesh, L. Q. Chen and C. B. Eom, Nat. Mater., 2010, 9, 309–314 CrossRef CAS.
- M. Liu, B. M. Howe, L. Grazulis, K. Mahalingam, T. Nan, N. X. Sun and G. J. Brown, Adv. Mater., 2013, 25, 4886–4892 CrossRef CAS.
- N. Balke, S. Choudhury, S. Jesse, M. Huijben, Y. H. Chu, A. P. Baddorf, L. Q. Chen, R. Ramesh and S. V. Kalinin, Nat. Nanotechnol., 2009, 4, 868 CrossRef PubMed.
- G. F. Nataf, M. Guennou, J. M. Gregg, D. Meier, J. Hlinka, E. K. H. Salje and J. Kreisel, Nat. Rev. Phys., 2020, 2, 634 CrossRef.
- Z.-H. Sun, X.-Q. Wang, J.-H. Luo, S.-Q. Zhang, D.-Q. Yuan and M.-C. Hong, J. Mater. Chem. C, 2013, 1, 2561–2567 RSC.
- K. Dorr, Nat. Mater., 2016, 15, 497–498 CrossRef.
- A. Alsubaie, P. Sharma, J. H. Lee, J. Y. Kim, C. H. Yang and J. Seidel, ACS Appl. Mater. Interfaces, 2018, 10, 11768–11775 CrossRef CAS.
- K. Aizu, J. Phys. Soc. Jpn., 1969, 27, 387–396 CrossRef CAS.
- C. Hill, M. C. Weber, J. Lehmann, T. Leinen and M. Guennou, APL Mater., 2020, 8, 081108 CrossRef CAS.
- K. Aizu, A. Kumada, H. Yumoto and S. Ashida, J. Phys. Soc. Jpn., 1969, 27, 511 CrossRef CAS.
- S. Kamba, J. Pokorny, V. Porokhonskyy, J. Petzelt, M. P. Moret, A. Garg, Z. H. Barber and R. Zallen, Appl. Phys. Lett., 2002, 81, 1056–1058 CrossRef CAS.
- Z.-Y. An, S.-S. Xie, N. Zhang, J. Zhuang, A. M. Glazer, W. Ren and Z.-G. Ye, APL Mater., 2021, 9, 030702 CrossRef CAS.
- A. Piecha-Bisiorek, K. Mencel, V. Kinzhybalo, A. Szota, R. Jakubas, W. Medycki and W. Zawrocki, CrystEngComm, 2018, 20, 2112–2119 RSC.
- Z.-X. Zhang, C.-Y. Su, J. Li, X.-J. Song, D.-W. Fu and Y. Zhang, Chem. Mater., 2021, 33, 5790–5799 CrossRef CAS.
- M. Bari, A. A. Bokov and Z.-G. Ye, J. Mater. Chem. C, 2021, 9, 3096–3107 RSC.
- X.-X. Chen, D.-X. Liu, Y.-P. Gong, S.-S. Wang, W.-X. Zhang and X.-M. Chen, Inorg. Chem., 2022, 61, 2219–2226 CrossRef.
- X.-X. Chen, X.-Y. Zhang, D.-X. Liu, R.-K. Huang, S.-S. Wang, L.-Q. Xiong, W.-X. Zhang and X.-M. Chen, Chem. Sci., 2021, 12, 8713 RSC.
- Q.-R. Meng, W.-J. Xu, W.-H. Hu, H. Ye, X.-X. Chen, W. Yuan, W.-X. Zhang and X.-M. Chen, Chem. Commun., 2021, 57, 6292 RSC.
- S.-G. Han, X.-T. Liu, J. Zhang, C.-M. Ji, Z.-Y. Wu, K.-W. Tao, Y.-Y. Wang, Z.-H. Sun and J.-H. Luo, J. Mater. Chem. C, 2018, 6, 10327–10331 RSC.
- H.-Y. Zhang, C.-L. Hu, Z.-B. Hu, J.-G. Mao, Y. Song and R.-G. Xiong, J. Am. Chem. Soc., 2020, 142, 3240–3245 CrossRef CAS PubMed.
- W. Yuan, Y. Zeng, Y.-Y. Tan, J.-H. Zhou, W.-J. Xu, W.-X. Zhang and X.-M. Chen, Chem. Commun., 2019, 55, 8983–8986 RSC.
- W.-J. Xu, Y. Zeng, W. Yuan, W.-X. Zhang and X.-M. Chen, Chem. Commun., 2020, 56, 10054–10057 RSC.
- S.-Q. Lu, Z.-X. Zhang, H. Cheng, P.-F. Li, W.-Q. Liao and R.-G. Xiong, Angew. Chem., Int. Ed., 2020, 59, 9574–9578 CrossRef.
- Y.-J. Cao, L. Zhou, P.-P. Shi, Q. Ye and D.-W. Fu, Chem. Commun., 2019, 55, 8418–8421 RSC.
- L. He, L. Zhou, P.-P. Shi, Q. Ye and D.-W. Fu, Chem. Mater., 2019, 31, 10236–10242 CrossRef CAS.
- J.-X. Gao, X.-N. Hua, P.-F. Li, X.-G. Chen and W.-Q. Liao, J. Phys. Chem. C, 2018, 122, 23111–23116 CrossRef.
- A. Polyalov, A. H. Arkenbout, J. Baas, G. R. Blake, A. Meetsma, A. Caretta, P. H. M. Loosdrecht and T. T. M. Palstra, Chem. Mater., 2012, 24, 133–139 CrossRef.
- Y.-P. Gong, X.-X. Chen, G.-Z. Huang, W.-X. Zhang and X.-M. Chen, J. Mater. Chem. C, 2022, 10, 5482 RSC.
- S. Kassou, A. Kaiba, P. Guionneau and A. Belaaraj, J. Struct. Chem., 2016, 57, 737–743 CrossRef.
- T.-T. Ying, Y.-K. Li, N. Song, Y.-H. Tan, Y.-Z. Tang, J.-C. Zhuang, H. Zhang and L.-J. Wang, Chem.–Asian J., 2021, 16, 3664–3668 CrossRef CAS PubMed.
- D.-X. Liu, Z.-H. Yu, X.-X. Chen, W.-X. Zhang and X.-M. Chen, Chin. Chem. Lett., DOI:10.1016/j.cclet.2022.03.033.
- D.-X. Liu, X.-X. Chen, Z.-M. Ye, W.-X. Zhang and X.-M. Chen, Sci. China Mater., 2022, 65, 263–267 CrossRef CAS.
- W.-J. Xu, P.-F. Li, Y.-Y. Tang, W.-X. Zhang, R.-G. Xiong and X.-M. Chen, J. Am. Chem. Soc., 2017, 139, 6369–6375 CrossRef CAS PubMed.
- W.-H. Hu, W.-J. Xu, Q.-R. Meng, X.-W. Zhang, C.-T. He, W.-X. Zhang and X.-M. Chen, Chem. Commun., 2019, 55, 11555–11558 RSC.
- W. Li, D.-X. Liu, W.-Y. Hu, Q.-Y. Liu, Z.-Y. Du, C.-T. He, W.-X. Zhang and X.-M. Chen, Chin. J. Chem., 2022, 40, 1917–1923 CrossRef CAS.
- O. V. Dolomanov, L. J. Bourhis, R. J. Gildea, J. A. K. Howard and H. Puschmann, J. Appl. Crystallogr., 2009, 42, 339–341 CrossRef CAS.
- G. M. Sheldrick, Acta Crystallogr., Sect. C: Struct. Chem., 2015, 71, 3–8 Search PubMed.
- J. Harada, M. Ohtani, Y. Takahashi and T. Inabe, J. Am. Chem. Soc., 2015, 137, 4477–4486 CrossRef CAS.
- M. J. Cliffe and A. L. Goodwin, J. Appl. Crystallogr., 2012, 45, 1321–1329 CrossRef CAS.
- L. O. Alimi, P. Lama, V. J. Smith and L. J. Barbour, CrystEngComm, 2018, 20, 631–635 RSC.
- K. Yadava, G. Gallo, S. Bette, C. E. Mulijanto, D. P. Karothu, I.-H. Park, R. Medishetty, P. Naumov, R. E. Dinnebier and J. J. Vittal, IUCrJ, 2020, 7, 83–89 CrossRef PubMed.
- K. Aizu, J. Phys. Soc. Jpn., 1970, 28, 706–716 CrossRef.
- M. A. Carpenter, E. K. H. Salje and A. Graeme-Barber, Eur. J. Mineral., 1998, 10, 621–691 CrossRef.
- S.-N. Cheng, K. Ding, T. Zhang, Z.-X. Zhang, C.-Y. Su, J.-Z. Ge, Y. Zhang and D.-W. Fu, Chem.–Eur. J., 2021, 27, 17655–17659 CrossRef CAS PubMed.
- L. Zhou, R.-X. Li, P.-P. Shi, Q. Ye and D.-W. Fu, Inorg. Chem., 2020, 59, 18174–18180 CrossRef CAS PubMed.
- M. A. Spackman and D. Jayatilaka, CrystEngComm, 2009, 11, 19–32 RSC.
Footnote |
| † Electronic supplementary information (ESI) available: Additional data and two videos of ferroelastic domain evolution. CCDC 2179537–2179541. For ESI and crystallographic data in CIF or other electronic format see DOI: https://doi.org/10.1039/d2sc04112j |
| This journal is © The Royal Society of Chemistry 2022 |

