 Open Access Article
Precisely synthesized LiF-tipped CoF2-nanorod heterostructures improve energy storage capacities†
Siyuan
Wang
a,
Hao
Fu
ab,
Jiamin
Ma
a,
Xiaomeng
Shi
a,
Huimin
Wang
c,
Zongyou
Yin
 *d,
Shuai
Zhang
a,
Mengdie
Jin
a,
Ziyun
Zhong
a,
Xinyun
Zhai
a and
Yaping
Du
 *a
*a
aTianjin Key Lab for Rare Earth Materials and Applications, Center for Rare Earth and Inorganic Functional Materials, Smart Sensing Interdisciplinary Science Center, School of Materials Science and Engineering, National Institute for Advanced Materials, Nankai University, Tianjin, 300350, China. E-mail: ypdu@nankai.edu.cn
bCollege of Chemistry, Nankai University, Tianjin, 300071, China
cInstitute of New Energy Material Chemistry, School of Materials Science and Engineering, Nankai University, Tianjin, 300350, China
dResearch School of Chemistry, Australian National University, Canberra 2601, ACT, Australia. E-mail: zongyou.yin@anu.edu.au
First published on 7th October 2022
Abstract
CoF2, with a relatively high theoretical capacity (553 mA h g−1), has been attracting increasing attention in the energy storage field. However, a facile and controllable synthesis of monodispersed CoF2 and CoF2-based nano-heterostructures have been rarely reported. In this direction, an eco-friendly and precisely controlled colloidal synthesis strategy to grow uniformly sized CoF2 nanorods and LiF-tipped CoF2-nanorod heterostructures based on a seeded-growth method is established. The unveiled selective growth of LiF nanoparticles onto the two end tips of the CoF2 nanorods is associated with the higher energy of tips, which favors the nucleation of LiF nanocrystals. Notably, it was found that LiF could protect CoF2 from corrosion even after 9 months of aging. In addition, the as-obtained heterostructures were employed in supercapacitors and lithium sulfur batteries as cathode materials. The heterostructures consistently exhibited higher specific capacities than the corresponding two single components in both types of energy storage devices, making it a potential electrode material for energy storage applications.
Introduction
Heterostructures with two or more components, which possess synergistic chemical and physical properties than individual components, have always been attracting the interest of researchers.1–4 Heterojunctions within these structures may endow better electrical conductivity5 and faster ionic transport, benefiting advanced applications in catalysis6–8 and electrochemistry.9,10 Although many studies have been conducted on the construction of heterostructures, the controlled synthesis of high-quality heterostructures through colloidal chemistry has always been challenging.11–13It is known that the oxides, sulfides, and phosphides of cobalt have been widely used in energy storage devices and researchers have designed some efficient strategies for boosting their performance. Therefore, the development of synthesis strategies for heterostructures was taken widely as a feasible and efficient method, including Co3O4/CoMoO4 for lithium-ion batteries,14 CoO/Co–Cu–S for hybrid supercapacitors,15 Co9S8/CoO for lithium sulfur batteries,16 CoP/Co2P for magnesium/seawater batteries,17 to name a few, and the hybrid components mentioned above exhibited better performance than their single components.
In addition to the cobalt compounds mentioned above, CoF2, which was used for Li(Na)-ion batteries as a cathode material because of its relatively high theoretical capacity (553 mA h g−1), has attracted the attention of researchers recently.18–21 However, the poor conductivity and short-term cycles limit its further applications. In order to improve the performance of CoF2 as an electrode material, some strategies have been reported.20,22,23 Evidently, it has been challenging to obtain monodispersed CoF2 nanostructures according to the previously reported synthetic methods. Additionally, in these wet chemical synthesis methods, environmentally unfriendly HF and NH4F were always used as fluoride sources or TOPO (trioctyl phosphorus oxide) solvents. On the other hand, CoF2 prepared through annealing encounters the size uniformity issue and cannot provide an ideal building block for further nanoarchitecturing (Table S1†). To sum up, a precise green synthesis of CoF2 with functional nano-heterostructures has been rarely reported to date, which is probably associated with its strong ionic bonds, unconducive to the construction of heterostructures.24
In this study, monodispersed CoF2 nanorods were synthesized by developing a facile colloidal synthesis strategy using trifluoroacetates as precursors. Then, the CoF2 nanorods were used as the template for constructing the CoF2–LiF rod-like heterostructure by injecting a lithium trifluoroacetate solution. The heterostructure was composed of CoF2 nanorods and LiF nanoparticles growing at the two end tips of the rod. Importantly, the morphology of heterostructures could be controlled via adjusting the amount and timing of the injected lithium trifluoroacetate solution. The formation mechanism of heterostructures was investigated in detail, and it was found that the LiF particles preferentially grew at the tips of CoF2 nanorods because of the higher energy compared with that of the body. Furthermore, the heterostructure was applied in supercapacitors and lithium sulfur batteries and consistently manifested a higher specific capacity than the two single components, making it a potential electrode material for energy storage devices.
Results and discussion
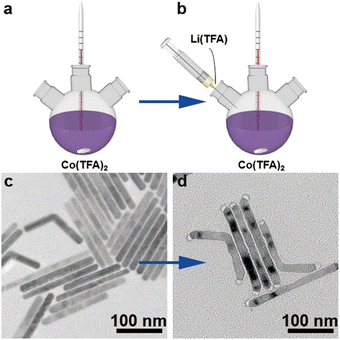
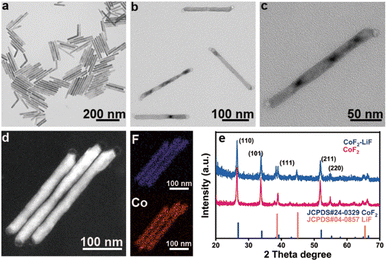
The synthesis process of rod-like CoF2 and CoF2–LiF heterostructures is shown in Scheme 1. 1 mmol of Co(TFA)2 (cobalt trifluoroacetat) was dissolved in 3 mL of OA (oleic acid), 3 mL of OM (oleylamine) and 6 mL of ODE (1-octadecene) with vigorous stirring at room temperature to form a homogeneous solution. Then, the purple solution was heated to 120 °C and kept for 0.5 h under vacuum to remove dissolved water and oxygen from the solvents. Next, nitrogen was introduced and the solution was heated rapidly to 320 °C and maintained for 1 h to harvest CoF2 nanorods (Scheme 1a). At this moment, 2 mL (OA/OM/ODE = 0.5/0.5/1 mL) of solution B (lithium trifluoroacetate solution) was injected rapidly and reacted for 5 min to obtain CoF2–LiF heterostructures (Scheme 1b). Scheme 1c and 1d show the TEM (transmission electron microscope) images of products obtained before and after the injection of solution B. It could be seen that particles grew at both the tips of nanorods after injecting 2 mL of solution B with a well retained rod-like morphology for heterostructures.The magnified TEM image of CoF2 (Fig. 1a) shows a uniform rod-like morphology with length and diameter around 180 nm and 10 nm, respectively (ESI, Fig. S1†). The self-assembly behavior of the nanorods indicates their high uniformity. Fig. 1b shows the TEM image of the products after solution B 0.05 (details shown in the Experimental section) was injected. It is evident that the products still present the rod-like morphology without other byproducts. Fig. 1c indicates that the products consist of two parts: body and tips. The dark field TEM image (Fig. 1d) further verifies the formation of heterostructures. Elemental mapping results confirm that F and Co elements co-exist at the body parts (note that Li element cannot be detected by EDS (energy-dispersive X-ray spectroscopy)). The lattice fringes were obtained from HR-TEM (high-resolution TEM) (ESI, Fig. S2†), and the interplanar distance of 0.20 nm could be ascribed to the (200) facet of LiF and 0.33 nm attributable to the (110) facet of CoF2. Furthermore, the signal of Li could be detected through XPS (X-ray photoelectron spectroscopy), indicating the presence of Li (ESI, Fig. S3†). XRD (X-ray diffraction) patterns of samples corresponded well to the standard cards of CoF2 (JCPDS# 24-03289) and LiF (JCPDS # 04-0857), indicating that tetragonal CoF2 (a = b = 4.695 Å, c = 3.179 Å, α = β = γ = 90°) and cubic LiF (a = b = c = 4.027 Å, α = β = γ = 90°) have been synthesized (Fig. 1e).
A series of condition dependent experiments were designed to uncover the growth mechanism and simultaneously optimize the synthesis process for the monodispersed CoF2 nanorods. TEM images of products obtained under different temperatures are shown in Fig. S4 (ESI†). When the reaction temperature was 260 °C, the products had no clear-defined shapes (ESI, Fig. S4a†). When the temperature increased to 300 °C, it could be observed that most of the products were nanorods but were accompanied by some small particles (ESI, Fig. S4b†). Besides, the concentration of precursors played an important role in the formation of high-quality CoF2 nanorods. When solvent components (OA/OM/ODE = 10/10/20 mmol) and temperature (320 °C) were fixed, using 0.5 mmol of Co(TFA)2 for the reaction, irregular nanoparticles were obtained (ESI, Fig. S5a†). When 2 mmol of Co(TFA)2 was added, nanorods and nanoparticles coexisted in the products (ESI, Fig. S5b†). Therefore, 1 mmol of Co(TFA)2 was the optimized concentration for the preparation of uniform CoF2 nanorods in this synthesis.
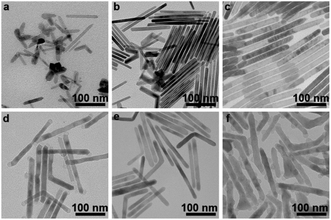
Time-dependent experiments were further carried out to study the formation process of CoF2 nanorods (Fig. 2). At the beginning of the reaction (0 min), no precipitation was obtained after centrifugation, which could be due to the size of the products being too small to separate from dispersion. When the reaction time was extended to 20 min, nanorods started to appear (Fig. 2a). However, the morphology and size of products were not uniform at this stage. When solution A (details shown in the Experimental section) was kept at 320 °C for 40 min, nanorods in the products and a few irregular byproducts were obtained (Fig. 2b). Till the reaction was carried out for 60 min, the products consisted of uniform CoF2 nanorods (Fig. 2c), hinting that Ostwald ripening was well controlled.25 Further, solution B 0.05 was injected into solution A rapidly and kept for 5 min, and the LiF nanoparticles grew at both the tips of CoF2 nanorods (Fig. 2d). Further, the growth time for the reaction with the injected solution B 0.05 was extended to 1 h, and there was no particle growth around the sides of CoF2 nanorods (ESI, Fig. S6†). Therefore, the amount of Li(TFA) injected had a distinct effect on the morphology of products. When solution B 0.01 was injected, no LiF particles were observed on CoF2 nanorods (Fig. 2e). When solution B 0.1 (details shown in the Experimental section) was injected into solution A, LiF particles grew around CoF2 nanorods as well as at both the tips (Fig. 2f). Notably, the LiF particles were not observed growing at just one tip, indicating that the two tips possess equal opportunity to allow the nucleation-to-growth of LiF particles on the top.
What products would be obtained by injecting Li(TFA) solution before the formation of CoF2 nanorods? Uniform sphere-like heterostructures were synthesized as shown in Fig. S7 (ESI†). In addition, with the increase in the concentrations of precursors, the amounts of corresponding components in heterostructures also increased (ESI, Fig. S8†). In order to verify the good affinity between CoF2 and LiF, the Co(TFA)2 solution was injected into the Li(TFA) solution and kept for 30 min. In addition, the TEM image shows that the sphere-like heterostructures were still obtained (ESI, Fig. S9†). Furthermore, CoF2–LiF heterostructures were synthesized by a one-pot method instead of the hot injection method. Further, the TEM image shows that the morphology and size of products are less uniform (ESI, Fig. S10a†), which could be due to the interference of nucleation and growth between the products. Interestingly, when the given molar ratio of Co(TFA)2/Li(TFA) was set at 2/1, bamboo-like heterostructures could be obtained (ESI, Fig. S10b and c†). It could be seen that the products consisted of CoF2 and LiF alternately, and the connecting part was LiF, which further indicated that the tips of CoF2 were easier to combine with LiF. Finally, the role of temperature and solvents was studied. In order to avoid the irregular nanoparticle growth at lower temperatures, the temperature was kept at 320 °C (ESI, Fig. S11†), where the heterostructure formation was dominated by thermodynamics. As observed, when the amount of either OA or OM increased, irregular heterostructures and particles were obtained. (ESI, Fig. S12a and b†). Additionally, there were nanosheets and tiny particles obtained without ODE (ESI, Fig. S12c†). To sum up, the optimized solvent components of OA/OM/ODE = 10/10/20 mmol are responsible for the monodispersed CoF2 nanorod growth below 320 °C.
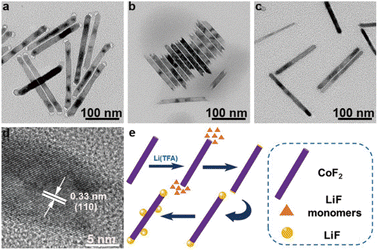
Impressively, the morphology of heterostructures was intact even after more than 9 months of storage (Fig. 3a). In contrast, both the ends of pure CoF2 nanorods were corroded (Fig. 3b). This result strongly proved that LiF could effectively protect CoF2. On the other hand, the two ends of pure CoF2 rods were more active than the main body because either the formation of heterostructures or the corrosion started from the two tips of nanorods. Although LiF could not be found at the tips of CoF2 nanorods from the TEM image (Fig. 3c) when solution B 0.01 was injected into solution A, the two tips of this sample were not corroded after 9 months, implying that both the tips of CoF2 nanorods were covered by LiF actually. The lattice fringes of 0.33 nm correspond to that of the (110) facet of CoF2 (Fig. 3d). Based on the above mentioned results, a mechanism for the CoF2–LiF heterostructure formation is described (Fig. 3e): the tips of CoF2 nanorods have higher energy, even when a little amount of Li(TFA) solution (0.01 mmol) is injected, and LiF particles would grow at the two tips of CoF2 nanorods. This may result from the decomposition products of Li(TFA) attacking the tips of CoF2 nanorods preferentially, forming nucleation sites for the LiF growth.26,27 Further, the LiF nanoparticles continued to grow when there were excess amounts of Li(TFA) (0.05 mmol) in the reaction system. Furthermore, the LiF particles would nucleate and grow at the body of CoF2 nanorods under the supply of more Li(TFA) (increased to 0.1 mmol) after the two tip ends were covered by LiF.
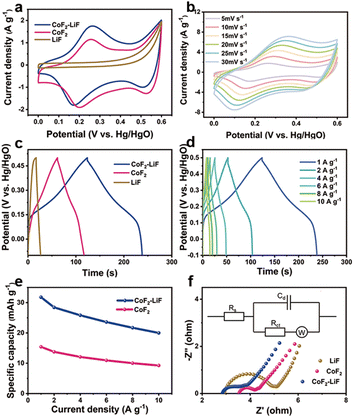
The electrochemical performances of samples (LiF (details shown in the ESI, Fig. S13†), CoF2, and CoF2–LiF) as electrode materials were investigated using cyclic voltammetry (CV), galvanostatic charge–discharge (GCD), and electrochemical impedance spectroscopy (EIS) characterizations. The CV curves of samples measured at a scan rate of 5 mV s−1 are shown in Fig. 4a. Apparently, the rod-like CoF2–LiF heterostructure electrode exhibits larger CV areas than other electrodes, indicating that the heterostructures lead to a higher capacitance.8,28 The three distinct redox peaks of CoF2 nanorods and CoF2–LiF heterostructures indicate that CoF2 undergoes two sequential electron transfer steps (from Co2+ to Co3+ to Co4+), and they possess faradaic battery-type redox capacitive characteristics.29,30Fig. 4b shows the CV curves of the CoF2–LiF heterostructure electrode at scan rates from 5 to 30 mV s−1. All CV curves present a similar profile indicating good circulation reversibility.31 Moreover, the peak currents gradually improve with the increased scan rates, which are mainly related to the polarization of electrodes.32,33 The GCD curves of samples measured at 1 A g−1 quantify their specific capacities as shown in Fig. 4c. The nonlinear GCD curves further confirm the faradaic battery-type redox capacitive behavior, which agrees with CV curves. The CoF2–LiF heterostructure electrode enables longer discharge time than other electrodes, corresponding to a higher capacitance. Fig. 4d demonstrates the GCD curves of CoF2–LiF heterostructures at different current densities. The approximately symmetric charge–discharge curves verify electrochemical reversibility and good rate performance. The specific capacities calculated from the GCD curves are plotted in Fig. 4e. Notably, the CoF2–LiF heterostructure electrode consistently exhibits higher specific capacity than the CoF2 electrode at the same current density. The specific capacity of the CoF2–LiF heterostructures is 32 mA h g−1 (specific capacitance is 200 F g−1) at a current density of 1 A g−1, which is comparable to that has been reported (Table S2†). The cycling stability of CoF2–LiF and CoF2 was also evaluated as shown in Fig. S14 (ESI†), and it can be seen that at both the initial discharge time and the discharge time after 50 cycles, the heterostructure is longer than CoF2, indicating a higher specific capacitance. By calculating the discharge time of CoF2–LiF and CoF2, the specific capacitance after 50 cycles was obtained as 88% and 90%, respectively. Therefore, the cycling stability of the two samples is subequal, and the heterostructures just improve the specific capacitance of CoF2. Fig. 4f shows the EIS spectra in the Nyquist plot, which consists of a semicircle and an inclined line. The semicircle at high frequency reflects internal resistance related to the charge transfer (Rct) between the electrode surface and electrolyte.34,35 The smaller semicircle indicates better electrical conductivity. According to the fitting results (Table S3†), the CoF2–LiF heterostructure electrode has a smaller equivalent series resistance, which means that it had a higher current density at the same voltage. Combined with the reported studies, we suggest that the reason for the better performance of the heterostructures is that the unique heterogeneous architecture could enhance the charge transfer efficiency,36–38 resulting in a higher specific capacity.
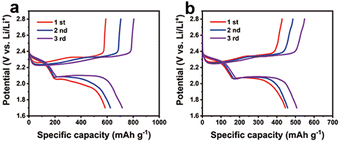
According to the obtained results (the CoF2–LiF heterostructures exhibited higher specific capacity than CoF2), the CoF2–LiF sample with higher electrochemical activity was further studied in the Li–S battery. To date, CoF2, as an electrode material for fluoride–lithium and lithium-ion batteries,18–20,34,39–42 has been rarely reported for Li–S batteries. In this study, the synthesized rod-like CoF2 and heterostructured CoF2–LiF samples were used as additives in sulfur cathode materials for Li–S batteries, and the corresponding discharge–charge tests were performed at room temperature. Fig. 5 shows the galvanostatic discharge–charge curves of Li–S batteries using sulfur cathodes with CoF2–LiF and CoF2 samples, respectively, at 0.1 C. The discharge–charge curves of the two materials are of similar trend, and the specific capacity increases gradually from the first cycle to the third cycle, which may be attributed to the activation process of the sulfur cathode. Fig. 5a shows the specific capacity of CoF2–LiF increasing from 585 mA h g−1 to 716 mA h g−1, which is superior to the specific capacity of CoF2 (i.e., from 445 mA h g−1 to 506 mA h g−1 as shown in Fig. 5b), indicating that the CoF2–LiF heterostructure also improves the electrochemical performance of the Li–S battery. The cycle performance and rate of Li–S battery were evaluated (ESI, Fig. S15†), and the results indicate that the specific capacitance of heterostructures is higher than that of CoF2 at 0.1 C. At different rates, the heterostructures show higher discharge capacity, which may be due to the CoF2–LiF heterostructures accelerating the electron transport and benefiting the electrochemical reaction kinetics of Li–S cells.43–45 Therefore, CoF2–LiF heterostructures could realize better electrochemical activity. Consequently, this method is expected to expand the application of transition metal fluorides to other energy storage devices.
Experimental
Chemicals
Oleic acid (OA) (90%, Sigma-Aldrich), oleylamine (OM) (70%, Sigma-Aldrich), 1-octadecene (ODE) (90%, Aladdin), Co(OH)2 (98%, Meryer), trifluoroacetic acid (TFA) (99%, Macklin), lithium trifluoroacetate (Li(TFA)) (97%, Macklin) n-hexane (AR, Aladdin), deionized water, ethanol (95%, Tianjin Concord Technology Co. Ltd), polytetrafluoroethylene (PTFE) (60%, Xiya Reagent), carbon papers (TGP-H-0600, Toray Industries, Inc.), Ketjen black (ECP 200L), and KOH (95%, Macklin) chemicals were used in for the experiments. All the reagents and solvents were used directly without further purification.Preparation of cobalt trifluoroacetate (Co(TFA)2)
10 mmol of Co(OH)2 and 10 mL of deionized water were weighed and transferred to a 100 mL beaker. Then, the mixture was heated to 50 °C with magnetic stirring. Next, 10 mL of trifluoroacetic acid was dropped and kept for 10 min to form a homogeneous dark red solution. The hot solution was filtered three times to remove impurities and dried to a pink solid at 140 °C. The solid was transferred to a mortar and ground to powder. The final product was stored in a glass bottle and kept in a dryer.Synthesis of CoF2 nanorods
1 mmol of Co(TFA)2 was dissolved in OA/OM/ODE (10/10/20 mmol) in a 50 mL three-neck flask at room temperature. Then, the mixture was heated to 120 °C to remove water and oxygen under vacuum with vigorous magnetic stirring (800 rpm) for 30 min to form a dark purple homogeneous solution. The solution was heated to 320 °C at a heating rate of 20 °C min−1 and kept for 1 h under N2 atmosphere (noted as solution A). After cooling to room temperature, the products were washed with n-hexane/ethanol and centrifuged at 6000 rpm. Further, the precipitate was dispersed in n-hexane by ultrasonication. One drop of this dispersion was taken on a copper grid for morphology characterization.Synthesis of LiF nanoparticles
The synthetic procedure was similar to that for CoF2 nanorods except that the precursor was 1 mmol of Li(TFA) and maintained at 320 °C for 10 min.Synthesis of CoF2–LiF heterostructures
The synthetic procedure was similar to that of CoF2 nanorods except that the solution consisting of 0.01/0.05/0.1 mmol of Li(TFA) and OA/OM/ODE (1.5/1.5/3 mmol) (noted as solution B 0.01/0.05/0.1, respectively) was injected to solution A and kept for 5 min.Electrochemical measurements
The electrochemical characterization of samples was performed in a three-electrode system with 1 M KOH as the electrolyte. A Hg/HgO electrode and platinum plate were used as the reference and counter electrodes, respectively. The working electrode was prepared by mixing samples, ketjen black, and 5% PTFE with a weight ratio of 7![[thin space (1/6-em)]](https://www.rsc.org/images/entities/char_2009.gif) :
:![[thin space (1/6-em)]](https://www.rsc.org/images/entities/char_2009.gif) 2
2![[thin space (1/6-em)]](https://www.rsc.org/images/entities/char_2009.gif) :
:![[thin space (1/6-em)]](https://www.rsc.org/images/entities/char_2009.gif) 1. The mixture was pressed onto a carbon paper (0.5 cm × 1 cm). The cyclic voltammetry (CV), galvanostatic charge–discharge (GCD), and electrochemical impedance spectroscopy (EIS) measurements were performed on an electrochemical workstation (CHI 660E) at room temperature.
1. The mixture was pressed onto a carbon paper (0.5 cm × 1 cm). The cyclic voltammetry (CV), galvanostatic charge–discharge (GCD), and electrochemical impedance spectroscopy (EIS) measurements were performed on an electrochemical workstation (CHI 660E) at room temperature.
Characterization
The morphology and energy-dispersive X-ray spectroscopy (EDS) results of the samples were investigated using transmission electron microscopy (TEM) and high-resolution TEM (HR-TEM) on a HT-7800 (Hitachi, Japan) and JEM-2800 microscope (JEOL, Japan), operating at an acceleration voltage of 200 kV. The crystalline structures of the obtained samples were tested by X-ray diffraction (XRD) on a Rigaku Smart-lab X-ray diffractometer (Rigaku, Japan) with Cu Kα radiation (λ = 1.5406 Å, 20 mA, and 40 kV). X-Ray photoelectron spectroscopy (XPS) was performed using an ESCALAB 250Xi spectrometer using a monochromatic Al Kα X-ray source (hν = 1486.6 eV) as the excitation source (Thermal Scientific, USA).Conclusions
In conclusion, we developed a facile but robust method to precisely synthesize well-defined LiF-tipped CoF2-nanorod heterostructures. The formation mechanism of heterostructures was unveiled, showing that the selective growth of LiF nanoparticles onto the two tips of CoF2 nanorods is associated with the higher energy of the tips, favoring the nucleation-to-growth of LiF nanocrystals. Unexpectedly, LiF was observed to be able to obviously protect CoF2 nanorods from corrosion after long time aging. After the heterostructures were applied as supercapacitor and cathode materials for lithium sulfur batteries, they exhibited higher specific capacity than the corresponding single components, making them a potential electrode material for the next-generation energy storage. This study opens the avenue to construct advanced well-defined heterostructures and extends to various potential applications.Data availability
All data is available in the main text or the ESI.†Author contributions
The manuscript was written through the contributions of all authors. All authors have given approval for the final version of the manuscript.Conflicts of interest
There are no conflicts to declare.Acknowledgements
We gratefully acknowledge the support from the National Natural Science Foundation of China (21971117), the 111 Project (B18030) from China, the Beijing-Tianjin-Hebei Collaborative Innovation Project (19YFSLQY00030), the Outstanding Youth Project of Tianjin Natural Science Foundation (20JCJQJC00130), the Key Project of Tianjin Natural Science Foundation (20JCZDJC00650), the Open Foundation of Guangxi Key Laboratory of Processing for Non-ferrous Metals and Featured Materials (Grant No. 2022GXYSOF07), the Functional Research Funds for the Central Universities, Nankai University (ZB19500202), Tianjin “131” Innovative Talent Team Construction Project, Tianjin Key Lab for Rare Earth Materials and Applications (ZB19500202), and the Haihe Laboratory of Sustainable Chemical Transformations for financial support.References
- H. Wu, O. Chen, J. Zhuang, J. Lynch, D. LaMontagne, Y. Nagaoka and Y. C. Cao, J. Am. Chem. Soc., 2011, 133, 14327–14337 CrossRef CAS PubMed.
- A. M. Fagan, W. R. Jeffries, K. L. Knappenberger and R. E. Schaak, ACS Nano, 2021, 15, 1378–1387 CrossRef CAS PubMed.
- J. M. Hodges, J. R. Morse, J. L. Fenton, J. D. Ackerman, L. T. Alameda and R. E. Schaak, Chem. Mater., 2017, 29, 106–119 CrossRef CAS.
- M. R. Buck, J. F. Bondi and R. E. Schaak, Nat. Chem., 2012, 4, 37–44 CrossRef CAS PubMed.
- Z. Yu, L. Tetard, L. Zhai and J. Thomas, Energy Environ. Sci., 2015, 8, 702–730 RSC.
- W. Zhou, Z. Yin, Y. Du, X. Huang, Z. Zeng, Z. Fan, H. Liu, J. Wang and H. Zhang, Small, 2013, 9, 140–147 CrossRef CAS PubMed.
- H. Zhang, X. Li, A. Hähnel, V. Naumann, C. Lin, S. Azimi, S. L. Schweizer, A. W. Maijenburg and R. B. Wehrspohn, Adv. Funct. Mater., 2018, 28, 1706847 CrossRef.
- B. Wang, C. Tang, H. F. Wang, X. Chen, R. Cao and Q. Zhang, Adv. Funct. Mater., 2019, 31, 1805658 Search PubMed.
- Y. Li, J. Zhang, Q. Chen, X. Xia and M. Chen, Adv. Mater., 2021, 33, 2100855 CrossRef CAS PubMed.
- X. Wang, H. Li, H. Li, S. Lin, W. Ding, X. Zhu, Z. Sheng, H. Wang, X. Zhu and Y. Sun, Adv. Funct. Mater., 2020, 30, 0190302 CrossRef CAS.
- S. B. Varandili, J. Huang, E. Oveisi, G. L. De Gregorio, M. Mensi, M. Strach, J. Vavra, C. Gadiyar, A. Bhowmik and R. Buonsanti, ACS Catal., 2019, 9, 5035–5046 CrossRef CAS.
- J. M. Hodges, J. R. Morse, M. E. Williams and R. E. Schaak, J. Am. Chem. Soc., 2015, 137, 15493–15500 CrossRef CAS PubMed.
- X. Z. Lu, C. Gu, Q. Zhang, L. Shi, S.-K. Han and G.-P. Jin, Inorg. Chem., 2021, 60, 7269–7275 CrossRef CAS PubMed.
- C. He, B. Han, S. Han, Q. Xu, Z. Liang, J. Y. Xu, M. Ye, X. Liu and J. Xu, J. Mater. Chem. A, 2019, 7, 26884–26892 RSC.
- W. Lu, J. Shen, P. Zhang, Y. Zhong, Y. Hu and X. W. Lou, Angew. Chem., Int. Ed., 2019, 58, 15441–15447 CrossRef CAS PubMed.
- N. Wang, B. Chen, K. Qin, E. Liu, C. Shi, C. He and N. Zhao, Nano Energy, 2019, 60, 332–339 CrossRef CAS.
- G. Liu, M. Wang, Y. Xu, X. Wang, X. Li, J. Liu, X. Cui and L. Jiang, J. Power Sources, 2021, 486, 229351 CrossRef CAS.
- M. J. Armstrong, A. Panneerselvam, C. O'Regan, M. A. Morris and J. D. Holmes, J. Mater. Chem. A, 2013, 1, 10667–10676 RSC.
- J. Khan, H. Ullah, M. Sajjad, A. Ali and K. H. Thebo, Inorg. Chem. Commun., 2018, 98, 132–140 CrossRef CAS.
- X. Wang, W. Gu, J. T. Lee, N. Nitta, J. Benson, A. Magasinski, M. W. Schauer and G. Yushin, Small, 2015, 11, 5164–5173 CrossRef CAS PubMed.
- N. Zhang, X. Xiao and H. Pang, Nanoscale Horiz., 2019, 4, 99–116 RSC.
- F. Wu, V. Srot, S. Chen, M. Zhang, P. A. van Aken, Y. Wang, J. Maier and Y. Yu, ACS Nano, 2021, 15, 1509–1518 CrossRef CAS PubMed.
- Y. Huang, X. Li, R. Ding, D. Ying, T. Yan, Y. Huang, C. Tan, X. Sun, P. Gao and E. Liu, Electrochim. Acta, 2020, 329, 135138 CrossRef CAS.
- C. Coughlan, M. Ibáñez, O. Dobrozhan, A. Singh, A. Cabot and K. M. Ryan, Chem. Rev., 2017, 117, 5865–6109 CrossRef CAS PubMed.
- C. B. Whitehead, S. Özkar and R. G. Finke, Chem. Mater., 2019, 31, 7116–7132 CrossRef CAS.
- Y. P. Du, Y. W. Zhang, Z. G. Yan, L. D. Sun, S. Gao and C. H. Yan, Chem. - Asian J., 2007, 2, 965–974 CrossRef CAS PubMed.
- Y. P. Du, X. Sun, Y. W. Zhang, Z. G. Yan, L. D. Sun and C. H. Yan, Cryst. Growth Des., 2009, 9, 2013–2019 CrossRef CAS.
- Y. Wang, Y. Liu, H. Wang, W. Liu, Y. Li, J. Zhang, H. Hou and J. Yang, ACS Appl. Energy Mater., 2019, 2, 2063–2071 CrossRef CAS.
- H. Liu, J. Zhu, Z. Li, Z. Shi, J. Zhu and H. Mei, Chem. Eng. J., 2021, 403, 126325 CrossRef CAS.
- C. Y. Lee, Z. Su, K. Lee, H. Tsuchiya and P. Schmuki, Chem. Commun., 2014, 50, 7067–7070 RSC.
- Y. Lei, J. Li, Y. Wang, L. Gu, Y. Chang, H. Yuan and D. Xiao, ACS Appl. Mater. Interfaces, 2014, 6, 1773–1780 CrossRef CAS PubMed.
- J. Ma, J. Xia, Z. Liang, X. Chen, Y. Du and C. H. Yan, Small, 2021, 17, 2104423 CrossRef CAS PubMed.
- Y. Lan, H. Zhao, Y. Zong, X. Li, Y. Sun, J. Feng, Y. Wang, X. Zheng and Y. Du, Nanoscale, 2018, 10, 11775–11781 RSC.
- F. Wu, V. Srot, S. Chen, M. Zhang, P. A. van Aken, Y. Wang, J. Maier and Y. Yu, ACS Nano, 2021, 15, 1509–1518 CrossRef CAS PubMed.
- C. Guo, J. Xie, J. Wang, L. Li, Z. Zhu, L. Xie, Y. Mao and W. Hu, Adv. Energy Mater., 2021, 11, 2003734 CrossRef CAS.
- D. Yu, B. Wu, L. Ge, L. Wu, H. Wang and T. Xu, J. Mater. Chem. A, 2016, 4, 10878–10884 RSC.
- P. Wang, S. Wang, X. Zhang, H. Wang, W. Duan, H. Han and X. Fan, J. Alloys Compd., 2020, 819, 153374 CrossRef CAS.
- P. Zhang, B. Guan, L. Yu and X. W. Lou, Angew. Chem., Int. Ed., 2019, 58, 15441–15447 CrossRef PubMed.
- C. P. Guntlin, T. Zünd, K. V. Kravchyk, M. Wörle, M. I. Bodnarchuk and M. V. Kovalenko, J. Mater. Chem. A, 2017, 5, 7383–7393 RSC.
- Y. T. Teng, S. S. Pramana, J. Ding, T. Wu and R. Yazami, Electrochim. Acta, 2013, 107, 301–312 CrossRef CAS.
- Q. Zhang, Y. T. Huang, X. Chen, A. Pan, Z. Cai, S. Liu and Y. Zhang, J. Alloys Compd., 2019, 805, 539–544 CrossRef CAS.
- Q. Guan, J. Cheng, X. Li, W. Ni and B. Wang, Chin. J. Chem., 2017, 35, 48–54 CrossRef CAS.
- J. Wang, H. Yang, Z. Chen, L. Zhang, J. Liu, P. Liang, H. Yang, X. Shen and Z. X. Shen, Adv. Sci., 2018, 5, 1800621 CrossRef PubMed.
- Z. Li, B. Y. Guan, J. Zhang and X. W. Lou, Joule, 2017, 1, 576–587 CrossRef CAS.
- Z. Chang, H. Dou, B. Ding, J. Wang, Y. Wang, X. Hao and D. R. MacFarlane, J. Mater. Chem. A, 2017, 5, 250–257 RSC.
Footnote |
| † Electronic supplementary information (ESI) available. See DOI: https://doi.org/10.1039/d2sc04008e |
| This journal is © The Royal Society of Chemistry 2022 |

