
 Open Access Article
 This Open Access Article is licensed under a Creative Commons Attribution-Non Commercial 3.0 Unported Licence
Switching between classical/nonclassical crystallization pathways of TS-1 zeolite: implication on titanium distribution and catalysis†
Risheng Bai ab,
Yue Songa,
Lukas Lätschc,
Yongcun Zoua,
Zhaochi Fengd,
Christophe Copéretc,
Avelino Corma*b and
Jihong Yu*ae
ab,
Yue Songa,
Lukas Lätschc,
Yongcun Zoua,
Zhaochi Fengd,
Christophe Copéretc,
Avelino Corma*b and
Jihong Yu*ae
aState Key Laboratory of Inorganic Synthesis and Preparative Chemistry, College of Chemistry, Jilin University, Changchun 130012, China. E-mail: jihong@jlu.edu.cn
bInstituto de Tecnología Química, Universitat Politècnica de València-Consejo Superior de Investigaciones Científicas, Valencia 46022, Spain. E-mail: acorma@itq.upv.es
cDepartment of Chemistry and Applied Biosciences, ETH Zürich, Vladimir-Prelog Weg 1-5/10, 8093 Zürich, Switzerland
dState Key Laboratory of Catalysis, Dalian Institute of Chemical Physics, Chinese Academy of Sciences, Dalian 116023, China
eInternational Center of Future Science, Jilin University, Changchun 130012, China
First published on 29th August 2022
Abstract
In the MFI zeolite crystallization process, the classical crystallization mechanism based upon the addition of silica species is often concomitant with the nonclassical route that is characteristic of the attachment of silica nanoparticle precursors. However, the factors that govern the preferences for each mechanism remain unclear. In this work, we present the impact of switching between these two crystallization pathways on the active sites and the resulting catalytic performance of the titanosilicate TS-1 zeolite. By controlling the self-assembled precursor structures in the early crystallization stage which are mediated by the Ti and H2O in the reaction system, we could achieve the preferred modes of crystal growth of the TS-1 zeolite. We indicate that by directing the predominant crystallization path from the classical to the nonclassical route, it is possible to generate more stable bridging peroxo species upon reaction with hydrogen peroxide, as confirmed by 17O solid-state nuclear magnetic resonance spectroscopy, thus substantially increasing the catalytic performance of the resulting TS-1 for olefin epoxidation.
Introduction
Zeolites are a class of crystalline microporous materials, characterized by well-defined micropore architectures, and have brought breakthrough innovations in heterogeneous catalysis.1–9 The diameter and nature of pores and cavities give rise to the unique shape selectivity of zeolites, e.g., by limiting the diffusion of substrates into and out of zeolites based on their molecular size, or by stabilizing transition states.10–12 These facts have stimulated studies in crystal engineering of zeolites to enhance the accessibility and diffusivity of bulky molecules with larger dimensions and to achieve the “ab initio” design of the channels and cavities needed for stabilizing preestablished transition states.13–16 Meanwhile, controlling the distribution of active sites in zeolites is of paramount importance in improving the catalytic performances. However, at present, there is still a lack of sufficient fundamental knowledge on zeolite nucleation and crystallization that would allow us to prepare zeolites with predictable active sites and catalytic properties.17,18 The lack of systematic understanding of zeolite crystallization mechanisms severely impedes the judicious selection of synthesis conditions.In the past few decades, efforts to elucidate the crystallization mechanism have mainly concentrated on the identification of primary building units in the zeolite synthesis gel, such as the monomers, oligomers, precursors, etc.19–21 Then, based on the species for nucleation and crystal growth, classical and nonclassical crystallization modes have been proposed for zeolite synthesis.22,23 Classical routes usually involve spontaneous nucleation and are defined by the addition of monomers (atoms or molecules) from the growth solution to kink, step, and terrace sites on crystal surfaces, resulting in crystals with smooth surfaces.24 Nonclassical processes encompass the addition and attachment of precursors, which range from oligomers to primary particles or even fully developed nanoparticles, comprising disorder-to-order transformation processes, leading to the formation of crystals with an irregular morphology, rough crystal surfaces, and mesoscopic structures.25,26 Crystallization by particle attachment (CPA)27 is characteristic of a nonclassical mechanism, and has been found in diverse biominerals such as sea urchin spines,28 vertebrate bones,29 mammalian tooth enamel,30 mollusk larval shells,31 proteins,32 magnetite,33 noble metals,34 and zeolites (such as CHA, MFI, LTL, and MTW).23,35–39 Controlling the CPA processes could hence be an efficient method to optimize the physicochemical properties of zeolite crystals. Recent studies regarding the crystal engineering of zeolites have demonstrated that the morphology and size of zeolite crystals can be selectively altered by using zeolite growth modifiers (e.g., amines, polymers, etc.), which could bind to specific facets of zeolite crystals or interact with amorphous precursors, thus promoting or inhibiting the CPA processes.40–42 For instance, the crystal size of SSZ-13 (CHA) can be tailored from 1 μm to 100 nm with polyethylenimine as the zeolite growth modifier or to 20 μm through the modification with poly(diallyldimethylammonium chloride).35
It is worth noting that, in some cases, the classical processes are juxtaposed with nonclassical pathways in governing the formation of crystals through CPA routes. Fig. S1† depicts the putative evolution pathways of silicalite-1 (S-1, MFI) zeolite, comprising the addition of monomers as well as the aggregation and subsequent reconstruction of the as-synthesized and evolved nanoparticles.22,23,43,44 Particularly, the addition of monomers can gradually take the predominant role when decreasing the concentration of precursors.23,45,46 For example, studies by Rimer and co-workers on the crystallization mechanism of silicalite-1 (MFI) zeolite by using in situ atomic force microscopy (AFM) reveal that both silica molecules and silica nanoparticle precursors act as the growth units during crystallization.23 Hence, the aggregation of silica precursors, the disorder-to-order evolution of attached particles, and the addition of silica monomers are concerted events occurring during the whole crystallization process. Recently, Zhang and co-workers further confirmed that the crystallization process of an MFI zeolite in clear solution indeed comprised both aggregative growth of particles and single-molecule condensation, and they also demonstrated that the formation of high order nuclei was the indispensable premise of the fast crystal growth.38 By manipulating the evolution degree of amorphous silica precursors, which could be mediated by the organic structure directing agents in the zeolite synthesis gel, Rimer and co-workers have achieved the regulation of classical and nonclassical growth routes of silicalite-1 zeolite; the more structurally developed the amorphous silica precursor is, the more nonclassical processes are enhanced.44
Here, we have studied the putative crystallization processes of an industrially relevant zeolite TS-1. In this case, it is foreseen that controlling the crystallization may control Ti incorporation and distribution, so that zeolite TS-1 samples can have different catalytic properties despite having the same composition and morphological characteristics. We will show here that the synthesis of TS-1 involves intertwined classical and nonclassical mechanisms. The switch of the predominant crystallization mode of TS-1 zeolite from the addition of monomers to the attachment of nanoparticle precursors can be achieved by controlling the crystallization kinetics, which is done by deliberately controlling the evolution rate of the titanosilicate precursors during synthesis (Fig. 1a). Furthermore, we will show the strong impact of the crystal growth mechanism on the stabilization of key catalytic intermediates and finally, its influence on the catalytic activity of TS-1 for epoxidation of olefins (1-hexene, 2-methyl-2-butene, and cyclohexene) and oxidation of 4,6-dimethyldibenzothiophene. This work demonstrates a facile crystallization pathway regulated route for controlling the structures of active sites in zeolite catalysts to optimize catalytic performance.
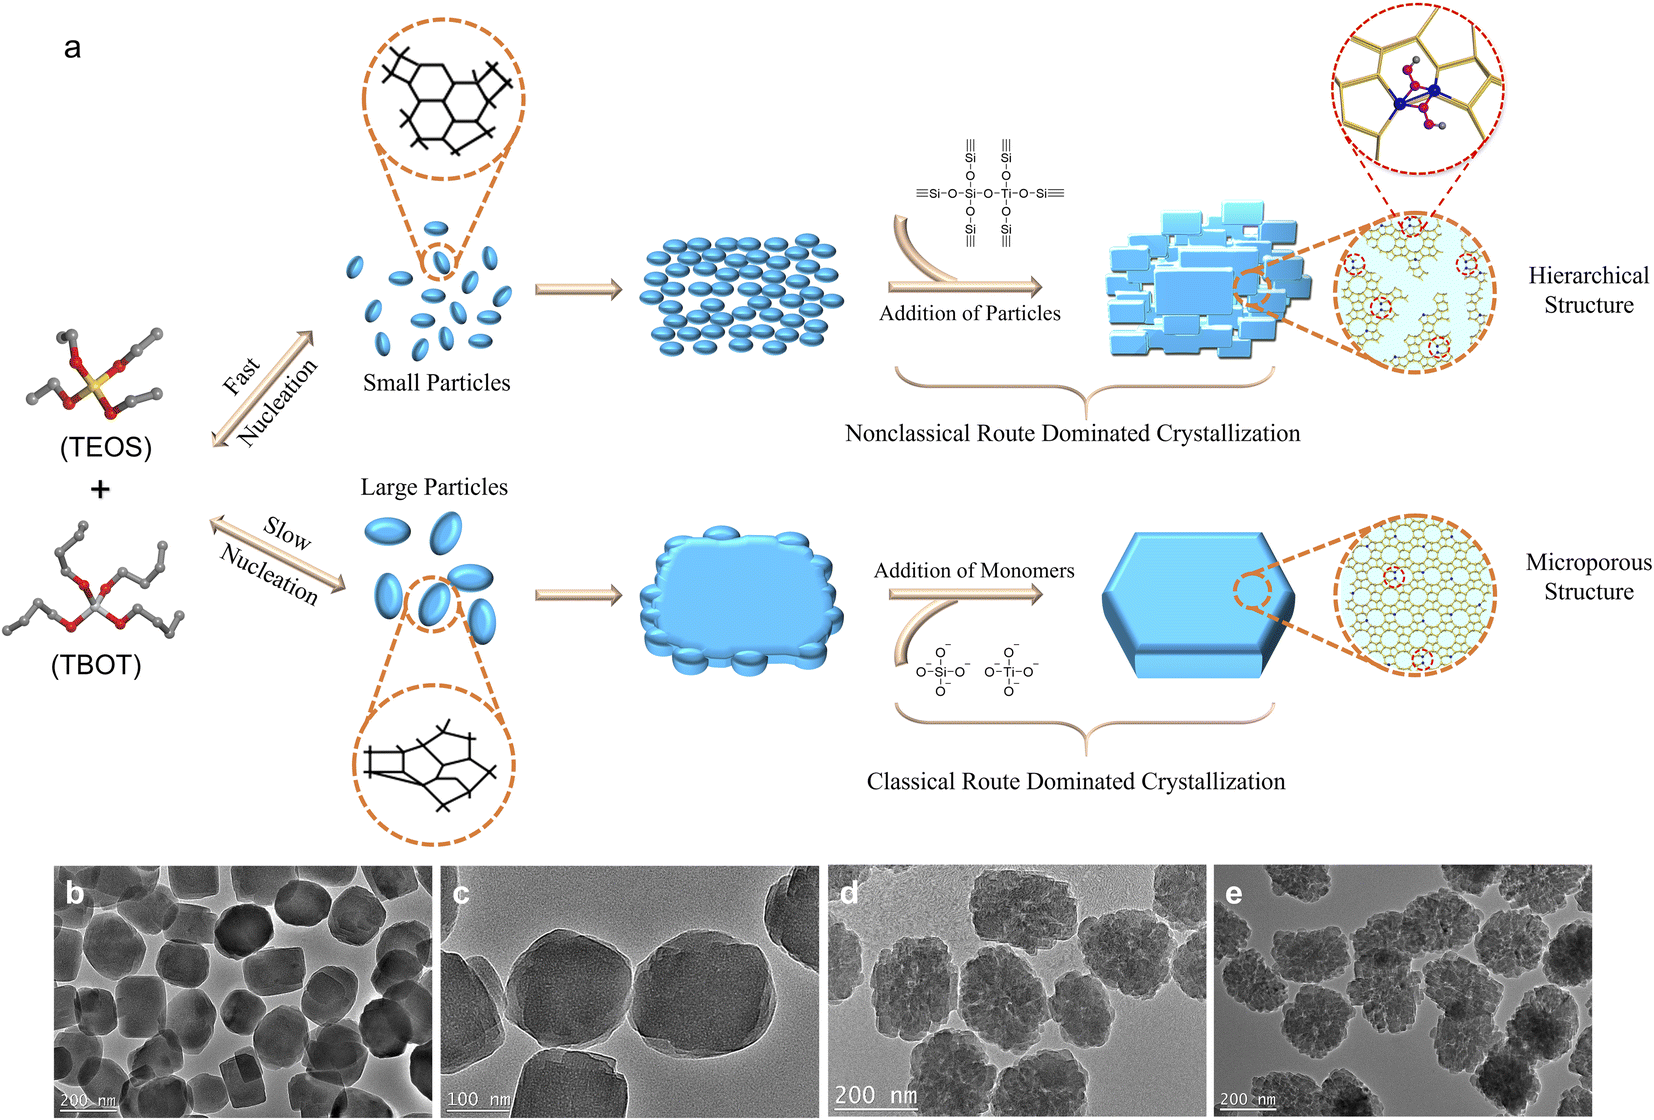 | ||
| Fig. 1 Schematic illustration of the crystallization pathways of TS-1 zeolite through classical and nonclassical processes (a). TEM images of silicalite-1 zeolite (b) and TS-1 zeolites with Ti/Si = 0.01 (c), 0.025 (d), and 0.035 (e) in the synthesis gel. | ||
Results and discussion
As shown in Fig. 1b, the transmission electron microscopy (TEM) image of the silicalite-1 (S-1) zeolite, synthesized by using tetraethyl orthosilicate (TEOS) as the Si source and tetrapropylammonium hydroxide (TPAOH) as the organic template with a molar composition of 1.0SiO2![[thin space (1/6-em)]](https://www.rsc.org/images/entities/char_2009.gif) :0.2TPAOH:10H2O under hydrothermal conditions at 170 °C for 24 h, presents a single particle coffin-shaped morphology with smooth crystal surfaces, suggesting that the classical crystallization pathway is the dominant crystallization route. It is notable that with the introduction of Ti atoms (with tetrabutyl orthotitanate (TBOT) as the Ti source (Ti/Si ratios of 0.01, 0.025, and 0.035 in the synthesis gel)), the obtained TS-1 zeolites consist of highly aggregated small nanocrystals with a rough crystal surface (Fig. 1c–e), showing that the nonclassical growth pathway has prevailed. The more Ti atoms are incorporated, the more loosely the particles are aggregated. X-ray diffraction (XRD) patterns reveal that all the prepared S-1 and TS-1 zeolites have MFI structures and high crystallinity, without detectable impurities or residual amorphous raw materials (Fig. S2†). N2 adsorption–desorption results indicate that with the incorporation of Ti and the increase of Ti amount in the synthesis gel (from Ti/Si = 0 to Ti/Si = 0.035), the external surface area and the mesoporous volume increase from 137 m2 g−1 and 0.23 cm3 g−1 to 203 m2 g−1 and 0.29 cm3 g−1 (Fig. S3 and Table S1,† see also the TEM results for crystal size and shape).
:0.2TPAOH:10H2O under hydrothermal conditions at 170 °C for 24 h, presents a single particle coffin-shaped morphology with smooth crystal surfaces, suggesting that the classical crystallization pathway is the dominant crystallization route. It is notable that with the introduction of Ti atoms (with tetrabutyl orthotitanate (TBOT) as the Ti source (Ti/Si ratios of 0.01, 0.025, and 0.035 in the synthesis gel)), the obtained TS-1 zeolites consist of highly aggregated small nanocrystals with a rough crystal surface (Fig. 1c–e), showing that the nonclassical growth pathway has prevailed. The more Ti atoms are incorporated, the more loosely the particles are aggregated. X-ray diffraction (XRD) patterns reveal that all the prepared S-1 and TS-1 zeolites have MFI structures and high crystallinity, without detectable impurities or residual amorphous raw materials (Fig. S2†). N2 adsorption–desorption results indicate that with the incorporation of Ti and the increase of Ti amount in the synthesis gel (from Ti/Si = 0 to Ti/Si = 0.035), the external surface area and the mesoporous volume increase from 137 m2 g−1 and 0.23 cm3 g−1 to 203 m2 g−1 and 0.29 cm3 g−1 (Fig. S3 and Table S1,† see also the TEM results for crystal size and shape).
To further investigate the role of Ti in guiding the zeolite crystallization pathways, we have also used tetraethyl orthotitanate (TEOT) and tetra-2-ethylhexyl orthotitanate (TEHOT) as the Ti source to prepare TS-1 zeolites (with the gel composition of 1.0SiO2:0.025TiO2:0.2TPAOH:10H2O, at 170 °C for 24 h); the prepared TS-1 zeolite samples are named TS-1-TEOT and TS-1-TEHOT, respectively. XRD patterns confirm that the obtained samples have an MFI structure (Fig. S4†). TEM images of TS-1-TEOT (Fig. 2a), TS-1-TEHOT (Fig. 2c), and TS-1-TBOT (Fig. 1d and 2b, prepared by using TBOT as the Ti source and with the same amount of Ti as TS-1-TEOT and TS-1-TBOT) suggest that the TS-1-TEOT and TS-1-TBOT samples are composed of a larger number of smaller nanoparticles and have rougher crystal surfaces than the TS-1-TEHOT sample. It is noteworthy that the particle size of TS-1-TEHOT is smaller than that of TS-1-TEOT and TS-1-TBOT (prepared with TBOT as the Ti source with Ti/Si = 0.025), which could be related to the steric hindrance caused by the long alkyl group of iso-octanol from TEHOT, affecting the crystal growth to some extent. The zeolite crystal morphology of TS-1-TEOT, TS-1-TBOT, and TS-1-TEHOT samples suggests that the nonclassical crystallization mechanism affects the former two samples more than the last one, as also confirmed by the atomic force microscopy (AFM) images (Fig. 2d–f).
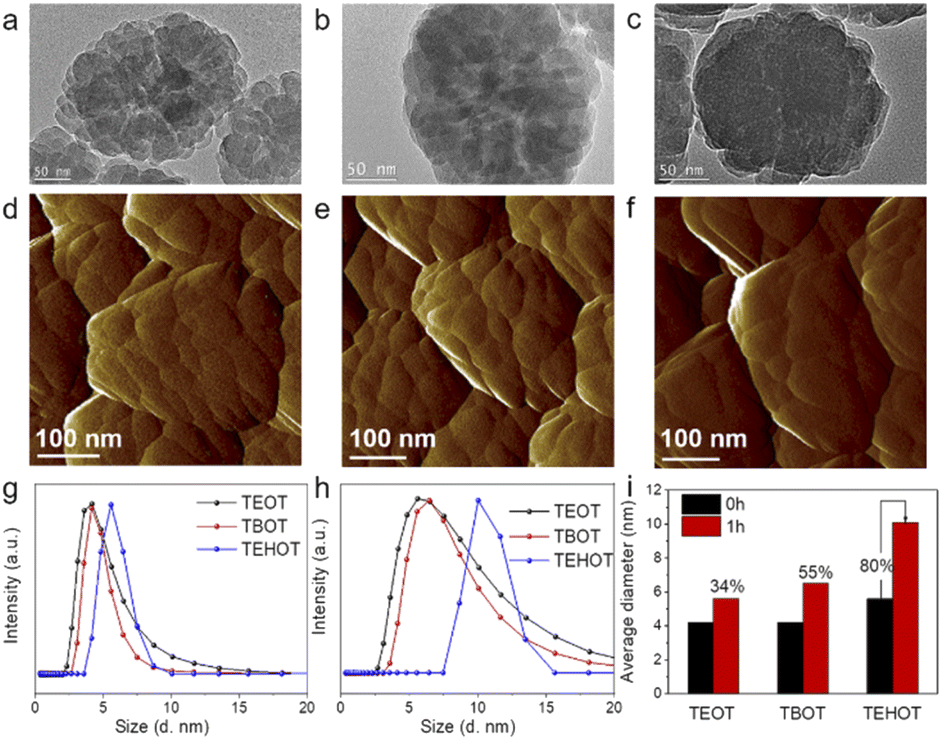 | ||
| Fig. 2 TEM images of TS-1-TEOT (a), TS-1-TBOT (b), and TS-1-TEHOT (c). AFM images of TS-1-TEOT (d), TS-1-TBOT (TS-1-TBOT-10) (e), and TS-1-TEHOT (f). DLS curves of the growth solution suspensions of TS-1-TEOT, TS-1-TBOT, and TS-1-TEHOT, with the synthesis gel composition of 1.0SiO2:0.025TiO2:0.2TPAOH:10H2O, before crystallization (g) and after crystallization for 1 h (h), and the average hydrodynamic diameter changes, showing the increase percentage of the evolved Ti-nanoparticles (i). | ||
In particular, the different titanium sources used in the three synthesis systems exhibit different hydrolysis rates (TEOT > TBOT > TEHOT),47,48 and dynamic light scattering (DLS) was used to monitor the evolution process of the TS-1 zeolite precursors with TEOT, TBOT, and TEHOT as the Ti source; the particle size of the titanosilicate precursors extracted from growth solutions could give information on the evolution process of the soluble monomer and/or oligomer species of silicon, titanium, and titanosilicate. After the hydrolysis of all the raw materials, the average hydrodynamic diameters of the TS-1-TEOT, TS-1-TBOT, and TS-1-TEHOT precursors are nearly 4.2, 4.2, and 5.6 nm, respectively (Fig. 2g); after incubation at 170 °C for 1 h, the three synthesis systems remain water clear, but the precursor particle sizes increase to ∼5.6, 6.5, and 10.1 nm, respectively (Fig. 2h and S5–S7†). To eliminate the influence of the alkyl group length and configuration of the different Ti sources, we calculated the increase percentage of the evolved Ti-nanoparticles which could indicate the change in the microstructure (Fig. 2i).
By evaluating the percentage increase of the nanoparticle size, it may be possible to obtain some insights on the effects of the Ti source on the evolution of the titanosilicate precursors. TEOT and TBOT, which induce the nonclassical crystallization route, yield a size increase percentage of the titanosilicate precursor of 34% and 55%, respectively; while TEHOT, which intertwines more the classical crystallization route with the nonclassical crystallization pathway, yields a nanoparticle size increase percentage of 80%, which is much higher than that of TEOT and TBOT. Next, we also tracked the growth process of the TS-1 zeolite crystals at different crystallization times. The photographs (Fig. S5–S7†) and XRD patterns (Fig. S8–S10†) reveal that the TS-1 zeolite crystals prepared using TEOT and TBOT can be obtained when crystallized for 2 h at 170 °C, while TEHOT slows down the appearance of TS-1 crystals to 3 h. Based on the above observed results, we can conclude that the faster the hydrolysis rate of the Ti sources, the shorter the induction period during the zeolite crystallization process, and hence the faster the zeolite crystal formation. In addition, the TEM images of TS-1-TEOT-2h, TS-1-TBOT-2h, and the TS-1-TEHOT-3h indicate that the smaller titanosilicate precursors formed through the fast hydrolysis of the Ti sources (TEOT and TBOT in this case) tend to build zeolite crystals with relatively loose structures (Fig. S11†). In the TEOT and TBOT synthesis systems, the dominant particle size distributions are smaller than that in the TEHOT case, but extend to diameters largely exceeding the one observed in the TEHOT case, indicating that the precursors in the former two synthesis systems may be at higher degrees of derivatization, that is, more regulated zeolite framework structures can be developed. In the case of TEHOT, the slower crystallization process can be ascribed to two factors: (1) the nanoparticles are less ordered in the system; (2) the hydrolysed product, iso-octanol, may be adsorbed on the surface of the zeolite nucleus or particles, inhibiting the attachment of oligomers or atoms.
It is notable that hydrolysed organics (such as butanol from TBOT and iso-octanol from TEHOT) could be adsorbed on the nanoparticle/crystal surfaces, which may have an impact on the microstructure of the titanosilicate precursor formed in the induction period of the zeolite crystallization process (i.e., on nucleation) and on the subsequent crystallization process, respectively. We synthesized TS-1 zeolite by using TEOT as the Ti source in the presence of additional butanol or iso-octanol (the hydrolysis product of TBOT or TEHOT, respectively). The photograph of TS-1-TEOT-iso-octanol zeolite crystallized at 170 °C for 1 h and 2 h (Fig. S12†) showed that solid products emerged at the crystallization time of 2 h, and the XRD pattern indicated the formation of an MFI zeolite structure (Fig. S13†), which was similar to the pure TEOT synthesis system (zeolite solid products first appear at 2 h of crystallization) and superior to the TEHOT synthesis system (zeolite solid products first appear at 3 h of crystallization), indicating that the zeolite precursor nanoparticles evolved in the TEOT synthesis system might exhibit more ordered microstructures, that is, the adsorption of iso-octanol had little effect on the nucleation process. The scanning electron microscopy (SEM) and TEM images of the obtained zeolite product suggest that the presence of additional butanol or iso-octanol could significantly change the morphology and reduce the particle size of the finally obtained zeolite crystals (Fig. S14 and S15†). In the synthesis system with TEOT only, the obtained zeolite particles are composed of a larger number of smaller nanoparticles, exhibiting rough crystal surfaces and the particle size concentrated around 250 nm. The addition of butanol or iso-octanol to the synthesis gel could reduce the particle size (∼150 nm in both cases of butanol and iso-octanol), but the zeolite particles are still composed of many small nanoparticles, with smoother surfaces in comparison to the pure TEOT sample (Fig. S15†). The above mentioned results suggest that the adsorbed organic molecules could tailor the crystal morphology and slightly regulate the zeolite growth pathway.
Based on the aforementioned results, we can speculate that although the titanosilicate precursors grow slower in size in the TEOT and TBOT synthesis systems, the evolved nanoparticles may exhibit more ordered structures than those in the TEHOT synthesis system, thus leading to faster crystallization processes. Although the hydrolysed molecules, such as butanol and iso-octanol, had some effect on tailoring the crystal morphology, they had little effect on the nucleation process. Moreover, the evolved nanoparticles with more ordered structures may have lower barriers to the attachment to crystals, facilitating the nonclassical crystallization processes, which is in accordance with the characteristic differences in the crystal morphology (Fig. 1 and 2).23,44
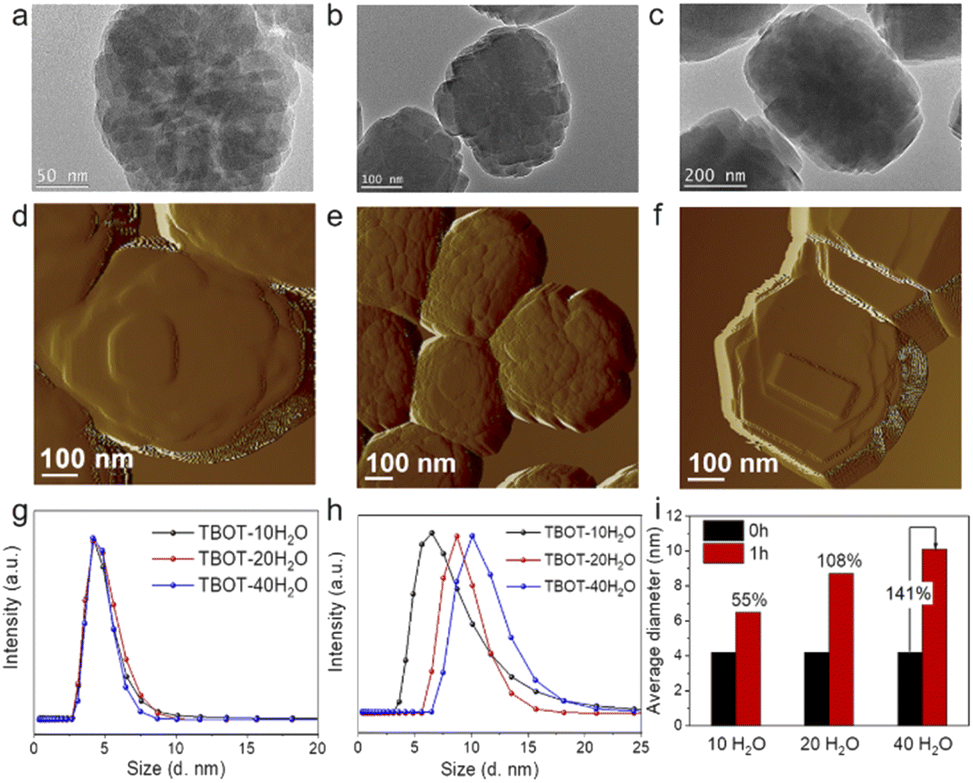
It is widely accepted that the concentration of alkali in the zeolite synthesis gel can dramatically influence the hydrolysis rate of TEOS and TBOT, and hence we adjusted the H2O/SiO2 ratio in the synthesis gel from 10 to 20 and 40 (with molar compositions of 1.0SiO2:0.025TiO2:0.2TPAOH:xH2O (x = 10, 20, and 40) and crystallized under hydrothermal conditions at 170 °C for 24 h; the obtained samples are identified as TS-1-TBOT-x, where x represents the H2O/SiO2 ratio in the synthesis gel). As shown in Fig. 3, TEM analyses indicate that the reduction of the H2O/SiO2 ratio decreases the crystal sizes (TS-1-TBOT-40, ∼500 nm, TS-1-TBOT-20, ∼350 nm, and TS-1-TBOT-10, ∼230 nm) and enriches the mesoporosity of the obtained TS-1 zeolite samples. TS-1-TBOT-10, prepared in a system with rapid hydrolysis of TEOS and TBOT, exhibits a morphology of nanoparticle aggregation with a rough crystal surface, suggesting that the nonclassical crystallization mechanism dominates the crystallization process (Fig. 1d); when the H2O/SiO2 ratio increases to 20 or 40, the hydrolysis rate of the raw materials decreases and the crystal surface of the obtained zeolite samples becomes smoother, illustrating that the classical growth pathway leads the crystallization process in this case (Fig. 3). AFM images of TS-1-TBOT-10, TS-1-TBOT-20, and TS-1-TBOT-40 depict a substantial difference in morphology and surface structures, further confirming the different choices of main crystallization mechanisms in different synthesis systems (Fig. 2e and 3d–f). It is worth mentioning that the initial solid zeolite product that appeared during the crystallization process of the TS-1-TBOT-40 synthesis system, TS-1-TBOT-40-4h, displays a rough surface and a morphology of small particle aggregation; as the crystallization process progresses, the crystal surfaces become smoother, indicating that both nonclassical and classical mechanisms could contribute to the crystallization behaviour (Fig. 3b, c, e and f).
 | ||
| Fig. 3 TEM images of TS-1-TBOT-20-24h (a), TS-1-TBOT-40-4h (b), and TS-1-TBOT-40-24h (c). AFM images of TS-1-TBOT-20-24h (d), TS-1-TBOT-40-4h (e), and TS-1-TBOT-40-24h (f). DLS curves of the growth solution suspensions of TS-1-TBOT-10, TS-1-TBOT-20, and TS-1-TBOT-40, with the synthesis gel composition of 1.0SiO2:0.025TBOT:0.2TPAOH:10–40H2O, before crystallization (g) and after crystallization for 1 h (h), and the average hydrodynamic diameter changes, showing the increase percentage of the evolved Ti-nanoparticles (i). | ||
DLS reveals that before crystallization, the particle sizes of the titanosilicate precursors in the growth solutions of TS-1-TBOT-10, TS-1-TBOT-20, and TS-1-TBOT-40 are all nearly 4.2 nm while after crystallization for 1 h, the average hydrodynamic diameters increase to 6.5, 8.7, and 10.1 nm, respectively (Fig. 3g and h). In the concentrated alkaline synthesis system (1.0SiO2:0.025TiO2:0.2TPAOH:10H2O), the increase in percentage of the titanosilicate precursor was 55%; upon decreasing the alkali concentration, the particle increase percent increased by 108% (1.0SiO2:0.025TiO2:0.2TPAOH:20H2O) and 141% (1.0SiO2:0.025TiO2:0.2TPAOH:40H2O). The growth processes of these TS-1 zeolites were also investigated. TS-1 zeolite crystals can be obtained at 2 h of crystallization in the cases of TS-1-TBOT-10 and TS-1-TBOT-20, while in the TS-1-TBOT-40 synthesis system, the crystal formation time was prolonged to 4 h (Fig. S6, S9, and S16–S19†). The faster crystallization behaviour in the high alkaline concentration synthesis system indicates that although the growth of the titanosilicate precursor size is slower, the formed particles may exhibit much more ordered structures than those developed in a low alkaline concentration growth solution. Besides, compared to TS-1-TBOT-10-2h, which is composed of loosely aggregated nanoparticles, TS-1-TBOT-40-4h presents a denser aggregated particle morphology (Fig. 3b). The structurally developed precursors not only ease the zeolite crystallization process but also make the nonclassical crystallization dominate the crystallization process. Therefore, it can be reasonably deduced that the evolution degree of the titanosilicate nucleus may determine the dominant crystallization process between the nonclassical route and classical pathway.
TS-1-TBOT zeolite samples were prepared at different crystallization times to assess the evolution of zeolite structures. We can see that the textural porosities and the microporous surface area measured from N2 adsorption–desorption measurements increase and the external surface area decreases when the crystallization time is prolonged from 2 h to 24 h, demonstrating the growth process of the microporous structures in zeolites (Fig. S20 and Table S1†). UV-visible spectra illustrate the coordination states of titanium in these TS-1 zeolite samples (Fig. S21†). The absorption bands at 210 nm and 260 nm are ascribed to the tetra-coordinated Ti and hexa-coordinated Ti, respectively.49,50 As can be seen, the amount of hexa-coordinated Ti decreases when increasing the crystallization time, and for the TS-1-TBOT-24h sample, a new absorption peak at 330 nm appears which can be ascribed to the presence of anatase-like species. The changes in Ti species provide information on the evolution of the TS-1 zeolite microstructure and suggest that in addition to Si atoms, Ti atoms also participate in the entire TS-1 zeolite crystallization process. As verified by inductively coupled plasma-optical emission spectroscopy (ICP-OES), the Si/Ti ratios of the TS-1 samples crystallized for 2 h, 9 h, and 24 h are 63, 48, and 47, respectively, which indicates that the attached Si and Ti atoms may come from both Ostwald ripening and the hydrolysed raw materials.
TEM images show that the formed TS-1-TBOT zeolite crystal has a nanoparticle aggregated morphology (Fig. S22†). The high-resolution image shows that the nanoparticles in the obtained zeolite crystal at 2 h is orientedly attached, and the fast Fourier transform (FFT) image demonstrates some discrete spots, suggesting the single crystalline nature of the crystals (Fig. 4a). Particularly, Fig. 4a also reveals the direct titanosilicate precursor attachment to the crystals, as highlighted by the red marks in the image, exactly confirming the nonclassical growth route, which is characterized by the addition of small particles during the crystallization process of the crystal. This image also presents the time-resolved intermediate stages of TS-1 crystallization. The attached titanosilicate precursors marked as “1” and indicated by red arrows in Fig. 4a are about 7 nm, and do not show any crystal lattice fringe lines, indicating the absence of long-range ordered zeolite framework structures; while the larger part, named “2” and marked by a red polygon, shows clear crystal lattice fringe lines, which presents an identical crystal orientation with the bulky crystal particle, indicating the existence of long-range ordered zeolite structures. Therefore, the process of the early crystallization stage can be depicted as the attachment of small precursor particles to the crystal surfaces, which grow larger by the attachment of other nanoparticle precursors, and evolve into crystals with long-range ordered zeolite structures through the solid-transformation process.
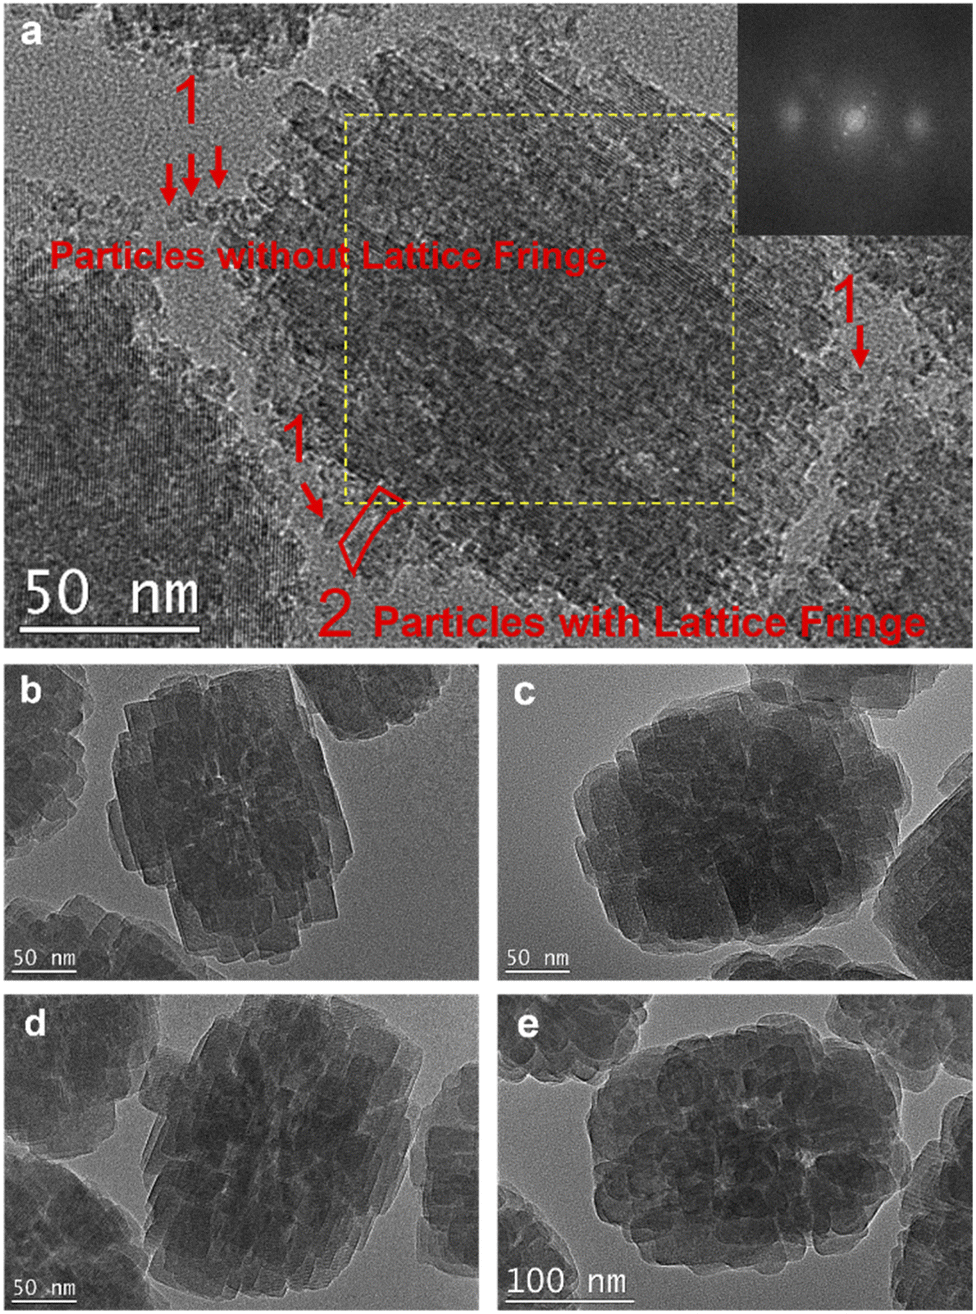 | ||
| Fig. 4 TEM images of TS-1-TBOT zeolites crystallized for different crystallization times. (a) 2 h; (b) 6 h; (c) 9 h; (d) 12 h; (e) 24 h. The inset in (a) is the FFT pattern of the area enclosed by the yellow dotted line. | ||
When the crystallization time was prolonged from 2 h to 24 h, the zeolite particle size slightly increases from ∼190 nm to ∼240 nm and the crystal surfaces become smoother, implying that it is mainly the addition of Ti or Si monomers rather than the attachment of precursor particles that occurs during this ripening stage. In other words, the classical mechanism (including the attachment of the Ti or Si monomers) directs the late stage of the crystallization process. Therefore, the whole crystallization process of TS-1-TBOT involves both the nonclassical mechanism based on the attachment of precursor nanoparticles and the classical route on the basis of Ti and Si monomer addition. In addition, the selected area electron diffraction (SAED) patterns of TS-1-TBOT-24h display discrete spots, verifying the single-crystalline nature of the zeolite sample (Fig. S23†).
The above experimental results suggest that the dominant crystallization process of TS-1 zeolite can be adjusted by kinetically regulating the evolution of nucleus structures (Fig. 1a). With TEOT or TBOT as the Ti source or in a concentrated alkaline synthesis system (e.g., H2O/SiO2 = 10), the raw materials undergo a fast hydrolysis process, facilitating the formation of relatively small titanosilicate precursors with some ordered zeolite structures. With the crystallization progressing, these small nuclei attach and form loosely aggregated zeolite nanoparticles, which are further developed by solid-state rearrangement and ripening through the addition of Ti and Si monomers, and eventually evolve into crystals with mesoscopic structures.
The whole crystallization process is dominated by the classical crystallization route with TEHOT as the Ti source or in a low alkaline concentration synthesis system. In this case, the raw materials experience a slow hydrolysis rate, leading to the formation of titanosilicate precursors with less developed ordered structures, and resulting in the formation of densely aggregated zeolite nanoparticles. With the crystallization process proceeding, these densely attached nanoparticles finally grow into crystals with microporous structures, namely, classical crystallization is the dominant pathway in this case.
The nucleation processes influence the dominant crystallization mechanism of the TS-1 zeolite, but would it have some effect on the structures and the dispersions of Ti species? It has generally been accepted that the active Ti species in TS-1 zeolite for the epoxidation of olefins is mononuclear Ti, which activates the oxidant, allowing the transfer of the oxygen atom to the olefin to form an olefin oxide. However, recently, 17O solid-state nuclear magnetic resonance spectroscopy in combination with density functional theory (DFT) calculations has shown evidence for the formation of a bridging peroxo species at dinuclear Ti sites, instead of isolated Ti(IV) sites, in TS-1 zeolite. Such sites have been proposed to enable the low-energy epoxidation of propylene.51 We have thus examined the TS-1 zeolites, obtained through nonclassical and classical crystallization pathways, by 17O solid-state nuclear magnetic resonance (NMR) spectroscopy and studied the formation rate and stability of the peroxo intermediates.
In order to probe peroxo formation rates, we first established a quantification protocol. Towards this goal, wideband, uniform-rate and smooth-truncation pulse with quadrupolar-CPMG (WURST QCPMG) experiments were performed and subsequently the echo spectrum was reconstructed and then deconvoluted into components associated with H2O, H2O2, and peroxy species. To avoid overfitting, we decided to fit the experimentally obtained spectrum of H2O, H2O2, and peroxo individually using DM Fit.52 The initial guess for each component was based on the previously DFT calculated NMR parameters51 and the relative intensity was optimized to converge to a best fit that provided the ratio of each species. Fig. 5a and b show that hydrogen peroxide (the molar ratio between Ti and H2O2 was fixed at 1) is consumed immediately (within 15 minutes), when it comes into contact with TS-1 zeolite catalysts constructed through the nonclassical crystallization mechanism (TS-1-NC, prepared with TBOT, H2O/SiO2 = 10, and crystallized for 12 h at 170 °C, with a Si/Ti ratio equal to 46 as measured by ICP-OES) and through the classical crystallization mechanism (TS-1-C, prepared with TBOT, H2O/SiO2 = 40, and crystallized for 12 h at 170 °C, with a Si/Ti ratio equal to 47 as measured by ICP-OES). The only signals observed are the ones corresponding to the μ2-bridging peroxo species and water. TS-1-NC shows a slightly higher fraction of μ2-bridging peroxo species than TS-1-C (92% vs. 90%). Next, we also evaluated the stability of the peroxo species formed in both catalysts by recording the NMR spectra after 3 h. In both cases, the peroxo species were partially decomposed as evidenced by the presence of a greater amount of 17O water, but TS-1-NC shows slightly more stable peroxo species (84% vs. 80%) (Fig. 5c, d, and S24, S25†). Overall, 17O solid-state NMR spectroscopy shows fast formation of μ2-bridging peroxo species regardless of the preparation method, yet, points towards differences in the stability of this key catalytic intermediate that could probably lead to different catalytic performances.
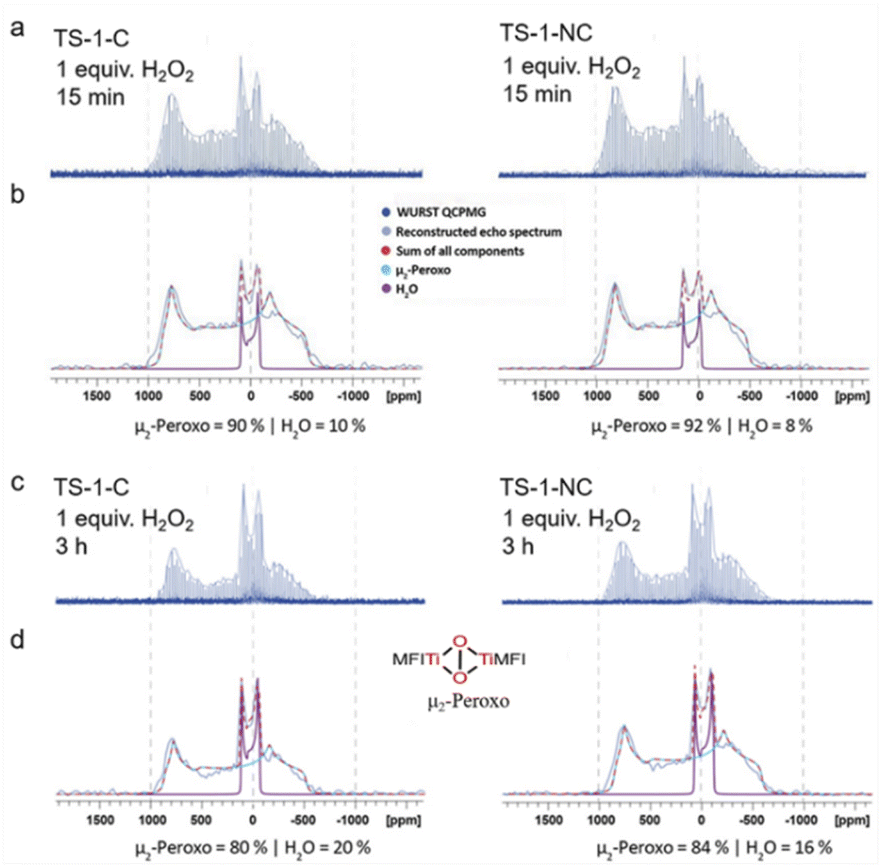 | ||
| Fig. 5 (a and c) WURST QCPMG 17O NMR spectra of the TS-1 zeolites obtained via classical (left) and nonclassical (right) pathways after impregnation with aqueous hydrogen peroxide (1.6 M) for 15 min and 3 h; (b and d) deconvoluted reconstructed echo spectrum to determine the amount of each presented species (the individual quadrupolar line shapes were fitted on samples/time points with only one species present). | ||
Epoxidation of olefins with H2O2
As the solid-state 17O NMR spectroscopy shows a more stable μ2-bridging peroxo species in TS-1-NC than in the TS-1-C zeolite catalyst after coming into contact with H2O2, we next evaluated the catalytic performance in the epoxidation of olefins with the two catalysts, in which both the catalytic activity and the epoxide selectivity were pursued. UV-vis spectra and UV-Raman spectra of TS-1-NC and TS-1-C indicate that the former one has slightly more hexa-coordinated Ti species than the latter (as evidenced by the presence of absorption bands at 260 nm in the UV-vis spectrum (Fig. 6a) and at 705 cm−1 in the UV-Raman spectrum with an excitation wavelength of 266 nm laser line (Fig. 6b)), and both are free of anatase species (the absence of absorption bands at 330 nm in the UV-vis spectra and at 144, 390, 516, and 637 cm−1 in the UV-Raman spectra excited by a 320 nm laser line (Fig. 6c)). STEM-energy-dispersive X-ray spectrometry (EDX) analyses indicate that the titanium atoms are distributed uniformly in both TS-1 zeolite catalysts (Fig. S26†). The epoxidation of olefins with different molecular dimensions, shapes and intrinsic reactivity, such as 1-hexene, 2-methyl-2-butene, and cyclohexene, was investigated with H2O2 as the primary oxidant, to elucidate the effect of the differences in physical and chemical properties and the micro-environments of the Ti in the catalyst structure on the catalytic activity brought by the different zeolite crystallization processes.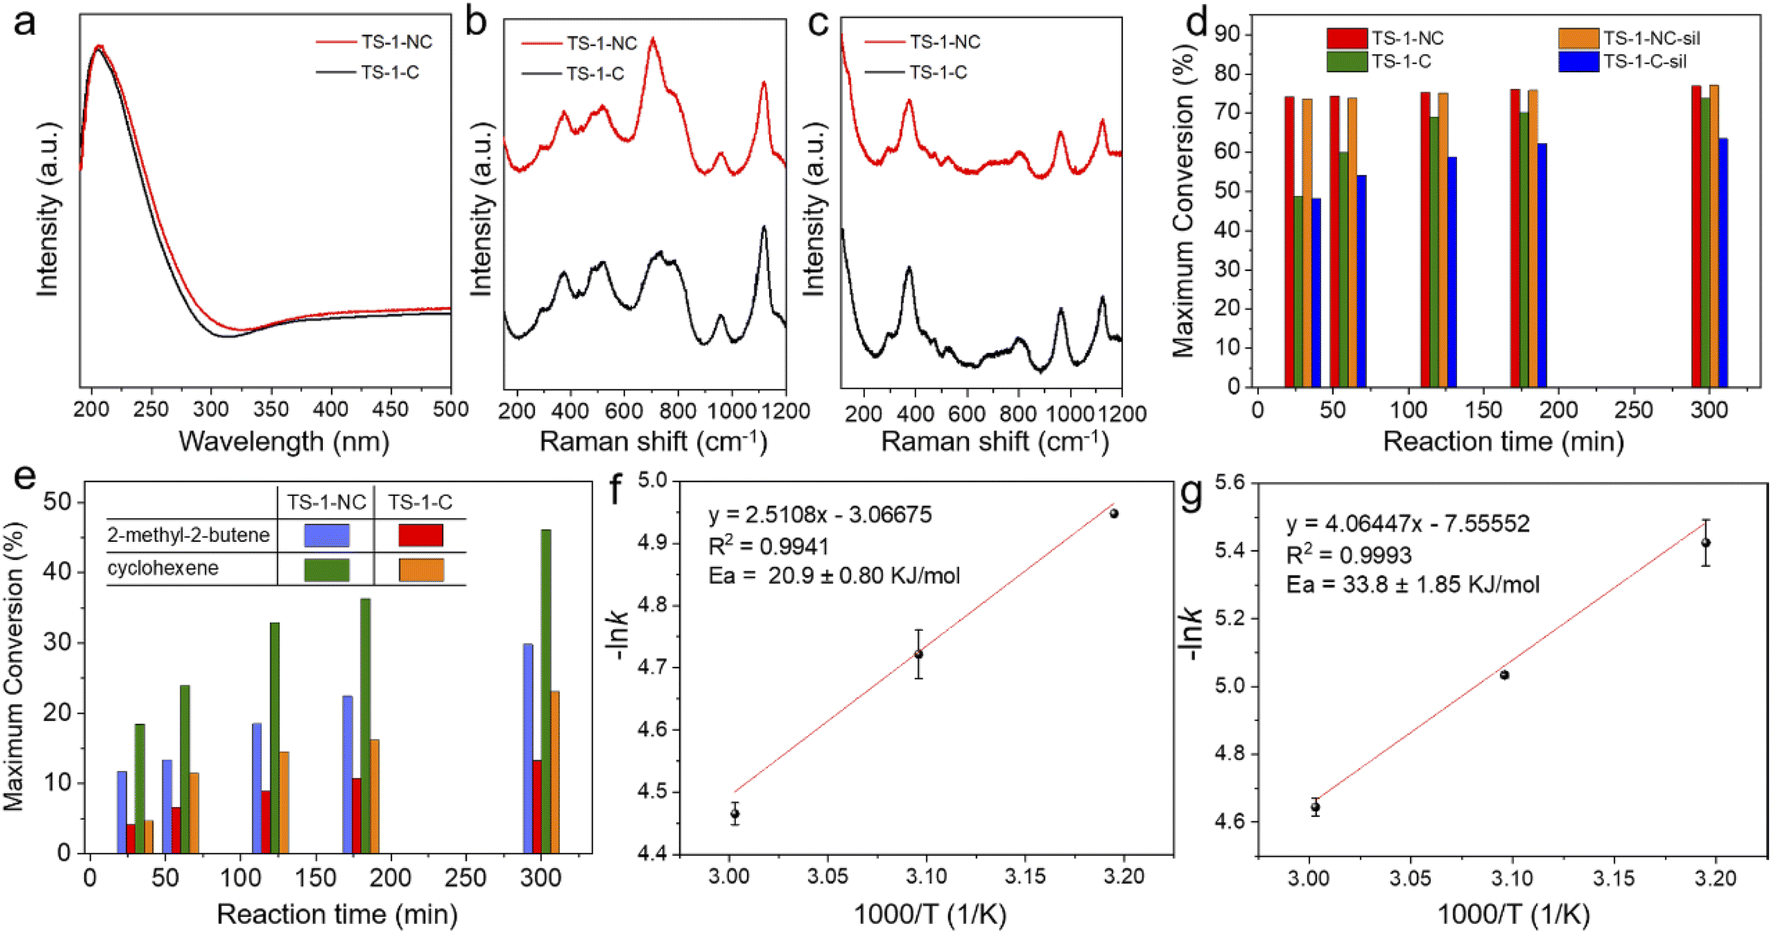 | ||
| Fig. 6 (a) UV-vis spectra, (b) UV-Raman spectra excited at 266 nm, and (c) UV-Raman spectra excited at 320 nm of TS-1-NC and TS-1-C zeolite catalysts. (d) Epoxidation of 1-hexene over TS-1-NC, TS-1-C, TS-1-NC-sil, and TS-1-C-sil catalysts; reaction conditions: cat., 100 mg; 1-hexene, 16 mmol; H2O2 (35 wt%), 4 mmol; methanol, 12 g; temp., 333 K, and 3 bar of N2. (e) Epoxidation of 2-methyl-2-butene and cyclohexene over TS-1-NC and TS-1-C catalysts; reaction conditions: cat., 100 mg; olefin, 16 mmol; H2O2 (35 wt%), 4 mmol; acetonitrile, 12 g; temp., 323 K, and 3 bar of N2. Arrhenius plots of the epoxidation of 1-hexene over (f) TS-1-NC and (g) TS-1-C catalysts; reaction conditions: cat., 33 mg; 1-hexene, 16 mmol; H2O2 (35 wt%), 4 mmol; methanol, 12 g, and 3 bar of N2. | ||
In the epoxidation of 1-hexene with H2O2 as the oxidant at 60 °C, the TS-1-NC catalyst gives 76.9% conversion of 1-hexene (based on the maximum theoretical value) at 300 min, which is only slightly higher than that of the classical mechanism-dominated TS-1-C catalyst (73.7%) (Fig. 6d and Tables S2 and S3†). However, in the initial stage of the reaction, for example, at 30 min of the reaction, the conversion of 1-hexene over the TS-1-NC catalyst reaches 74.2%, which is significantly higher than that of the TS-1-C catalyst (48.7%), revealing the higher catalytic activity of the TS-1-NC catalyst. TS-1-NC exhibits slightly higher H2O2 efficiency and comparable epoxide selectivity in comparison to TS-1-C (82.0 vs. 79.9%; 69.5 vs. 70.1%, respectively).
To further probe the catalytic performance difference between the two catalysts that were obtained by predominantly different crystallization mechanisms, we lowered the reaction temperature to 50 °C and decreased the catalyst-to-1-hexene ratio by a factor of three. TS-1-NC still shows higher initial catalytic activity (39.4 vs. 33.8% at a reaction time of 30 min), the same or slightly higher H2O2 efficiency (75.3 vs. 73.5%), and comparable epoxide selectivity (93.9 vs. 92.9%) in comparison to TS-1-C (Tables S4 and S5†). Due to the low reaction temperature and the low catalyst-to-feed ratio, glycol formation is strongly reduced for the two TS-1 catalysts and the selectivity to the epoxide is 93.9% for TS-1-NC and 92.9% for TS-1-C. In addition, we silylated TS-1-NC and TS-1-C with dimethoxydimethylsilane to increase their hydrophobicity (the silylated samples are named TS-1-NC-sil and TS-1-C-sil, respectively). Fig. S27† shows that the silylation significantly decreases the number of –OH groups as measured by infrared spectroscopy and inhibits the formation of glycol (Tables S6 and S7†). Notably, the TS-1-NC-sil catalyst displays a similar initial catalytic activity to TS-1-NC (conversion of 1-hexene at 30 min: 73.6 vs. 77.1%), which is still higher than that of TS-1-C (48.7%) and TS-1-C-sil (48.1%), indicating that the amount of external silanol groups does not play a significant role in causing the difference in catalytic activity for 1-hexene epoxidation (Fig. 6d).53
From these results one would expect that the TS-1-NC sample should have a lower activation energy for the olefin epoxidation reaction. Then, if we compare the apparent activation energy values for epoxidation of 1-hexene on TS-1-NC (20.9 ± 0.80 kJ mol−1) and TS-1-C (33.8 ± 1.85 kJ mol−1), we can speculate that the TS-1 sample synthesized through the nonclassical crystallization mechanism has a higher relative amount of dinuclear Ti sites (Fig. 6f, g and S28†). Considering that the solid-state 17O nuclear magnetic resonance spectroscopy of TS-1-NC shows a slightly higher generation rate and more stable μ2-bridging peroxo species than for the TS-1-C zeolite catalyst after coming into contact with H2O2, we can conclude that a fast nucleation with the corresponding small nuclei, which facilitates the nonclassical crystallization mechanism, could favour the formation of dinuclear Ti (Ti-pair) sites with respect to isolated Ti(IV) sites. Nevertheless, this should be further investigated since the differences observed by the NMR technique are very small.
To investigate the influence of the different crystallization mechanisms on the nucleation and the catalytic activity, we took the titanosilicate zeolite precursors of TS-1-NC and TS-1-C, which were obtained from crystallization at 170 °C for only 1 h, as the seeds for further preparing TS-1 zeolites. The titanosilicate zeolite precursor seeds were XRD amorphous and exhibit both tetra- and hexa-coordinated Ti species, as confirmed by the UV-vis spectra (Fig. S29 and S30†). As shown in the Fourier transform infrared spectra (FT-IR) in Fig. S31,† the two titanosilicate zeolite precursor samples exhibit the absorption band at 550 cm−1, which is attributed to the stretching vibration of double rings in the MFI structure, indicating that some ordered structures have already formed during the 1 h incubation/crystallization process of the two synthesis systems. The corresponding TS-1 zeolites were named TS-1-NC-S and TS-1-C-S, respectively. ICP-OES provides that the Si/Ti ratios of TS-1-NC-S and TS-1-C-S are 332 and 346, respectively. XRD patterns confirm the high crystallinity and the phase purity of the two samples (Fig. S32†). TEM images indicate that TS-1-NC-S and TS-1-C-S have a coffin-like morphology, exhibiting similar crystal size and smooth crystal surfaces (Fig. S33†). UV-vis spectra demonstrate that both the TS-1 zeolite samples mainly exhibit tetra-coordinated Ti species (Fig. S34†). The epoxidation of 1-hexene was also evaluated over these two TS-1 catalysts to give some indication of their Ti site structures. TS-1-NC-S demonstrated higher catalytic activity than the TS-1-C-S sample, suggesting that the former may possess more dinuclear Ti sites (Tables S8 and S9†). It is then of interest to further investigate if the relative amounts of mono and dinuclear Ti sites can be changed when changing the crystallization mechanism.
Finally, we also studied here the impact of the crystallization mechanism on the textural properties and the reactivity of the final samples obtained (Table S1†). Besides the nature and concentration of active sites, the textural properties of the catalyst can also influence reactivity when the size of the reactant approaches or even surpasses the diameter of the zeolite pores. Indeed, the TS-1 sample synthesized through the nonclassical crystallization mechanism (see Fig. 1a) shows a higher external surface area and mesoporosity than the sample synthesized through the classical mechanism (Table S1†). The differences should yield a higher activity for the former when reacting with larger molecules, which exhibit diffusional limitations within the pores and will react at the external surface or the pore mouth of the zeolite crystals.
To further assess the influence of the textural properties on catalytic performance, achieved by controlling the crystallization mechanism, we also studied the epoxidation of 2-methyl-2-butene and cyclohexene, which have strong diffusional limitations through the channels of MFI structures and can only be converted by the Ti active sites located at the crystal surfaces and at the pore mouth of the channels. As expected, the initial rate of the reaction, measured as the conversion of the maximum attainable, divided by reaction time at 30 minutes, is more than three times larger (Fig. 6e and Tables S10–S13†) for the TS-1-NC sample, synthesized through the nonclassical crystallization mechanism than for TS-1-C, synthesized through the classical mechanism, as a consequence of the hierarchical structure and the higher mesoporous surface area of TS-1-NC (Table S1†).
Oxidative desulfurization (ODS)
Oxidation of the bulky organosulfur molecule 4,6-dimethyldibenzothiophene (4,6-DMDBT) was performed to evaluate the catalytic activity of the TS-1 catalysts.54–57 TS-1-NC, which is mainly constructed through the nonclassical crystallization route, demonstrates significantly superior catalytic activity compared to TS-1-C, which is crystallized through the classical mechanism (Fig. S35†). Considering that the two catalysts exhibit similar Ti content (from ICP-OES) and Ti coordination (from solid UV-vis spectra), the large difference in catalytic activity indicates that the TS-1 zeolite crystallized with the nonclassical mechanism as the dominant pathway exhibits a hierarchical structure and is better adapted to convert bulky molecules with dimensions larger than the zeolite micropores. Significantly, the TS-1-NC zeolite catalyst exhibits good recycling stability during the oxidation of 4,6-DMDBT; the conversion of 4,6-DMDBT is still as high as 90% after 10 cycles (Fig. S35†). XRD, TEM, and UV-vis spectroscopy imply that the zeolite framework structure and the Ti microstructure are well preserved (Fig. S36 and S37†). The above mentioned catalytic results show the strong impact of the crystal growth mechanism on the distribution of Ti atoms, the textural properties, and the corresponding catalytic activities.Conclusions
In summary, the dominant crystallization mode of TS-1 zeolite could be switched between the nonclassical route and classical pathway by regulating the kinetic process of crystal nucleation. The crystallization of TS-1 via the attachment of titanosilicate precursor particles could be achieved by improving the hydrolysis rate of the raw materials, that is, by accelerating the nucleation process. The promoted nucleation process facilitates the formation of nuclei with more ordered zeolite structures, thus making the nonclassical mechanism guide the crystallization process. The obtained TS-1 zeolite catalyst with the nonclassical route as the predominant mechanism is of single crystalline nature, yields more stable bridging peroxo species upon reaction with H2O2, and exhibits higher external surface area. Finally, it is possible by controlling the crystallization mechanism during the synthesis of TS-1 to improve the catalytic activity, as shown here for the olefin epoxidation and ODS, and may provide some guidance for further optimization of other heteroatom-containing zeolite catalysts (such as Al, B, Sn, etc.).Data availability
All data associated with this article have been included in the main text and ESI.†Author contributions
A. C. and J. Y. conceived the project and directed the study. R. B. carried out the synthesis and characterization of the zeolite materials. L. L. and C. C. carried out the WURST QCPMG 17O NMR measurements and the simulations. Y. S. helped in some characterization studies. Y. Z. conducted the adsorption analyses. Z. F. performed the UV-Raman spectroscopy measurements. R. B. wrote the original draft, with further revisions by A. C. and J. Y. All the authors discussed the results and contributed to manuscript editing.Conflicts of interest
The authors declare no conflict of interest.Acknowledgements
The authors thank the National Key Research and Development Program of China (grant 2021YFA1501202), the National Natural Science Foundation of China (grant 21920102005, 21835002 and 21621001), the 111 Project (B17020), the European Union through the European Research Council (grant ERC-AdG-2014-671093, SynCatMatch), and the Spanish Government through “Severo Ochoa” (SEV-2016-0683, MINECO) for supporting this work. L. L. thanks the Scholarship Fund of the Swiss Chemical Industry (SSCI) for funding. José Gaona Miguélez is acknowledged for his technical help.Notes and references
- S. Shevlin, Nat. Mater., 2020, 19, 1038–1039 CrossRef CAS PubMed.
- A. Corma, Chem. Rev., 1997, 97, 2373–2420 CrossRef CAS PubMed.
- W. Vermeiren and J. P. Gilson, Top. Catal., 2009, 52, 1131–1161 CrossRef CAS.
- M. Shamzhy, M. Opanasenko, P. Concepcion and A. Martinez, Chem. Soc. Rev., 2019, 48, 1095–1149 RSC.
- M. E. Davis, Chem. Mater., 2014, 26, 239–245 CrossRef CAS.
- M. G. Clerici, Top. Catal., 2000, 13, 373–386 CrossRef CAS.
- W. J. Roth, P. Nachtigall, R. E. Morris and J. Čejka, Chem. Rev., 2014, 114, 4807–4837 CrossRef CAS PubMed.
- A. Korde, B. Min, E. Kapaca, O. Knio, I. Nezam, Z. Wang, J. Leisen, X. Yin, X. Zhang, D. S. Sholl, X. Zou, T. Willhammar, C. W. Jones and S. Nair, Science, 2022, 375, 62–66 CrossRef CAS PubMed.
- W.-C. Lin, S. Wu, G. Li, P.-L. Ho, Y. Ye, P. Zhao, S. Day, C. Tang, W. Chen, A. Zheng, B. T. W. Lo and S. C. Edman Tsang, Chem. Sci., 2021, 12, 210–219 RSC.
- C. Li, P. Ferri, C. Paris, M. Moliner, M. Boronat and A. Corma, J. Am. Chem. Soc., 2021, 143, 10718–10726 CrossRef CAS PubMed.
- T. Sun, S. Xu, D. Xiao, Z. Liu, G. Li, A. Zheng, W. Liu, Z. Xu, Y. Cao, Q. Guo, N. Wang, Y. Wei and Z. Liu, Angew. Chem., Int. Ed., 2020, 59, 20672–20681 CrossRef CAS PubMed.
- Y. Ma, X. Tang, J. Hu, Y. Ma, W. Chen, Z. Liu, S. Han, C. Xu, Q. Wu, A. Zheng, L. Zhu, X. Meng and F.-S. Xiao, J. Am. Chem. Soc., 2022, 144, 6270–6277 CrossRef CAS PubMed.
- B. Smit and T. L. M. Maesen, Nature, 2008, 451, 671–678 CrossRef CAS PubMed.
- R. Bai, Y. Song, Y. Li and J. Yu, Trends Chem., 2019, 1, 601–611 CrossRef CAS.
- W. Schwieger, A. G. Machoke, T. Weissenberger, A. Inayat, T. Selvam, M. Klumpp and A. Inayat, Chem. Soc. Rev., 2016, 45, 3353–3376 RSC.
- E. M. Gallego, M. T. Portilla, C. Paris, A. León-Escamilla, M. Boronat, M. Moliner and A. Corma, Science, 2017, 355, 1051–1054 CrossRef CAS PubMed.
- K. Ding, A. Corma, J. Antonio Macia-Agullo, J. G. Hu, S. Kraemer, P. C. Stair and G. D. Stucky, J. Am. Chem. Soc., 2015, 137, 11238–11241 CrossRef CAS PubMed.
- R. Bai, Q. Sun, Y. Song, N. Wang, T. Zhang, F. Wang, Y. Zou, Z. Feng, S. Miao and J. Yu, J. Mater. Chem. A, 2018, 6, 8757–8762 RSC.
- C. S. Cundy and P. A. Cox, Microporous Mesoporous Mater., 2005, 82, 1–78 CrossRef CAS.
- S. Inagaki, K. Nakatsuyama, Y. Saka, E. Kikuchi, S. Kohara and M. Matsukata, J. Phys. Chem. C, 2007, 111, 10285–10293 CrossRef CAS.
- F. Fan, Z. Feng and C. Li, Chem. Soc. Rev., 2010, 39, 4794–4801 RSC.
- T. M. Davis, T. O. Drews, H. Ramanan, C. He, J. Dong, H. Schnablegger, M. A. Katsoulakis, E. Kokkoli, A. V. McCormick, R. L. Penn and M. Tsapatsis, Nat. Mater., 2006, 5, 400–408 CrossRef CAS PubMed.
- A. I. Lupulescu and J. D. Rimer, Science, 2014, 344, 729–732 CrossRef CAS PubMed.
- S. Karthika, T. K. Radhakrishnan and P. Kalaichelvi, Cryst. Growth Des., 2016, 16, 6663–6681 CrossRef CAS.
- M. Niederberger and H. Cölfen, Phys. Chem. Chem. Phys., 2006, 8, 3271–3287 RSC.
- M. Jehannin, A. Rao and H. Cölfen, J. Am. Chem. Soc., 2019, 141, 10120–10136 CrossRef CAS PubMed.
- J. J. De Yoreo, P. U. P. A. Gilbert, N. A. J. M. Sommerdijk, R. L. Penn, S. Whitelam, D. Joester, H. Zhang, J. D. Rimer, A. Navrotsky, J. F. Banfield, A. F. Wallace, F. M. Michel, F. C. Meldrum, H. Cölfen and P. M. Dove, Science, 2015, 349, aaa6760 CrossRef PubMed.
- Y. Politi, T. Arad, E. Klein, S. Weiner and L. Addadi, Science, 2004, 306, 1161–1164 CrossRef CAS PubMed.
- J. Mahamid, A. Sharir, L. Addadi and S. Weiner, Proc. Natl. Acad. Sci. U.S.A., 2008, 105, 12748–12753 CrossRef CAS PubMed.
- E. Beniash, R. A. Metzler, R. S. K. Lam and P. U. P. A. Gilbert, J. Struct. Biol., 2009, 166, 133–143 CrossRef CAS PubMed.
- I. M. Weiss, N. Tuross, L. Addadi and S. Weiner, J. Exp. Zool., 2002, 293, 478–491 CrossRef CAS PubMed.
- G. He, T. Dahl, A. Veis and A. George, Nat. Mater., 2003, 2, 552–558 CrossRef CAS PubMed.
- J. Baumgartner, A. Dey, P. H. H. Bomans, C. Le Coadou, P. Fratzl, N. A. J. M. Sommerdijk and D. Faivre, Nat. Mater., 2013, 12, 310–314 CrossRef CAS PubMed.
- H.-G. Liao, L. Cui, S. Whitelam and H. Zheng, Science, 2012, 336, 1011–1014 CrossRef CAS PubMed.
- M. Kumar, H. Luo, Y. Roman-Leshkov and J. D. Rimer, J. Am. Chem. Soc., 2015, 137, 13007–13017 CrossRef CAS PubMed.
- M. Kumar, R. Li and J. D. Rimer, Chem. Mater., 2016, 28, 1714–1727 CrossRef CAS.
- Y. Zhao, H. Zhang, P. Wang, F. Xue, Z. Ye, Y. Zhang and Y. Tang, Chem. Mater., 2017, 29, 3387–3396 CrossRef CAS.
- Z. Sheng, H. Li, K. Du, L. Gao, J. Ju, Y. Zhang and Y. Tang, Angew. Chem., Int. Ed., 2021, 60, 13444–13451 CrossRef CAS PubMed.
- Z. J. Berkson, R. J. Messinger, K. Na, Y. Seo, R. Ryoo and B. F. Chmelka, Angew. Chem., Int. Ed., 2017, 56, 5164–5169 CrossRef CAS PubMed.
- K. N. Olafson, R. Li, B. G. Alamani and J. D. Rimer, Chem. Mater., 2016, 28, 8453–8465 CrossRef CAS.
- W. Qin, A. Agarwal, M. K. Choudhary, J. C. Palmer and J. D. Rimer, Chem. Mater., 2019, 31, 3228–3238 CrossRef CAS.
- A. I. Lupulescu and J. D. Rimer, Angew. Chem., Int. Ed., 2012, 51, 3345–3349 CrossRef CAS PubMed.
- S. Kumar, Z. Wang, R. L. Penn and M. Tsapatsis, J. Am. Chem. Soc., 2008, 130, 17284–17286 CrossRef CAS PubMed.
- M. K. Choudhary, M. Kumar and J. D. Rimer, Angew. Chem., Int. Ed., 2019, 58, 15712–15716 CrossRef CAS PubMed.
- S. Kumar, R. L. Penn and M. Tsapatsis, Microporous Mesoporous Mater., 2011, 144, 74–81 CrossRef CAS.
- A. Aerts, L. R. A. Follens, E. Biermans, S. Bals, G. Van Tendeloo, B. Loppinet, C. E. A. Kirschhock and J. A. Martens, Phys. Chem. Chem. Phys., 2011, 13, 4318–4325 RSC.
- K. Kiss, J. Magder, M. S. Vukasovich and R. J. Lockhart, J. Am. Ceram. Soc., 1966, 49, 291–295 CrossRef CAS.
- N. V. Golubko, M. I. Yanovskaya, I. P. Romm and A. N. Ozerin, J. Sol-Gel Sci. Technol., 2001, 20, 245–262 CrossRef CAS.
- W. Fan, R.-G. Duan, T. Yokoi, P. Wu, Y. Kubota and T. Tatsumi, J. Am. Chem. Soc., 2008, 130, 10150–10164 CrossRef CAS PubMed.
- R. Bai, M. T. Navarro, Y. Song, T. Zhang, Y. Zou, Z. Feng, P. Zhang, A. Corma and J. Yu, Chem. Sci., 2020, 11, 12341–12349 RSC.
- C. P. Gordon, H. Engler, A. S. Tragl, M. Plodinec, T. Lunkenbein, A. Berkessel, J. H. Teles, A.-N. Parvulescu and C. Copéret, Nature, 2020, 586, 708–713 CrossRef CAS PubMed.
- D. Massiot, F. Fayon, M. Capron, I. King, S. Le Calvé, B. Alonso, J.-O. Durand, B. Bujoli, Z. Gan and G. Hoatson, Magn. Reson. Chem., 2002, 40, 70–76 CrossRef CAS.
- D. T. Bregante, A. M. Johnson, A. Y. Patel, E. Z. Ayla, M. J. Cordon, B. C. Bukowski, J. Greeley, R. Gounder and D. W. Flaherty, J. Am. Chem. Soc., 2019, 141, 7302–7319 CrossRef CAS PubMed.
- A. Chica, A. Corma and M. E. Dómine, J. Catal., 2006, 242, 299–308 CrossRef CAS.
- Z. Jiang, H. LÜ, Y. Zhang and C. Li, Chin. J. Catal., 2011, 32, 707–715 CrossRef CAS.
- S. Otsuki, T. Nonaka, N. Takashima, W. Qian, A. Ishihara, T. Imai and T. Kabe, Energy Fuels, 2000, 14, 1232–1239 CrossRef CAS.
- J. M. Campos-Martin, M. C. Capel-Sanchez, P. Perez-Presas and J. L. G. Fierro, J. Chem. Technol. Biotechnol., 2010, 85, 879–890 CrossRef CAS.
Footnote |
| † Electronic supplementary information (ESI) available. See https://doi.org/10.1039/d2sc02679a |
| This journal is © The Royal Society of Chemistry 2022 |