
 Open Access Article
 This Open Access Article is licensed under a Creative Commons Attribution-Non Commercial 3.0 Unported Licence
Operando acoustic analysis: a valuable method for investigating reaction mechanisms in mechanochemistry†
César
Leroy
 *a,
Sébastien
Mittelette
a,
Gautier
Félix
a,
Nicolas
Fabregue
a,
Jessica
Špačková
a,
Philippe
Gaveau
a,
Thomas-Xavier
Métro
b and
Danielle
Laurencin
*a
*a,
Sébastien
Mittelette
a,
Gautier
Félix
a,
Nicolas
Fabregue
a,
Jessica
Špačková
a,
Philippe
Gaveau
a,
Thomas-Xavier
Métro
b and
Danielle
Laurencin
*a
aICGM, Univ Montpellier, CNRS, ENSCM, Montpellier, France. E-mail: cesar.leroy@umontpellier.fr; danielle.laurencin@umontpellier.fr
bIBMM, Univ Montpellier, CNRS, ENSCM, Montpellier, France
First published on 6th May 2022
Abstract
We present a new operando approach for following reactions taking place in mechanochemistry, relying on the analysis of the evolution of the sound during milling. We show that differences in sound can be directly correlated to (physico)chemical changes in the reactor, making this technique highly attractive and complementary to others for monitoring mechanochemical reactions. Most notably, it can provide unique information on the actual movements of the beads within the milling jars, which opens new avenues for helping rationalize mechanochemical processes.
The growing attention to mechanochemistry has led to an impressive range of research areas to which this “green” synthetic method can be applied, ranging from pharmacy to catalysis as well as crystal engineering or materials science.1,2 Although widely used for synthesizing elaborate compounds, the details of grinding and more specifically of the physical and chemical mechanisms taking place are still often seen as unfathomable. In the case of ball-milling, this is mainly due to the opaque and closed environment of the milling reactors in which most reactions take place.
In light of the great interest in mechanochemistry, several research groups have thus strongly focused their attention on developing in situ as well as operando analytical methods in order to monitor reactions and observe evolutions in the structure, crystallinity and/or texture of compounds involved during the milling processes.3–8 Except for temperature, these methods usually require the use of transparent reactor materials (for Raman or X-ray diffraction monitoring, for example),4,9 or the adaptation of the geometry and size of the reactor itself (in particular in the case of NMR analyses).10–16 However, several studies have shown that the kinetics and/or reaction mechanisms in ball-milling can be greatly affected by the size and materials composing the reactor and beads, meaning that the latter methods cannot be readily applied to different reactions without re-investigating the synthetic conditions.17,18 Hence, developing new operando approaches allowing the evolution of reaction media to be followed, but without requiring any modification of the initial set of experimental parameters, would be greatly beneficial for the mechanochemistry community.
Several mechanical behaviours involving the beads and reactors have been shown to come into play during a ball-mill synthesis.19–22 The reacting particles undergo direct impacts from the beads, as well as shearing forces, which both can lead to particle size reduction and the creation of “fresh reactive surfaces”, and thereby enable the chemical reactions to take place. Moreover, under some milling conditions, specific trajectories of the beads have also been identified, such as their direct back and forth movements from one wall of the reactor to another, or their rolling along the sides of the milling reactor. Such processes are generally difficult to predict, and depend on numerous experimental parameters such as the type of beads (size, number and material), the type of reactors (volume, geometry, and material), the milling parameters (frequency, time), not to mention the type of movements imposed to the reactors by the mill (e.g., planetary, oscillating vertically or horizontally), but also the physical and chemical properties of the milled reagents. Various sounds can sometimes be noticed during the milling of compounds, which attest of changes in the beads' motions in the reactor. Yet, although a few previous attempts to follow the sound during ball-milling experiments had been reported, notably in 2004 by Cuadrado-Laborde et al.,23 to the best of our knowledge, only sounds resulting from the impact of a bead on the reactor were identified and analysed. No systematic investigation was made at the time on how the sound recorded could inform on other movements of the bead (aside from the simple impact), nor, more importantly, on how it could be used to directly follow different physico-chemical changes occurring in the milling reactors.23 In this context, we decided to record the sound produced by a vertical mixer mill upon milling, in order to try to decipher the acoustic variations arising from different movements of the beads, and how they can be related to changes in the composition or physico–chemical properties of the medium. Moreover, as detailed below, we investigated how this method compares to other known operando techniques, i.e. Raman spectroscopy and temperature measurements, for following reaction mechanisms taking place during ball-milling (see Fig. 1).
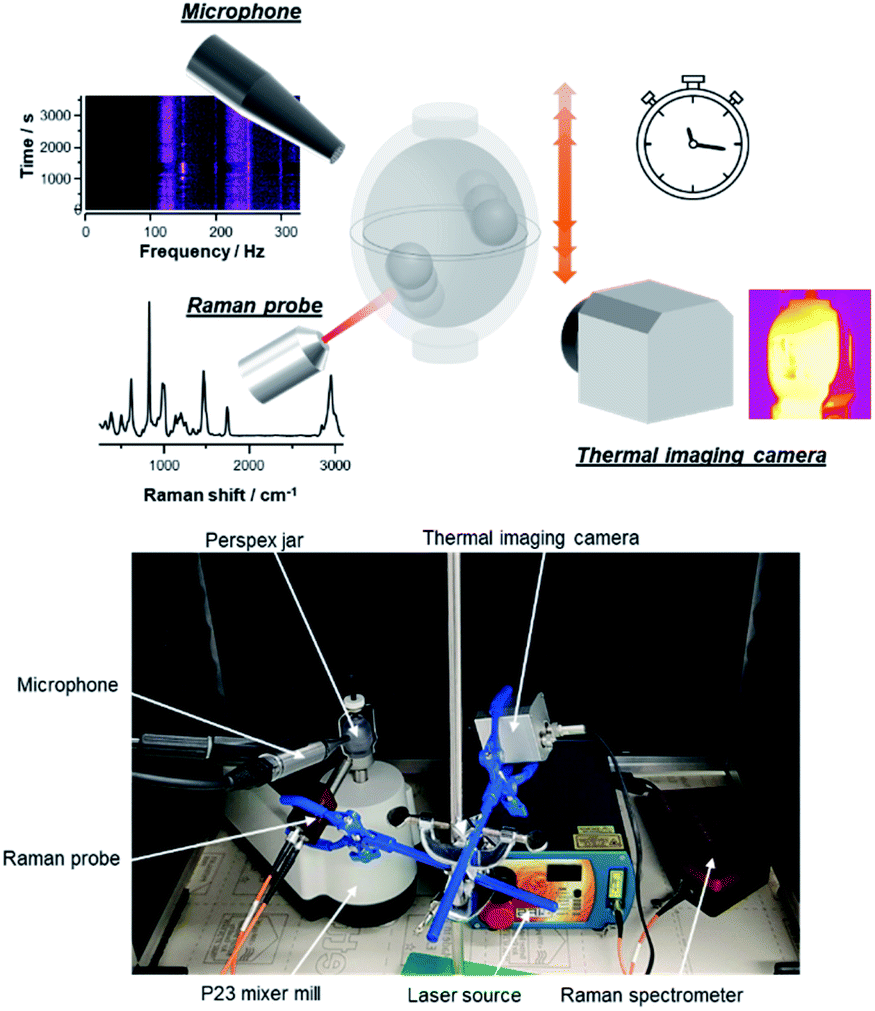 | ||
| Fig. 1 Top: schematic representation of the set-up used for the operando monitoring of mechanochemical reactions, using the combination of Raman spectroscopy, thermal imaging, and the recording of an AF spectrogram. Bottom: photo of the instrumental set-up used in this work. | ||
As a first system of study, we decided to follow the mechanochemical formation of a 1![[thin space (1/6-em)]](https://www.rsc.org/images/entities/char_2009.gif) :1 cocrystal of terephthalic acid (H2BDC) and 1,4-diazabicyclo[2.2.2]octane (DABCO) (see Fig. 2a). The sound was recorded through the use of a microphone situated close to the milling reactor. This recording was then used to generate an audio-frequency spectrogram (AF spectrogram), which allows the Fourier transform of the signal to be monitored as a function of time, and different sound harmonics to be observed. In parallel to the sound recording, Raman analyses and temperature measurements were also carried out to follow the evolution of the reaction medium (Fig. 1). These three operando methods were adapted to a vertical mixer mill (Pulverisette 23, Fritsch) using a Perspex reactor with two ZrO2 beads (Ø 10 mm). Here, the experiments were conducted at a frequency of 50 Hz with a reaction time of 60 min, for a total mass of reactants ∼500 mg (see ESI† for more details).
:1 cocrystal of terephthalic acid (H2BDC) and 1,4-diazabicyclo[2.2.2]octane (DABCO) (see Fig. 2a). The sound was recorded through the use of a microphone situated close to the milling reactor. This recording was then used to generate an audio-frequency spectrogram (AF spectrogram), which allows the Fourier transform of the signal to be monitored as a function of time, and different sound harmonics to be observed. In parallel to the sound recording, Raman analyses and temperature measurements were also carried out to follow the evolution of the reaction medium (Fig. 1). These three operando methods were adapted to a vertical mixer mill (Pulverisette 23, Fritsch) using a Perspex reactor with two ZrO2 beads (Ø 10 mm). Here, the experiments were conducted at a frequency of 50 Hz with a reaction time of 60 min, for a total mass of reactants ∼500 mg (see ESI† for more details).
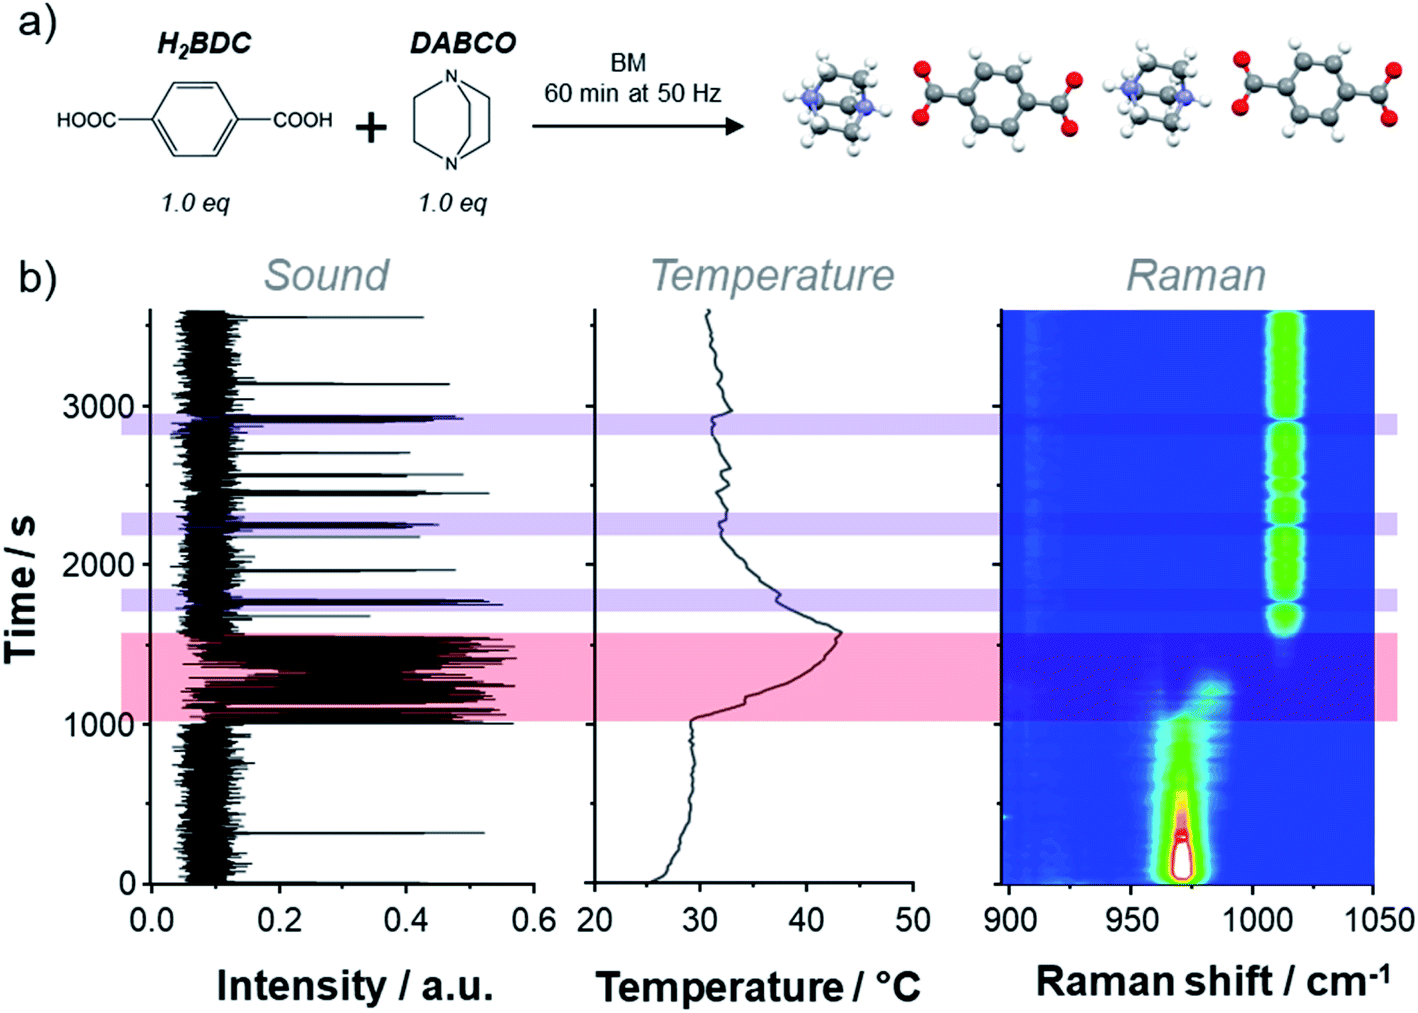 | ||
| Fig. 2 (a) Dry milling reaction between H2BDC (1.0 eq) and DABCO (1.0 eq) during 60 min at 50 Hz, inducing the formation of a cocrystal (see Fig. S1 and S2† for ex situ pXRD and Raman analyses of the cocrystal). (b). Left: intensity of the 3rd harmonic of the AF spectrogram as a function of time, obtained by integration between 145 and 155 Hz. Centre: temperature profile of the reactor during the milling reaction presented in (a). Right: time-resolved operando Raman spectra for a selected area (between 950 and 1050 cm−1); the intensity scale goes from low (blue) to high (red and then white). The red shaded rectangle emphasizes the presence of the intermediate species, while purple ones highlight the erratic rolling motions. | ||
During the mechanochemical formation of the H2BDC–DABCO cocrystal (Fig. 2a),24 various sounds were noticed. Careful analysis of the AF spectrogram revealed contrasts in signal intensity in the 105–145 Hz and 145–155 Hz regions (see Fig. S3b†), i.e. close to the 3rd harmonic of the milling frequency (50 Hz in this case). Notably, the acoustic intensity between 145 and 155 Hz was found to significantly increase between ∼1000 and 1500 s of milling (Fig. 2b, red shaded zone). This experimental observation could be reproduced in the same time-frame by repeating the experiment (see Fig. S4†). Interestingly, when looking at the measurements recorded using the other operando methods, an increase of the reactor's temperature by about 10–12 °C was simultaneously observed using the thermal imaging camera (Fig. 2b). Moreover, the Raman spectra recorded over the same period of time also revealed shifts in the DABCO and H2BDC vibration bands (Fig. 2b). Hence, these first results suggest that changes in sound can be directly correlated to chemical reactions occurring in the reactor.
Further analysis of the Raman spectra was performed (Fig. S5†), focusing notably on the zone between 950 and 1050 cm−1, in which the DABCO νCC/ωCH2 vibration bands appear.25 The latter vibration mode was first found to shift from 970.8 cm−1 to 984.3 cm−1 after ∼1000 s of milling, and then to further shift to 1013.5 cm−1 (after ca. 500 s), which corresponds to the vibration frequency expected for the final cocrystal (Fig. 2b). Although the exact nature of the intermediate has not yet been unambiguously identified, it can be tentatively assigned to an {H2BDC–DABCO} species, in which only one of the nitrogen atoms of DABCO becomes protonated (based on the shift observed in Raman spectroscopy),25 leading to a single N–H⋯O hydrogen-bonding motif (in contrast with the final cocrystal which contains two). Remarkably, the previously noticed variation of sound around 150 Hz (3rd harmonic) happens precisely during the short lifespan of this intermediate, i.e. between ∼1000 and 1500 s. To the best of our knowledge, it is the first time that evidence of the presence of reaction intermediates in mechanochemistry is accounted for by analysing the sound occurring during the milling.
In order to help rationalize the origin of the changes in sound during the formation of the intermediate, the movements of the beads across the transparent Perspex milling reactors were visualized using a digital camera. In doing so, it was found that when the intermediate appears (thus when the intensity of the sound is maximum in the 145–155 Hz frequency range, i.e. in the red-shaded area on Fig. 2b), the beads undergo a rolling type of movement on the wall of the reactor. Such motion can be opposed to the erratic impact of the beads which occurs during most of the remaining time, and can be identified here on the AF spectrogram by the more intense inharmonic signals between 105 and 145 Hz (see ESI Fig. S3†). It is possible that the predominance of rolling between 1000 and 1500 s may be caused by the significant changes in texture of the medium upon formation of the intermediate. More generally speaking, to the best of our knowledge, it is the first time that an acoustic signature characteristic of rolling events in mechanochemistry is identified through sound measurements.
Beyond the possibility of directly observing the formation and/or disappearance of a reaction intermediate, we also found that the analysis of the AF spectrogram actually helps understand deeper some of the details of the data recorded using Raman spectroscopy and the thermal imaging camera. For this reaction system, the “rolling” vs. “impact” sound signatures were found to largely appear in specific regions, as illustrated in Fig. S6.† Indeed, the impact is appearing in the 105–145 Hz region, while rolling is visible in the 145–155 Hz one. Yet, interestingly, the signature characteristic of rolling motions was observed not only during the life-span of the intermediate, but also intermittently before and after its appearance (see for example the purple-shaded rectangles in Fig. 2b), with a simultaneous decrease in the Raman signals intensities and increase in temperature. Concerning the Raman data, this can be explained by the fact that when rolling occurs, the beads are more likely to remove the powder from the point of focus of the Raman laser, implying that less compound is then analysed during the Raman acquisition time, hence the decrease in signal intensity. Regarding temperature, the small increase may be caused by a more significant frictional heating of the beads against the reactor's walls during the rolling events.26
Overall, throughout this first example, we have been able to show how sound modifications can attest of a chemical evolution of the medium inside the milling reactor in a complementary way to two other operando techniques (Raman analyses and thermal imaging measurements), and how they can also explain some of the smaller features observed during the acquisition of the operando data (notably when rolling motions occur). In light of these first results, we decided to study on one hand whether other changes in the physical aspect of a reaction medium could be correlated to variations in sound, and on the other hand how sound measurements may actually inform on chemical events taking place in the milling reactors, in situations when temperature measurements or Raman operando analyses can be ambiguous, poorly informative, or not even applicable.
In order to investigate how changes in physical aspect of a reaction medium can be followed through the recording of AF spectrograms, we decided to study the hydrolysis of SiO2 (initially introduced in the reactor as “fumed silica”), upon progressive addition of small amounts of water during ball-milling. Indeed, as shown in Fig. 3, this system appeared to us as ideal for such investigations, because it goes through many of the physical states commonly encountered in ball-milling reactions. First, the medium is under the form of a light fluffy powder, which upon addition of water forms more agglomerated particles (leading to a “heavy powder”), which then further agglomerate and stick to the beads (leading to a so-called “snow-ball” effect).7,8,27,28 The subsequent addition of water enables the medium to re-spread onto the walls of the reactor (the phase then having the aspect of a “sticky gel” or “gel”), and finally evolves towards a slurry type of texture. These changes were thus followed using a similar set-up as for the study of the H2BDC–DABCO cocrystal (P23 vertical mixer mill operated at 50 Hz, using a Perspex reactor with two zirconia beads), and after each addition of water, the milling was performed for 5 minutes. Here, in addition to recording the AF spectrogram, the changes in temperature of the reactor were monitored using a thermal-imaging camera, and the movements of the beads inside the reactor were also filmed at specific time-points using a digital camera. It is worth noting that the observations described below were found to be essentially reproducible (see Fig. S7† for comparison of AF spectrograms).
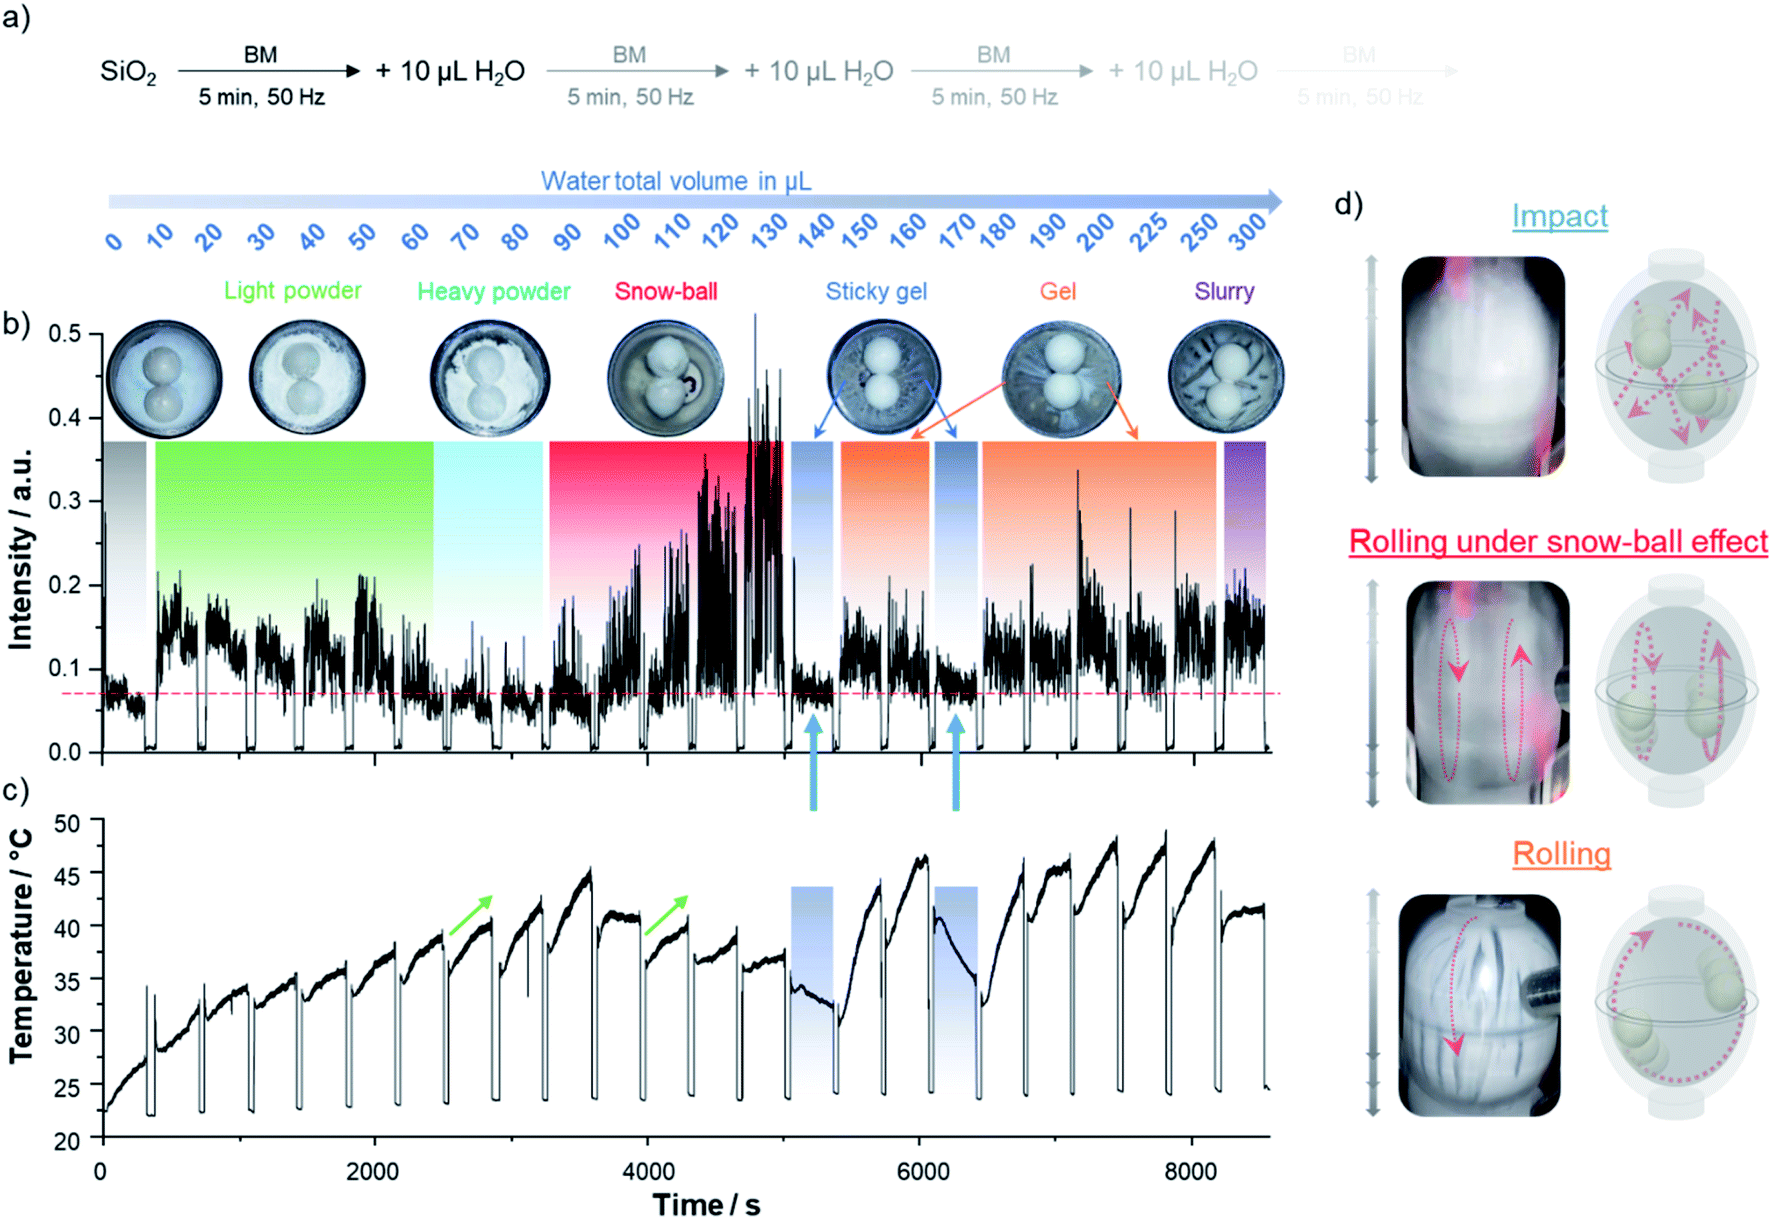 | ||
| Fig. 3 (a) Scheme of the hydrolysis of SiO2 in a Perspex reactor using two zirconia beads. After each addition of 10 μL of H2O, the mixture was milled during 5 min at 50 Hz. (b) Sound intensity variation of the 3rd harmonic (145–155 Hz) according to the physical state of SiO2 upon addition of H2O. Associated pictures are taken just before the water addition. The red dashed line is given as a guideline to show the differences in sound intensities for motions which are predominantly impact. The blue arrows indicate the 5 minutes periods of milling when impact motions were predominant. (c) Temperature profile of the reactor. Blue shaded rectangles emphasize the impact motions regions. The green arrows highlight the regions which show similar temperature profiles (but different sound signatures). (d) Details of the three different bead motions detected during the experiment (on the left: pictures of the reactor, on the right: schemes of the beads motion): impact, rolling under snow-ball effect and rolling. | ||
When looking at the full AF spectrogram, it is clear that it is around the third harmonic (∼150 Hz) that the contrast is the most significant and the intensity the highest (see Fig. S8 in ESI† for changes in sound intensity in other spectral regions). As for the H2BDC–DABCO system, it was found that high intensity signals around this frequency can attest of rolling-types of motions, as shown for example by analysing the results in the zone corresponding to the addition of 180–300 μL of water, in which the presence of rolling is clearly visible when visualising the movement of the beads and looking at the aspect of the medium after opening of the reactor. Concomitantly, the events with the lowest intensity signals at ∼150 Hz (i.e. after addition of 140 and 170 μL) could be corroborated with more “impact-like” movements (see blue arrows in Fig. 3b, zone corresponding to the “sticky gel” aspect of the mixture). These events were also found to correspond to a simultaneous increase in signal intensity in the 105–145 Hz region, in line with previous observations made for the H2BDC–DABCO system (see Fig. S9†). However, it is important to highlight that in the case of the hydrolysis of silica, a lower intensity signal at ∼150 Hz did not systematically correlate with a higher intensity sound in the 105–145 Hz region (see ESI, Fig. S8†), in contrast with what had been seen previously for the cocrystal (see below for further discussion). This shows that in order to help interpret the subtleties of the movements of the beads within the reactor and of the physico–chemical processes taking place, the investigation of several zones of the AF spectrograms is actually needed.
When analysing in more detail the overall plot of the changes in sound intensity around the 3rd harmonic as a function of the amount of water added (Fig. 3), it is clear that the most significant increase occurs in the zone corresponding to the formation of the “snow-ball” (i.e. after addition of 90–130 μL of water – red-shaded zone), when the beads start rolling against the reactor's walls and accumulating powder at their surface. Most interestingly, when looking at the movement of the beads in this regime using a digital camera, a rolling of both beads in separate zones of the reactor could be observed, as tentatively illustrated in Fig. 3d. A possible explanation to the related increase in sound would be that upon the formation of the snow-balls, the walls of the reactor then become mostly free of powder, inducing such sound intensification. A contrario, when the powder is homogeneously spread over the walls of the reactor, as is the case upon formation of the “heavy powder” (zones highlighted in light blue in Fig. 3, which correspond essentially to rolling motions), the sound intensity is much more dampened (see Fig. 3, S7 and S9†).
The importance of being able to follow the sound during the milling further appears when comparing the results of the AF spectrogram analyses to those of the temperature measurements. In several situations, just like for the H2BDC–DABCO system, the rolling events were found to be associated to temperature increases inside the milling reactor, as shown in particular after addition of 150 μL and of 180 to 250 μL of water. However, changes in sound intensity around 150 Hz did not systematically correlate in the same way to changes in temperature. For example, while the temperature profiles after addition of 70 and 110 μL of water were essentially the same (see green arrows on Fig. 3c), the sound intensity at ∼150 Hz over that same period of time was very different, in one case corresponding to the milling of a “heavy powder”, while in the other to a snowball. Such results clearly demonstrate the complementarity of acoustic and temperature measurements in trying to decipher the evolution in the physico–chemical properties of the medium during the milling. Considering the increasing number of studies in which temperature measurements are reported,26,29,30 and related to endo- or exothermal chemical reactions occurring in the milling reactors, being able to take into consideration that changes in beads motions can also be correlated to changes in temperature is another important feature to bear in mind.
Overall, although many other aspects related to the milling of silica in presence of water would deserve to be investigated, these results on the hydrolysis of silica clearly highlight that (i) beyond the identification of rolling or erratic impact movements of the beads, acoustic measurements can attest of other phenomena occurring in the reactor, such as the formation of snow-balls (during which a different type of rolling movements take place), or the evolution of the aspect of the mixture (e.g. formation of a “sticky gel” inducing impact motions); and (ii) sound measurements are highly complementary to temperature measurements, as they can bring unique evidence of phenomena taking place during the milling.
Finally, in order to demonstrate the utility of sound measurements for the optimization of ball-milling reaction conditions, we decided to study the hydrolysis of an activated fatty acid, lauric acid, using this operando method. Indeed, during our previous work on the 17O/18O isotopic enrichment of fatty acids,31,32 we had found that for saturated fatty acids, the hydrolysis time of the activated acyl-imidazole intermediates had to be systematically optimized by repeating the experiments with various milling times. Given that this hydrolysis is accompanied by a change in texture of the reaction medium, which switches from a powdery aspect to a more oily one, we suspected that acoustic measurements could be used to determine the time after which the hydrolysis is complete (Fig. 4a).
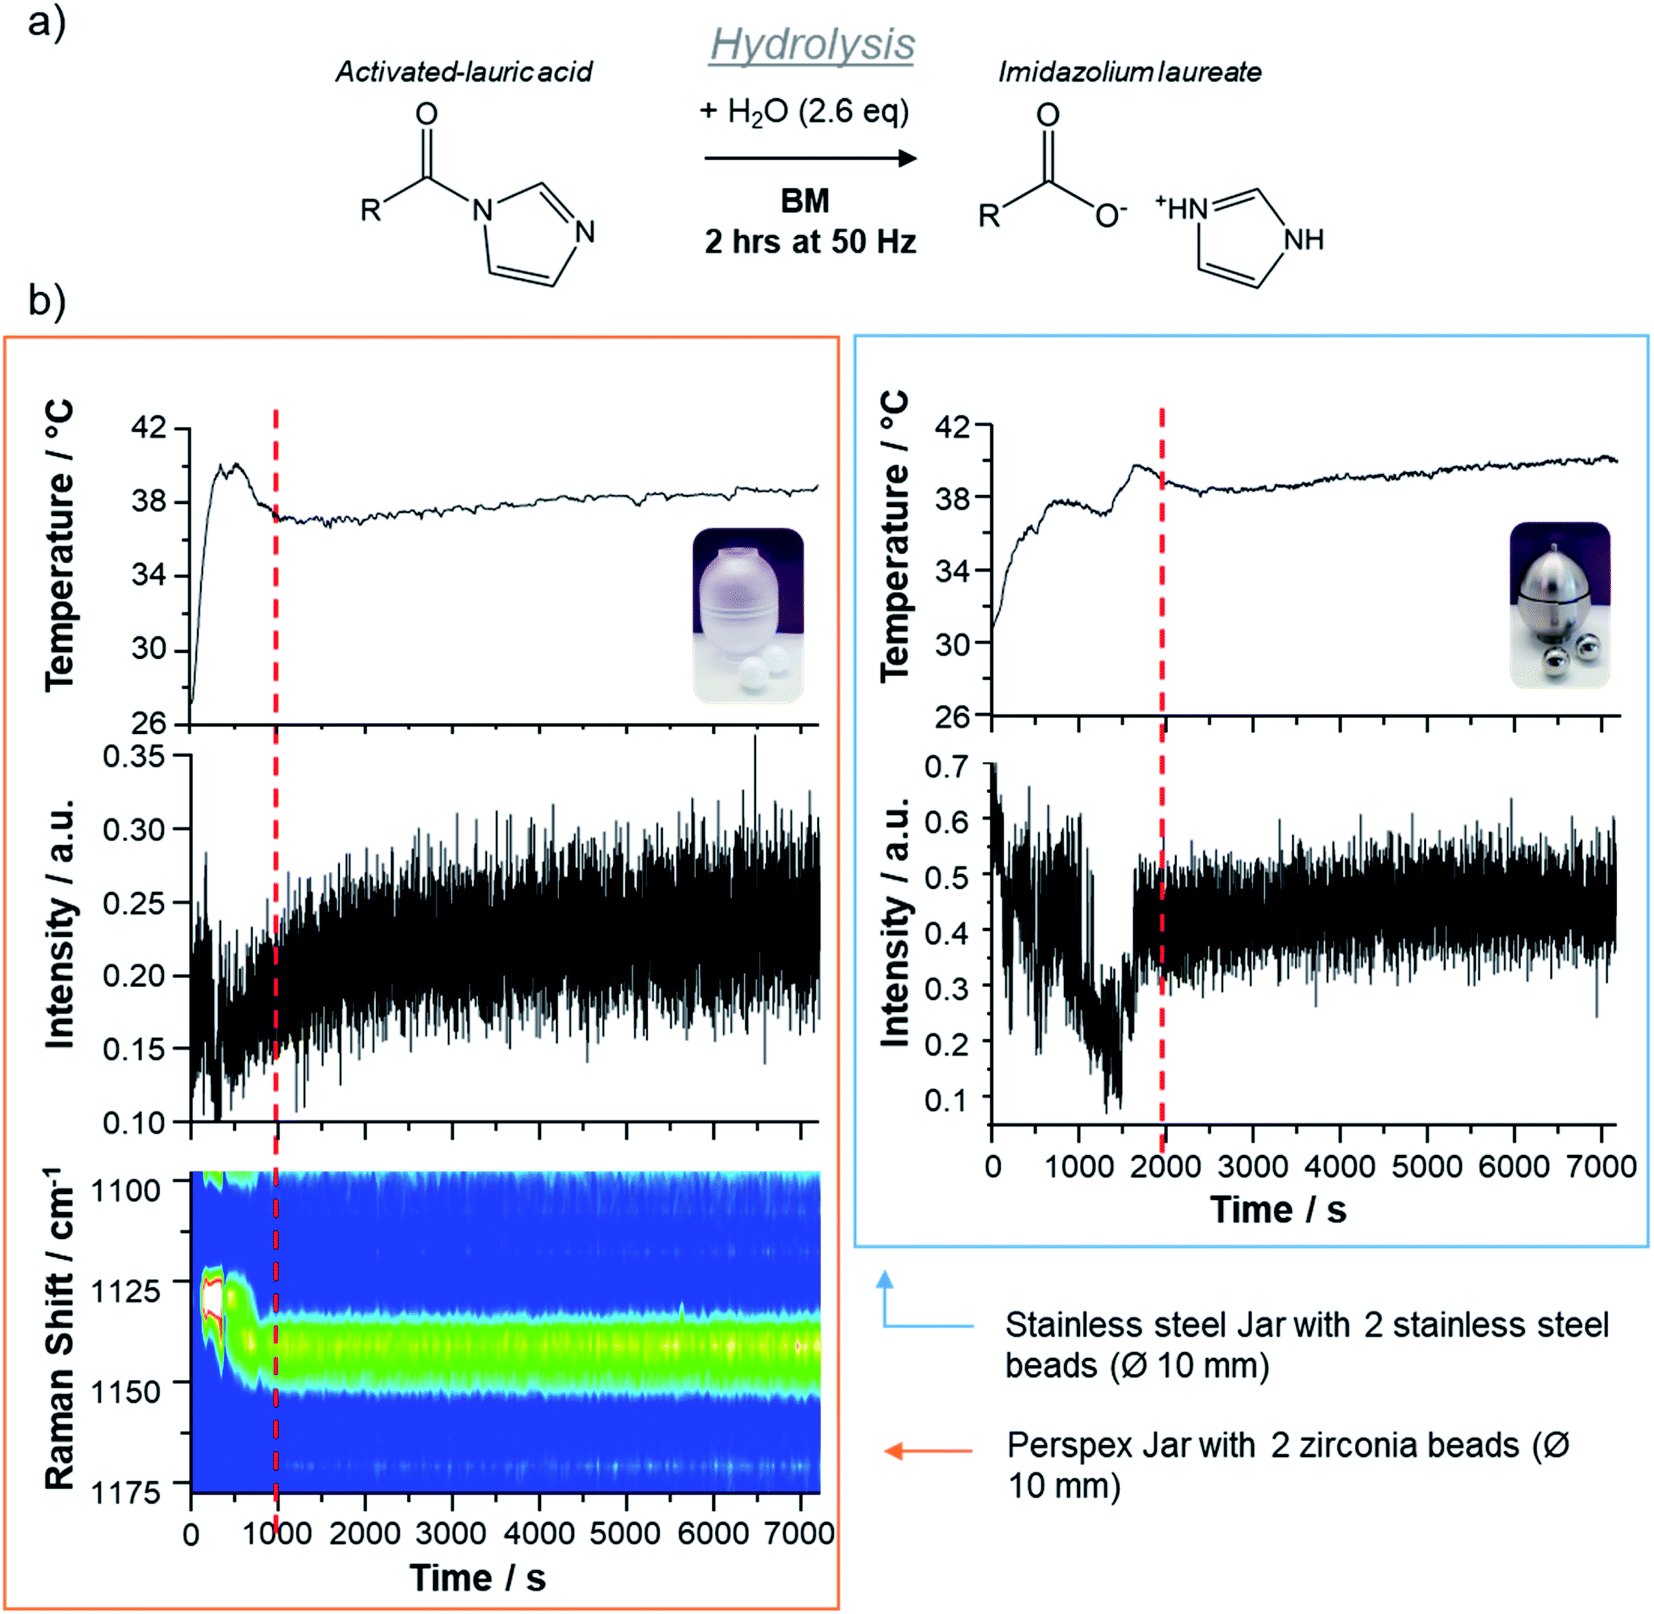 | ||
| Fig. 4 (a) Reaction corresponding to the mechanochemical hydrolysis of activated lauric acid (CH3–(CH2)10–COOH), which was followed here using operando analyses. (b) Operando experiments conducted in a Raman laser-transparent Perspex reactor (see picture in the orange rectangle, left) and in an opaque stainless steel reactor (see picture in the blue rectangle, right) with: temperature profiles of the reactor during the milling reactions, intensity of the 5th harmonic of the AF spectrograms as a function of time obtained by an integration between 205 and 245 Hz, and Raman analyses (for the experiment in a Perspex reactor). Dotted red lines are used as visual helps for indicating the completion of the reaction. | ||
Two experimental conditions were compared: the first hydrolysis experiment was performed in a Perspex reactor with two zirconia beads (10 mm Ø) in order to allow the Raman signals to be recorded, while the second one was performed in a stainless steel reactor with two stainless steel beads (10 mm Ø), and can be seen as a “blind” experiment (as it cannot be followed by Raman spectroscopy). The changes in sound, temperature, and, in the former case, in Raman signatures, during the milling are compared in Fig. 4.
For these milling experiments, carried out at a frequency of 50 Hz, it was found that the highest contrast on the AF spectrograms appears close to the 5th harmonic, and more specifically in the 205–245 Hz frequency region (see ESI Fig. S10–S12†). For both types of milling reactors, after an initial period during which significant variations in the sound intensity are observed, there is a stabilisation of the sound intensity (see dashed red vertical line in Fig. 4b), suggesting that a final physical state of the reaction medium has been reached. When looking at the simultaneous temperature measurements, it appears that this time also corresponds to the threshold after which no strong changes in reactor's temperature are noticed. Moreover, when looking at the operando Raman data recorded for the experiment carried out in a Perspex reactor, it is clear that this threshold also corresponds to the period after which no further change in the vibration frequencies occurs, as illustrated by focusing on the 1100–1200 cm−1 spectral region. Using ex situ analyses by FTIR spectroscopy, it was verified that after stabilization of the sound the hydrolysis is indeed complete, for reactions carried out both in Perspex and stainless steel reactors (see Fig. S12†). Overall, this demonstrates the utility of performing sound measurements in operando mode, in order to determine the time at which experiments are over, especially in situations when simultaneous Raman analyses are not possible, for example when working in a stainless steel reactor, or when temperature measurements may not be possible, for example in cases when dedicated temperature-regulated milling systems are used for the experiments.
In conclusion, we have presented here a new approach based on the study of the sound for following mechanochemical syntheses using operando methods. The potential of this approach was illustrated in three different examples, demonstrating how it can be used to draw attention to the formation of synthetic intermediates, to know when a reaction is complete, and also to follow changes in the physical state of a reaction medium. Moreover, it was shown that sound analyses can shed light on different types of movements of the beads within the milling reactors, meaning that it is highly interesting to use such analyses to decipher the different phenomena taking place within the milling jars. Overall, this makes sound measurements a promising addition to the toolbox of methods which mechanochemists can now use to try to understand and control the evolution of reaction media during ball-milling.
Data availability
The following data, related to the different milling reactions presented here, can be made available on demand: AF spectrograms, raw Raman spectra, and thermal measurement data, raw acoustic sound-tracks and also digital movies performed during the milling.Author contributions
The project was conducted by CL, in close interaction with DL and TXM. GF developed the Python script to generate the AF spectrograms. PG, GF, NF, SM and CL took part in the experimental development of the operando acoustic set-up. SM and CL performed the BM syntheses for the cocrystal, NF and CL designed the experiment with SiO2, JS and CL the syntheses involving the lauric acid. CL performed the data analyses, and prepared all figures and tables. CL and DL wrote the initial draft of the manuscript. All authors discussed the results and contributed to the final preparation of the manuscript.Conflicts of interest
There are no conflicts to declare.Acknowledgements
This project has received funding from the European Research Council (ERC) under the European Union's Horizon 2020 research and innovation programme (grant agreement No 772204; 2017 ERC-COG, MISOTOP project). We acknowledge Prof. Franziska Emmerling for providing the Perspex reactors used for some of the real-time monitoring syntheses shown here.References
- J.-L. Do and T. Friščić, ACS Cent. Sci., 2017, 3, 13–19 CrossRef CAS PubMed.
- T. Friščić, C. Mottillo and H. M. Titi, Angew. Chem., Int. Ed., 2020, 59, 1018–1029 CrossRef PubMed.
- D. Gracin, V. Štrukil, T. Friščić, I. Halasz and K. Užarević, Angew. Chem., 2014, 126, 6307–6311 CrossRef.
- L. Batzdorf, F. Fischer, M. Wilke, K.-J. Wenzel and F. Emmerling, Angew. Chem., Int. Ed., 2015, 54, 1799–1802 CrossRef CAS PubMed.
- H. Kulla, S. Greiser, S. Benemann, K. Rademann and F. Emmerling, Molecules, 2016, 21, 917 CrossRef PubMed.
- S. Lukin, T. Stolar, M. Tireli, M. V. Blanco, D. Babić, T. Friščić, K. Užarević and I. Halasz, Chem. - Eur. J., 2017, 23, 13941–13949 CrossRef CAS PubMed.
- B. P. Hutchings, D. E. Crawford, L. Gao, P. Hu and S. L. James, Angew. Chem., Int. Ed., 2017, 56, 15252–15256 CrossRef CAS PubMed.
- M. Carta, S. L. James and F. Delogu, Molecules, 2019, 24, 3600 CrossRef CAS PubMed.
- I. Halasz, S. A. J. Kimber, P. J. Beldon, A. M. Belenguer, F. Adams, V. Honkimäki, R. C. Nightingale, R. E. Dinnebier and T. Friščić, Nat. Protoc., 2013, 8, 1718–1729 CrossRef PubMed.
- J. G. Schiffmann, F. Emmerling, I. C. B. Martins and L. Van Wüllen, Solid State Nucl. Magn. Reson., 2020, 109, 101687 CrossRef CAS PubMed.
- G. I. Lampronti, A. A. L. Michalchuk, P. P. Mazzeo, A. M. Belenguer, J. K. M. Sanders, A. Bacchi and F. Emmerling, Nat. Commun., 2021, 12, 6134 CrossRef CAS PubMed.
- N. Tumanov, V. Ban, A. Poulain and Y. Filinchuk, J. Appl. Crystallogr., 2017, 50, 994–999 CrossRef CAS.
- J. M. Bellosta von Colbe, M. Felderhoff, B. Bogdanović, F. Schüth and C. Weidenthaler, Chem. Commun., 2005, 4732 RSC.
- S. Doppiu, L. Schultz and O. Gutfleisch, J. Alloys Compd., 2007, 427, 204–208 CrossRef CAS.
- J. Zhang, F. Cuevas, W. Zaïdi, J.-P. Bonnet, L. Aymard, J.-L. Bobet and M. Latroche, J. Phys. Chem. C, 2011, 115, 4971–4979 CrossRef CAS.
- B. J. Jaques, D. D. Osterberg, G. A. Alanko, S. Tamrakar, C. R. Smith, M. F. Hurley and D. P. Butt, J. Alloys Compd., 2015, 619, 253–261 CrossRef CAS.
- L. S. Germann, M. Arhangelskis, M. Etter, R. E. Dinnebier and T. Friščić, Chem. Sci., 2020, 11, 10092–10100 RSC.
- L. Catalano, L. S. Germann, P. A. Julien, M. Arhangelskis, I. Halasz, K. Užarević, M. Etter, R. E. Dinnebier, M. Ursini, M. Cametti, J. Martí-Rujas, T. Friščić, P. Metrangolo, G. Resnati and G. Terraneo, Chem, 2021, 7, 146–154 CAS.
- E. Boldyreva, Chem. Soc. Rev., 2013, 42, 7719–7738 RSC.
- P. Baláž, M. Achimovičová, M. Baláž, P. Billik, Z. Cherkezova-Zheleva, J. M. Criado, F. Delogu, E. Dutková, E. Gaffet, F. J. Gotor, R. Kumar, I. Mitov, T. Rojac, M. Senna, A. Streletskii and K. Wieczorek-Ciurowa, Chem. Soc. Rev., 2013, 42, 7571 RSC.
- F. Fischer, N. Fendel, S. Greiser, K. Rademann and F. Emmerling, Org. Process Res. Dev., 2017, 21, 655–659 CrossRef CAS.
- E. Colacino, M. Carta, G. Pia, A. Porcheddu, P. C. Ricci and F. Delogu, ACS Omega, 2018, 3, 9196–9209 CrossRef CAS PubMed.
- C. Cuadrado-Laborde, L. C. Damonte and L. Mendoza-Zélis, Rev. Sci. Instrum., 2004, 75, 2334–2339 CrossRef CAS.
- E. Yang, X.-C. Song and J.-W. Zhu, Acta Crystallogr., Sect. E: Struct. Rep. Online, 2008, 64, o1764 CrossRef CAS PubMed.
- D. A. Guzonas and D. E. Irish, Can. J. Chem., 1988, 66, 1249–1257 CrossRef CAS.
- K. Užarević, N. Ferdelji, T. Mrla, P. A. Julien, B. Halasz, T. Friščić and I. Halasz, Chem. Sci., 2018, 9, 2525–2532 RSC.
- E. Boldyreva, Curr. Pharm. Des., 2016, 22, 4981–5000 CrossRef CAS PubMed.
- J. Andersen, J. Brunemann and J. Mack, React. Chem. Eng., 2019, 4, 1229–1236 RSC.
- H. Kulla, M. Wilke, F. Fischer, M. Röllig, C. Maierhofer and F. Emmerling, Chem. Commun., 2017, 53, 1664–1667 RSC.
- H. Kulla, S. Haferkamp, I. Akhmetova, M. Röllig, C. Maierhofer, K. Rademann and F. Emmerling, Angew. Chem., Int. Ed., 2018, 57, 5930–5933 CrossRef CAS PubMed.
- J. Špačková, C. Fabra, S. Mittelette, E. Gaillard, C.-H. Chen, G. Cazals, A. Lebrun, S. Sene, D. Berthomieu, K. Chen, Z. Gan, C. Gervais, T.-X. Métro and D. Laurencin, J. Am. Chem. Soc., 2020, 142, 21068–21081 CrossRef PubMed.
- J. Špačková, C. Fabra, G. Cazals, M. Hubert-Roux, I. Schmitz-Afonso, I. Goldberga, D. Berthomieu, A. Lebrun, T.-X. Métro and D. Laurencin, Chem. Commun., 2021, 57, 6812–6815 RSC.
Footnote |
| † Electronic supplementary information (ESI) available. See https://doi.org/10.1039/d2sc01496c |
| This journal is © The Royal Society of Chemistry 2022 |