
 Open Access Article
 This Open Access Article is licensed under a Creative Commons Attribution-Non Commercial 3.0 Unported Licence
Data-driven discovery of cardiolipin-selective small molecules by computational active learning†
Bernadette
Mohr‡
a,
Kirill
Shmilovich‡
b,
Isabel S.
Kleinwächter
c,
Dirk
Schneider
 c,
Andrew L.
Ferguson
*b and
Tristan
Bereau
*ad
c,
Andrew L.
Ferguson
*b and
Tristan
Bereau
*ad
aVan't Hoff Institute for Molecular Sciences and Informatics Institute, University of Amsterdam, Amsterdam 1098 XH, The Netherlands. E-mail: t.bereau@uva.nl
bPritzker School of Molecular Engineering, University of Chicago, Chicago, Illinois 60637, USA. E-mail: andrewferguson@uchicago.edu
cDepartment of Chemistry – Biochemistry, Johannes Gutenberg University Mainz, 55128 Mainz, Germany
dMax Planck Institute for Polymer Research, 55128 Mainz, Germany
First published on 2nd March 2022
Abstract
Subtle variations in the lipid composition of mitochondrial membranes can have a profound impact on mitochondrial function. The inner mitochondrial membrane contains the phospholipid cardiolipin, which has been demonstrated to act as a biomarker for a number of diverse pathologies. Small molecule dyes capable of selectively partitioning into cardiolipin membranes enable visualization and quantification of the cardiolipin content. Here we present a data-driven approach that combines a deep learning-enabled active learning workflow with coarse-grained molecular dynamics simulations and alchemical free energy calculations to discover small organic compounds able to selectively permeate cardiolipin-containing membranes. By employing transferable coarse-grained models we efficiently navigate the all-atom design space corresponding to small organic molecules with molecular weight less than ≈500 Da. After direct simulation of only 0.42% of our coarse-grained search space we identify molecules with considerably increased levels of cardiolipin selectivity compared to a widely used cardiolipin probe 10-N-nonyl acridine orange. Our accumulated simulation data enables us to derive interpretable design rules linking coarse-grained structure to cardiolipin selectivity. The findings are corroborated by fluorescence anisotropy measurements of two compounds conforming to our defined design rules. Our findings highlight the potential of coarse-grained representations and multiscale modelling for materials discovery and design.
1 Introduction
Mitochondria are double-membrane-bound organelles found in most eukaryotic cells (Fig. 1a). Their principal function is to generate the cell's supply of adenosine triphosphate (ATP), the main source of chemical energy used to drive biochemical reactions.1 Through their key role in bioenergetics, mitochondria play an essential part in controlling cell proliferation, and they are involved in cell signaling and the activation of apoptosis.2–4 The inner mitochondrial (IMM) membrane partitions the intermembrane space from the matrix and contains the membrane-bound ATP synthase proteins responsible for ATP generation. The composition of this membrane includes approximately 20% cardiolipin (CL) (Fig. 1b), a phospholipid comprising four acyl chains that is exclusively found in energy-generating membranes.1,5 Abnormalities in CL composition of inner mitochondrial membranes are linked to pathologies including Barth syndrome, Tangier disease, heart failure, and neurodegeneration.5,6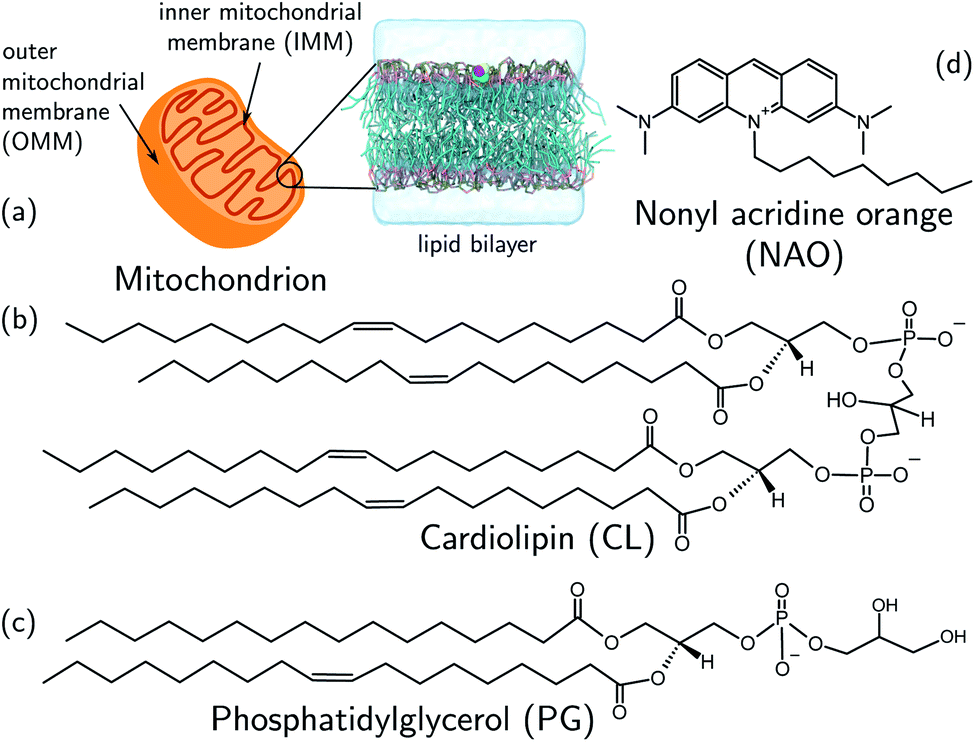 | ||
| Fig. 1 (a) Schematic representation of a mitochondrion with lipid bilayer system representing the inner mitochondrial membrane (IMM). (b) Chemical structures of (b) cardiolipin (CL) and (c) phosphatidylglycerol (PG) phospholipids. The CL molecule is essentially a dimer of PG. CL contains two phosphatidyl moieties and one hydroxyl group in its headgroup, in comparison one phosphatidyl group and two hydroxyl groups in the PG headgroup. (d) The cardiolipin probe 10-N-nonyl acridine orange (NAO). All structures were drawn with ChemSketch.24 | ||
The CL content of a membrane can be experimentally assayed using molecular stains to visualize and quantify the presence of CL. A primary challenge in the molecular design of cardiolipin-selective small molecules7 is the high degree of structural similarity between CL and other common phospholipids. The most chemically similar phospholipid is phosphatidylglycerol (PG) (Fig. 1c), a precursor of which CL is essentially a dimer.8–10 Apart from its role in the CL synthesis pathway, PG is prevalent in bacterial membranes and a minor constituent of eukaryotic membranes.11 There are two principal differences in the CL and PG headgroups: CL possesses two chemically distinct phosphatidyl moieties whereas PG has only one, and PG possesses two hydroxyl groups while CL retains only one. The dianionic CL structure thereby stands out as the main difference to the monoanionic PG. A number of selective probes have been described for the purpose of detecting CL,12–17 including the fluorescent dye 10-N-nonyl acridine orange (NAO) (Fig. 1d),12,13 but the degree to which these probes are optimally selective for CL relative to PG is not clear.13,18–23
Engineering selectivity into a molecular probe requires manipulation of the structure and physicochemical properties to stabilize favorable interactions with CL relative to other phospholipids, in particular, its chemically similar precursor PG. Due to the structural similarity of the two lipids, the design process must exploit the subtle differences in binding affinity mediated by the existence of two phosphate groups due to the four-acyl chain structure of CL relative to its two-acyl chain PG competitor. This motivates a design strategy targeting the lipid headgroups as the site of these distinguishing characteristics. The challenges posed by this subtle structural distinction are further compounded by the absence of a clear binding site—as might be anticipated in, for example, protein–ligand interactions—and the anticipated importance of inter-molecular, multi-body interactions between phospholipid chains within the membrane.
The objective of this work is to engage the design challenge posed by the subtle chemical differences between phospholipids and the lack of a defined binding site in lipid structures. To this end, we use a combination of a high-throughput virtual screening approach and data-driven active learning. The virtual screening is based on coarse-grained molecular dynamics simulations and alchemical free energy calculations, and the active learning employs deep representational learning using neural networks, Gaussian process regression surrogate models, and Bayesian optimization. As our objective function, we choose to maximize the difference ΔΔG in partitioning free energies between a CL and a PG membrane environment to maximize the thermodynamic preference of the molecule for CL relative to PG. By performing our screening using coarse-grained modeling we can substantially reduce the size of our search space without sacrificing coverage of chemical space. Because transferable coarse-grained models rely on a finite set of interaction types, many molecules map to the same coarse-grained representation.25 The accuracy and transferability of our coarse-grained model enable us to tractably and efficiently engage the space of ∼1060 small organic molecules with molecular weight up to 500 Da.26 The multiscale-based many-to-one mapping reduces to only 124![[thin space (1/6-em)]](https://www.rsc.org/images/entities/char_2009.gif) 327 unique coarse-grained topologies that maintain the pertinent physicochemical properties. Within this reduced chemical space, we conduct seven rounds of iterative computational screening and surrogate model building linking molecular structure to thermodynamic properties. We discover 242 compounds with up to 184% superior predicted thermodynamic selectivity for CL membranes relative to NAO.
327 unique coarse-grained topologies that maintain the pertinent physicochemical properties. Within this reduced chemical space, we conduct seven rounds of iterative computational screening and surrogate model building linking molecular structure to thermodynamic properties. We discover 242 compounds with up to 184% superior predicted thermodynamic selectivity for CL membranes relative to NAO.
The discovery of high performing compounds after sampling only 0.42% of the CG molecular design space exploits the power of the active learning protocol to efficiently guide sampling towards the most promising regions of chemical space to explore. Our molecular discovery platform also identifies human-interpretable design principles that furnish both novel molecular designs and promote new understanding of the subtle physicochemical molecular properties that lead to high CL selectivity. Specifically, post hoc analysis of the simulation data accumulated over the course of our active learning process enables us to identify chemical motifs that determine CL selectivity by building a sparsity-enforced structure–property regression model. We validate our computational model by performing experimental fluorescence anisotropy measurements of CL selectivity for two molecules selected according to our learned design rules and observe good concordance with our computational predictions. Our computational discovery platform is generically transferable to other molecular engineering applications by modular substitution of the selectivity assay for other addressable properties of interest.
2 Computational methods
2.1 Overview
We develop and deploy a computational screening active learning cycle for the data-driven discovery of small molecule probes highly selective to CL membranes (Fig. 2). In a nutshell, we (i) conduct coarse-grained molecular dynamics (CGMD) simulations and alchemical free energy calculations to measure the thermodynamic preference ΔΔG of a particular candidate molecule for a CL membrane relative to a PG membrane, (ii) build supervised regression models over a learned low-dimensional latent space to predict the performance of new compounds that have not yet been simulated, and (iii) apply Bayesian optimization to the trained regression models to identify the next most promising compounds to submit for computational screening. After running the active learning cycle for several rounds, we analyze the learned models in order to extract the physicochemical design rules underpinning the observed performance of the simulated candidates. We provide below the methodological details of each component of this computational workflow. A more comprehensive description of the theoretical bases and numerical implementations of these approaches is provided in the ESI.†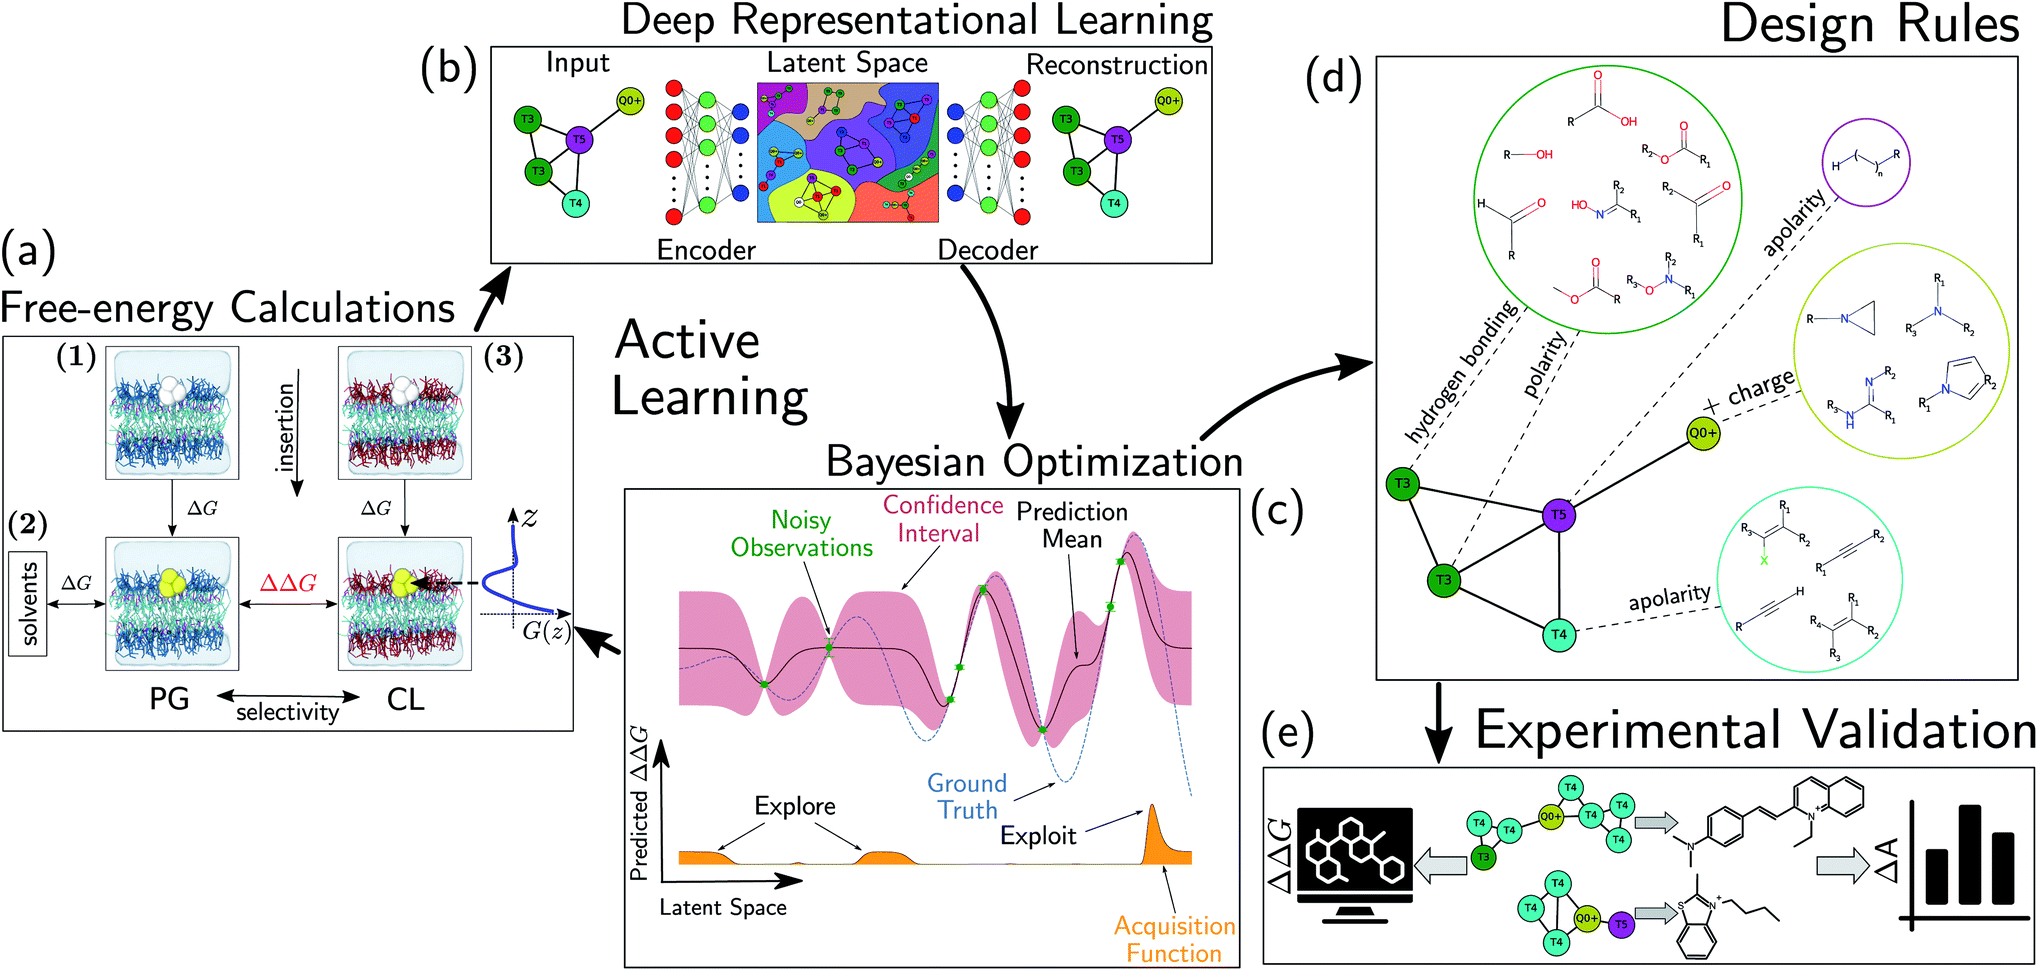 | ||
| Fig. 2 Active learning cycle for the automated discovery of small (≤500 Da) molecules with high CL selectivity. (a) Coarse-grained molecular dynamics (CGMD) simulations are performed to calculate the partitioning free energy of a molecule into PG and CL membranes used to evaluate the CL selectivity ΔΔG. (b) Deep representational learning using a regularized autoencoder (RAE) is used to construct a fixed-size latent space embedding of the discrete molecular design space encompassing all coarse-grained molecular candidates. Gaussian process regression (GPR) surrogate models are fit using all accumulated simulation data to predict the CL selectivity ΔΔG of all untested compounds within the design space. (c) These surrogate model predictions are then interfaced with a Bayesian optimization platform to select the next most promising compounds for computational simulation. This process iteratively continues until multiple consecutive active learning rounds fail to identify new top-performing compounds. (d) Using our accumulated simulation data we extract design rules linking the inclusion/omission of chemical functional groups to the degree of CL selectivity ΔΔG by building of interpretable linear models using graph representational learning. (e) The design rules are used to select candidate compounds that are subjected to fluorescence anisotropy measurements as well as CG free energy calculations to validate our findings. Structures in this panel are drawn with ChemSketch,24 the icons were obtained from https://Flaticon.com. | ||
2.2 Coarse-grained molecular design space
The molecular design space for our computational screening is formed from organic molecules with molecular weights less than or equal to 500 Da. We impose this upper weight threshold in order to promote high mobility and diffusion into and through membranes.7 No atom types are excluded from our design space. The number of molecules satisfying these criteria is ∼1060,26 motivating the use of approximations and simplifications to efficiently screen this subset of chemical space. To this end, we employ the coarse-grained (CG) Martini 2 molecular model, that both greatly reduces the cost of our molecular simulations and significantly reduces the size of chemical compound space by grouping molecules into a smaller number of CG representations.27–29 The Martini model was parameterized against thermodynamic data to generate 14 neutral and four charged CG bead types (14 + 4 bead-type model) representing most physicochemical interactions relevant in biomolecular settings. This building-block approach allows the rapid generation of new representations without requiring individual reparameterization and provides a good balance between chemical accuracy and computational efficiency. The Martini CG force field has been widely used in the study of membrane organization and dynamics,30–33 drug-membrane permeability,34–38 and membrane–protein interactions.39–43 More recently it has been shown that even coarser models, going as low as five bead types, represent the underlying physical properties comparably well while facilitating more thorough coverage of chemical compound space by reducing the combinatorial complexity.25 We created a 5 + 1 bead-type CG model through extending the five bead-type 5 + 0 reduced Martini model25 by one charged bead-type to fully represent the candidate small molecule probes. The additional charged bead-type represents single positive or negative charges (Q0±). We offset this increase in complexity by removing the two non-polar bead types representing only hydrogen bond donor or acceptor properties (T3d, T3a), as the reduced Martini model already contains a nonpolar hydrogen bond donor- and acceptor bead-type (T3) that represents both interaction types simultaneously. The complete 5 + 1 model comprises the set of five neutral bead types ordered by descending polarity and one charged bead type {T1, T2, T3, T4, T5, Q0±} as illustrated in Fig. S1 in the ESI.† This reduced model allowed us to explore the chemical compound space more efficiently compared to the 14 + 4 interaction type scheme applied in Martini.27 The combinatorial candidate space of compounds less than 500 Da was defined by constructing all plausible molecular graphs containing five or fewer 5 + 1 beads, resulting in 124327 candidate compounds.
2.3 Coarse-grained molecular dynamics (CGMD) simulations
We constructed CL and PG membranes comprising 98 and 118 lipid molecules, respectively, using the CHARMM-GUI Martini maker.44 The membranes were solvated in 3287 water particles for CL and 1754 water particles for PG. A sufficient number of sodium ions (Na+) to maintain charge neutrality were added: two Na+ ions per CL headgroup since the double negative charged CL model was chosen,45–47 and one Na+ ion per PG headgroup. The CL and PG phospholipid membranes were represented using the Martini 2 force field,27 water using the refined parameters for polarizable water,29 and ions using the polarizable ion model.28 Coarse grained molecular dynamics (CGMD) simulations were conducted using GROMACS 2018.6 (ref. 48) implementing the standard Martini run parameters introduced for GPU acceleration.49 Full details of the force field and run parameters are reported in the ESI.†2.4 Alchemical free energy calculations
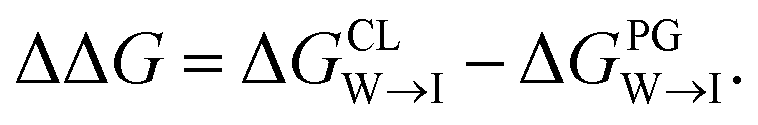
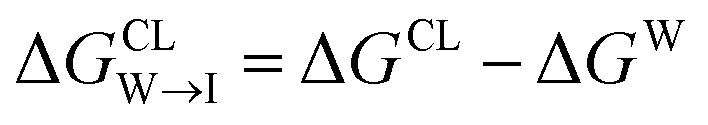
We evaluate CG candidate molecules based on their thermodynamic affinity for a CL membrane environment relative to a PG membrane. It is our goal to maximize the affinity of the probe for CL and simultaneously minimize its affinity for PG in order to maximize CL selectivity. It is computationally intractable to consider all possible competing phospholipid environments in our molecular screen, so we adopt PG as the negative design target as the most chemically similar phospholipid to CL and therefore the most challenging target for negative design. We quantify selectivity by computing the relative partitioning free energy ΔΔG for each candidate molecule between the transfer free energy from the water phase to the interface region of a PG membrane and the same transfer for a CL membrane
 | (1) |
We focus on the water–membrane interface since it is the water-facing lipid headgroups that are the site of the primary chemical difference between CL and PG, and therefore the region of interest for engineering target selectivity.
All free energies are calculated using CGMD alchemical free energy calculations,50 using the MBAR method51 with tools provided by the pymbar52 package. Full details of the calculation procedure are reported in the ESI.† Calculation of ΔΔG for a single candidate molecule requires approximately ∼24 GPU h for an uncharged molecule and ∼48 GPU h for a charged molecule on a single NVIDIA Tesla V100 GPU card. Exhaustive simulation of all 124327 candidate molecules would therefore require ∼4.8 M GPU h conservatively assuming an average simulation time per molecule of ∼36 GPU h. To reduce the overall computational cost, we adopted a three-step hierarchy for the calculations that enables early exit for unviable candidate molecules. Only candidates that meet our minimum requirements of easily partitioning into and aligning with the interface region of the PG membrane are subjected to the most computationally expensive calculations in the CL membrane.
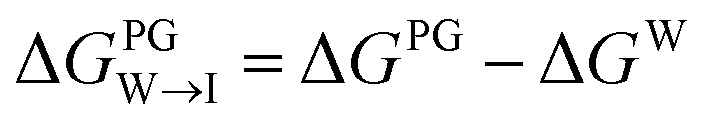 from the water phase to the interface and
 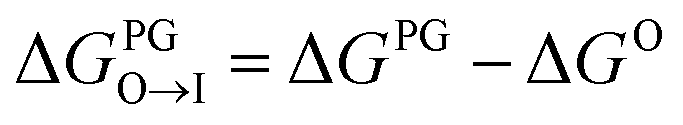 from the midplane to the interface. Negative values for both
  and
and  confirm a spontaneous insertion of the candidate at the PG interface.
 from the water phase to the interface and
 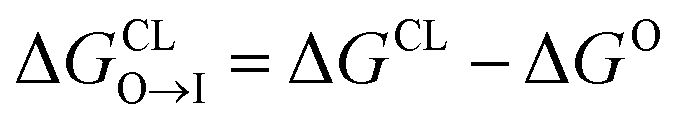 from the midplane to the interface. We now have all the ingredients to quantify the compound's thermodynamic preference for the CL membrane relative to its PG counterpart,
  Larger negative values of the transfer free-energy difference ΔΔG are indicative of stronger thermodynamic selectivity for CL relative to PG.
2.5 Chemical space embedding
Each of the 124327 CG molecular candidates in the design space is represented as a molecular graph composed of up to five beads selected from the possible six bead types and different charge states of the 5 + 1 model {T1, T2, T3, T4, T5, Q0±}.25 The nodes of the graph represent the identity of each bead in the molecule and the edges capture the connectivity of the beads within the CG topology. Performing molecular design and optimization directly over the discrete molecular design space has been demonstrated using kernel-based methods.53–59 Here, we choose to project candidate molecules into a learned, smooth, low-dimensional, and continuous embedding. This approach renders our design space amenable to the construction of low-dimensional and robust surrogate models and the use of off-the-shelf Bayesian optimization algorithms.60,61 We learn an appropriate latent space embedding in a data-driven fashion by training a regularized autoencoder (RAE),62 a deterministic adaptation of the variational autoencoder (VAE) architecture,63 over the corpus of 124327 CG molecular graphs (Fig. 2b). The encoder-decoder architecture is composed of a message passing neural network encoder and a permutation-invariant graph decoder.64–68 The network accepts graph-structured molecular representations where the nodes are featurized with one-hot representations of the bead type and the charge state. The edge between two nodes relies on the corresponding Lennard-Jones 6–12 interaction parameter. It is the objective of the RAE encoder to learn a smooth and continuous latent representation containing the salient information about the input graphs from which the decoder can accurately reconstruct (i.e., auto-encode) the same graph. We achieve good reconstruction performance employing a 16-dimensional bottleneck layer between the encoder and decoder that defines our latent space dimensionality and representation, and within which we define measures of proximity between candidates and construct our surrogate models and perform global optimization via active learning. Although RAEs are generative models that when trained on open data sets are in principle capable of producing never-before-seen reconstructions, our model operates within a fully enumerated and fixed molecular design space such that we do not require this generative functionality. Rather, upon completing training, the decoder is discarded and the encoder alone is purposed for dimensionality reduction mapping our 124327 candidate design space into a continuous embedding for downstream application within our active learning workflow. RAE models were constructed and trained using PyTorch.69 The RAE was trained only once over all 124327 candidate molecules prior to commencing active learning. Training required ∼36 GPU h on a single NVIDIA Tesla V100 GPU card. Full details of the network architecture and training are provided in the ESI.†
2.6 Active learning
The primary goal of our active learning cycle is to efficiently discover CG compounds within the 124327-member candidate space with high selectivity for CL membranes (i.e., large negative ΔΔG). The high computational cost to measure the selectivity of each candidate precludes an exhaustive traversal of these candidates and we must employ a more computationally efficient search strategy. We achieve this by iterating between targeted CGMD simulations of promising candidates designed using a surrogate model relating molecular structure to CL selectivity ΔΔG and the training and interrogation of these surrogate models constructed over the 16-dimensional RAE latent space. To ensure broad initial coverage of the molecular design space, we seed the first round of active learning by conducting CGMD simulations of 100 compounds residing closest to the centroids of a 100-cluster k-means partitioning of the latent space.70 We then trained a Gaussian process regression (GPR)71 surrogate model with a Gaussian kernel to learn a mapping from the 16-dimensional latent space coordinates to the calculated ΔΔG. The trained model was then applied to predict the ΔΔG values for all remaining 124, 327 − 100 = 124, 227 compounds in the design space along with the predicted model uncertainties. The predictions of the surrogate GPR model were then interfaced with a Bayesian Optimization (BO)72 framework using the Expected Improvement (EI)72,73 acquisition function and kriging believer batched sampling74 to identify a 60-molecule batch of candidates with the most promising (i.e., lowest) values of ΔΔG (Fig. 2c). Importantly, the EI acquisition function accounts for both the value of the GPR predictions and its estimated uncertainties, enabling the BO-directed active learning search to direct inquiry towards both regions of design space with favorable predictions (exploitation) and under-explored regions with high uncertainties (exploration). This batch of 60 compounds is then subjected to CGMD free-energy calculations to evaluate their associated ΔΔG values and the cycle repeats. Each round of active learning involves updating the training dataset based on all accumulated simulation data, refitting the GPR to predict out-of-training sample ΔΔG selectivity, and BO selection of the most promising compounds to simulate next (Fig. 2a–c). Convergence of the active learning cycle is monitored by tracking the distribution of ΔΔG values measured in each round, and the process is terminated when multiple consecutive rounds fail to identify new best performing candidates. As detailed below, we compute ΔΔG values for a total of N = 439 interfacial molecular candidates.
2.7 Inference of design rules
After completing the active learning screen, we analyzed the collected library of ΔΔG values to extract human-interpretable design rules linking the presence or absence of particular CG structural motifs to the calculated values of the transfer free energy (Fig. 2d). We constructed these interpretable models by decomposing each CG topology as a distribution of relative subgraph frequencies and then performed sparse LASSO regression to rank the most impactful subgraph motifs. We begin by enumerating k = 1608 topologically unique subgraphs with 1–5 CG beads that are contained within the N = 439 interfacial compounds. Each CG topology is then featurized as a length-k vector of subgraph frequencies, reweighted to account for the over counting of smaller subgraphs necessarily contained within larger subgraphs, and normalized to unit length.75 Assembling these featurizations into a normalized frequency matrix F ∈ IR(N=439)×(k=1608) we adopt a simple and interpretable linear model for predicting transfer free energy based on these relative subgraph frequencies,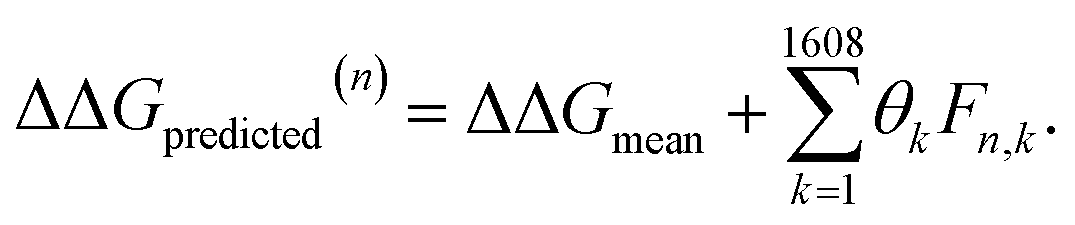 | (2) |
ΔΔGmean is the arithmetic mean of all N = 439 ΔΔG values and the regression coefficients θ ∈ IR1608 assign weights to the different subgraph frequencies. The coefficients θ are learned by minimizing the LASSO regression loss between the predicted and the calculated free energies, ΔΔGpredicted, ΔΔGref, respectively. The resulting expression yields
 | (3) |
2.8 Functional group analysis
The CG model integrates out atomic-level information to only keep essential physicochemical properties. The ability to backmap from coarse-grained to all-atom resolution would offer chemical insight as to compounds of interest. As such, we aim to identify the diversity of all-atom structures given CG graphs of interest. This problem is more easily addressed by working from high- to low resolution: we consider a large set of molecules and coarse-grain them all. In this work we relied on the Generated DataBase (GDB).76 We only considered molecules mapping to a single CG bead (1481 molecules of a size up to six heavy atoms).35 On top of their original neutral form, we used the Calculator Plugin of Marvin77 by ChemAxon to estimate their protonation state at pH 7. In addition, we account for aromatic groups by further considering around 22000 small five- or six-member cyclic compounds. The CG representations of cyclic molecules were used to evaluate how heteroatoms or substituents present in cyclic hydrocarbons affected the choice of bead types in the coarse-graining process. To automatically identify functional groups, bead types were linked to chemical information using an algorithm described by Ertl78 and implemented in RDKit.79 We extended the Ertl algorithm to recognize and name the most common functional groups found in bioactive molecules80 as well as additional chemical structures repeatedly encountered in our GDB-derived dataset. More detail of this analysis is provided in the ESI.† Probabilities of functional groups mapping to a CG bead type were inferred through observation frequencies. The probabilities between CG bead type and functional group offer a practical link to translate CG design rules into chemical structures.
3 Experimental methods
3.1 Fluorescence anisotropy
1,2-Dioleoyl-sn-glycero-3-phosphocholine (DOPC), 1,2-dioleoyl-sn-glycero-3-phosphoglycerol (DOPG), and cardiolipin (CL) were purchased from Avanti Polar Lipids (Alabaster, ALA, US). 1,6-Diphenyl-1,3,5-hexatriene (DPH) was purchased from Fluka Analytical (Charlotte, North Carolina, US). The small molecule candidate compounds were purchased from Mcule (Budapest, HUN). Liposome solutions with a total lipid concentration of 300 μM, 0.6 μM of DPH, and 3 μM of the indicated substance, were prepared as follows: the lipids (dissolved in chloroform) were mixed in the described ratio with DPH (dissolved in chloroform) and, if needed, the small molecule candidate compound (dissolved in methanol). The solvents were removed under a gentle nitrogen stream and the lipids were desiccated overnight under vacuum. The next day, the lipids were dissolved in 10 mM 4-(2-hydroxyethyl)-1-piperazineethanesulfonic acid (HEPES)-buffer (pH 7.4, 150 mM NaCl) via vortexing 2× for 1 min, followed by 5 freeze–thaw circles. 250 μL of each sample was measured at 25 °C. Each lipid composition was measured at least three times using fresh lipid preparations. Anisotropy was measured using a Fluoro-Max-4 fluorescence spectrometer (Horiba (Bensheim, Germany)). Single point anisotropy was measured with 5 nm bandwidth, an excitation wavelength of 350 nm and an emission wavelength of 452 nm. Each sample was measured five times and the results were averaged. Samples in the absence and presence of the small molecule candidates were measured leading to the anisotropy difference,| ΔA = As − A∅, |
4 Results and discussion
4.1 Active learning identifies highly cardiolipin-selective compounds
We perform active-learning directed CG alchemical free energy calculations within an RAE-learned chemical space embedding to discover compounds with high thermodynamic selectivity for CL membranes. We conduct seven rounds of active learning during which we consider 520 molecules (100 seeded and 60 per round) within the search space of 124327 possible CG candidates. The majority (439 of 520) of these molecules were observed to be interfacial and for which we performed the complete alchemical free-energy calculations to determine ΔΔG. The remaining 81 compounds failed to partition to the membrane interface, were deemed non-interfacial, and the free energy calculations terminated early as a resource-saving strategy.
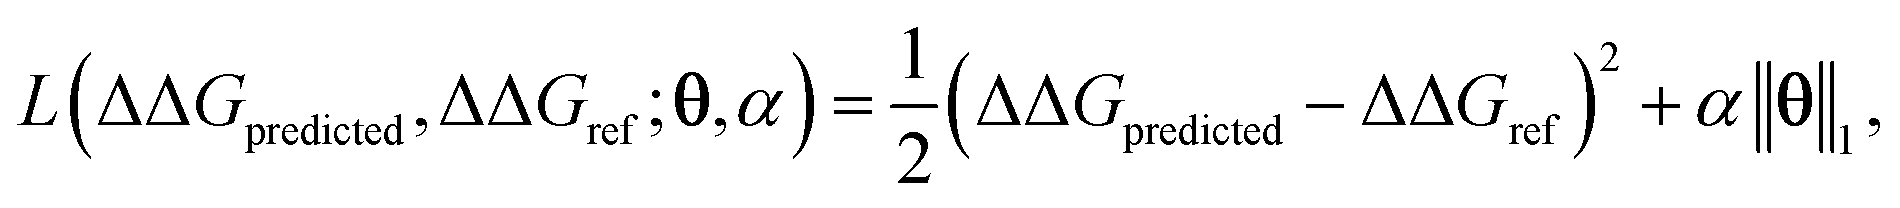
The intent of the active learning search was to efficiently navigate chemical space to identify profitable regions of our learned latent space embedding densely populated with high-performing candidates by balancing exploration—compounds predicted with high uncertainty, and exploitation—compounds predicted with high performance. The performance of the active learning search is presented in Fig. 3a, which illustrates the distribution of ΔΔG values within each round, and Fig. 3b, which illustrates the corresponding location within the latent space of the selected candidates. The distribution of ΔΔG values tends towards more negative values over the course of the search, indicating that the active learning strategy is successfully discovering high-performing candidate molecules. Particular rounds tend to perform more exploration, such as Rounds 6 and 7, reflected by more variance in the sampled ΔΔG distribution, broader latent space sampling, and a higher proportion of selected non-interfacial compounds. Other rounds, such as Rounds 4 and 5, tend to be more exploitative, reflected by more localized latent space sampling and ΔΔG distributions with more weight in the negative tail. While these trends in sampling help provide some intuition for the progress of the active learning process, our use of the expected improvement acquisition function within our Bayesian optimization selection procedure means that each round naturally balances exploration and exploitation to select the next most effective compounds to simulate in order to maximize the chances of discovering high-performing candidates within the design space.
 | ||
| Fig. 3 (a) Distribution of calculated thermodynamic selectivities for CL relative to PG membranes ΔΔG for CG compounds simulated in each active learning round. Each active learning cycle employs Bayesian optimization to select 60 candidate molecules for which we calculate ΔΔG using alchemical free energy calculations and which are used to iteratively retrain and update the model for subsequent rounds of selection. (b) Latent space embeddings of simulated compounds visualized in a 2D principal component analysis projection of the 16-dimensional RAE latent space. Points are colored by their calculated ΔΔG. Dark blue points represent compounds that fail to spontaneously insert into the membrane bilayer and are deemed not interfacial and hence are terminated early within the workflow without finalizing the ΔΔG calculation. Model predictions become more accurate round by round as data is accumulated enabling the acquisition function to progressively better localize sampling in regions of latent space rich in high-performing compounds. | ||
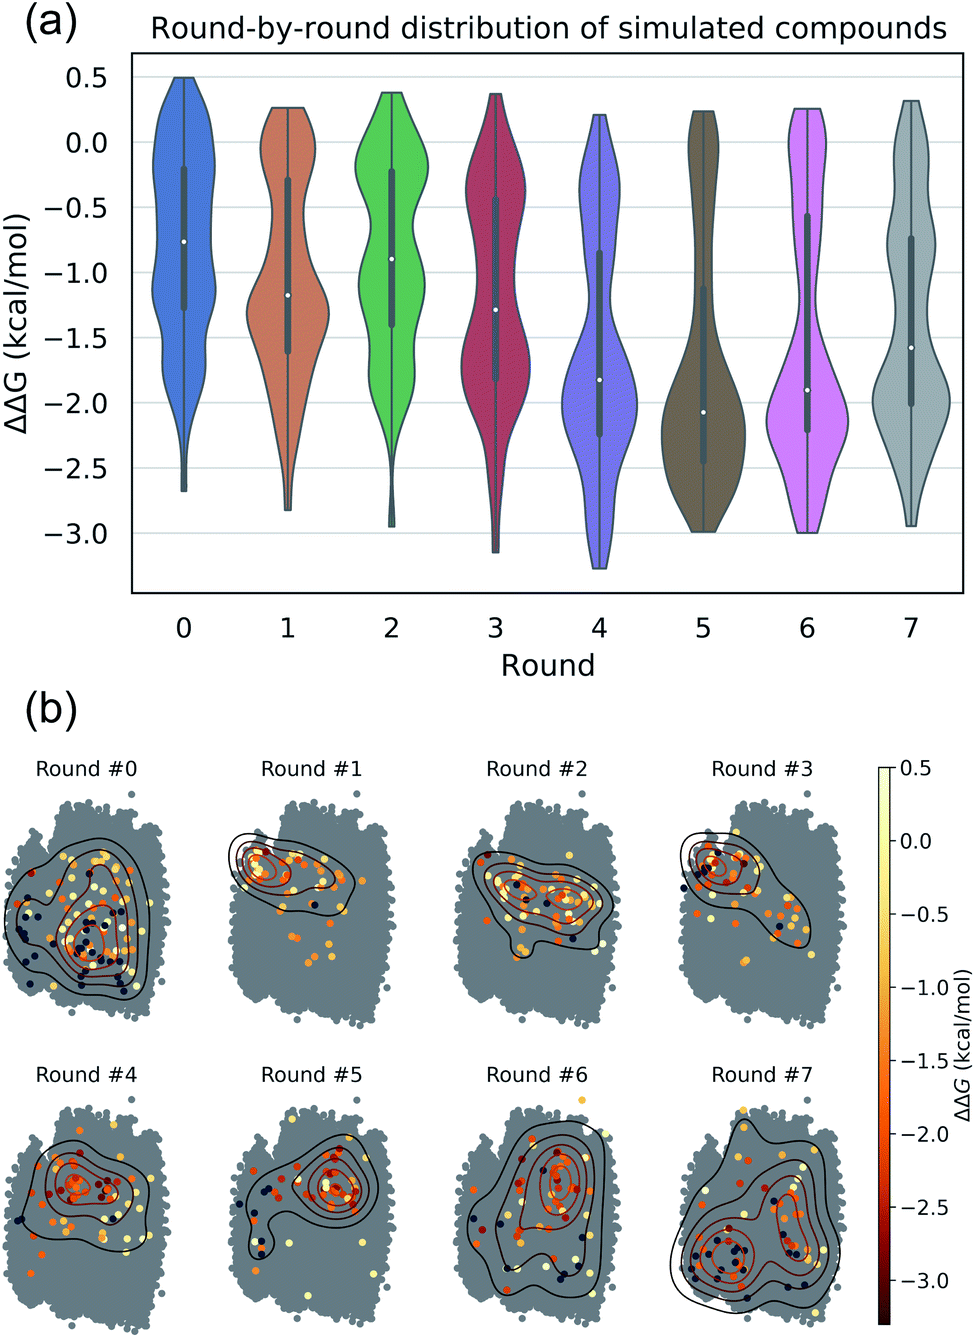
We assessed convergence of the active learning by monitoring the performance of the best observed candidates after each round. Throughout the first four rounds we observe an approximately linear decrease in the overall best observed ΔΔG, with the following three rounds yielding no overall improvement but nonetheless identifying relatively high performing candidates (Fig. 4a). The stagnant improvement over the last three rounds motivates us to terminate sampling after Round 7. Over the course of the seven rounds of active learning we observed a 22.2% improvement in the best calculated ΔΔG after simulating a total of only 520 molecules, corresponding to a mere 0.42% of the 124327 possible candidates. We present in Fig. 4b the 12 molecules with the best (i.e., most negative) ΔΔG identified over the course of our search. Importantly, the best performing candidate possesses a ΔΔG = −3.27 kcal mol−1 corresponding to a 184% improvement over the NAO fluorescent dye molecule which possess a thermodynamic selectivity of only ΔΔG = −1.15 kcal mol−1 calculated under our CG model. A full accounting of the measured ΔΔG values for all 520 candidates is provided in the Data availability statement.81
 | ||
| Fig. 4 (a) Best sampled ΔΔG for each active learning round alongside the cumulatively best sampled molecule in each round. The top axis denotes the number of compounds simulated after each round and in parentheses as a percent of the 124327 molecule design space. Errors represent uncertainly in the measured ΔΔG for the associated compound. The best candidate was selected after round four, with the final three rounds failing to identify any new better performing candidates. (b) The 12 best coarse-grained molecules identified over all seven active learning rounds sorted by increasing ΔΔG. Large negative values of ΔΔG correspond to high thermodynamic selectivity for CL over PG membranes. | ||
We can approximately quantify the savings afforded by our active learning process in discovering our best performing molecule by comparing against a baseline of naïve random sampling. A simple statistical analysis reveals that performing random selection of candidates within our 124327 molecule candidate space and still considering 60 molecules per round, we would expect to happen upon our best-performing candidate with a 25% chance of success after ∼518 rounds and with a 50% chance of success after ∼1036 rounds. Although chemical intuition and prior experience could be used to guide the search, the bias and preconceptions that this introduces risks missing non-intuitive but high-performing candidates, and this baseline random search comparison nonetheless effectively highlights the value of our data-driven approach for guided molecular discovery.
4.2 Data-driven discovery of chemical design rules
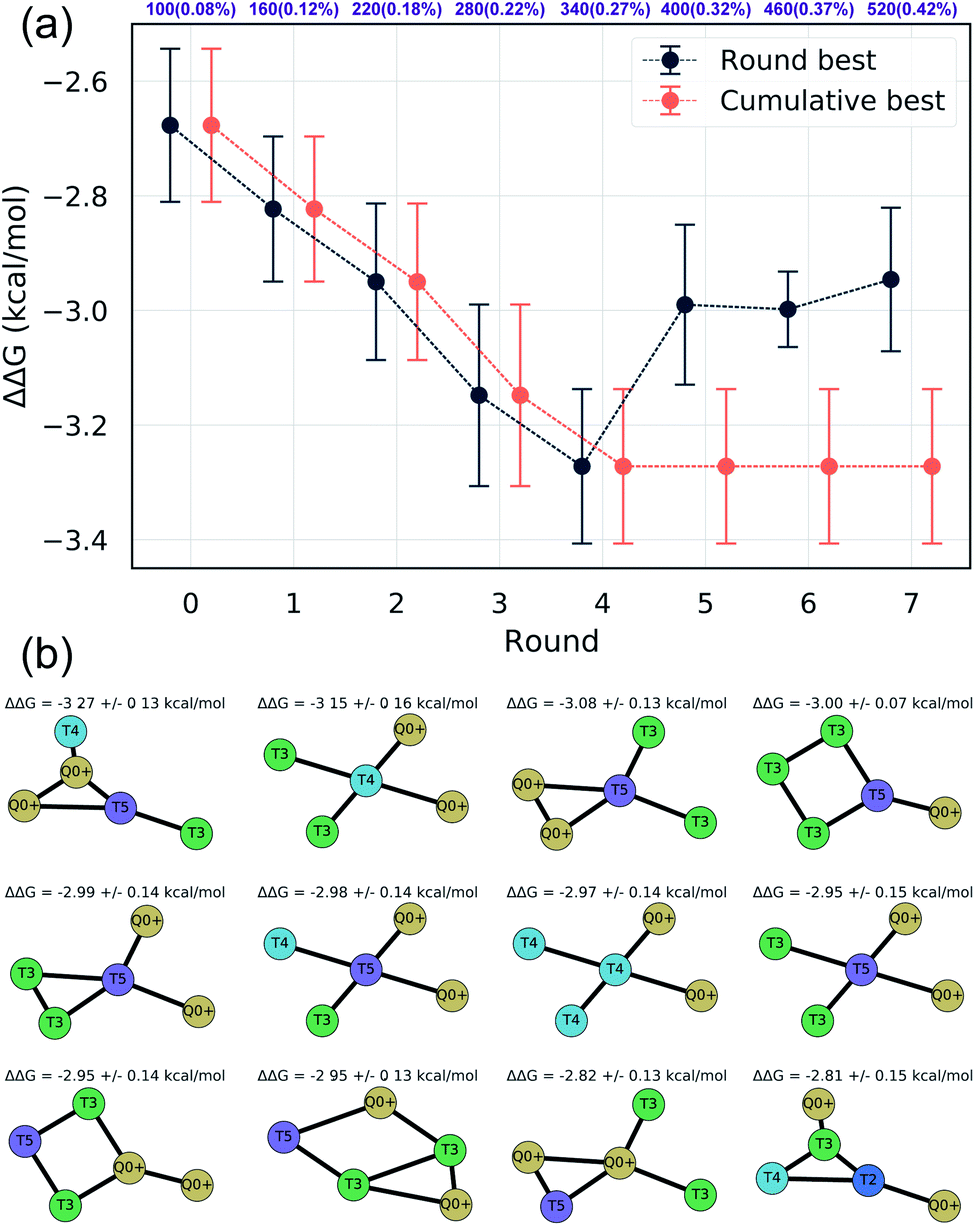
Having completed seven rounds of active learning and calculating ΔΔG values for N = 439 compounds, we proceed to use graph representational learning to discover design rules correlating the presence/absence of chemical motifs to CL selectivity. In the interest of simplicity and interpretability, we adopt a simple linear model given in eqn (2) for predicting the calculated transfer free energy of a molecule via a featurization based on its decomposition into topologically unique structures with 1–5 CG beads. This model is trained using the LASSO regression algorithm to promote sparsity where select elements from the learned model weights are set precisely to zero θk = 0, and the nonzero weights ‖θk‖ > 0 correspond to a small number of the most generalizable features retained by the model. Based on the linear structure of eqn (2) the sign of learned nonzero weights θk indicates whether the corresponding subgraph motifs contribute to more favorable ΔΔG values leading to better CL selectivity if θk < 0, or unfavorable ΔΔG values if θk > 0. Furthermore, as the subgraph representations Fn,k in eqn (2) are normalized and therefore unitless, the coefficient weights θk carry the same units as ΔΔG of kcal mol−1. The magnitude of these coefficient weights θk can therefore be interpreted as the extent in kcal mol−1 that the representation of specific subgraph motifs improve, if θk < 0, or degrade, if θk > 0, upon the average CL selectivity ΔΔGmean. Analyzing the prevailing structural features and characteristics contained in the largest magnitude model weights serves as a data-driven approach for unveiling critical determinants of CL selectivity.In Fig. 5 we present a rank ordering of the largest magnitude nonzero model weights θk partitioned by the sign of the weight, sgn(θk). These largest magnitude weights can be interpreted as corresponding to CG motifs with the highest predictive capacity and therefore the most influential for determining CL selectivity. We note that while this analysis pertains to the CG space our active learning search is performed in, the following Sec. 4.3 provides further analysis linking CG beads and structures to atomistic functional groups. This current analysis reveals the importance of subgraph motifs containing positive net charges (Q0+), apolar (T5) bead types, and weakly polar T3 bead with both hydrogen bond donor- and acceptor properties in promoting favorable CL selectivity (i.e., negative values of ΔΔG). Contrariwise, negative charges (Q0−) and highly polar beads (T1, T2) tend to impair CL selectivity. These observations can be intuitively rationalized, given the two phosphate groups of CL that are predominantly negatively charged in the physiological pH range,46,82 and the close proximity of the hydrophobic lipid tails to the interface region caused by the unique shape of the CL headgroup. The presence of apolar regions in the candidate structures therefore facilitates easy insertion into the membrane. Electrostatic interactions have been described as primary interaction modes of small molecules with the CL headgroup and the important role of hydrophobic interactions has also been recognized.12–14,83,84 The small CL headgroup containing a single hydroxy group also suggests that hydrogen bonding may represent an important interaction type for targeting CL, and this correlates well with the frequent appearance of the T3 beads in the identified chemical motifs. Taken together, this analysis allows us to extract the following design rules for highly CL-selective small molecules from the active learning results:
 | ||
Fig. 5 Rank-ordering of learned coefficient weights θk corresponding to CG motifs for predicting measured ΔΔG. Each compound n is featurized by calculating the normalized frequency of all k topologically unique subgraphs consisting of 1–5 CG beads, denoted Fn,k. Using this featurization we perform LASSO regression to predict the calculated ΔΔG obtained from the alchemical free energy calculations using eqn (2): 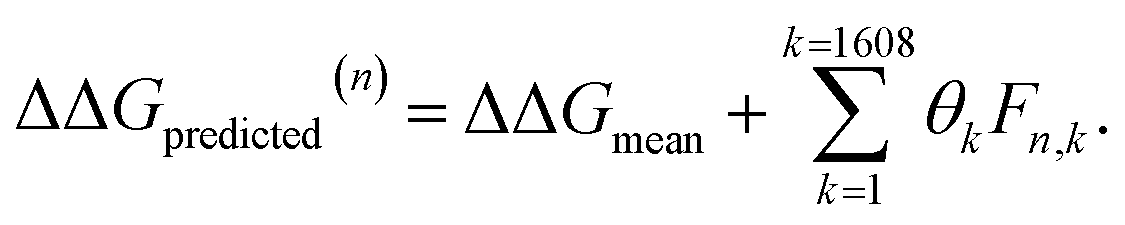 We then extract the associated largest and smallest learned coefficient weights θk from the reduced feature set retained by the LASSO model. The most negative coefficient weights correspond to chemical motifs indicative of small ΔΔG and good CL selectivity, while the most positive weights correspond to motifs predicative of large ΔΔG and poor CL selectivity. As the weights θk have units of kcal mol−1 these weights can be interpreted as the magnitude of the influence of the corresponding subgraph motif on CL selectivity. We then extract the associated largest and smallest learned coefficient weights θk from the reduced feature set retained by the LASSO model. The most negative coefficient weights correspond to chemical motifs indicative of small ΔΔG and good CL selectivity, while the most positive weights correspond to motifs predicative of large ΔΔG and poor CL selectivity. As the weights θk have units of kcal mol−1 these weights can be interpreted as the magnitude of the influence of the corresponding subgraph motif on CL selectivity. | ||
(1) At least one, ideally two sites that will carry a positive charge at physiological pH (pH ≈ 7.3).
(2) Hydrophobic areas in the molecule that induce alignment with or insertion into the lipid bilayer.
(3) Functional groups able to form hydrogen bonds with the CL headgroup.
4.3 All-atom backmapping
We adopted the 5 + 1 CG model in order to efficiently screen chemical space at the cost of integrating atomic representations into coarse-grained beads. The top performing candidates identified within our active learning search are therefore represented as bead graphs as opposed to chemical structures. In order to approximately recover these lost degrees of freedom, we perform a backmapping analysis to identify functional groups with physical and chemical properties consistent with each CG bead. Due to the information removed by the coarse-graining procedure, there are multiple all-atom structures consistent with each CG representation, i.e., the mapping is many-to-one. The most prevalent bead to all-atom functional group mappings resulting from our analysis are shown in Fig. 6 and 7. The mapping probabilities for cycle-containing groups are presented in Fig. S25 in the ESI.†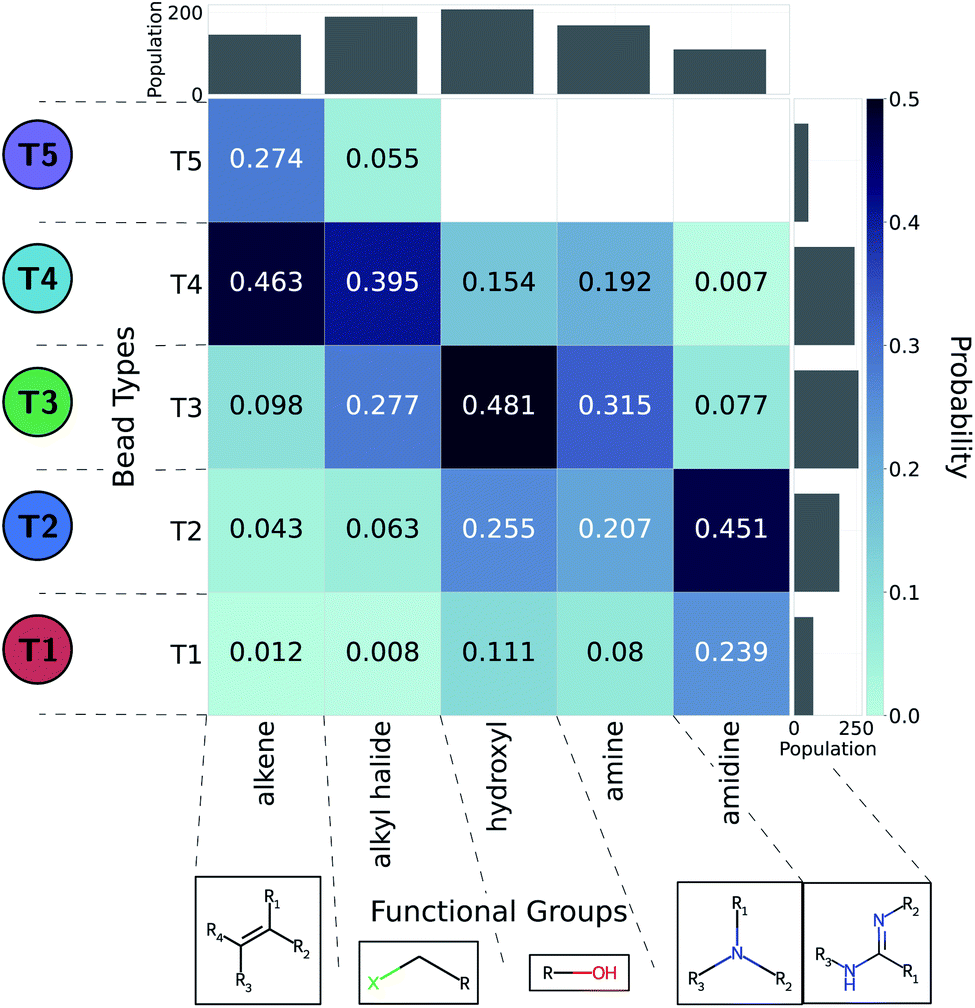 | ||
| Fig. 6 Five functional groups most frequently mapped to the uncharged beads of the 5 + 1 reduced Martini model.25,35 Dark colors represent higher mapping probabilities. | ||
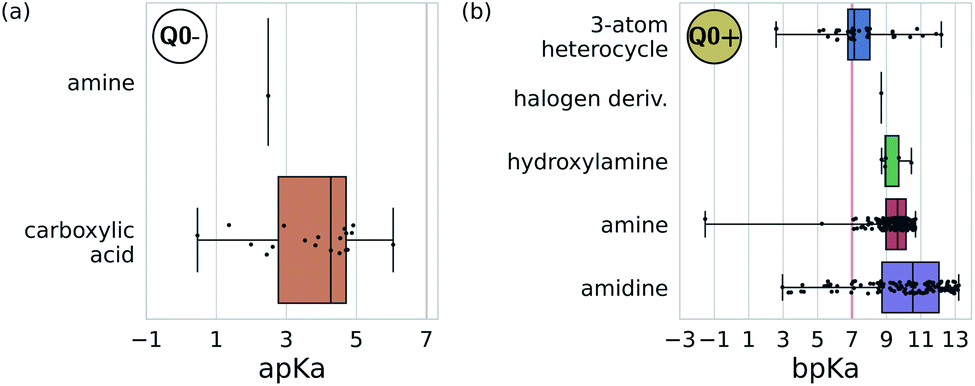 | ||
| Fig. 7 Predominant functional groups mapped to the charged bead type Q0± within our 5 + 1 reduced Martini model.25,35 (a) Functional groups with apKa ≤ 7 are most likely to be negatively charged under physiological conditions (pH ≈ 7.3) and are mapped to the Q0− bead. (b) Those with bpKa ≥ 7 are most likely to be positively charged and are mapped to the Q0+ bead. | ||
While a rigorous strategy for the backmapping of any CG molecule to all possible atomistic counterparts is beyond the scope of the present work, we illustrate in Fig. 8 the diversity of all-atom structures represented by a single coarse-grained molecule by presenting the range of GDB-derived small molecules whose coarse-grained mapping corresponds to a T3–T5 dimer as one of the chemical motifs correlated with increased CL selectivity (see Sec. 2.7). We identify a total of 2157 GDB-derived small molecules consistent with a T3–T5 dimer and render the chemical structures of seven of these in an attempt to convey the chemical diversity contained within this single coarse-grained dimer. We intentionally adopted a coarse-grained model for our screening procedure in order to reduce the size of chemical space and accelerate our simulations. This allowed us to efficiently identify CG representations of molecules predicted to have high CL selectivity, but results in enormous redundancy in the number of all-atom structures consistent with a single CG representation. Naturally the CG model is not able to rank compounds that map to the same CG representation. As such, CG modeling acts as a funnel to efficiently filter out uninteresting compounds. The results yield a small set of top performing CG structures, which can be further backmapped to an atomistic resolution. The set of consistent all-atom representations can be filtered to further design other desirable characteristics, such as functional groups that endow fluorescence or other optical responses desirable for imaging agents. They also naturally lend themselves to validation and applications, through all-atom simulations or experiments. In the next section we pursue the latter strategy to validate our computational predictions using fluorescence-anisotropy experiments. In future work, we would also like to pursue all-atom calculations of the top-performing candidates identified in our CG calculations but currently face challenges associated with the absence of validated all-atom force field parameters and exceedingly high computational complexity of all-atom free-energy calculations in membrane systems.85
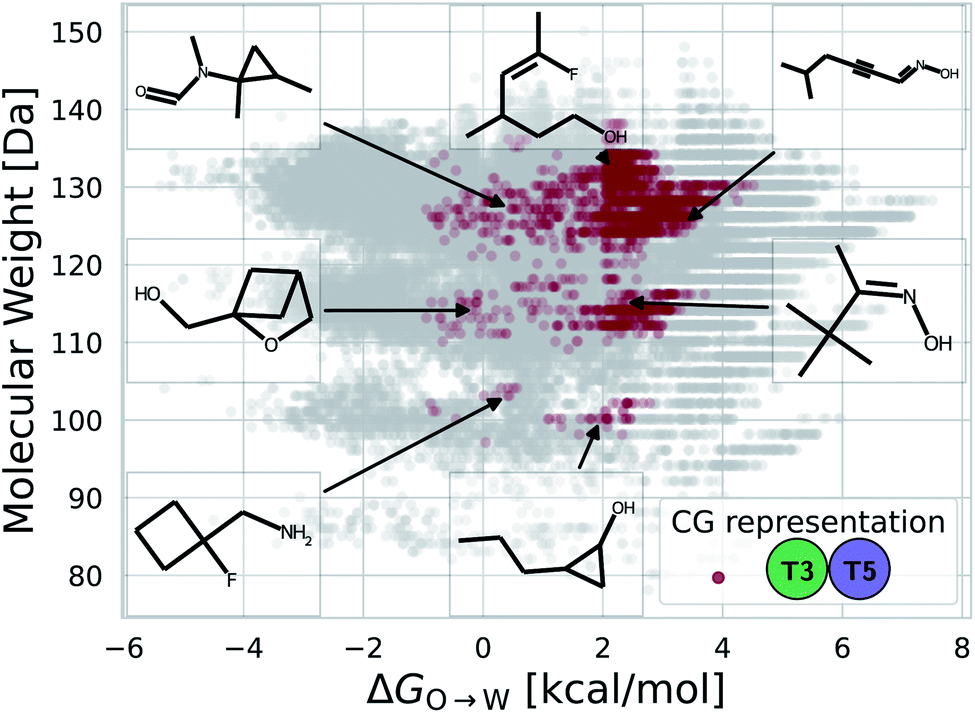 | ||
| Fig. 8 Backmapping of a coarse-grained T3–T5 dimer. The ensemble of 55639 GDB-derived small molecules consistent with any coarse-grained dimer are projected as grey points into the 2D plane spanned by the two order parameters of molecular weight and octane to water transfer free energy ΔGO→W. We highlight in red the 2157 GDB-derived small molecules whose coarse-grained mapping corresponds to a T3–T5 dimer. The chemical structures of seven molecules are visualized. A large number of diverse chemical structures map to a particular CG representation. | ||
4.4 Validating simulations against experimental measurements
We test the validity of our CG predictions of thermodynamic selectivity and of the learned design rules by comparing calculated ΔΔG transfer free energies against experimental measurements of CL selectivity for two molecules: quinaldine red (4-[(E)-2-(1-ethylquinolin-1-ium-2-yl)ethenyl]-N,N-dimethylaniline) and benzothiazolium (3-butyl-2-methyl-1,3-benzothiazol-3-ium) (Fig. 9). We selected these molecules according to our learned design rules, they were therefore predicted to preferentially partition into CL membranes. These molecules both possess at least one ionizable group that will likely be positively charged at pH ≈ 7, hydrophobic character, and aromatic ring systems and partial charges that may participate in hydrogen bond formation. We experimentally measured the interaction of these two molecules with model membranes consisting of 100% 1,2-dioleoyl-sn-glycerol-3-phosphocholine (PC), 90% PC/10% 1,2-dioleoyl-sn-glycerol-3-phosphoglycerol (PG), and 90% PC/10% CL. We hypothesized that permeation of the molecules into the lipid membranes would affect lipid packing and order. This can be monitored using an experimental fluorescence anisotropy assay to report the differential fluorescence anisotropy ΔA = As − A∅ of a lipid membrane in presence of the candidate molecule As and in its absence A∅. Our hypothesis is that the two selected molecules should lead to a moderate increase in anisotropy ΔA if they incorporate into a membrane, and to a larger increase if they not only incorporate, but specifically interact with a lipid species in the membrane. The measurements of the pure PC membrane were added to differentiate between simple incorporation and specific interactions, since the latter were not to be expected with this particular phospholipid.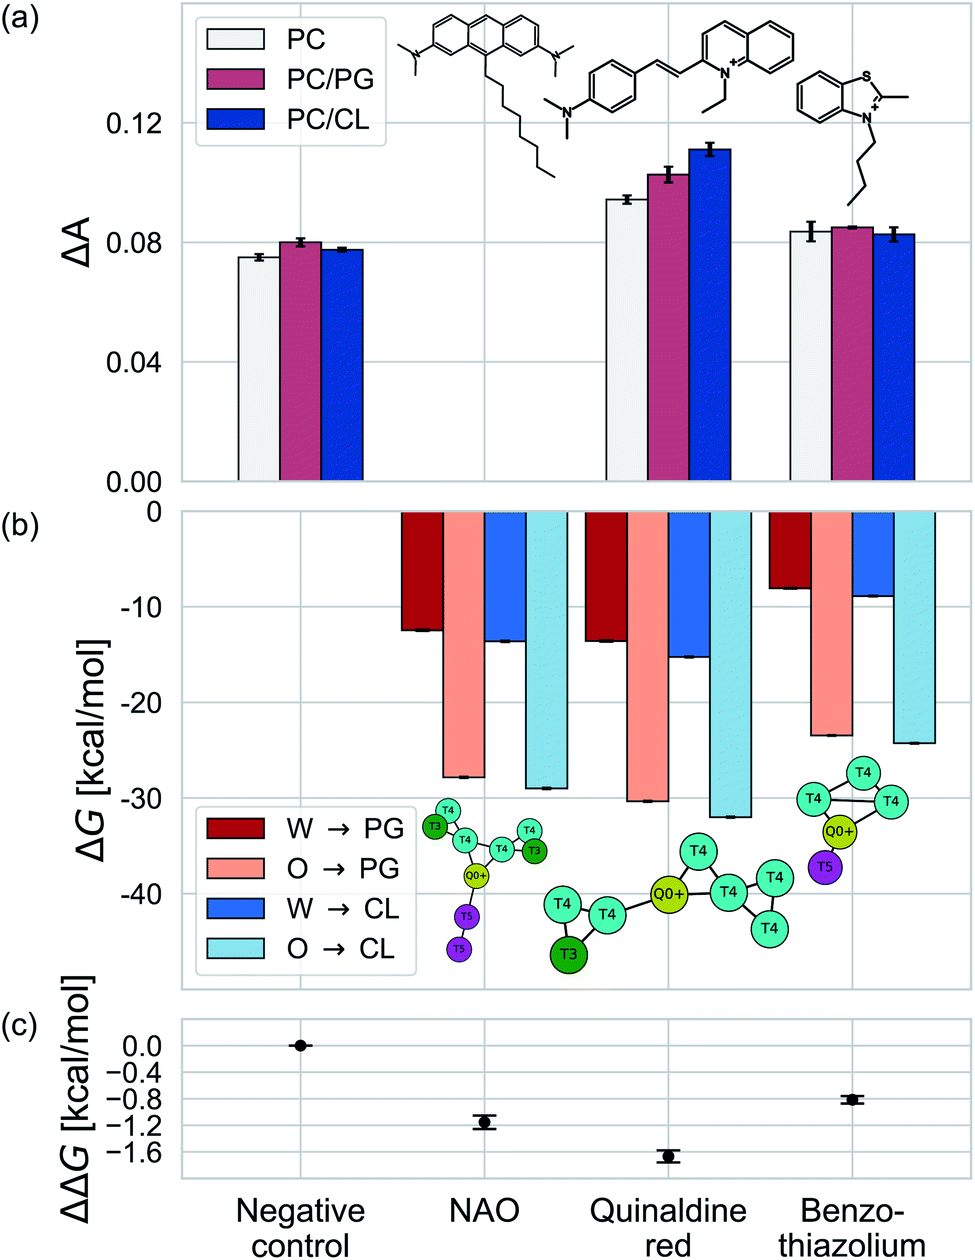 | ||
Fig. 9 Comparison of experimental measurements and computational predictions of the selectivity of two candidate molecules quinaldine red and benzothiazolium selected according to our learned design rules within three model membranes consisting of 100% PC, 90% PC/10% PG, and 90% PC/10% CL. (a) Experimental measurements of the differential fluorescence anisotropy ΔA. The negative control confirms negligible differences between the different membranes in the measured value of ΔA. Measurements of ΔA for NOA were not reported due to technical issues. (b) Computational predictions of the transfer free energies ΔGW→I from water to the membrane interface and from octane (representative of the membrane midplane) to the interface ΔGO→I calculated using the 5 + 1 CG model and alchemical transformations. Calculated uncertainties of the computational results are smaller than the symbol size. (c) Computational predictions of the relative partitioning free energy  | ||
We present the results of these measurements in Fig. 9a. A negative control experiment confirms no change in ΔA in the absence of any molecular candidate. The addition of benzothiazolium led to slight increases in ΔA (i.e., decrease in membrane fluidity) for all three model membranes, but this increase was similar in all cases indicating no preferential interaction that would result in a differential response. Quinaldine red led to more significant increases in ΔA for all three membranes and a rank ordering in the magnitude of the response of PC/CL > PC/PG > PC, indicating a preferential partitioning into the CL-containing model membrane. These results indicate that our design rules successfully identified quinaldine red as a CL-selective molecule, whereas benzothiazolium was a false positive. Our learned design rules are a heuristic tool by which to identify candidate molecules, so we next sought to subject these two molecules to CG free energy calculations to determine if the ΔG and ΔΔG values recapitulated the experimental trends.
We constructed CG representations of quinaldine red and benzothiazolium under the 5 + 1 model and subjected these to alchemical free energy calculations. Our experimental measurements of ΔA for NAO were clouded by interferences between the fluorescence properties of the compound and the dye used for the anisotropy measurements (DPH). We therefore do not report the results in this work. We nevertheless also performed these calculations for NAO as a baseline comparison. As illustrated in Fig. 9b, all three compounds showed favorable partitioning from bulk water and octane into the interface regions of both the PG and the CL membranes (i.e., ΔGW→I, ΔGO→I < 0). These results are consistent with the experimental observations of elevated ΔA for all three model membranes that is indicative of spontaneous thermodynamic partitioning of the molecules into the membranes. As demonstrated in Fig. 9c, the calculated relative partitioning free energies ΔΔG follow the same trends as the experimental ΔA trends. In the case of benzothiazolium, the ΔΔG = −0.82 kcal mol−1 is close to thermal energy kBT ≈ 0.6 kcal mol−1 at room temperature, showing moderate CL selectivity. This is in reasonable agreement with the lack of difference in anisotropy change observed in the experiments. In contrast, the ΔΔG = −1.67 kcal mol−1 of quinaldine red is more than twice as large as that for benzothiazolium and nearly three times larger than the thermal energy scale. This is consistent with the differential response in the experimental ΔA measurements showing significantly elevated selectivity of quinaldine red for the CL membrane environment. Finally, we observe that the ΔΔG = −1.15 kcal mol−1 calculated for NAO is superior to that for benzothiazolium but inferior to that for quinaldine red, suggesting that the latter may offer superior CL selectivity.
5 Conclusions
The phospholipid cardiolipin (CL) is found exclusively within energy transducing membranes and constitutes approximately 20% of the composition of the inner mitochondrial membrane in eukaryotes.1,5 It plays a key metabolic role while having demonstrated capability to also behave as a biomarker for detecting a number of diverse pathologies. A standing challenge in developing reliable CL-based diagnostics lies in the lack of molecules that display selectivity in binding to CL compared to other phospholipid membranes. With the number of drug–like molecules being on the order of ∼1060, a major challenge is the efficient exploration and filtration of this enormous molecular design space. Using transferable CG models to systematically reduce the size of chemical compound space we mapped this all-atom space into a more manageable 124327-member CG design space. Nevertheless, a naïve Edisonian trial-and-error or random sampling within this design space remains prohibitively expensive. This motivated us to employ techniques in Bayesian optimization and deep representational learning to perform a directed data-driven search over the CG space of small organic molecules in an effort to minimize the data complexity, develop surrogate models to exploit the subtle structural differences in the CL and PG lipids to wield control over CL selectivity and efficiently discover the best performing candidates within an iterative active learning loop. After seven rounds of active learning and simulation of only 0.42% of the molecular design space, we identified candidate molecules with 184% better selectivity than the fluorescent dye NAO that is commonly used as a selective CL stain.
Analyzing our accumulated CG simulation data with interpretable linear models enabled automatic discovery of chemical motifs predictive of good CL selectivity. We were able to derive design rules correlating the presence/omission of functional groups to CL selectivity by probabilistically mapping each CG bead to possible all-atom functional groups and relating these to the automatically identified CG motifs. CL selectivity is linked to positively charged groups, hydrophobicity, and the ability to form hydrogen bonds. In contrast, negatively charged groups and overall polarity led to the molecule partitioning into the bulk water, and dominant apolarity led to a tendency of the candidate molecules to insert into the membrane midplane regions.
We tested our computational models against experimental measurements of CL selectivity for two candidate molecules selected using our learned design rules. The trends in our calculated transfer free energies and relative partitioning free energy differences are in good accord with experimental measurements providing support and validation of our computational approach.
In future work, we plan to conduct experimental testing of other candidate molecules identified by our learned design rules and CG screen and conduct all-atom free energy calculations with a second higher-resolution virtual screen. This work adopted thermodynamic selectivity as the sole optimization objective for virtual screening without regard to the optical activity of the candidate molecules. Since the ultimate goal is to discover high-selectivity CL dyes, in subsequent work we plan to employ computational filtrations and/or multi-objective optimization strategies to discover molecules that are both highly selective for CL and possess either inherent fluorescent activity or can support the addition of fluorescent tags without compromising their thermodynamic behavior. Finally, we note that the coarse-grained chemical space embeddings and active learning search are generically transferable to other molecular design applications by replacing the thermodynamic selectivity prediction for a computational or experimental assay of the property of interest.
Data availability
We present a full accounting of intermediate alchemical transfer free energies used to calculate ΔΔG CL selectivity; predicted ΔΔG from the terminal GPR model; neural network weights and training codes; GPR training codes; embeddings of the RAE; LASSO regression pipeline; demonstration of the active learning workflow; Python pipeline for generating Gromacs input files; Gromacs run parameter files; Python implementation of the Ertl algorithm with our extension; and previously unpublished datasets of small molecules containing five- or six-membered rings with CG representations.81Author contributions
Design of the methodologies: B. M. and T. B. for the computer simulations, I. S. K. and D. S. for the experiments, and K. S. and A. L. F. for the machine learning. B. M., I. S. K., and K. S. performed the experiments and analyzed the results. T. B., D. S., and A. L. F. supervised the project. All authors wrote the article.Conflicts of interest
A. L. F. is a co-founder and consultant of Evozyne, Inc. and a co-author of US Provisional Patents 62/853919 and 62/900420 and International Patent Applications PCT/US2020/035206 and PCT/US20/50466.Acknowledgements
We sincerely thank Kiran Kanekal for providing the datasets of small molecules containing five- or six-membered rings with CG representations, as well as Jocelyne Vreede and Martin Girard for a critical reading of the manuscript. B. M. and T. B. acknowledge support from the Sectorplan Bèta & Techniek of the Dutch Government. K. S. was supported by the National Science Foundation's Graduate Research Fellowship (Grant No. DGE-1746045). D. S. acknowledges support from DynaMem (State of Rhineland-Palatinate, Germany). This work was completed in part with resources provided by the Dutch national e-infrastructure with the support of SURF Cooperative and the University of Chicago Research Computing Center. We gratefully acknowledge computing time on the University of Chicago high-performance GPU-based cyberinfrastructure supported by the National Science Foundation under Grant No. DMR-1828629. Part of this research was performed while K. S., A. L. F., and T. B. were visiting the Institute for Pure and Applied Mathematics (IPAM), which is supported by the National Science Foundation (Grant No. DMS-1440415).References
- J. Dudek, Front. Cell Dev. Biol., 2017, 5, 90 CrossRef PubMed.
- G. Paradies, V. Paradies, V. De Benedictis, F. M. Ruggiero and G. Petrosillo, Biochim. Biophys. Acta, Bioenerg., 2014, 1837, 408–417 CrossRef CAS PubMed.
- F. Elías-Wolff, M. Lindén, A. P. Lyubartsev and E. G. Brandt, Soft Matter, 2019, 15, 792–802 RSC.
- E. R. Pennington, K. Funai, D. A. Brown and S. R. Shaikh, Biochim. Biophys. Acta, Mol. Cell Biol. Lipids, 2019, 1864, 1039–1052 CrossRef CAS PubMed.
- G. Paradies, V. Paradies, F. M. Ruggiero and G. Petrosillo, Cells, 2019, 8, 728 CrossRef CAS PubMed.
- F. Gonzalvez, M. D'Aurelio, M. Boutant, A. Moustapha, J.-P. Puech, T. Landes, L. Arnauné-Pelloquin, G. Vial, N. Taleux and C. Slomianny, et al. , Biochim. Biophys. Acta, Mol. Basis Dis., 2013, 1832, 1194–1206 CrossRef CAS PubMed.
- C. A. Lipinski, Drug Discovery Today: Technol., 2004, 1, 337–341 CrossRef CAS PubMed.
- H.-F. Tian, J.-M. Feng and J.-F. Wen, BMC Evol. Biol., 2012, 12, 1–15 CrossRef PubMed.
- E. M. Mejia, H. Nguyen and G. M. Hatch, Chem. Phys. Lipids, 2014, 179, 11–16 CrossRef CAS PubMed.
- M. G. Acoba, N. Senoo and S. M. Claypool, J. Cell Biol., 2020, 219, e202003131 CrossRef CAS PubMed.
- A. Uphoff, M. Hermansson, P. Haimi and P. Somerharju, Medical Applications of Mass Spectrometry, Elsevier, Amsterdam, 2008, pp. 223–249 Search PubMed.
- M. E. Rodriguez, K. Azizuddin, P. Zhang, S.-m. Chiu, M. Lam, M. E. Kenney, C. Burda and N. L. Oleinick, Mitochondrion, 2008, 8, 237–246 CrossRef CAS PubMed.
- C. W. Leung, Y. Hong, J. Hanske, E. Zhao, S. Chen, E. V. Pletneva and B. Z. Tang, Anal. Chem., 2014, 86, 1263–1268 CrossRef CAS PubMed.
- H. Szeto and A. Birk, Clin. Pharmacol. Ther., 2014, 96, 672–683 CrossRef CAS PubMed.
- A. Birk, W. Chao, C. Bracken, J. Warren and H. Szeto, Br. J. Pharmacol., 2014, 171, 2017–2028 CrossRef CAS PubMed.
- H. H. Szeto and S. Liu, Arch. Biochem. Biophys., 2018, 660, 137–148 CrossRef CAS PubMed.
- F. A. de Wolf, Biosci. Rep., 1991, 11, 275–284 CrossRef CAS PubMed.
- K. Pyrshev, S. O. Yesylevskyy and M. Bogdanov, Biophys. J., 2021, 120(17), 3776–3786 CrossRef CAS PubMed.
- J. Jacobson, M. R. Duchen and S. J. Heales, J. Neurochem., 2002, 82, 224–233 CrossRef CAS PubMed.
- V. M. Gohil, J. Gvozdenovic-Jeremic, M. Schlame and M. L. Greenberg, Anal. Biochem., 2005, 343, 350–352 CrossRef CAS PubMed.
- P. M. Oliver, J. A. Crooks, M. Leidl, E. J. Yoon, A. Saghatelian and D. B. Weibel, J. Bacteriol., 2014, 196, 3386–3398 CrossRef PubMed.
- A.-R. Pogmore, K. H. Seistrup and H. Strahl, Microbiology, 2018, 164, 475–482 CrossRef CAS PubMed.
- S. Lobasso, M. S. Saponetti, F. Polidoro, P. Lopalco, J. Urbanija, V. Kralj-Iglic and A. Corcelli, Chem. Phys. Lipids, 2009, 157, 12–20 CrossRef CAS PubMed.
- ACD/ChemSketch Version 2021.1.0, Advanced Chemistry Development, Inc., Toronto, ON, Canada, www.acdlabs.com, 2021 Search PubMed.
- K. H. Kanekal and T. Bereau, J. Chem. Phys., 2019, 151, 164106 CrossRef PubMed.
- C. M. Dobson, et al. , Nature, 2004, 432, 824–828 CrossRef CAS PubMed.
- S. J. Marrink, H. J. Risselada, S. Yefimov, D. P. Tieleman and A. H. De Vries, J. Phys. Chem. B, 2007, 111, 7812–7824 CrossRef CAS PubMed.
- J. Michalowsky, J. Zeman, C. Holm and J. Smiatek, J. Chem. Phys., 2018, 149, 163319 CrossRef PubMed.
- J. Michalowsky, L. V. Schäfer, C. Holm and J. Smiatek, J. Chem. Phys., 2017, 146, 054501 CrossRef PubMed.
- W. D. Bennett and D. P. Tieleman, J. Chem. Theory Comput., 2011, 7, 2981–2988 CrossRef CAS PubMed.
- H.-J. Woo and A. Wallqvist, J. Phys. Chem. B, 2011, 115, 8122–8129 CrossRef CAS PubMed.
- A. Centi, A. Dutta, S. H. Parekh and T. Bereau, Biophys. J., 2020, 118, 1321–1332 CrossRef CAS PubMed.
- J. Eid, H. Razmazma, A. Jraij, A. Ebrahimi and L. Monticelli, J. Phys. Chem. B, 2020, 124, 6299–6311 CrossRef CAS PubMed.
- R. Menichetti, K. Kremer and T. Bereau, Biochem. Biophys. Res. Commun., 2018, 498, 282–287 CrossRef CAS PubMed.
- R. Menichetti, K. H. Kanekal and T. Bereau, ACS Cent. Sci., 2019, 5, 290–298 CrossRef CAS PubMed.
- R. Menichetti, K. H. Kanekal, K. Kremer and T. Bereau, J. Chem. Phys., 2017, 147, 125101 CrossRef PubMed.
- H. N. Pishkenari, M. R. Barzegar and A. Taghibakhshi, Iran. J. Sci. Technol., Trans. Mech. Eng., 2019, 1–22 Search PubMed.
- I. S. Kleinwächter, S. Pannwitt, A. Centi, N. Hellmann, E. Thines, T. Bereau and D. Schneider, Membranes, 2021, 11, 254 CrossRef PubMed.
- L. Monticelli, S. K. Kandasamy, X. Periole, R. G. Larson, D. P. Tieleman and S.-J. Marrink, J. Chem. Theory Comput., 2008, 4, 819–834 CrossRef CAS PubMed.
- D. H. de Jong, G. Singh, W. D. Bennett, C. Arnarez, T. A. Wassenaar, L. V. Schafer, X. Periole, D. P. Tieleman and S. J. Marrink, J. Chem. Theory Comput., 2013, 9, 687–697 CrossRef CAS PubMed.
- J. F. Franco-Gonzalez, J. Ramos, V. L. Cruz and J. Martinez-Salazar, J. Comput.-Aided Mol. Des., 2014, 28, 1093–1107 CrossRef CAS PubMed.
- L. Thøgersen, B. Schiøtt, T. Vosegaard, N. C. Nielsen and E. Tajkhorshid, Biophys. J., 2008, 95, 4337–4347 CrossRef PubMed.
- A. L. Duncan, A. J. Robinson and J. E. Walker, Proc. Natl. Acad. Sci. U. S. A., 2016, 113, 8687–8692 CrossRef CAS PubMed.
- Y. Qi, H. I. Ingólfsson, X. Cheng, J. Lee, S. J. Marrink and W. Im, J. Chem. Theory Comput., 2015, 11, 4486–4494 CrossRef CAS PubMed.
- G. Olofsson and E. Sparr, PLoS One, 2013, 8, e73040 CrossRef CAS PubMed.
- M. Sathappa and N. N. Alder, Biochim. Biophys. Acta, Biomembr., 2016, 1858, 1362–1372 CrossRef CAS PubMed.
- L. Serpas, B. Milorey, L. A. Pandiscia, A. W. Addison and R. Schweitzer-Stenner, J. Phys. Chem. B, 2016, 120, 12219–12231 CrossRef CAS PubMed.
- M. J. Abraham, T. Murtola, R. Schulz, S. Páll, J. C. Smith, B. Hess and E. Lindahl, SoftwareX, 2015, 1, 19–25 CrossRef.
- D. H. De Jong, S. Baoukina, H. I. Ingólfsson and S. J. Marrink, Comput. Phys. Commun., 2016, 199, 1–7 CrossRef CAS.
- C. Chipot and A. Pohorille, Free Energy Calculations, Springer, 2007 Search PubMed.
- M. R. Shirts and J. D. Chodera, J. Chem. Phys., 2008, 129, 124105 CrossRef PubMed.
- K. A. Beauchamp and J. D. Chodera, L. N. Naden and M. R. Shirts, Python implementation of the multistate Bennett acceptance ratio (MBAR), https://github.com/choderalab/pymbar, published under the MIT license Search PubMed.
- M. K. Warmuth, J. Liao, G. Rätsch, M. Mathieson, S. Putta and C. Lemmen, J. Chem. Inf. Comput. Sci., 2003, 43, 667–673 CrossRef CAS PubMed.
- D. A. Pertusi, M. E. Moura, J. G. Jeffryes, S. Prabhu, B. W. Biggs and K. E. Tyo, Metab. Eng., 2017, 44, 171–181 CrossRef CAS PubMed.
- R. Varela, W. P. Walters, B. B. Goldman and A. N. Jain, J. Med. Chem., 2012, 55, 8926–8942 CrossRef CAS PubMed.
- V. Khanna and S. Ranganathan, BMC Bioinf., 2011, 1–12 Search PubMed.
- D. Reker, P. Schneider and G. Schneider, Chem. Sci., 2016, 7, 3919–3927 RSC.
- A. W. Naik, J. D. Kangas, C. J. Langmead and R. F. Murphy, PLoS One, 2013, 8, e83996 CrossRef PubMed.
- C. Kim, A. Chandrasekaran, A. Jha and R. Ramprasad, MRS Commun., 2019, 9, 860–866 CrossRef CAS.
- K. Shmilovich, R. A. Mansbach, H. Sidky, O. E. Dunne, S. S. Panda, J. D. Tovar and A. L. Ferguson, J. Phys. Chem. B, 2020, 124, 3873–3891 CrossRef CAS PubMed.
- R. Gómez-Bombarelli, J. N. Wei, D. Duvenaud, J. M. Hernández-Lobato, B. Sánchez-Lengeling, D. Sheberla, J. Aguilera-Iparraguirre, T. D. Hirzel, R. P. Adams and A. Aspuru-Guzik, ACS Cent. Sci., 2018, 4, 268–276 CrossRef PubMed.
- P. Ghosh, M. S. Sajjadi, A. Vergari, M. Black and B. Schölkopf, arXiv preprint arXiv:1903.12436, 2019.
- D. P. Kingma and M. Welling, arXiv preprint arXiv:1312.6114, 2013.
- J. Gilmer, S. S. Schoenholz, P. F. Riley, O. Vinyals and G. E. Dahl, International conference on machine learning, 2017, pp. 1263–1272 Search PubMed.
- P. W. Battaglia, J. B. Hamrick, V. Bapst, A. Sanchez-Gonzalez, V. Zambaldi, M. Malinowski, A. Tacchetti, D. Raposo, A. Santoro and R. Faulkner, et al., arXiv preprint arXiv:1806.01261, 2018.
- J. Chung, C. Gulcehre, K. Cho and Y. Bengio, arXiv preprint arXiv:1412.3555, 2014.
- Y. Li, D. Tarlow, M. Brockschmidt and R. Zemel, arXiv preprint arXiv:1511.05493, 2015.
- O. Vinyals, S. Bengio and M. Kudlur, arXiv preprint arXiv:1511.06391, 2015.
- A. Paszke, S. Gross, F. Massa, A. Lerer, J. Bradbury, G. Chanan, T. Killeen, Z. Lin, N. Gimelshein, L. Antiga, A. Desmaison, A. Kopf, E. Yang, Z. DeVito, M. Raison, A. Tejani, S. Chilamkurthy, B. Steiner, L. Fang, J. Bai and S. Chintala, Advances in Neural Information Processing Systems, Curran Associates, Inc., 2019, 32, pp. 8024–8035 Search PubMed.
- D. Arthur and S. Vassilvitskii, k-means++: The advantages of careful seeding, Stanford Technical Report, 2006 Search PubMed.
- C. E. Rasmussen and C. K. I. Williams, Gaussian processes for machine learning (adaptive computation and machine learning), The MIT Press, 2005 Search PubMed.
- E. Brochu, V. M. Cora and N. De Freitas, arXiv preprint arXiv:1012.2599, 2010.
- D. J. Lizotte and D. James, Practical Bayesian optimization, Library and Archives Canada = Bibliothèque et Archives Canada, 2009 Search PubMed.
- D. Ginsbourger, R. Le Riche and L. Carraro, HAL preprint hal-00260579, 2008 Search PubMed.
- T. Milenković and N. Pržulj, Cancer Inf., 2008, 6, CIN-S680 CrossRef.
- T. Fink and J.-L. Reymond, J. Chem. Inf. Model., 2007, 47, 342–353 CrossRef CAS PubMed.
- ChemAxon, Calculator Plugin of Marvin 17.28.0, 2017, https://www.chemaxon.com Search PubMed.
- P. Ertl, J. Cheminf., 2017, 9, 1–7 Search PubMed.
- RDKit: Open-Source Cheminformatics, http://www.rdkit.org, online, accessed, 03-May-2021 Search PubMed.
- P. Ertl, E. Altmann and J. M. McKenna, J. Med. Chem., 2020, 63, 8408–8418 CrossRef CAS PubMed.
- B. Mohr, K. Shmilovich, I. Kleinwächter, D. Schneider, A. L. Ferguson and T. Bereau, Supporting data for: “Data-driven discovery of cardiolipin-selective small molecules by computational active learning”, 2021, DOI:10.5281/zenodo.5507577.
- D. Malyshka, L. A. Pandiscia and R. Schweitzer-Stenner, Vib. Spectrosc., 2014, 75, 86–92 CrossRef CAS.
- P. X. Petit, P. Dupaigne, F. Pariselli, F. Gonzalvez, F. Etienne, C. Rameau and S. Bernard, FEBS J., 2009, 276, 6338–6354 CrossRef CAS PubMed.
- J. Zielonka, J. Joseph, A. Sikora, M. Hardy, O. Ouari, J. Vasquez-Vivar, G. Cheng, M. Lopez and B. Kalyanaraman, Chem. Rev., 2017, 117, 10043–10120 CrossRef CAS PubMed.
- M. Aldeghi, V. Gapsys and B. L. de Groot, ACS Cent. Sci., 2018, 4, 1708–1718 CrossRef CAS PubMed.
Footnotes |
| † Electronic supplementary information (ESI) available. See DOI: 10.1039/d2sc00116k |
| ‡ Contributed equally to this work. |
| This journal is © The Royal Society of Chemistry 2022 |