 Open Access Article
Remarkable stability of a molecular ruthenium complex in PEM water electrolysis†
Marco
Bellini‡
 a,
Jonas
Bösken‡
 b,
Michael
Wörle
 b,
Debora
Thöny
 b,
Juan José
Gamboa-Carballo
 bd,
Frank
Krumeich
 b,
Francesco
Bàrtoli
ac,
Hamish A.
Miller
a,
Lorenzo
Poggini
 a,
Werner
Oberhauser
a,
Alessandro
Lavacchi
a,
Hansjörg
Grützmacher
a,
Werner
Oberhauser
a,
Alessandro
Lavacchi
a,
Hansjörg
Grützmacher
 *b and
Francesco
Vizza
 *a
*a
aInstitute of Chemistry of Organometallic Compounds – National Research Council (ICCOM-CNR), Via Madonna del Piano 10, 50019 Sesto Fiorentino, Florence, Italy. E-mail: francesco.vizza@iccom.cnr.it
bDepartment of Chemistry and Applied Biosciences, ETH Hönggerberg, CH-8093 Zürich, Switzerland. E-mail: hgruetzmacher@ethz.ch
cDepartment of Biotechnology, Chemistry and Pharmacy, University of Siena, Via Aldo Moro 2, Siena, 53100, Italy
dHigher Institute of Technologies and Applied Sciences (InSTEC), University of Havana, 10600 Havana, Cuba
First published on 3rd March 2022
Abstract
The dinuclear Ru diazadiene olefin complex, [Ru2(OTf)(μ-H)(Me2dad)(dbcot)2], is an active catalyst for hydrogen evolution in a Polymer Exchange Membrane (PEM) water electrolyser. When supported on high surface area carbon black and at 80 °C, [Ru2(OTf)(μ-H)(Me2dad)(dbcot)2]@C evolves hydrogen at the cathode of a PEM electrolysis cell (400 mA cm−2, 1.9 V). A remarkable turn over frequency (TOF) of 7800 molH2 molcatalyst−1 h−1 is maintained over 7 days of operation. A series of model reactions in homogeneous media and in electrochemical half cells, combined with DFT calculations, are used to rationalize the hydrogen evolution mechanism promoted by [Ru2(OTf)(μ-H)(Me2dad)(dbcot)2].
Introduction
Water electrolysis is the best choice for future industrial hydrogen production and will be key for a sustainable energy economy based upon renewable resources.1,2 Proton Exchange Membrane Electrolysis Cells (PEM-EC) are currently the best performing devices at low temperature (<100 °C).3,4 PEM electrolysers offer several advantages over alkaline electrolysers, such as their high faradaic efficiency, their compactness, fast response times and their capability to operate at current densities above 2 A cm−2.5,6 A key role in PEM electrolysis is played by the solid polymeric membrane which enables the use of water without added electrolyte, guarantees fast kinetics due to low resistance and separates the gases produced at the anode and cathode enabling pressurization of the H2 produced up to 80 bar differential pressure.7 One of the biggest disadvantages of PEM-ECs is that they currently employ platinum group metals (PGMs) as electrode material, which contribute significantly to the cost of the whole device.4 PEM electrolyzers are fed with pure (unbuffered neutral) water, with the interfacial environment of the proton exchange membrane highly acidic.5 State of the art PEM electrolysers are operated with highly efficient nanoparticles of platinum and iridium oxide as catalysts for the hydrogen and the oxygen evolution reactions, respectively (HER, OER).3,8In recent years, research has focussed on the development of new heterogenous electrode materials that does not rely on PGMs9–12 or reducing the metal load by the use of single atoms or organometallic metal complexes on a conducting support material.5,13 Molecular catalysts offer many advantages over heterogeneous materials. Not only do they usually demonstrate higher turnover numbers and molecular activity than heterogeneous electrode materials,11 but also their properties can be fine-tuned by well-established methods of organometallic synthesis.13 Furthermore, molecular catalysts allow easier elucidation of their mechanisms which drives further improvement.
Nature provides molecular hydrogen evolution catalysts, namely hydrogenase and nitrogenase enzymes, that are able to evolve hydrogen with very high efficiencies (102–106 molH2 molcatalyst−1 s−1).14,15 These enzymes contain earth-abundant metal centers like iron and nickel in their active sites. Despite their high activity, these catalysts are impractical for use in PEM-ECs, due to their limited stability in the presence of oxygen, their limited operative range with respect to a very narrow pH and temperature window (pH 7 and 37 °C are the optimal conditions), a bad electrode–catalyst contact that oftentimes calls for a redox mediator, as well as difficulties in obtaining sufficient amounts of hydrogen for large scale applications.16–20
The development of artificial Fe and Ni metal complexes mimicking the active site of hydrogenase is a vibrant and growing research field.15,21–23 DuBois and co-workers reported square planar Ni(II) complexes with derivatives of 3,7-diphenyl-1,5-diaza-3,7-diphosphacyclooctanes24 or 1,3,6-triphenyl-1-aza-3,6-diphosphacycloheptanes25 as P2N2 ligands. While the family of Ni–P2N2 complexes shows a remarkable activity as homogeneous catalyst in acidic organic solvents,26 recent attempts to use them as immobilized catalysts for HER in aqueous environments have fallen short of expectations with turnover numbers (TONs) not exceeding 2500.27
Long and co-workers used a polypyridyl molybdenum(VI)-oxo complex, [MoO(PY5Me2)]2+ (PY5Me2 = 2,6-bis(1,1-bis(2-pyridyl)ethyl)pyridine), which is soluble in neutral water and able to evolve hydrogen with a remarkable activity of 8500 molH2 molcatalyst−1 h−1 at pH 7.28 A number of other hydrogenase mimicking catalysts have been developed that can reduce water to give molecular hydrogen.29,30 They contain polypyridyl,14,30 bipyridine31,32 or porphyrinoid-type29 ligands and can be considered as artificial metalloproteins.33,34 Some dinuclear ruthenium complexes have been used as [Fe–Fe] hydrogenase mimics,35,36 but only one complex has been used as an electrocatalyst for the splitting of H2 into protons and electrons.37 Even though many (electro)catalysts for hydrogen production are known in the literature, very few of them have actually been employed as immobilized catalysts in a full PEM electrolyser setup.13
Dedov and co-workers reported functionalized iron, ruthenium, and cobalt clathrochelate cage complexes physisorbed on carbon paper.38,39 The complexes were used as electro(pre)catalysts for hydrogen production in a PEM membrane electrode assembly (MEA) for water electrolysis with an IrO2 anode. At cell voltages of 2.2 V, impressive current densities of well over 1200 mA cm−2 were reached at catalyst loadings of ca. 0.16 μmol cm−2.39 While the activity is remarkable, the complex shows signs of decomposition after 24 hours at 2.2 V, which manifests in a drop of current density by 50–70 mA cm−2.
In this report we show the remarkable stability and activity of an organometallic dinuclear Ru–Ru compound adsorbed onto conductive carbon. This material was used to assemble a polymer exchange membrane electrolysis cell fed with pure water. This device is able to evolve H2 (28 LH2 gRu−1 min−1) with a turnover frequency (TOF) of 7800 molH2 molcatalyst−1 h−1 and remains stable without loss of activity for at least 7 days.
Results and discussion
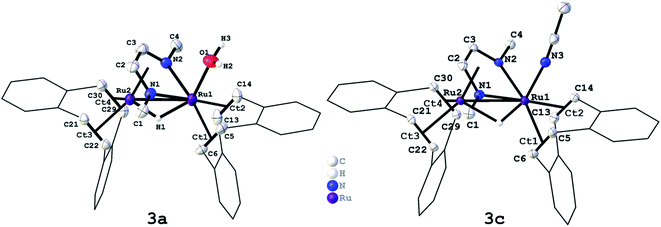
We have recently reported that the dinuclear Ru diazadiene olefin complex [Ru2H(μ-H)(Me2dad)(dbcot)2] 1 with a bridging and terminal hydride ligand (Me2dad = N,N′-dimethyldiazabutadiene, dbcot = dibenzo[a,e]cyclooctene) converts H2 to protons and electrons and reversibly hydrogenates quinones like vitamin K2 and K3.37 Both reactions are reminiscent of hydrogenases and hence it seemed feasible to use complexes like 1 as catalysts for the electrolysis of water.In order to obtain air and water stable complexes for convenient handling, 1 was oxidized with triflic acid, HOTf, in difluorobenzene (DBF) to obtain [Ru2(OTF)(μ-H)(Me2dad)(dbcot)2] 2 (Scheme 1).37 The reaction between 1 and aqueous sulfuric acid (50%) or tetrafluoroboric acid (50%) in THF gives after 10 minutes at 65 °C the aquo complexes [Ru2(OH2)(μ-H)(Me2dad)(dbcot)2]+(Xn−) (Xn− = ½ SO42−, HSO4−, BF4−) 3a. The oxidation with ferrocenium hexafluorophosphate, FcPF6, or ferrocenium tetrafluoroborate, FcBF4, in THF gives a cationic solvato complex [Ru2(S)(μ-H)(Me2dad)(dbcot)2]+(X−) 3b (S = THF; X− = PF6−, BF4−). All reactions proceed under the elimination of H2. The new compounds 3a and 3b are obtained as bright red crystals. Single crystals of 3a with Xn− = HSO4−, SO42− and those with X = BF4− were subjected to an X-ray diffraction analysis. Only the latter gave a data set of sufficient quality to determine the structure with high resolution and a plot is shown in Fig. 1, left (crystal data are reported in Table S1†). In acetonitrile (ACN), the terminal coordination side at Ru1 is filled with a solvent molecule. The compound 3c was obtained as orange-red crystals and a plot of its molecular structure is shown in Fig. 1, right (crystallographic details are reported in Table S2†).
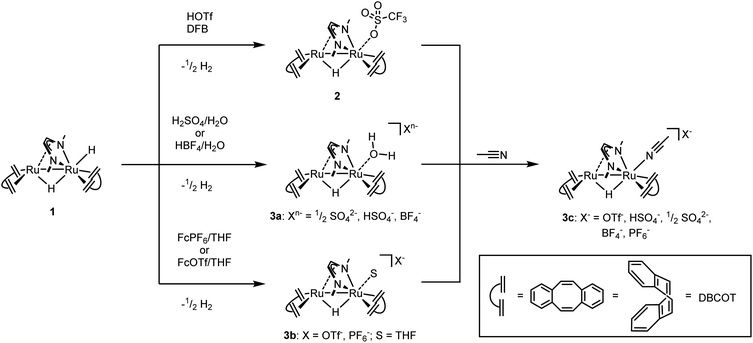 | ||
| Scheme 1 Syntheses of complexes 2, 3a, 3b, and 3c starting from 1. OTf− = SO3CF3−, Fc+ = ferrocenium+, DFB = 1,2-difluorobenzene. | ||
Like [Fe,Fe] and [Fe,Ni] hydrogenases, these type of dinuclear Ru complexes with redox non-innocent diazadiene ligands show a remarkable structural invariance within the {Ru2(dad)} core. The Ru1–Ru2 bonds in previously reported neutral complex [Ru2H(μ-H)(Me2dad)(dbcot)2] 1 with a terminal hydride bound to Ru1 (2.730 Å),37 triflate complex 2 (2.6730 Å),37 aquo complex 3a (2.6892 Å), and solvato complex 3c (2.6932 Å), do not differ significantly and are at the shorter edge within the range of more than 4000 Ru–Ru bond lengths reported in the CCDC database (2.6–3.2 Å).40 The C–N bonds (1: 1.375 Å; 2: 1.370 Å; 3a: 1.376 Å, 3c: 1.368 Å) and C–C bonds (1: 1.398 Å; 2: 1.402 Å; 3a:1.406 Å, 3c: 1.397 Å) of the N1–C2–C3–N2 unit indicate a reduced form of the diazadiene (dad) ligand, which in its fully oxidized form can be described as neutral diimine (N![[double bond, length as m-dash]](https://www.rsc.org/images/entities/char_e001.gif) C–C
C–C![[double bond, length as m-dash]](https://www.rsc.org/images/entities/char_e001.gif) N: C
N: C![[double bond, length as m-dash]](https://www.rsc.org/images/entities/char_e001.gif) N ≈ 1.29 Å; C–C ≈ 1.46 Å) and in its fully reduced form as bis(amido)ethylene (–N–C
N ≈ 1.29 Å; C–C ≈ 1.46 Å) and in its fully reduced form as bis(amido)ethylene (–N–C![[double bond, length as m-dash]](https://www.rsc.org/images/entities/char_e001.gif) C–N–: C
C–N–: C![[double bond, length as m-dash]](https://www.rsc.org/images/entities/char_e001.gif) N ≈ 1.38 Å; C–C ≈ 1.35 Å). The positions of the μ2-hydride ligands were located in the difference map and were freely refined in both structures. The resulting Ru–H bond lengths in the structures of 3a (Ru1–H: 1.859 Å, Ru2–H: 1.422 Å) and 3c (Ru1–H: 1.586 Å, Ru2–H: 1.774 Å) are within the usual range of distances found in more than 2800 Ru–H compounds with a Ru–(μ2H)–Ru fragment. The mean value of 1.78 Å is in good agreement with the DFT-calculated bond length in 3a (Ru1–H: 1.738 Å, Ru2–H: 1.754 Å). Note that hydrogen centers in the vicinity of a metal atom are not accurately determined with data from X-ray diffraction experiments which also explains the rather large range of Ru–H distances reported in the CCDC database (1.4–2.2 Å).
N ≈ 1.38 Å; C–C ≈ 1.35 Å). The positions of the μ2-hydride ligands were located in the difference map and were freely refined in both structures. The resulting Ru–H bond lengths in the structures of 3a (Ru1–H: 1.859 Å, Ru2–H: 1.422 Å) and 3c (Ru1–H: 1.586 Å, Ru2–H: 1.774 Å) are within the usual range of distances found in more than 2800 Ru–H compounds with a Ru–(μ2H)–Ru fragment. The mean value of 1.78 Å is in good agreement with the DFT-calculated bond length in 3a (Ru1–H: 1.738 Å, Ru2–H: 1.754 Å). Note that hydrogen centers in the vicinity of a metal atom are not accurately determined with data from X-ray diffraction experiments which also explains the rather large range of Ru–H distances reported in the CCDC database (1.4–2.2 Å).
The Ru1–NCCH3 bond length of 2.073 Å in 3c is within the range of >1800 Ru–NCCH3 bond lengths reported in the CCDC database (1.98–2.42 Å) and is comparatively short.40 The Ru1–O bonds in 2 (2.189 Å) and 3a (2.180 Å) are within the range of more than 500 Ru–OH2 bond lengths reported in the CCDC database (2.05 Å - 2.365 Å).40 In comparison to the Ru–NCCH3 bond of 3c, the Ru–O bond of 2 and 3a is more than 0.1 Å longer. This observation is in accord with the lability of the triflate anion or water ligand in 2/3a which can be easily replaced by coordinating solvent molecules like acetonitrile (ACN) to give 3b or 3c. Hence the 1H-NMR spectra of triflate complex 2 (Fig. S1†) and aquo complexes 3a (Fig. S2 and S3†) in CD3CN as solvent are identical to the 1H-NMR spectra of solvato complexes 3c (Fig. S4†), while free water is observed in the spectra of 3a. A characteristic deshielded signal at δ = −7.4 ppm is observed for the bridging H nucleus. In dihydride complex 1, this signal is shifted by about 6.5 ppm to higher frequencies (δ = −0.74 ppm; THF[D]8). Aquo complexes 3a and acetonitrile complex 3c were subjected to thermal gravimetric analyses which showed that all compounds are thermally remarkable stable up to >230 °C, where they start to lose water (3a) or ACN (3c) (see the ESI for details, Fig. S5–S7†).
Complexes [Ru2(OTf)(μ-H)(Me2dad)(dbcot)2] (2) or [Ru2(OH2)(μ-H)(Me2dad)(dbcot)2]+(Xn−) (3a) were adsorbed onto Ketjenblack EC-600 JD (Ck) as conductive carbon support material following a well-established wet impregnation procedure reported in previous papers.41–44 Two different electrocatalyst concentrations were used, one designated as 2@Ck with 3.06 wt% of Ru and one with a sevenfold lower catalyst loading (0.44 wt% Ru) designated as 2dil@Ck. These electrocatalytic materials can be readily applied in a MEA by standard techniques and subsequently assembled in a PEM electrolysis test cell. We assume that the molecular complex adsorption onto Ck is driven through CH–π interactions between the protons at the benzo groups of the dibenzo[a,e]cyclooctene (dbcot ligand) and the 6π-electron system of the C6 rings of the carbon support.45 KetjenBlack has a very high surface area, 1400 m2 g−1, due to a high pore volume and carbon porosity and thus favors high dispersion of the isolated 2@Ck molecules.44
Electron microscopic images of freshly prepared 2dil@Ck are shown in Fig. 2a–c and indicate the homogeneous distribution of the ruthenium complex on the carbon surface. Fig. 2a shows the evidence of sub-nanometer high Z clusters (bright patches). This evidence is consistent with the presence of the Ru dinuclear units of the complex at the carbon surface. Moreover, HRTEM images show the structure of the carboneous support but no evidence of nanoparticles (Fig. 2b and c), indicating that the complex spreads over the carbon surface homogeneously rather than forming aggregates.
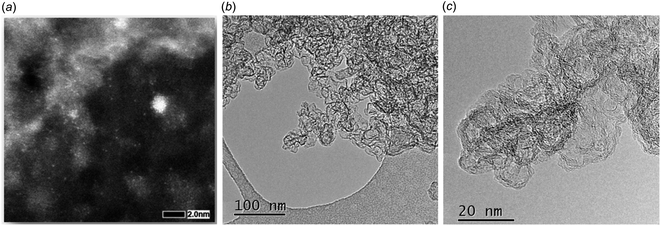 | ||
| Fig. 2 Electron microscopy images of pristine 2dil@Ck. (a) High magnification HAADF-STEM; (b) low magnification HRTEM; (c) high magnification HRTEM. | ||
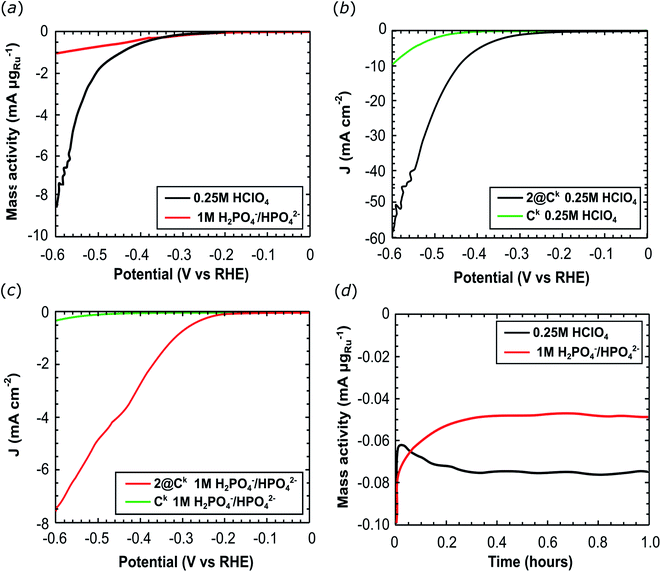
The electrochemical HER activity was firstly investigated in a three-electrode set-up by deposition of 2@Ck onto a glassy carbon disk electrode (6.3–7.5 μgRu cm−2 loading). Linear Sweep Voltammetry (LSV) and chronoamperometric experiments were performed in 0.25 M HClO4 (pH 0.6) and in 1 M H2PO4−/HPO42− buffer solution (pH 7.4). As shown in Fig. 3a, 2@Ck achieves a higher mass activity at pH 0.6: −8.56 mA μgRu−1 were recorded at −600 mV vs. RHE compared to −1.04 mA μgRu−1 recorded at pH 7.4 (at −600 mV vs. RHE). HER Tafel slopes were determined under acidic and neutral conditions, 135 mV dec−1 at pH 0.6 and 132 mV dec−1 at pH 7.4, respectively. Ketjenblack EC 600 JD has a negligible activity for the HER reaction (Fig. 3b and c). Chronoamperometric experiments at a constant applied potential of −300 mV (RHE) demonstrate the stability of 2@Ck for hydrogen evolution over 1 hour of water reduction (Fig. 3d).
A constant current of ca. −75 μA μgRu−1 was recorded at pH 0.6, corresponding to 1.7 μmol of H2 produced with a turnover number (TON) of 135 molH2 molcat−1. While −50 μA μgRu−1 were recorded at pH 7.4, with the production of 1.0 μmol of H2 and a TON = 71 molH2 molcat−1.
Electrochemical impedance spectroscopy (EIS) measurements produced Nyquist plots (Fig. S8†) for 2@Ck and pure Ck at open circuit potential (Fig. S8b and c†) and under hydrogen evolution at −300 mV vs. RHE (Fig. S8a and S†8b). Carbon black component of the catalyst provides the major contribution to the EIS spectra, while the Ru complex contributes poorly due to its high dispersion and the low ruthenium content in the catalytically active material. Diffusion phenomena are predominant under open circuit conditions (see Table S3† for all EIS data).
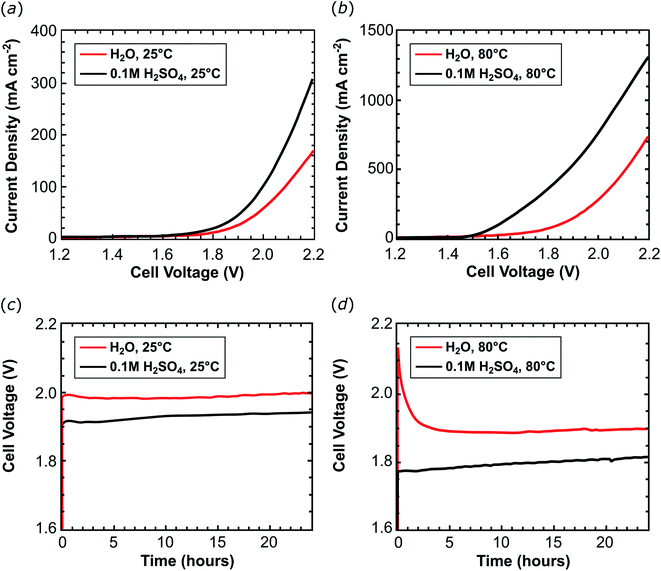
In the second phase of our investigations, an ink composed of 2@Ck and Nafion® ionomer (14 wt%) was applied onto a 5 cm2 carbon cloth electrode support (1 mgRu cm−2; 9.8 μmolRu cm−2) and used as a cathode. Combined with a Nafion® 117 membrane and an IrO2 anode, this assembly was tested in an organometallic PEM water electrolyser (Fig. S9†). The electrolysis cell was fed at the cathode with pure water or a 0.1 M H2SO4 aqueous solution. Cell voltage scans were acquired at 25 °C (Fig. 4a, Table 1, entries 1 and 4) and 80 °C (Fig. 4b and Table 1, entries 2 and 5). The cell performance improves when the pure water feed is switched to 0.1 M H2SO4. This additional proton source in the electrolyte improves proton migration inside the thick electrode layer (ca. 100 μm) of 2@Ck providing evidence that the catalyst layer structure requires further optimization in order to fully exploit all active sites of the deposited catalyst. In 0.1 M H2SO4 solution, a current density of 310.2 mA cm−2 flows in the cell at 25 °C (Table 1, entry 4) which increases to 1330 mA cm−2 at 80 °C (Table 1, entry 5). In the cell fed with water, about half of these current densities were recorded [170.4 mA cm−2 at 25 °C (Table 1, entry 1); 752.4 mA cm−2 at 80 °C (Table 1, entry 2)].
| Entry | Cat | Water feed | Temp (°C) | J @ 2.2 V (mA cm−2) | Time (h) | Current load (mA cm−2) | Flow H2 (L min−1 m−2) | TON | TOF24 h (h−1) |
|---|---|---|---|---|---|---|---|---|---|
| 1 | 2@Ck | H2O | 25 | 170.4 | 24 | 50 | 3.0 | 5.6 × 10³ | 230 |
| 2 | 2@Ck | H2O | 80 | 752.4 | 24 | 400 | 23.0 | 4.1 × 10⁴ | 1700 |
| 3 | 2dil@Ck | H2O | 80 | 345.5 | 168 | 250 | 12.1 | 1.3 × 10⁶ | 7800 |
| 4 | 2@Ck | 0.1 M H2SO4 | 25 | 310.2 | 24 | 50 | 2.9 | 5.5 × 10³ | 229 |
| 5 | 2@Ck | 0.1 M H2SO4 | 80 | 1330.0 | 24 | 400 | 23.6 | 4.2 × 10⁴ | 1800 |
A constant current load was applied to the cell for 24 hours (galvanostatic experiments) and the MEA voltage and the hydrogen produced were measured: 0.25 A (50 mA cm−2) were applied to the PEM-ECs operating at 25 °C (Fig. 4c and Table 1, entries 1 and 4) while 2 A (400 mA cm−2) were applied to the cells operating at 80 °C (Fig. 4d and Table 1, entries 2 and 5). At low temperature, the cell produces 3.0 LH2 min−1 m−2 (87% faradaic efficiency) which results in a TON of 5.6 × 10³ molH2 molcat−1 using 57.9 kW h kgH2−1 of electric energy (see Table 1, entry 1). The performance of the cell was evaluated during the first 24 hours of operation, which gives a TOF24 h of 230 molH2 molcat−1 h−1. Similar results were obtained using an acidic electrolyte: the hydrogen production rate amounts to 2.9 LH2 min−1 m−2 (86% faradaic efficiency), leading to a TON of 5.5 × 10³ molH2 molcat−1 (TOF24 h = 229 molH2 molcat−1 h−1) at an electric energy consumption of 60.1 kW h kgH2−1 (Table 1, entry 4). Increasing the operating temperature to 80 °C improves the hydrogen production rate without affecting the stability of 2@Ck: 23 LH2 min−1 m−2 (83% faradaic efficiency) were evolved from the cell fed with neutral water with a TON = 4.1 × 10⁴ molH2 molcat−1 (TOF24 h = 1700 molH2 molcat−1 h−1). In a cell fed with 0.1 M H2SO4, 24 LH2 min−1 m−2 (85% faradaic efficiency) were produced which results in TON = 4.2 × 10⁴ molH2 molcat−1 (TOF24 h = 1800 molH2 molcat−1 h−1; see Table 1, entries 2 and 5).
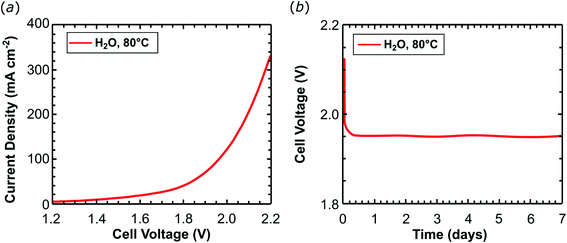
Ruthenium is a rare and expensive element and its application on a large scale for the production of chemical energy carriers is only compatible with a sustainable energy management at very low metal loadings. Therefore the amount of the ruthenium complex on the support material was reduced by 23 times to give 2dil@Ck as cathode material with a metal loading of only 0.043 mgRu cm−2 (0.42 μmolRu cm−2). Experiments were performed at 80 °C feeding the cathode with pure water. A current density of 345.5 mA cm−2 was obtained at 2.2 V (Table 1, entry 3, and Fig. 5a) during scan voltage tests. The current obtained is approximately half of that achieved with the 2@Ck cathode containing 1 mgRu cm−2 under the same conditions (pure water at 80 °C). The cell was operated at 0.2 A cm−2 for 168 hours (one week) and no voltage increase was recorded (Fig. 5b). The cell with 2dil@Ck produces 12.1 LH2 min−1 m−2 of hydrogen (87% faradaic efficiency), with a TON = 1.3 × 10⁶ molH2 molcatalyst−1 and TOF24 h = 7800 molH2 molcatalyst−1 h−1 as summarized in Table 1, entry 3. This activity is very close to the 8500 molH2 molcatalyst−1 h−1 achieved by Long.27 The current density of 2dil@C (ca. 350 mA cm−2 at 2.2 V) is ca. 3.7 times lower than the one reported by Dedov and co-workers (1300 mA cm−2) at about the same catalyst load (ca. 0.21 μmol cm−22dil@Cvs. 0.16 μmol cm−2 reported by Dedov39). But Dedov's cathode shows a drop of the current density by 50–70 mA cm−2 during 24 hours of electrolysis at 2.2 V. In contrast, 2dil@C is stable over 7 days of electrolysis at 80 °C using a similar working potential (c.a. 1.95 V at 0.2 A cm−2 of current load).
Carbon supported platinum nanoparticles (Pt/C) represent the state-of-the-art cathodes for hydrogen evolution in PEM electrolysis cells. Pt loadings of ca. 0.5 mgPt cm−2 are generally used in PEM electrolysers that operate at 2 A cm−2.46 This corresponds to ca. 140 LH2 min−1 m−2 and 28 LH2 min−1 gPt−1. The 2dil@Ck cathode shows the same H2 production rate of 28 LH2 min−1 gRu−1 if one takes into account that the lower operating current density is balanced by the lower metal loading.
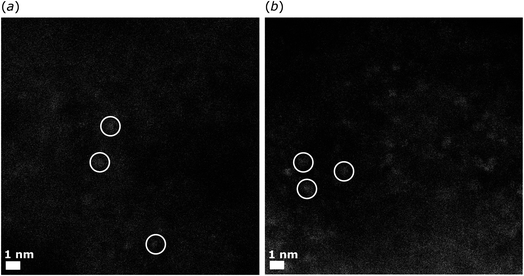
The 2dil@Ck catalyst powder was recovered from the electrode after 168 h of operation and studied by scanning transmission electron microscopy (STEM) imaging. No visible difference was detected between the fresh 2dil@Ck cathode displayed in Fig. 6a and the catalyst after operation, see Fig. 6b. This finding excludes significant decomposition which would lead to larger Ru nanoparticles. Instead, we assume that the dinuclear ruthenium complexes appear as globular bright spots with a size of up to 5 Å. An EDXS analysis of these spots (reported in Fig. S10†) confirms the presence of ruthenium. The Ru–Ru distance in dinuclear Ru complexes 1, 2, and 3a is about 2.7 Å (0.27 nm) and we assume that the few larger spots detected by high-angle annular dark-field scanning transmission electron microscopy (HAADF-STEM) may be due to co-precipitates of two or three complex molecules. But generally, the molecular catalyst is rather well dispersed on the Ck.
Soluble components were extracted from the recovered electrode in deuterated acetonitrile. The NMR spectra clearly showed that dinuclear complex [Ru2(ACN)(μ-H)(Me2dad)(dbcot)2]+(X−) 3c is present (Fig. S11†) providing further evidence for the catalyst stability. Inductively coupled plasma optical emission spectroscopy (ICP-OES) was used to determine possible ruthenium leaching into the aqueous phase during operation. After 24 h operation at 2 A cm−2 at 80 °C only a trace amount of Ru was detected (230 ppt).
XPS analysis was performed on two different samples: (i) the pristine complex 2 and (ii) the complex extracted with acetonitrile from the 2dil@Ck powder recovered from the MEA after 7 days of electrolysis. An extraction process is required because of the limited penetration depth of XPS measurements. This makes it impossible to detect any ruthenium signal arising from the complex in the 2dil@Ck embedded in a large excess of Ketjenblack powder. Insoluble carbon black was removed by filtration and the clear solution containing the ruthenium compound was drop-casted onto a slab of gold on mica (rinsed under nitrogen flux).
Fig. 7a and c depict the XPS spectra in the C 1s Ru3d (area filled in green) region of the pristine complex 2 and the complex obtained after extraction of the used electrode material. Fig. 7b and d show the spectra in the N 1s region. According to references,47–49 the deconvolution of the of the peak reveals a Ru3d5/2 signal, which corresponds to an electron deficient ruthenium species (Run+), that is found at the same binding energy of 281.4 eV for both, the pristine compound and for the recovered one. So there is no change in the oxidation state of the Ru in the complex before and after the electrolysis. In addition, no Ru(0) was observed, whose presence would be an indication of complex decomposition to ruthenium nanoparticles. The N 1s region (Fig. 7b and d) is characterized by a single component at 399.7 eV for the fresh complex and 399.8 for the recovered one. The signal is ascribed to the residual acetonitrile and to the nitrogen centers in the central Me2dad diazadiene ligand of the complex. The semiquantitative analysis of the surface chemical composition and the nitrogen/ruthenium ratio are reported in Table S8† and are in line with the compound structure.
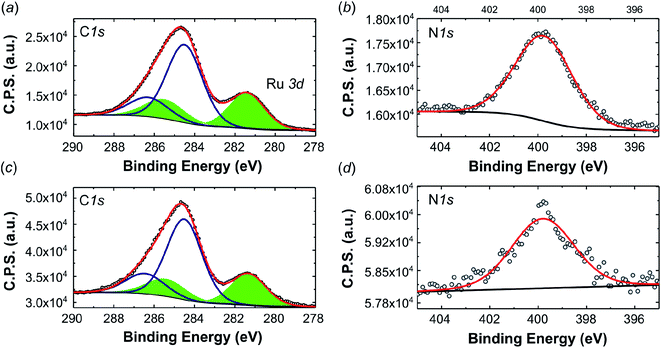 | ||
| Fig. 7 High resolution XPS spectra (a) C 1s, Ru 3d and (b) N 1s of pristine 2 and (c) C 1s Ru 3d and (d) N 1s of the complex recovered after 7 days of electrolysis. | ||
The measured binding energy of 281.4 eV (Ru 3d5/2) is very close to the values reported for a series of Ru2+ and Ru3+ organometallic compounds.50 For comparison, an XPS analysis was also performed for the mononuclear Ru diazadiene complex [K(dme)2][Ru(H)(trop2dad)] (trop2dad = 1,4-bis(5H-dibenzo[a,d]cyclohepten-5-yl)-1,4-diazabuta-1,3-diene) which has a comparable coordination environment and to which a +2 oxidation state was assigned (see Fig. S12† for a comparison of C 1s Ru 3d and the N 1s regions of the XPS spectra between this compound and 2).51 The Ru 3d5/2 peaks of compound 2 (281.4 eV) and [K(dme)2][Ru(H)(trop2dad)] (281.6 eV) have the same shape and very similar binding energies. The difference in shape and binding energy related to the N 1s peaks (2: 399.8 eV; [K(dme)2][Ru(H)(trop2dad)]: 400.2 eV) is not unexpected in view of the different structures of the ligands. Although these data do not allow to assign precisely the oxidation states of both Ru centers in 2, it is assumed that they lie in between (+2) and (+3).
In order to propose a possible mechanism for the catalytic HER, stoichiometric reactions were performed. In addition, DFT calculations were executed in order to support the assumptions drawn from these experiments (Fig. 8 and 9). The air stable complex 3b (as well as 2 and 3c) can be reduced by two electrons with two equivalents of KC8 to give anionic complex K+[Ru2(μ-H)(Me2dad)(dbcot)2]−4 [eqn (1) in Fig. 8a]. This complex is rather unstable and could not be isolated. In solution and at room temperature, it converts to several ruthenium hydride complexes, which were detected in situ by multi-nuclear NMR spectroscopy (Fig. 8c). In the presence of D2O or EtOH[D]6, complex 4 immediately reacts to form deuterated complex [RuD(μ-H) (Me2dad)(dbcot)2] (1[D]) [eqn (2) in Fig. 8a], which supports the assignment of 4 as anionic metal-localized Brønstedt-base. Note, that in the protonation reaction only the terminal position at Ru1 is protonated/deuterated and no H/D scambling of the bridging hydride is observed (Fig. S13†). In homogenous solution in an organic solvent, the neutral dihydride [RuH(μ-H)(Me2dad)(dbcot)2] 1 (which is insoluble in water) does not react with an excess water (five equivalents). No hydrogen is evolved according to, 1 + H2O  [Ru(OH)(μ-H)(Me2dad)(dbcot)2] + H2, even at 80 °C for several days, and there is no evidence for the formation of a hydroxide complex. The latter also cannot be prepared when the aquo complex 3a is treated with KOH. However, when 1 is treated with an acid such as aqueous H2SO4, dihydrogen gas is evolved [detected by gas chromatography (TCD detector) in the headspace] and the hydrido–aquo complex 3a [eqn (3) in Fig. 8a] is obtained in a clean reaction and isolated as red crystals. Reduction of the aquo complex 3a with two equivalents of KC8 expectedly does not give the anionic complex 4 (as was observed with 3b) but gives the dihydride complex 1, which is likely the result of the immediate protonation of 4 by the water released from 3a upon reduction.
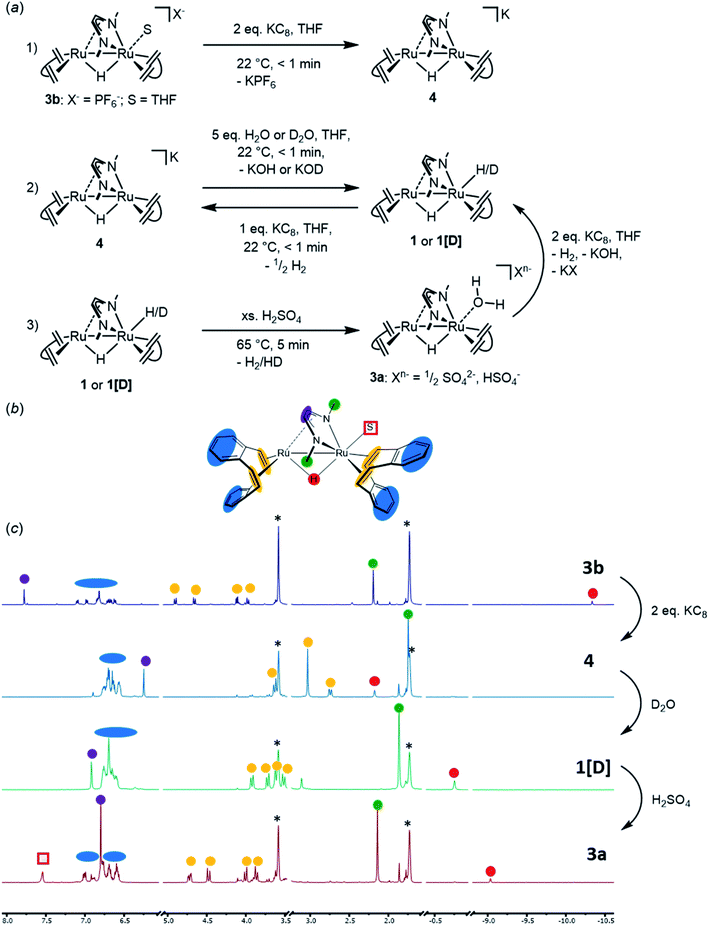 | ||
| Fig. 8 (a) Schematic presentation of stoichiometric reactions (1), (2), (3) with complexes 3b, 4, 1 (or 1[D]), respectively. These were followed by in situ1H-NMR spectroscopy in THF[D8]. (b) Structure of the generic complex [Ru2(S)(μ-H)(Me2(dad)(dbcot)2] (S = solvent molecule) with color coding for easier allocation of the 1H-NMR signals. (c) Stack plot of 1H NMR spectra taken after every indicated reactions (1) (top); (2) (middle); and (3) (bottom). The colored dots indicate the signals of the corresponding color coded protons in the formula given in (b). The red square marks the signal of the coordinated water in complex 3a. Note that D2O was chosen in the 2nd transformation to yield complex 1[D] with a deuterium in terminal position. See Fig. S12† for a comparison of the spectra of 1 and 1[D]. | ||
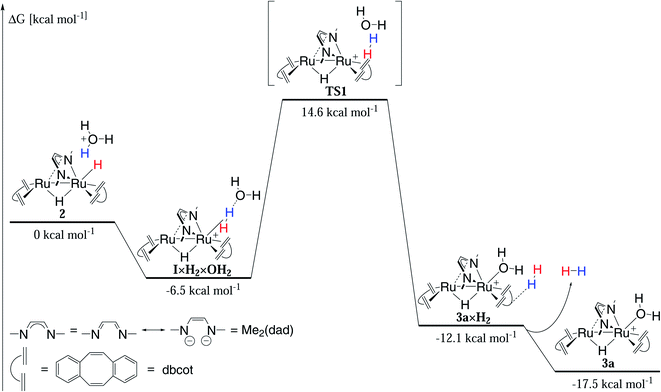 | ||
| Fig. 9 Mechanism of hydrogen evolution in acidic solution calculated by DFT (Orca 4.2.0, PBE0-D3BJ/def2-SVP/def2-TZVP(Ru), cpcm water (surfacetype vdw_gaussian)). | ||
The reduction of 3b (or 1) to 4 and the protonation of 4 to 1 are quick at room temperature (about 10 seconds). The release of hydrogen from 1 under acidic conditions to give 3a requires longer reaction times (20 minutes at room temperature) or elevated temperatures (10 minutes at 65 °C).
The slowest step in the cycle, namely the conversion of 1 to 3a under release of hydrogen, was modelled by DFT using the PBE0-D3BJ functional and the def2-SVP/def2-TZVP(Ru) basis set (Fig. 9). Implicit solvent effects were taken into account by using the cpcm model with water as solvent and a Gaussian charge scheme. In the first step, the oxonium dihydride adduct {[Ru2H(μ-H)(Me2dad)(dbcot)2] × H3O+} 1-H3O+ (ΔG = 0 kcal mol−1) reacts in an exergonic reaction to the intermediate [{[Ru2H(η2-H2)(Me2dad)(dbcot)2] × H2O}+I×H2×6-OH2 (ΔG = −6.5 kcal mol−1) which is best described as a hydrated non-classical dihydrogen complex. Hence, this reaction can be seen as an intra-molecular proton transfer reaction from H3O+ to the terminal hydride forming a coordinated polarized Hδ−–Hδ+ ligand to which the H2O molecule remains loosely bound via a H2O··· Hδ+–Hδ−-hydrogen bridge. The intramolecular displacement of H2 at Ru1 by H2O is an exergonic reaction (I×H2×OH2 → 3a×H2: ΔG = −12.1 kcal mol−1) but requires the surmounting of a sizable activation barrier of ΔG# = 21.1 kcal mol−1 at which top resides the activated complex TS1. According to the calculation, the H2 in 3a×H2 forms a van-der-Waals complex with one of the aromatic rings of the dbcot ligands. Finally H2 is released exergonically to give 3a and H2 (3a×H2 → 3a + H2: ΔG = −5.5 kcal mol−1). Note that the reaction between the dihydride complex 1 and neutral H2O to give H2 and the hydroxide complex [Ru(OH)(μ-H)(Me2dad)(dbcot)2] is not only endergonic (ΔG = +11.1 kcal mol−1) but also blocked by a prohibitively high activation barrier of ΔG# = 58.9 kcal mol−1 (Fig. S14†) explaining that this hydroxide complex is not experimentally observed. Overall, the calculations are in fair agreement with the experiments and show that all transformations can take place at room temperature. But specifically, hydrogen release will be significantly faster at elevated temperatures.
The rather efficient production of hydrogen in neutral bulk water with 2dil@Ck as electrocatalyst can be explained by the fact that the proton exchange membrane causes a locally more acidic environment as discussed in the literature.4,5 Generally, the stoichiometric experiments combined with the DFT calculations are in accord with the higher electrochemical activity of the MEA under acidic conditions. This allows to propose the simplified catalytic cycle shown in Fig. 10 which shows some of the elementary steps occurring at the electrode surface. By applying a negative potential, the precursor 2@Ck catalyst is reduced to 4@Ck, which in presence of a proton source, will be instantly protonated to generate 1@Ck. In the next step, molecular hydrogen is released very likely through the formation of a non-classical hydrogen complex such as IH2@Ck. Loss of hydrogen occurs in the next step leading to the cationic hydrido–aquo complex 3a@Ck. Reduction by two electrons from the cathode due to the applied negative applied potential will reduce 3a@Ck and give 4@Ck whereby the catalytic cycle is closed.
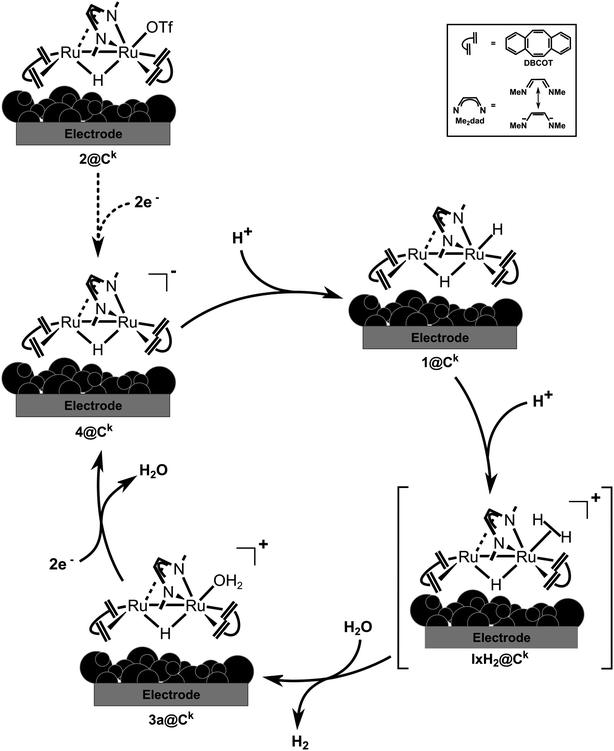 | ||
| Fig. 10 Proposed mechanism for hydrogen evolution reaction by water electrolysis occurring onto the 2@Ck cathode within in the cell. | ||
Conclusions
The dinuclear ruthenium compound, [Ru2(OTf)(μ-H)(Me2dad)(dbcot)2] supported on carbon black (2@Ck) is a remarkably stable catalyst precursor for hydrogen evolution in a PEM electrolyser. Electrodes made from molecular components, such as the cathode reported here, may allow to develop new electrocatalytic materials with a low metal loading but very high efficiency because in principle every supported molecule may serve as active center. The stability of the device used here is remarkable and no decomposition after operation (at 0.2 A cm−2) for one week at 80 °C is observed – a finding that is unprecedented in the literature of PEM electrolysers with immobilised molecular catalysts. A reason for this observation may be that catalytically active species like [Ru2(OH2)(μ-H)(Me2dad)(dbcot)2] 3a do not contain any sensitive components such as phosphanes, R3P, as ligands which are prone to chemical transformations (i.e. formation of phosphaneoxides) which lead to rather rapid catalyst decomposition and deactivation. Instead, the ligand framework is composed exclusively from rather stable C–C, C–N, and C–H bonds. Approximately 28 LH2 min−1 gRu−1 of hydrogen were evolved, with a corresponding turnover frequency of 7800 molH2 molcatalyst−1 h−1. Model reactions and DFT calculations give some insight into a possible mechanism for hydrogen evolution at the electrode surface and show that likely only classical organometallic reaction steps are involved. This in turn can serve as starting point to devise catalysts for devices with higher efficiency and ideally only earth-abundant metals as active sites using the repertoire of known organometallic transformations. It remains to be explored how actually the organometallic complexes interact at the interface of the conducting support material. In the electrocatalytic material 2@Ck reported in this paper, only van-der-Waals interaction exist between the dinuclear Ru complexes and the carbon black (likely H⋯Ck interaction between the hydrogen centers of benzogroups of the dbcot ligand and conjugated p-systems in Ck). In view of this rather weak interaction, the performance is amazing. We believe that the largest potential of improvement lies in the development of materials where the molecular catalyst couple efficiently in the conduction band of the support material.Data availability
The datasets supporting this article have been uploaded as part of the ESI.† Crystallographic data for complexes 3a and 3c have been deposited at the CCDC under 2067317 and 2074594.Author contributions
MB synthesised catalysts, performed electrolysis cell tests, and co-wrote the paper; JB synthesised molecular catalysts, performed NMR experiments and DFT calculation, recorded (3c) and processed (3a & 3c) crystallographic data, and co-wrote the paper; MW recorded crystallographic data (3a) and supervised data processing; DT performed TG analysis; JJGC performed DFT pre-experiments and assisted in interpretation of DFT results; FK conducted TEM and EDXS analysis; FB undertook the electrochemical tests in half cells; HM applied catalysts to GDLs for electrolysis cell tests; LP performed XPS experiments; WO performed XRD and NMR experiments; AL undertook interpretation of TEM analysis; FV provided supervision, coordination, and co-wrote the paper; HG provided supervision, coordination, and co-wrote the paper. MB and JB had the same contribution in the paper and will share the first co-authorship.Conflicts of interest
There are no conflicts of interest to declare.Acknowledgements
This work was financially supported by the Italian Ministry of University and Research MUR by the PRIN 2017 (No. 2017YH9MRK) and FISR 2019 project AMPERE (FISR2019_01294) projects, the Swiss National Science Foundation (SNF) through grant 2-77199-18, and the ETH Zürich. We also thank B. Cortigiani for his assistance in using the CeTeCS platform.References
- A. Lavacchi, H. A. Miller and F. Vizza, in Nanotechnol. Electrocatal. Energy, New York, NY, 2013, pp. 13–14 Search PubMed.
- M. A. Khan, H. Zhao, W. Zou, Z. Chen, W. Cao, J. Fang, J. Xu, L. Zhang and J. Zhang, Electrochem. Energy Rev., 2018, 1, 483–530 CrossRef CAS.
- Y. X. Chen, A. Lavacchi, H. A. Miller, M. Bevilacqua, J. Filippi, M. Innocenti, A. Marchionni, W. Oberhauser, L. Wang and F. Vizza, Nat. Commun., 2014, 5, 4036 CrossRef CAS PubMed.
- K. Ayers, Curr. Opin. Electrochem., 2019, 18, 9–15 CrossRef CAS.
- B. Zhang, L. Fan, R. B. Ambre, T. Liu, Q. Meng, B. J. J. Timmer and L. Sun, Joule, 2020, 4, 1408–1444 CrossRef CAS.
- M. Ďurovič, J. Hnát and K. Bouzek, J. Power Sources, 2021, 493, 229708 CrossRef.
- D. Siegmund, S. Metz, V. Peinecke, T. E. Warner, C. Cremers, A. Grevé, T. Smolinka, D. Segets and U.-P. Apfel, JACS Au, 2021, 1, 527–535 CrossRef CAS PubMed.
- M. Bernt, A. Hartig-Weiß, M. F. Tovini, H. A. El-Sayed, C. Schramm, J. Schröter, C. Gebauer and H. A. Gasteiger, Chem. Ing. Tech., 2020, 92, 31–39 CrossRef CAS.
- Y. Xu, C. Wang, Y. Huang and J. Fu, Nano Energy, 2021, 80, 105545 CrossRef CAS.
- M. Nemiwal, V. Gosu, T. C. Zhang and D. Kumar, Int. J. Hydrogen Energy, 2021, 46, 10216–10238 CrossRef CAS.
- T. Wang, H. Xie, M. Chen, A. D'Aloia, J. Cho, G. Wu and Q. Li, Nano Energy, 2017, 42, 69–89 CrossRef CAS.
- X. Sun, K. Xu, C. Fleischer, X. Liu, M. Grandcolas, R. Strandbakke, T. Bjørheim, T. Norby and A. Chatzitakis, Catalysts, 2018, 8, 657 CrossRef.
- M. Bellini, M. Bevilacqua, A. Marchionni, H. A. Miller, J. Filippi, H. Grützmacher and F. Vizza, Eur. J. Inorg. Chem., 2018, 2018, 4393–4412 CrossRef CAS.
- J. P. Bigi, T. E. Hanna, W. H. Harman, A. Chang and C. J. Chang, Chem. Commun., 2010, 46, 958–960 RSC.
- J. T. Kleinhaus, F. Wittkamp, S. Yadav, D. Siegmund and U.-P. Apfel, Chem. Soc. Rev., 2021, 50, 1668–1784 RSC.
- M. Winkler, J. Duan, A. Rutz, C. Felbek, L. Scholtysek, O. Lampret, J. Jaenecke, U.-P. Apfel, G. Gilardi, F. Valetti, V. Fourmond, E. Hofmann, C. Léger and T. Happe, Nat. Commun., 2021, 12, 756 CrossRef CAS PubMed.
- M. E. Ahmed and A. Dey, Curr. Opin. Electrochem., 2019, 15, 155–164 CrossRef CAS.
- A. Le Goff, V. Artero, B. Jousselme, P. D. Tran, N. Guillet, R. Metaye, A. Fihri, S. Palacin and M. Fontecave, Science, 2009, 326, 1384–1387 CrossRef CAS PubMed.
- J. C. Ruth, R. D. Milton, W. Gu and A. M. Spormann, Chem.–Eur. J., 2020, 26, 7323–7329 CrossRef CAS PubMed.
- Y. H. Budnikova and V. V. Khrizanforova, Pure Appl. Chem., 2020, 92, 1305–1320 CrossRef CAS.
- S. S. Nurttila, R. Zaffaroni, S. Mathew and J. N. H. Reek, Chem. Commun., 2019, 55, 3081–3084 RSC.
- D. Brazzolotto, M. Gennari, N. Queyriaux, T. R. Simmons, J. Pécaut, S. Demeshko, F. Meyer, M. Orio, V. Artero and C. Duboc, Nat. Chem., 2016, 8, 1054–1060 CrossRef CAS PubMed.
- P. Prasad, D. Selvan and S. Chakraborty, Chem.–Eur. J., 2020, 26, 12494–12509 CrossRef CAS PubMed.
- U. J. Kilgore, J. A. S. Roberts, D. H. Pool, A. M. Appel, M. P. Stewart, M. R. DuBois, W. G. Dougherty, W. S. Kassel, R. M. Bullock and D. L. DuBois, J. Am. Chem. Soc., 2011, 133, 5861–5872 CrossRef CAS.
- M. L. Helm, M. P. Stewart, R. M. Bullock, M. R. DuBois and D. L. DuBois, Science, 2011, 333, 863–866 CrossRef CAS PubMed.
- C. M. Klug, A. J. P. Cardenas, R. M. Bullock, M. O'Hagan and E. S. Wiedner, ACS Catal., 2018, 8, 3286–3296 CrossRef CAS.
- F. M. Brunner, M. L. Neville and C. P. Kubiak, Inorg. Chem., 2020, 59, 16872–16881 CrossRef CAS PubMed.
- H. I. Karunadasa, C. J. Chang and J. R. Long, Nature, 2010, 464, 1329–1333 CrossRef CAS PubMed.
- J. G. Kleingardner, B. Kandemir and K. L. Bren, J. Am. Chem. Soc., 2014, 136, 4–7 CrossRef CAS PubMed.
- Y. Sun, J. P. Bigi, N. A. Piro, M. L. Tang, J. R. Long and C. J. Chang, J. Am. Chem. Soc., 2011, 133, 9212–9215 CrossRef CAS PubMed.
- P. Zhang, M. Wang, F. Gloaguen, L. Chen, F. Quentel and L. Sun, Chem. Commun., 2013, 49, 9455 RSC.
- W. M. Singh, T. Baine, S. Kudo, S. Tian, X. A. N. Ma, H. Zhou, N. J. DeYonker, T. C. Pham, J. C. Bollinger, D. L. Baker, B. Yan, C. E. Webster and X. Zhao, Angew. Chem., Int. Ed., 2012, 51, 5941–5944 CrossRef CAS PubMed.
- D. Selvan, P. Prasad, E. R. Farquhar, Y. Shi, S. Crane, Y. Zhang and S. Chakraborty, ACS Catal., 2019, 9, 5847–5859 CrossRef CAS PubMed.
- A. Call, C. Casadevall, A. Romero-Rivera, V. Martin-Diaconescu, D. J. Sommer, S. Osuna, G. Ghirlanda and J. Lloret-Fillol, ACS Catal., 2019, 9, 5837–5846 CrossRef CAS.
- M. Yuki, K. Sakata, Y. Hirao, N. Nonoyama, K. Nakajima and Y. Nishibayashi, J. Am. Chem. Soc., 2015, 137, 4173–4182 CrossRef CAS PubMed.
- C. Sommer, C. P. Richers, W. Lubitz, T. B. Rauchfuss and E. J. Reijerse, Angew. Chem., Int. Ed., 2018, 57, 5429–5432 CrossRef CAS PubMed.
- X. Yang, T. L. Gianetti, M. D. Wörle, N. P. Van Leest, B. De Bruin and H. Grützmacher, Chem. Sci., 2019, 10, 1117–1125 RSC.
- A. S. Pushkarev, M. A. Solovyev, S. A. Grigoriev, I. V. Pushkareva, Y. Z. Voloshin, N. V. Chornenka, A. S. Belov, P. Millet, V. N. Kalinichenko and A. G. Dedov, Int. J. Hydrogen Energy, 2020, 45, 26206–26216 CrossRef CAS.
- A. S. Pushkarev, I. V. Pushkareva, M. A. Solovyev, S. A. Grigoriev, Y. Z. Voloshin, N. V. Chornenka, A. S. Belov, P. Millet, M. Antuch, V. N. Kalinichenko and A. G. Dedov, Mendeleev Commun., 2021, 31, 20–23 CrossRef CAS.
- C. R. Groom, I. J. Bruno, M. P. Lightfoot and S. C. Ward, Acta Crystallogr., Sect. B: Struct. Sci., Cryst. Eng. Mater., 2016, 72, 171–179 CrossRef CAS.
- M. Bellini, J. Filippi, H. A. Miller, W. Oberhauser, F. Vizza, Q. He and H. Grützmacher, ChemCatChem, 2017, 9, 746–750 CrossRef CAS.
- S. P. Annen, V. Bambagioni, M. Bevilacqua, J. Filippi, A. Marchionni, W. Oberhauser, H. Schönberg, F. Vizza, C. Bianchini and H. Grützmacher, Angew. Chem., Int. Ed., 2010, 49, 7229–7233 CrossRef CAS PubMed.
- M. Bellini, M. Bevilacqua, J. Filippi, A. Lavacchi, A. Marchionni, H. A. Miller, W. Oberhauser, F. Vizza, S. P. Annen and H. Grützmacher, ChemSusChem, 2014, 7, 2432–2435 CrossRef CAS PubMed.
- M. Bevilacqua, C. Bianchini, A. Marchionni, J. Filippi, A. Lavacchi, H. Miller, W. Oberhauser, F. Vizza, G. Granozzi, L. Artiglia, S. P. Annen, F. Krumeich and H. Grützmacher, Energy Environ. Sci., 2012, 5, 8608 RSC.
- M. A. Hoque, M. Gil-Sepulcre, A. de Aguirre, J. A. A. W. Elemans, D. Moonshiram, R. Matheu, Y. Shi, J. Benet-Buchholz, X. Sala, M. Malfois, E. Solano, J. Lim, A. Garzón-Manjón, C. Scheu, M. Lanza, F. Maseras, C. Gimbert-Suriñach and A. Llobet, Nat. Chem., 2020, 12, 1060–1066 CrossRef CAS PubMed.
- S. Shiva Kumar and V. Himabindu, Mater. Sci. Energy Technol., 2019, 2, 442–454 Search PubMed.
- C. Elmasides, D. I. Kondarides, W. Grünert and X. E. Verykios, J. Phys. Chem. B, 1999, 103, 5227–5239 CrossRef CAS.
- B. Li, L. Li and C. Zhao, Green Chem., 2017, 19, 5412–5421 RSC.
- V. Mazzieri, Appl. Surf. Sci., 2003, 210, 222–230 CrossRef CAS.
- D. J. Morgan, Surf. Interface Anal., 2015, 47, 1072–1079 CrossRef CAS.
- R. E. Rodríguez-Lugo, M. Trincado, M. Vogt, F. Tewes, G. Santiso-Quinones and H. Grützmacher, Nat. Chem., 2013, 5, 342–347 CrossRef PubMed.
Footnotes |
| † Electronic supplementary information (ESI) available. CCDC 2067317 and 2074594. For ESI and crystallographic data in CIF or other electronic format see DOI: 10.1039/d1sc07234j |
| ‡ MB and JB had the same contribution in the paper and will share the first co-authorship. |
| This journal is © The Royal Society of Chemistry 2022 |

