
 Open Access Article
 This Open Access Article is licensed under a Creative Commons Attribution-Non Commercial 3.0 Unported Licence
The quantum dot vs. organic dye conundrum for ratiometric FRET-based biosensors: which one would you chose?†
Chloé
Grazon
 *abc,
Margaret
Chern
d,
Patrick
Lally
f,
R. C.
Baer
eg,
Andy
Fan
f,
Sébastien
Lecommandoux
b,
Catherine
Klapperich
f,
Allison M.
Dennis
*df,
James E.
Galagan
*efg and
Mark W.
Grinstaff
*adf
*abc,
Margaret
Chern
d,
Patrick
Lally
f,
R. C.
Baer
eg,
Andy
Fan
f,
Sébastien
Lecommandoux
b,
Catherine
Klapperich
f,
Allison M.
Dennis
*df,
James E.
Galagan
*efg and
Mark W.
Grinstaff
*adf
aDepartment of Chemistry, Boston University, Boston, MA 02215, USA. E-mail: chloe.grazon@u-bordeaux.fr; mgrin@bu.edu
bUniversity Bordeaux, CNRS, Bordeaux INP, LCPO, UMR 5629, F-33600, Pessac, France. E-mail: sebastien.lecommandoux@enscbp.fr
cUniversity Bordeaux, CNRS, Bordeaux INP, ISM, UMR 5255, F-33400 Talence, France
dDivision of Materials Science and Engineering, Boston University, Boston, MA 02215, USA. E-mail: margaret.chern@gmail.com; aldennis@bu.edu
eDepartment of Microbiology, Boston University, Boston, MA 02118, USA. E-mail: rcbaer@gmail.com; jgalag@bu.edu
fDepartment of Biomedical Engineering, Boston University, Boston, MA 02215, USA. E-mail: plally@bu.edu; canvasback@gmail.com; catherin@bu.edu
gNational Emerging Infectious Diseases Laboratories, Boston University, Boston, MA 02118, USA
First published on 4th May 2022
Abstract
Förster resonance energy transfer (FRET) is a widely used and ideal transduction modality for fluorescent based biosensors as it offers high signal to noise with a visibly detectable signal. While intense efforts are ongoing to improve the limit of detection and dynamic range of biosensors based on biomolecule optimization, the selection of and relative location of the dye remains understudied. Herein, we describe a combined experimental and computational study to systematically compare the nature of the dye, i.e., organic fluorophore (Cy5 or Texas Red) vs. inorganic nanoparticle (QD), and the position of the FRET donor or acceptor on the biomolecular components. Using a recently discovered transcription factor (TF)–deoxyribonucleic acid (DNA) biosensor for progesterone, we examine four different biosensor configurations and report the quantum yield, lifetime, FRET efficiency, IC50, and limit of detection. Fitting the computational models to the empirical data identifies key molecular parameters driving sensor performance in each biosensor configuration. Finally, we provide a set of design parameters to enable one to select the fluorophore system for future intermolecular biosensors using FRET-based conformational regulation in in vitro assays and new diagnostic devices.
Introduction
Biosensors play a critical and essential role in medical diagnostics, environmental monitoring, food and water safety, and in the detection of chemical or biological threats.1 A typical biosensor utilizes a biorecognition element2,3 coupled to a transduction mechanism, such as surface plasmon resonance,4 electrochemistry,5 or fluorescence.6 Of these transduction mechanisms, fluorescence detection is widely used, as it is cost effective to develop and to commercialize, and offers high signal to noise with a visibly detectable signal. Optimizing fluorescent biosensor performance requires a multi-pronged approach involving the detector,7 the biomolecule/receptor affinity, and the dyes.8,9 A common fluorescence modulation modality is based on Förster resonance energy transfer (FRET), discovered by Theodor Förster in the 1940s,10 where non-radiative energy transfer occurs between the transition dipoles of two dyes: the donor and acceptor. FRET efficiency depends on several parameters such as the quantum yield of the donor, the spectral overlap between the donor fluorescence and the acceptor absorbance, and the distance between the donor and acceptor. Given the strong dependence between the resulting fluorescent signal and the distance between the two dyes, FRET is of widespread use in monitoring biological processes11 and in sensors. FRET-based sensors12 include detection of small molecules (e.g., antibiotics,13–15 glucose16), proteins (e.g., cAMP receptor protein,17 carcinoembryonic antigen18), nucleic acids,19,20 bacteria,21 and viruses.22 Such sensors can also now be directly read using a smartphone.6,23,24We recently described a novel FRET biosensor for progesterone (PRG) based on an allosteric transcription factor (TF) binding to its cognate nucleic acid sequence (steroid responsive transcription factor 1: SRTF1).25 Allosteric transcription factors26 are regulatory proteins that contain a DNA-binding domain and a ligand-binding domain. The FRET signal in the PRG TF-based biosensor arises when a CdSe/CdS/ZnS quantum dot donor associated with SRTF1 binds the SRTF1 DNA binding sequence labeled with a cyanine 5 (Cy5) dye acceptor.3 Binding of PRG to SRTF1 decreases the TF's affinity for its cognate DNA sequence, leading to release of the DNA and an increase in the donor–acceptor distance. The biosensor is efficient and selective with an LOD that varies from 740 nM to 15 nM for PRG,25 depending on the sensor design (nature of TF and oligonucleotides). Importantly, the sensitivity is within relevant PRG concentrations of clinical interest.
As a first biosensor of this class, we are investigating the role of donor and acceptor composition (conventional organic fluorophores vs. quantum dots), the placement on the TF or DNA, and the ratios of TF to DNA concentrations on sensor performance. Through this systematic study we determine if: (i) the FRET sensor works equally well whether the biomolecule–fluorophore pair is in the original or flipped configuration (i.e., TF–QD + DNA-Cy5 vs. DNA–QD + TF-Cy5), (ii) the impact of changing TF and DNA concentrations, and (iii) a system based solely on small fluorescent dyes is as efficient and sensitive as one incorporating a QD. Although QD and fluorophore-based FRET sensors are extensively used,27 the direct comparison of performance between such systems is lacking in the literature, and such data is critical for informing and optimizing biosensors, agnostic of the intended application.
Specifically, we describe a combined experimental and computational analysis of four different TF-FRET PRG biosensors based on quantum dots and fluorophores (Fig. 1). In pairs A and B, the FRET donor is a Texas Red (TR) dye emitting at 615 nm, labelled to either a TF or a short oligonucleotide and the FRET acceptor is a Cy5 dye (maximum absorption at 650 nm) conjugated to either a short DNA sequence – sensor A, or a TF – sensor B. In pairs C and D, the donor is a CdSe/CdS/ZnS QD emitting at 613 nm decorated with either a histidine-tagged TF (TF-his6) conjugated to Cy5 or a short oligonucleotide28 conjugated to Cy5. We report the quantum yield (QY), lifetime (τ), FRET efficiency (E), half maximal inhibitory concentration (IC50), and limit of detection (LOD) for detecting PRG for all four biosensors. Further, we develop computational models of the equilibrium molecular behavior of each biosensor system. Fitting the models to the empirical data identifies key molecular parameters driving sensor performance in each biosensor configuration. Finally, we provide a set of design parameters to enable one to select the fluorophore system for future intermolecular biosensors using FRET-based conformational regulation in in vitro assays and new diagnostic devices.
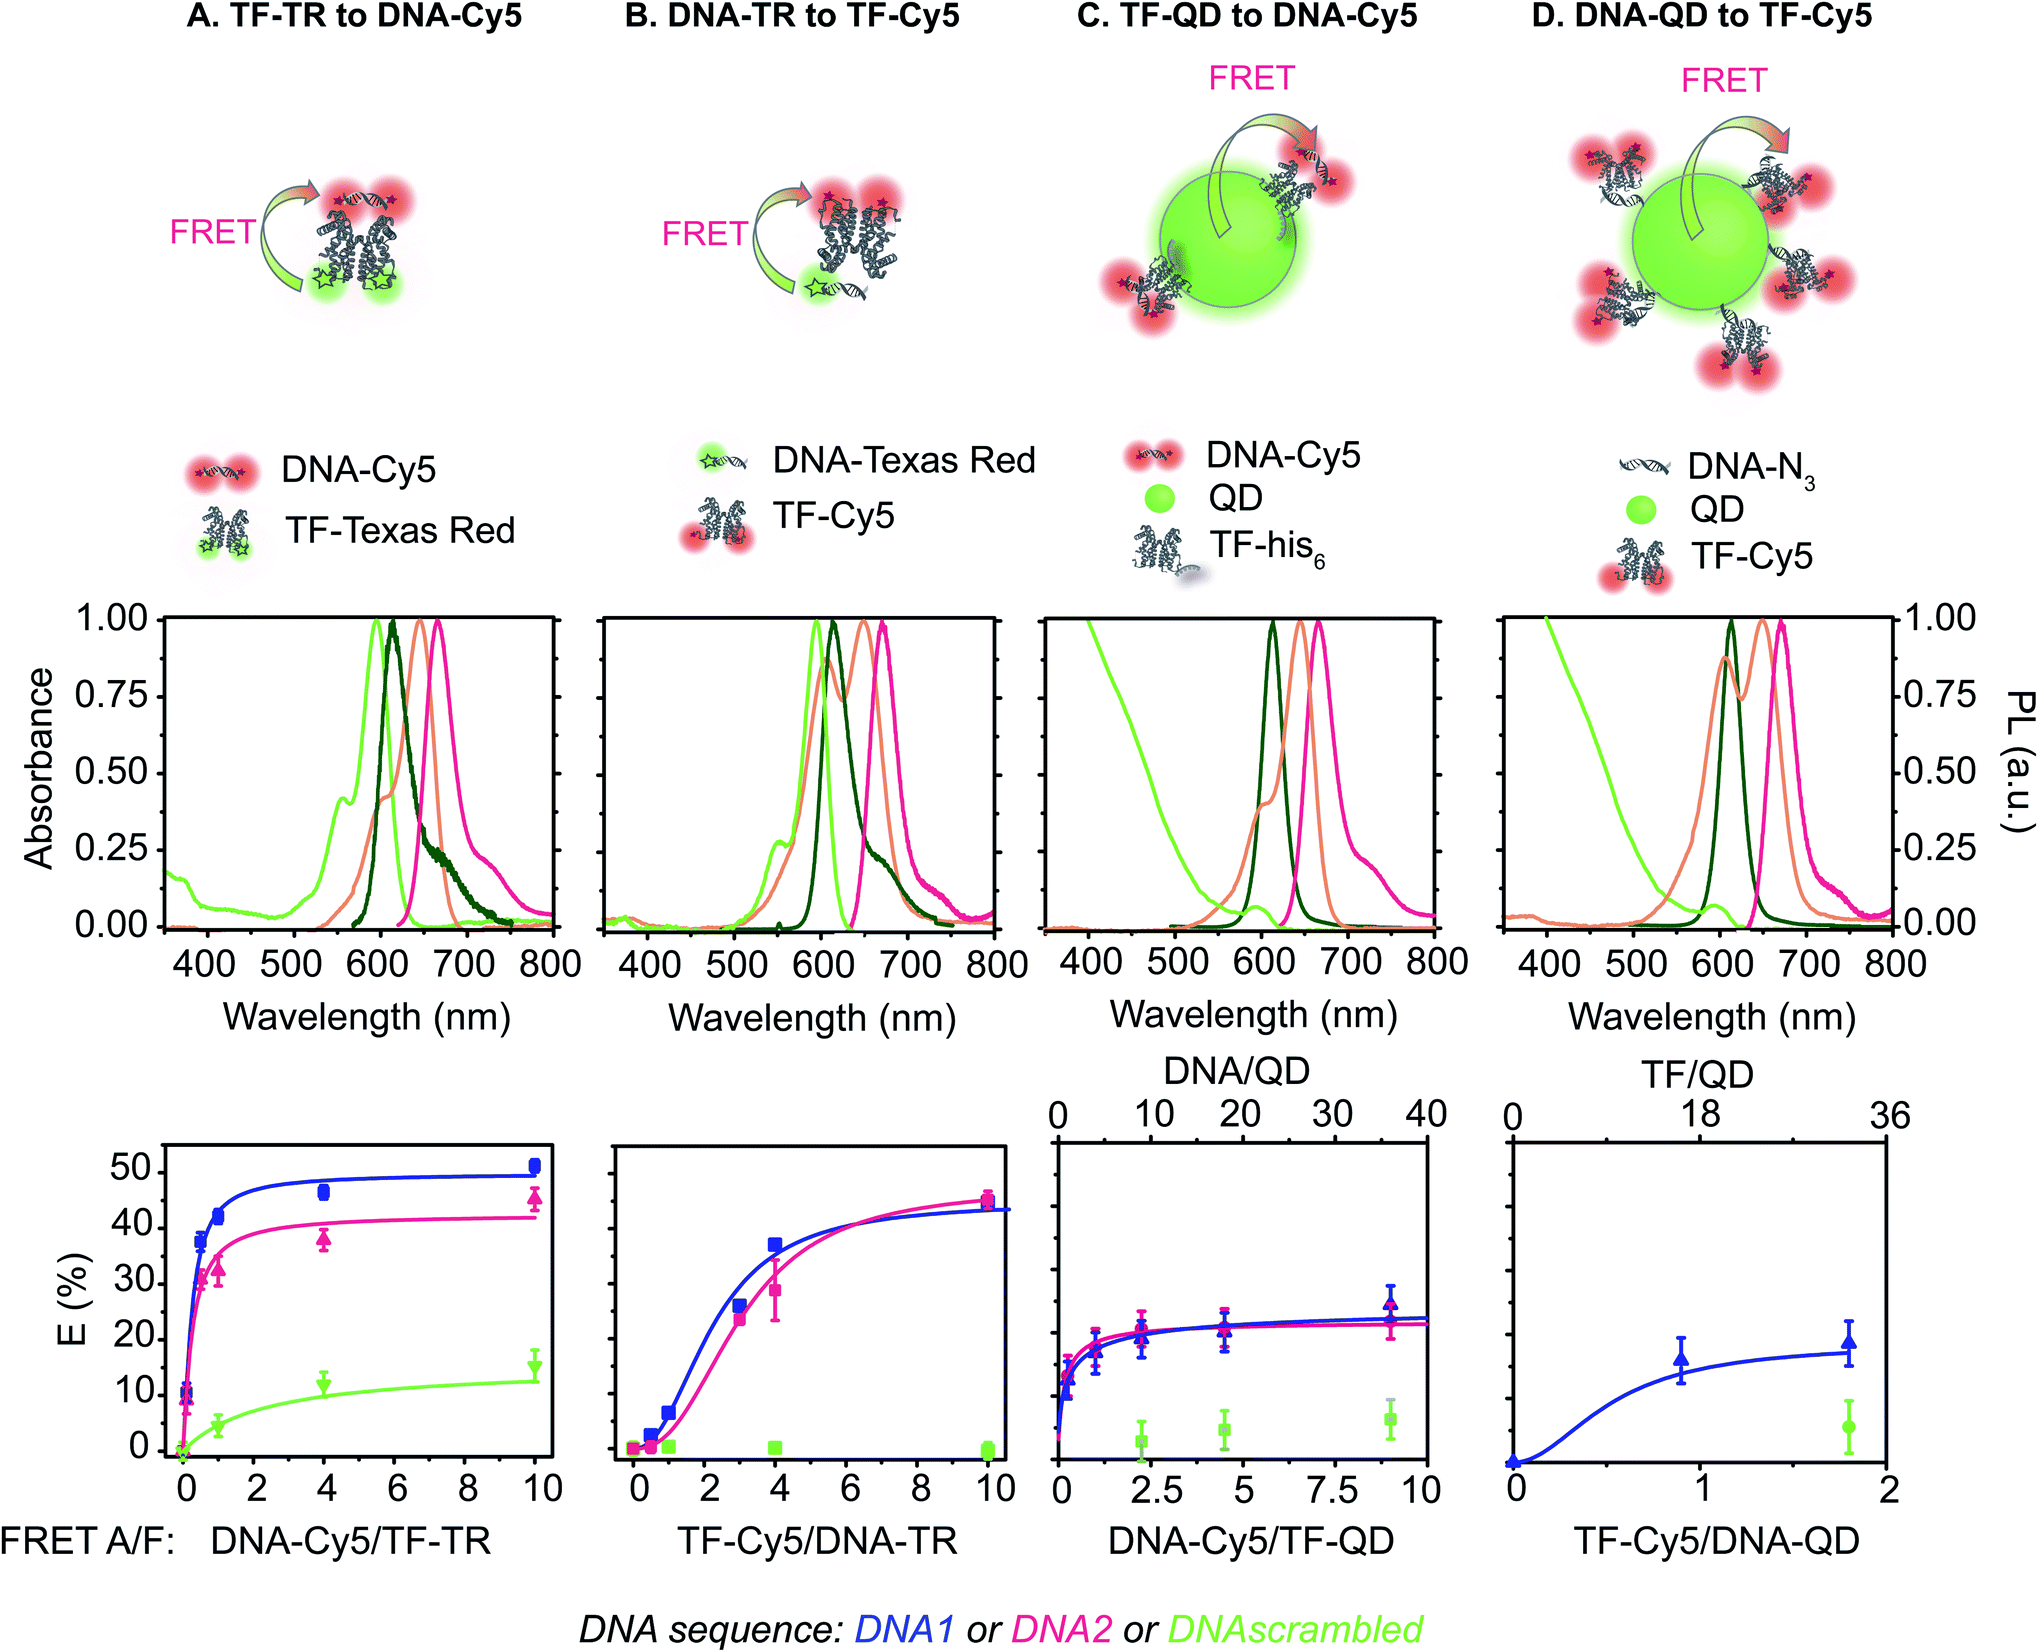 | ||
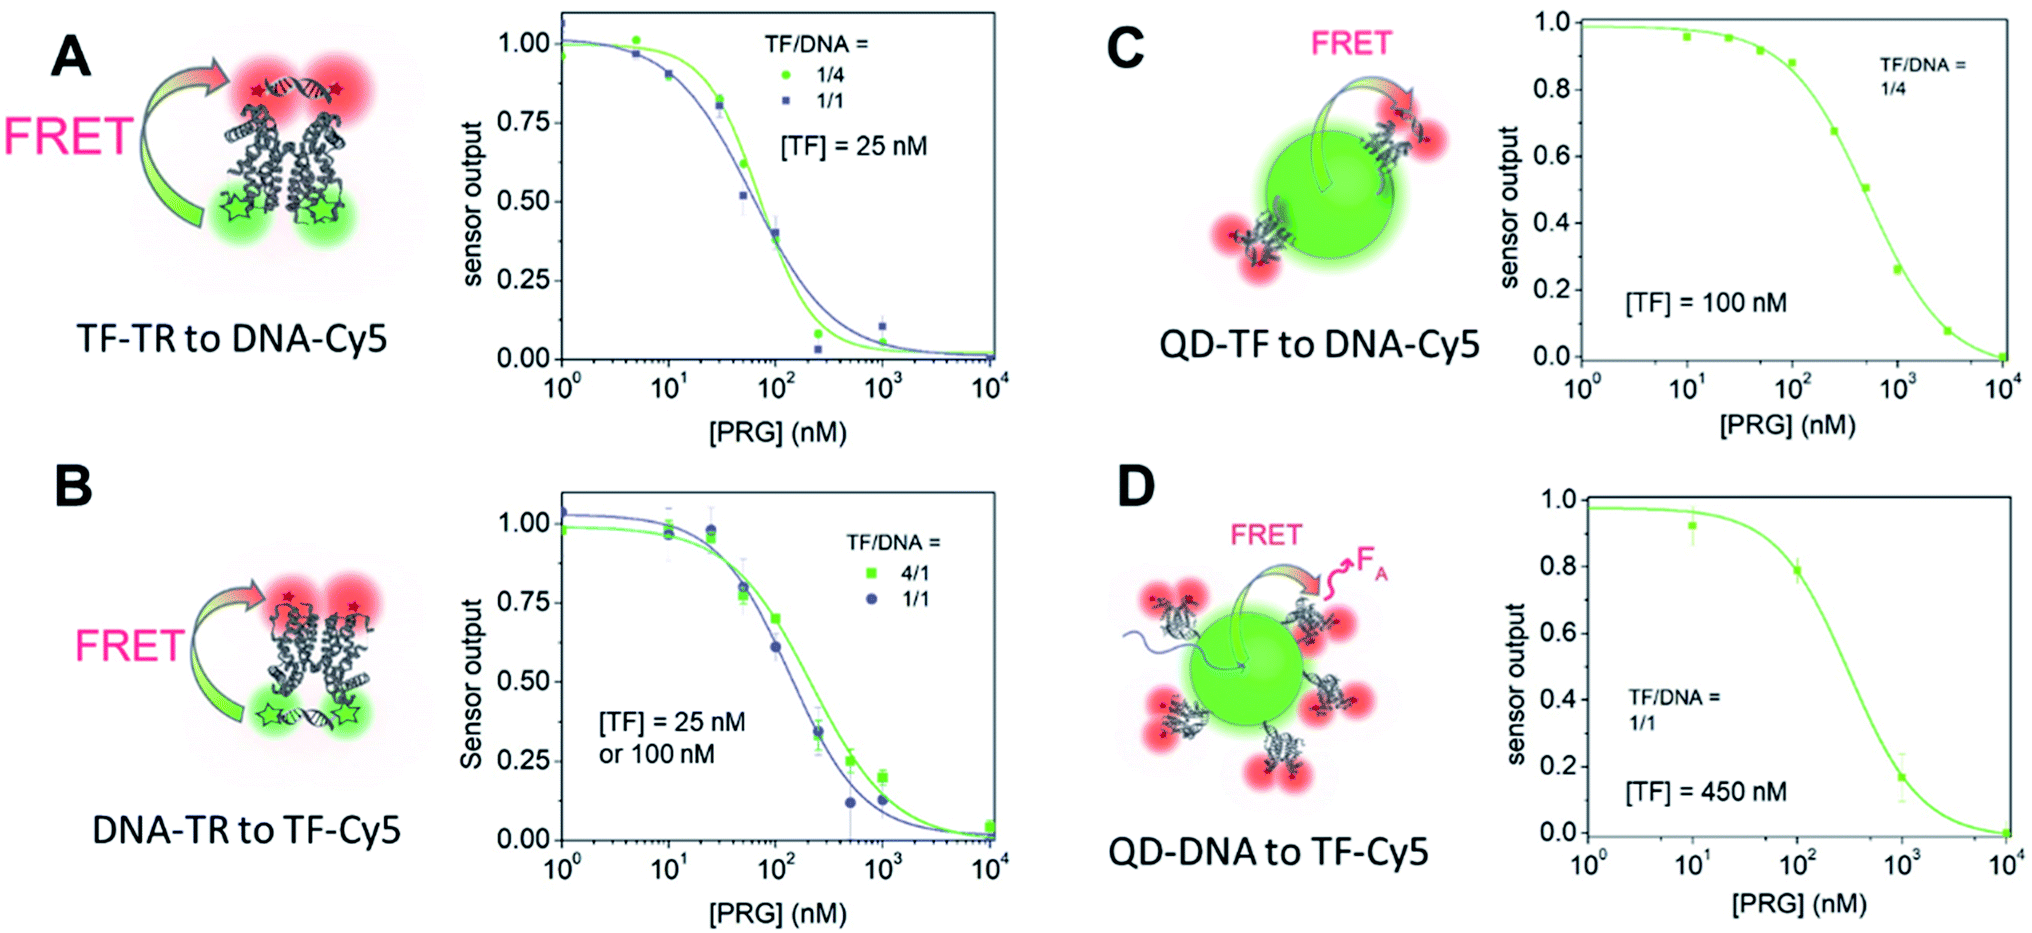
| Fig. 1 FRET pairs analyzed in this study. Top: schematic of the pairs. (A) Donor: TF-TR, acceptor: DNA-Cy5; (B) donor: DNA-TR, acceptor: TF-Cy5; (C) donor: TF–QD, acceptor: DNA-Cy5; (D) donor: DNA–QD, acceptor: DNA-Cy5. Representative examples are shown. For (C) and (D), the actual molar ratios of the biomacromolecules are not shown for easy of clarity. Please see the bottom row for the ratios studied. Middle: absorption and fluorescent emission spectra measured in HEPES 1×. The donor spectra are represented in green and the acceptor spectra in pink. Absorbance spectra are lighter, while fluorescence spectra are darker. Bottom: FRET efficiency calculated using lifetime measurements of the different FRET sensors. | ||
Results and discussion
Construction of FRET donors and acceptors
We synthesized the fluorophore-labeled TFs (SRTF1; TF-TR & TF-Cy5; Fig. 1) by first installing a C-terminal cysteine in the TF protein sequence followed by conjugation between this C-terminal cysteine and the corresponding maleimide fluorophores (see details in ESI and Fig. S1 and S2†). In both cases, we confirmed conjugation with MALDI-TOF, and we estimated a labelling efficiency of ∼90% via absorption measurements for the TF-TR. The TF–fluorophore constructs are fluorescent and free of unreacted dyes after purification, as indicated by analysis of samples run on polyacrylamide agarose gels (Fig. S1 and S2†).For QD constructs, we selected a core/shell/shell CdSe/CdS/ZnS QD emitting at 613 nm capped with a zwitterionic copolymer28,29 bearing carboxylic acid, quaternary amine, and imidazole moieties as the donor. The QDs are spherical, 7.6 ± 0.4 nm (n = 101) in diameter (TEM Fig. S3†).
To prepare TF-labeled QDs, we mixed the QDs with a 1![[thin space (1/6-em)]](https://www.rsc.org/images/entities/char_2009.gif) :4 molar concentration of C-terminal histidine-tagged TFs (named TF-his6) in HEPES buffer. The QD:TF molar ratio was chosen to enhance the FRET efficiency while maintaining high sensitivity of the sensor. Specifically, we selected 4 proteins per QD because ≥4 protein-his6 molecules are needed per QD to avoid naked QDs, i.e., non-functionalized donors,30,31 and our previous work showed that higher TF concentrations increased the LOD and IC50 of the biosensor.25,32
:4 molar concentration of C-terminal histidine-tagged TFs (named TF-his6) in HEPES buffer. The QD:TF molar ratio was chosen to enhance the FRET efficiency while maintaining high sensitivity of the sensor. Specifically, we selected 4 proteins per QD because ≥4 protein-his6 molecules are needed per QD to avoid naked QDs, i.e., non-functionalized donors,30,31 and our previous work showed that higher TF concentrations increased the LOD and IC50 of the biosensor.25,32
To prepare the DNA–QD, we used a modified version of our previously described zwitterionic polymer with 40% imidazole to anchor it to the QD, and 10% dibenzocyclooctyne (DBCO) for grafting.28 Using copper-free click chemistry, we successfully grafted an average of 18 DNA-azide strands to the QD surface (Fig. S4†) with >90% efficiency, following our published procedure.28,29
The DNA sequence comprises a 20 bp cognate binding region to the TF. In the DNA–QD sensor design, the 20 bp cognate sequence is flanked by 4 bp on the azide side to reduce steric hindrance between the QD nanoparticle and TF protein. In the DNA-Cy5 and DNA-TR sensors, each side of the 20 bp cognate sequence is flanked by 4 bp to ensure binding, resulting in a 28 bp DNA oligo. For those fluorophore-labeled DNA, we bought DNA already labelled with the donor or acceptor dye. Texas Red (FRET donor) is attached on the 5′ end of one of the DNA strands to produce the DNA-TR. For the DNA-Cy5, the Cy5 acceptor fluorophore is located on both the 5′ and 3′ ends of one the DNA strands to increase the number of FRET acceptors in the pair and, as such, to improve the FRET efficiency of the system. Each DNA-labelled strand is hybridized with its complement strand prior to the sensor assays.
Characterization of FRET donors and acceptors
We examined the fluorescence emission spectra and quantum yield (QY) of each of the FRET donors (Table 1). The QY of the QD is unchanged by the TF binding or DNA grafting, but QDs encapsulated with the DBCO-containing version of the PIMA polymer exhibit higher QY before biofunctionalization, leading to a higher QY for the DNA-labeled QD donor compared to the TF-labeled QD donor (TF–QD QY = 25%; DNA–QD QY = 37%, Table 1).28 The dye-labeled DNA strands exhibit high QYs, with values similar to those obtained in solution for the free dyes (DNA-TR QY = 71%;33 DNA-Cy5 QY = 23%,34Table 1). Interestingly, when the TF is labelled with Texas Red, the emission spectra of TR does not change, but its quantum yield decreases from 70% to 24%. Similarly, when conjugated to the protein, the Cy5 fluorophore exhibits a hypsochromically shifted H-band emission35,36 (Fig. S5 and S6†) and a decrease in QY from 23% to 7%. To determine if the spectral changes are due to aggregation, we measured the fluorescence of TF-Cy5 in a 50/50 (v/v) mixture of DMSO/H2O (Fig. S5†). In this solvent mixture, no hypsochromic band emission is present, and the Cy5 QY is 23%, confirming that the spectral shift and decrease in quantum yield are likely due to the Cy5 dyes forming H-aggregates, consistent with previous reports of this phenomenon.35,36| Sample | Role | ε (λabs/nm) (M−1 cm−1) | λ abs,max (nm) | λ F (nm) | QYc (HEPES) (%) | QYc (assay) (%) | B × 103 (M−1 cm−1) |
|---|---|---|---|---|---|---|---|
| a Molar coefficient extinction of the dye at the specified wavelength in brackets. b Maximum absorption and emission wavelengths. c Quantum yield in HEPES 1× or in the assay buffer. d Brightness of the donor when excited at its maximum absorbance (i.e., 595 nm for Texas Red and 400 nm for QD). B = ε × QY. | |||||||
| TF-TR | Donor | 84000 (ref. 33) (595) |
595 | 615 | 17 | 24 | 20 |
| DNA-TR | Donor | 84000 (ref. 33) (595) |
595 | 613 | 63 | 71 | 60 |
| TF–QD | Donor | 2600000 (400) |
— | 613 | 25 | 25 | 650 |
| DNA–QD | Donor | 2600000 (400) |
— | 613 | 37 | 37 | 962 |
| TF-Cy5 | Acceptor | 250000 (ref. 34) (645) |
645 | 643 | 7.0 | 8.6 | |
| DNA-Cy5 | Acceptor | 250000 (645) |
645 | 639 | 23 | 24 | |
SRTF1 belongs to the TetR family of transcription factors, which is known to homodimerize in solution.37 The C-terminal cysteine used for dye labeling is localized at a homologous site such that when the TF adopts a dimer form, the cysteines face each other. Thus, the dyes conjugated to the cysteines are in very close proximity. The decrease in QY observed for both TF-TR and TF-Cy5 is likely due to dye proximity in the TF homodimer.
Assessment of FRET pairs
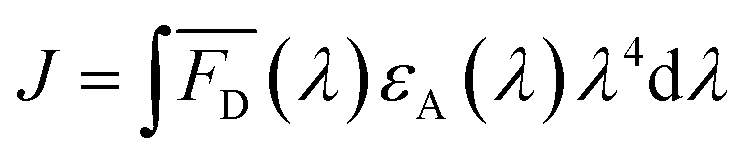
The two key parameters for achieving efficient FRET are high QY of the donor and sufficient spectral overlap between the donor fluorescence emission and the acceptor absorbance spectra (eqn (3) and (4)). We calculated the key FRET parameters of the four possible combinations of donor–acceptor pairs (Table 2) using the optical properties of the various fluorophore-labeled biomolecules. We used the spectral profiles of the donor and acceptor to determine spectral overlap (J), considering that in this study the donor emission and acceptor absorbance spectra vary with their environment. Indeed, as discussed earlier, when the Cy5 is conjugated to the TF, we observed a broadening of the absorbance spectra (i.e., increase in the FWHM) (Fig. S6† and 1) and a resulting increase in the spectral overlap between the donor dye emission and the acceptor absorbance.38 Consequently, the calculated J (Table 2) is significantly lower when using DNA-Cy5 (no H-agg.) vs. TF-Cy5 (H-agg.) as the FRET acceptor.| Donor | Acceptor | QYDa | J (×1016) (M−1 cm−1 nm4) | R 0 (nm) | E max DNA1 (%) | E max DNA2 (%) | E max sbdDNA (%) |
|---|---|---|---|---|---|---|---|
| a Quantum yield of the donor. b Spectral overlap and Förster radius calculated for a single acceptor system. | |||||||
| TF-TR | DNA-Cy5 | 24 | 2.29 | 6.8 | 51 | 45 | 15 |
| DNA-TR | TF-Cy5 | 71 | 2.93 | 8.5 | 46 | 45 | 0 |
| TF–QD | DNA-Cy5 | 25 | 1.76 | 6.6 | 24 | 22 | 6 |
| DNA–QD | TF-Cy5 | 37 | 2.82 | 7.6 | 19 | 6 | |
The characteristic Förster distance (R0) for a given donor–acceptor pair also depends on the donor QY. Since the positioning of Texas Red on the TF leads to dye quenching, R0 notably shortens for the pair using TF-TR as the donor compared to the DNA-TR donor. The hydrodynamic radius of the similar aTF TetR is approximately 3 nm,39 a similar size as our 24 bp DNA of 8.2 × 2 nm.
We estimated the energy transfer efficiency (E) of all the FRET pairs using photoluminescence lifetime measurements (Fig. S7 and Table S3†). For each system, we titrated Cy5-FRET acceptors to the donors (Fig. 1 and S7†). We used two different DNA sequences, with DNA1 exhibiting a slightly stronger affinity (Kd) for the TF than DNA2, as well as a scrambled DNA control (Tables S1 and S2†). Using scrambled DNA on the TF-TR to DNA-Cy5 biosensor, there is some non-specific binding (15%) likely due to TR and DNA interactions as TR is a known to associate with DNA through van der Waals interactions.40 In contrast, no non-specific binding is seen with the flipped system (i.e., DNA-TR to TF-Cy5). Both QD-based sensors exhibit up to 6% non-specific binding. For both QD-based systems, the maximum FRET efficiency (E) is approximately 20%, while for the dye-based systems E is between 45 and 50%. It is important to recall that multiple TFs or DNA oligonucleotides bind the QD surface, enabling multiple dyes to act as the acceptor to a single QD donor. Adding multiple acceptor molecules increases the FRET efficiency compared to a single acceptor at the same donor–acceptor distance.41,42 On the other hand, the larger size of the QD compared to the organic dye increases the donor–acceptor distance, thus decreasing energy transfer efficiency. The interplay between FRET efficiency and donor–acceptor distance is key to optimization.
By titrating the acceptor biomolecules relative to the donor, we identified when the FRET efficiency is greatest (Fig. 1 and S7†). When the TF is labelled with the donor dye (i.e., (A) TF-TR to DNA-Cy5 and (C) TF–QD to DNA-Cy5), the FRET efficiency plateaus after addition of ≈2.5 DNA per TF (monomer) (or 5 DNA for a TF dimer). These data suggest that only a small excess of DNA, relative to the TF, is required for biosensor assembly. In contrast, more acceptor dyes are needed to reach maximum FRET efficiency when the TF is labeled with the acceptor dye (i.e., (B) DNA-TR to TF-Cy5).
FRET efficiency is one of the key parameters in our sensor design. But in generating a sensor output that easily correlates with the concentration of the target analyte, we do not directly measure the FRET efficiency between the donor and acceptor but rather the ratio of the fluorescence intensity from the donor and the acceptor. The QY of the different dyes and the brightness of the biosensor are consequently two major parameters that define overall sensor performance. To achieve high fluorescence variation over the titration requires a large QY for both the donor and acceptor as well as high FRET efficiency (Tables 1 and 2). The DNA-TR donor (sensor B) exhibits the highest QY (71%), while the DNA-Cy5 (sensors A and C) exhibits the highest acceptor QY (24%). The corresponding TF-TR (sensor A) and TF-Cy5 (sensors B and D) possess lower QY, likely due to dye aggregation in the protein dimer. It is challenging to hypothesize which system will exhibit the largest change in fluorescence (and lowest standard deviation) over the progesterone titration based only on a comparison of the QY. For a given dye concentration, a higher brightness affords a better signal to noise ratio and sensitivity. In our system, we determined the overall brightness given the experimental constraint that the QDs are excited at 400 nm, while the Texas Red donors are excited at 585 nm (Table 1). Due to their strong absorption in the UV, the QD donor is almost 10 times brighter than the TR donor. This is notable, because a low FRET efficiency in bright systems can afford larger changes in sensor fluorescence output than in systems with high FRET efficiency and low brightness.43
Simulating FRET sensor dynamics
To better understand the different FRET efficiencies and binding behaviors observed experimentally (Fig. 1), we performed simulations of TF–DNA binding using MATLAB. We based our simulation on a mass-action model of TF–DNA and TF–analyte binding which predicts the proportion of FRET donors that are bound and the corresponding FRET output (see Methods). Additionally, we fixed a TF dimerization equilibrium constant, defined in Table S4† along with the other biophysical parameters. Simulations based on the experimental configurations and concentrations used in Fig. 1 are shown with the same colors in Fig. 2. Each trace represents a different TF-dimer:DNA binding equilibrium constant, which is used to fix the TF-monomer:DNA equilibrium binding constants.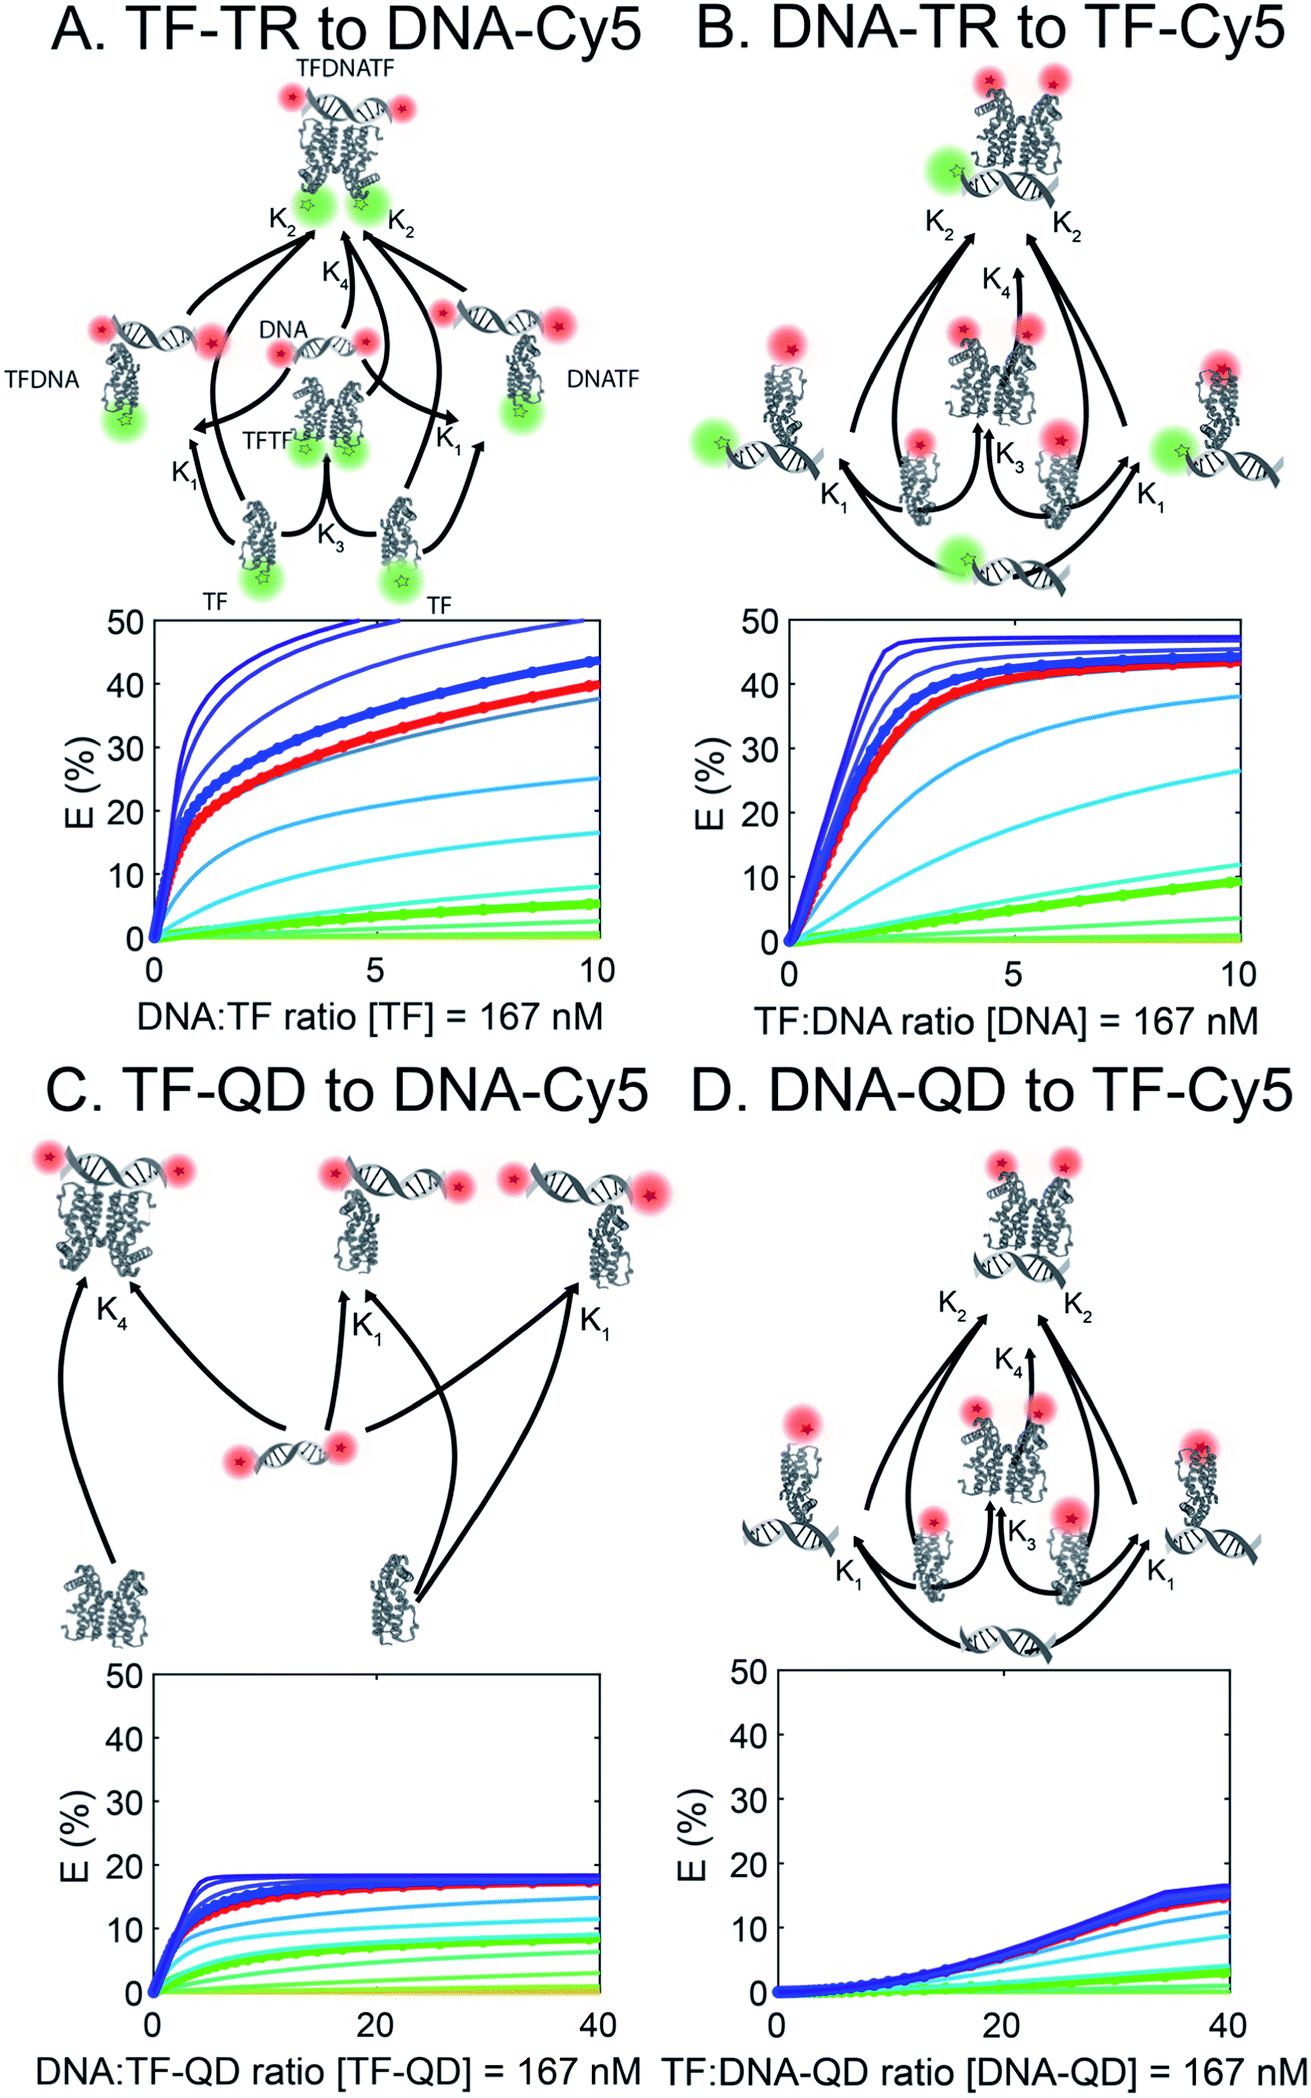 | ||
| Fig. 2 FRET simulations of the four sensors (A to D) in Fig. 1. Each trace represents a different TF:DNA binding affinity, with the circled & bolded traces corresponding to the DNAs used in the experiments. QD are not properly represented as they are not modelled in the affinity-based diagram (affinity between QD and TF or DNA is not simulated). | ||
Using our simulations, we provide explanations for two key features of the experimental data in Fig. 1. First, our experimental results display a marked asymmetry in FRET efficiency when the acceptors are DNA (TF-TR and TF–QD configurations), as opposed to TFs (TF-Cy5 configurations). In particular, DNA acceptors appear to saturate more quickly, while TF acceptors display a more sigmoidal behavior. The asymmetry in the experimental results suggests a potential cooperative effect when using TFs as the acceptor that does not reveal itself when DNA is the acceptor. A potential explanation for this asymmetry is that dimerization between monomers of the TF leads to cooperative DNA binding. This hypothesis is consistent with the fact that SRTF1 is a member of the TetR family and is known to dimerize, as noted above, and the formation of the Cy5-H-agg.30 As TF monomer concentrations increase, TFs dimerize and bind more strongly to DNA, which would lead to a sigmoidal response.
To test the above hypothesis, we simulated models with and without TF dimerization. In models without TF dimerization, TFs bind directly to DNA as monomers only (Fig. S14†). In models with TF dimerization, we considered multiple possible interactions: TF monomers can bind free DNA, TF monomers can bind DNA already bound by another TF monomer, TF monomers can bind each other in solution to form a TF dimer, and TF dimers can bind free DNA (Fig. 2). In simulations of the TF-Cy5 and TF-TR configurations, we included all of the above interactions in the dimerization models. In simulations of the TF–QD configuration, we treated TFs as immobilized on QDs at a fixed proportion of monomers and dimers depending on the concentration of QDs and TF:QD ratio. Additionally, only interactions between monomers and DNA, and dimers and DNA are included in these simulations (see Methods for details).
Consistent with our hypothesis, simulations ignoring dimerization do not display the asymmetry between the TF-TR and TF–QD configurations and the TF-Cy5 configurations (Fig. S14†), while models with dimerization recapitulate the asymmetry (Fig. 2). Both TF acceptor configuration simulations (TF-Cy5, (B) and (D) in Fig. 2) display a sigmoidal shape consistent with the cooperativity hypothesis, while the DNA acceptor configurations (TF-TR and TF–QD donors, (A) and (C) in Fig. 2) linearly rise to saturation. In our simulations, the asymmetry depends on the relative affinities of monomers to each other, and the degree of cooperativity in DNA binding between monomers. Increasing the affinity of monomers for each other, or increasing the degree of cooperativity in DNA binding increases the observed asymmetry, as expected given our hypothesis.
We further estimated the scale of these dimerization parameters by fitting our simulations to the empirical data. Our results predict that TFs dimerize with ∼100 nanomolar affinity. They also predict that DNA-binding of a monomer to free DNA occurs with 5% of the affinity of dimer binding to DNA, and that DNA-binding of a monomer to DNA already bound with another monomer occurs with 10% of the affinity of dimer binding to DNA.
The second key feature of our empirical data we simulated was the overall lower FRET efficiency with the QD-based sensors. In these sensors the higher acceptor:donor ratio would tend to lead a higher FRET efficiency. We hypothesized that the effect of higher acceptor:donor ratio is offset by an increased distance, r, between donor and acceptor, leading to an overall net decrease in FRET efficiency. The overall larger size of QDs (radii ∼ 3–4 nm; based on the TEM image in Fig. S3†) compared to Cy5 (radius of only ∼0.5 nm) is consistent with this hypothesis. Simulations using varying values for r confirm that larger values of r decrease FRET efficiency leading to a net decrease in the QD-based sensors.
We further estimated r for the different model configurations by fitting our models to the empirical data with estimated values for r of 8.2, 9.7, 9.5, and 11 nm, for the TF-TR, DNA-TR, TF–QD, and DNA–QD configurations, respectively (Table S5†). An approximately 1.3 nm (15%) increase in effective FRET distance is present between the corresponding dye and QD models. This result is somewhat smaller than the ∼2.5–3.5 nm difference between QD and Cy5 radii that we might expect, indicating that there are other effects our models may not capture completely.
Biosensor performance
The relationship between fluorescence change and progesterone concentration determines the overall biosensor performance. The sensor output is the ratio of the acceptor fluorescence intensity to the donor fluorescence intensity. Additionally, the sensor output serves as an internally calibrated ratiometric measurement that benefits from both the decrease in the donor emission and the increase in acceptor emission in the presence of energy transfer. We begin with a discussion of sensor A, the TF-TR to DNA-Cy5 FRET pair with a stoichiometric ratio TF-TR:DNA-Cy5 = 1:1 (Fig. 1A and 3). The fluorescence spectra vary with PRG addition (from 0 to 10 μM) (Fig. 3B), with a resulting change in the ratio between the acceptor and donor emission (FA/FD). Specifically, with increasing concentrations of PRG, FA decreases while FD increases (i.e., the FA/FD ratio decreases) indicating unbinding of the DNA from the TF in the presence of PRG (Fig. 3D).
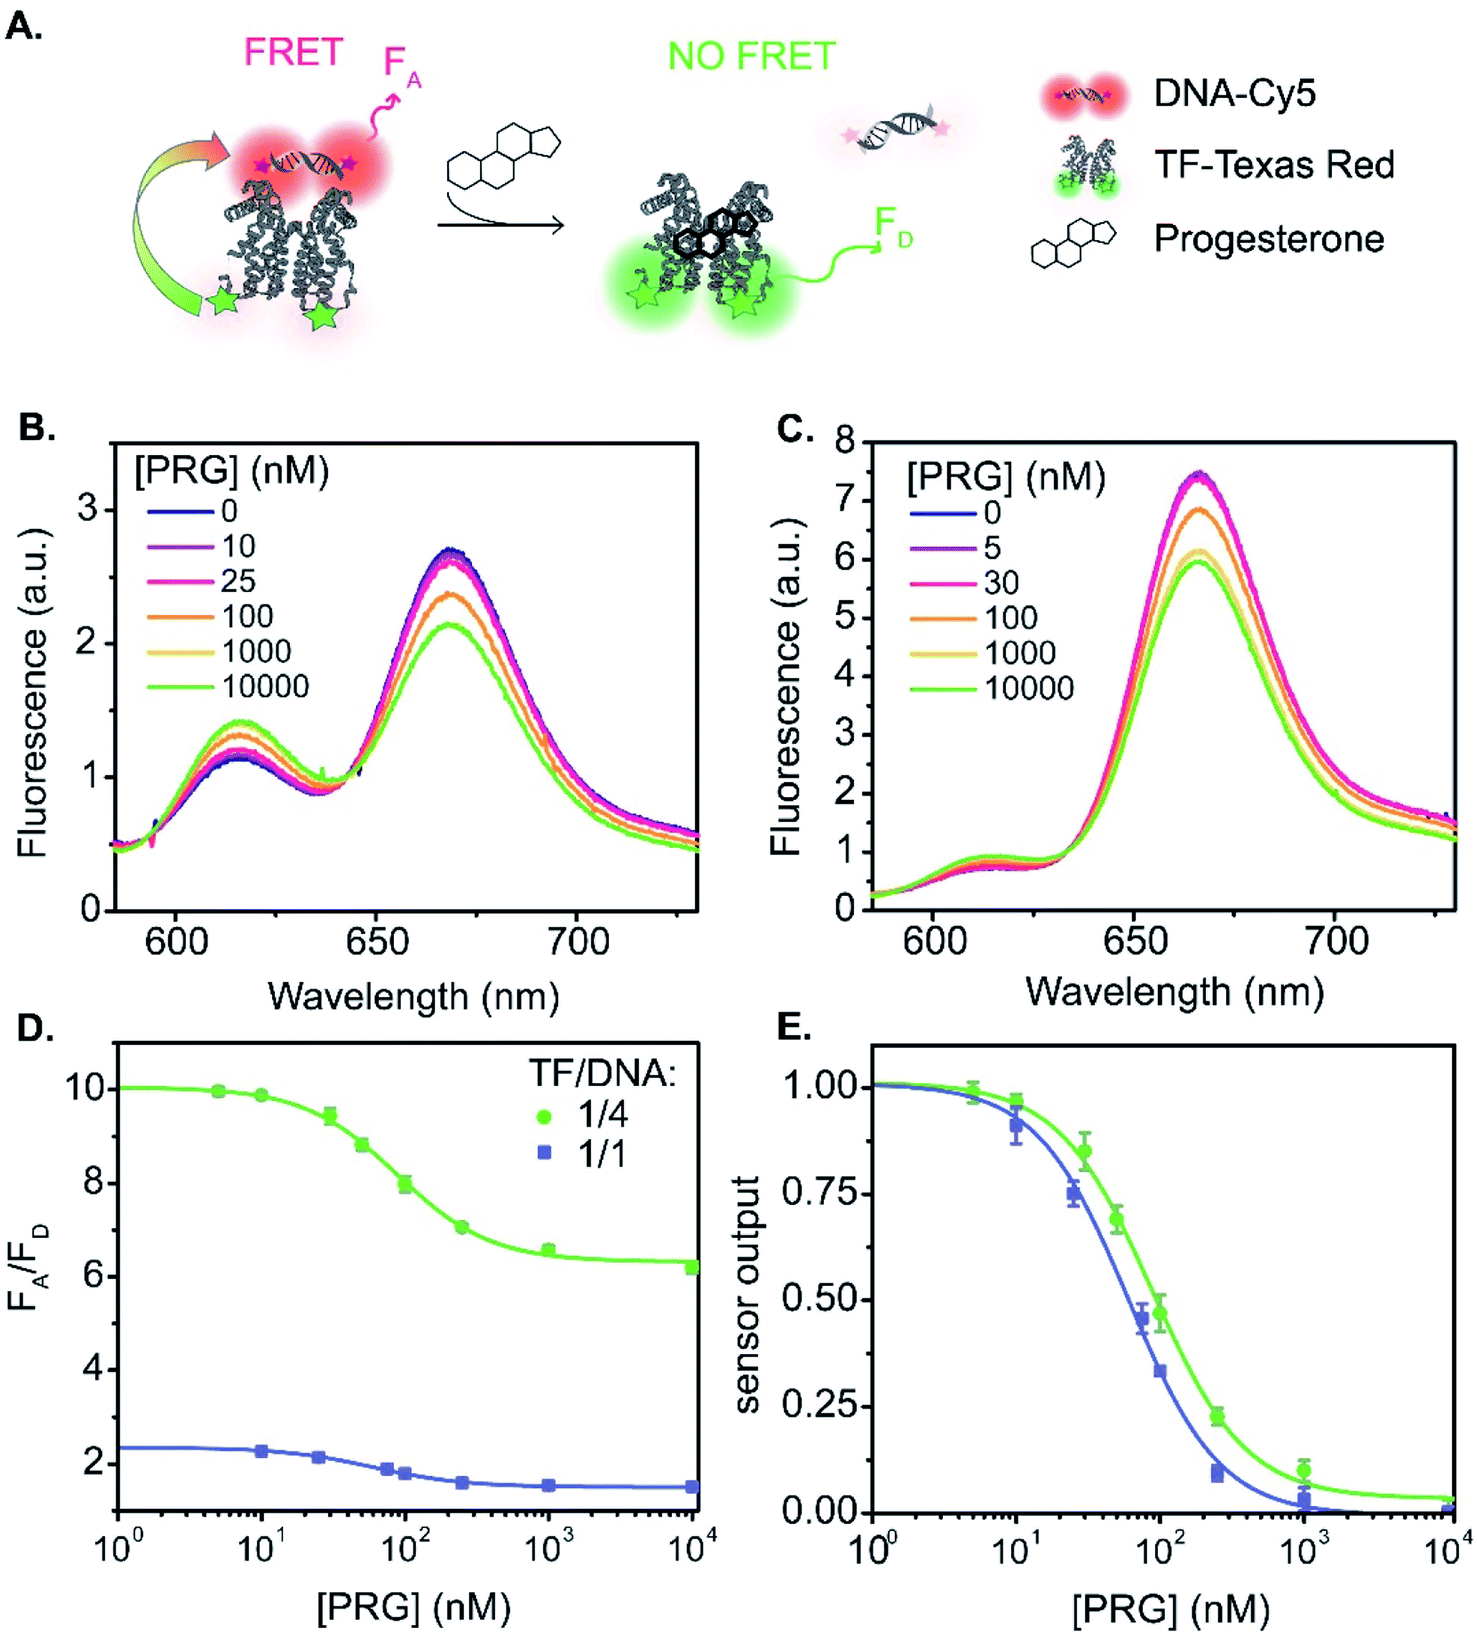 | ||
| Fig. 3 TF-TR and DNA1-Cy5 biosensor A. (A) Biosensor schematic: without PRG the DNA is bound to the TF and FRET occurs from TF-TR to DNA-Cy5. With PRG, DNA unbinds the TF and no more FRET is possible. (B) and (C) Fluorescence spectra (λexc = 550 nm) of the sensor normalized at the isosbestic point, upon addition of PRG from 0 to 10 μM ((B) TF-TR:DNA1-Cy5 = 1:1 – λiso = 642 nm, (C) TF-TR:DNA1-Cy5 = 1:4 – λiso = 633 nm). (D) and (E) Raw (D) and normalized (E) dose–response curves of the sensor for 2 different configurations (TF-TR:DNA1-Cy5 = 1:1 and TF-TR:DNA1-Cy5 = 1:4). Data are mean ± standard deviation of n = 3. For an easier visual comparison of the different curves, the sensor outputs in (E) are normalized between 0 and 1 (ESI eqn S(2)†) but the biosensor parameters are calculated based on the raw data. | ||
Increasing the ratio of TF-TR:DNA1-Cy5 from 1:1 to 1:4 does not significantly change the FRET efficiency of the system (Fig. 1) but does increase the range of FA/FD values over the titration (Fig. 3D). Interestingly, the higher FA/FD does not significantly change the normalized pool standard deviation of the fluorescent biosensor (Table 3 and ESI eqn (S4)†). We suspect that above a ratio of 1:1, adding more acceptors (i.e., DNA-Cy5) does not improve biosensor performance (FRET efficiency and standard deviation) because it only adds to the background signal from the excess unbound DNA-Cy5 (due to the direct excitation of the acceptor).
| Donor | Acceptor | DNA | A/Da | DNA/TF | [TF]b (nM) | E max (%) | IC50d (nM) | p (slope) | LODe (nM) | LOD 95% ICe (nM) | |σtest|f | DRg (nM) |
|---|---|---|---|---|---|---|---|---|---|---|---|---|
| a Stoichiometric ratio of the acceptor to the donor in the biosensor. b TF concentration used in the assay. c Maximum FRET efficiency of the FRET pair. d Half maximal inhibitory concentration (IC50) and slope (p) of the fitted dose–response curve using a Hill function (ESI eqn (S6)). e Limit of detection calculated using ESI eqn (S8) and 95% confidence interval of the IC50. f Normalized pool standard deviation for all test samples in the dilution series, calculated using the normalized dose–response curves. g Sensor dynamic range. | ||||||||||||
| TF-TR | DNA-Cy5 | DNA1 | 1:1 |
1:1 |
25 | 51 | 64 ± 5 | 1.40 | 13 | [9; 18] | 0.036 | 13–290 |
| DNA1 | 4:1 |
4:1 |
25 | 51 | 91 ± 7 | 1.40 | 20 | [16; 25] | 0.032 | 19–595 | ||
| DNA2 | 1:1 |
1:1 |
25 | 45 | 57 ± 6 | 1.43 | 18 | [13; 23] | 0.038 | 10–476 | ||
| DNA2 | 4:1 |
4:1 |
25 | 45 | 69 ± 3 | 1.65 | 12 | [8; 15] | 0.015 | 20–284 | ||
| DNA-TR | TF-Cy5 | DNA1 | 1:1 |
1:1 |
25 | 46 | 236 ± 27 | 1.08 | 44 | [31; 57] | 0.040 | 40–2192 |
| DNA1 | 4:1 |
1:4 |
100 | 46 | 196 ± 11 | 2.04 | 64 | [51; 77] | 0.022 | 65–809 | ||
| DNA2 | 1:1 |
1:1 |
25 | 45 | 136 ± 22 | 1.37 | 76 | [57; 97] | 0.088 | 30–891 | ||
| DNA2 | 4:1 |
1:4 |
100 | 45 | 163 ± 14 | 1.18 | 24 | [16; 32] | 0.025 | 28–1482 | ||
| TF–QD | DNA-Cy5 | DNA1 | 16:1 |
4:1 |
100 | 24 | 768 ± 38 | 1.16 | 36 | [22; 49] | 0.013 | 69–3060 |
| DNA2 | 16:1 |
4:1 |
100 | 22 | 510 ± 19 | 1.26 | 25 | [14; 36] | 0.013 | 66–2520 | ||
| DNA–QD | TF-Cy5 | DNA1 | 18:1 |
1:1 |
450 | 19 | 435 ± 97 | 1.42 | 310 | [210; 442] | 0.117 | 87–1200 |
| DNA2 | 18:1 |
1:1 |
450 | — | 314 ± 63 | 1.27 | 77 | [46; 125] | 0.052 | 45–1537 | ||
Fitting the raw dose–response curves to a Hill function (eqn S(1)†), yields a slightly lower IC50 (Table 3 and Fig. 3E) for the TF-TR:DNA1-Cy5 = 1:1 (64 ± 5 nM) compared to the ratio TF-TR:DNA1-Cy5 = 1:4 (91 ± 7 nM). The limit of detection (LOD, ESI eqn (S5)† and Table 3) is 13 and 20 nM of PRG in solution for the 1:1 and 1:4 ratios, respectively.
Next, we analyzed the flipped fluorophore sensor, i.e., system B composed of DNA-TR to TF-Cy5 (Fig. 1B and 4). The maximum FRET efficiency is of the same order of magnitude (E ∼ 45–50%) as the first system. Similarly, upon addition of PRG (from 0 to 10 μM), the FA/FD signal decreases due to the unbinding of DNA from TF and the loss of energy transfer.
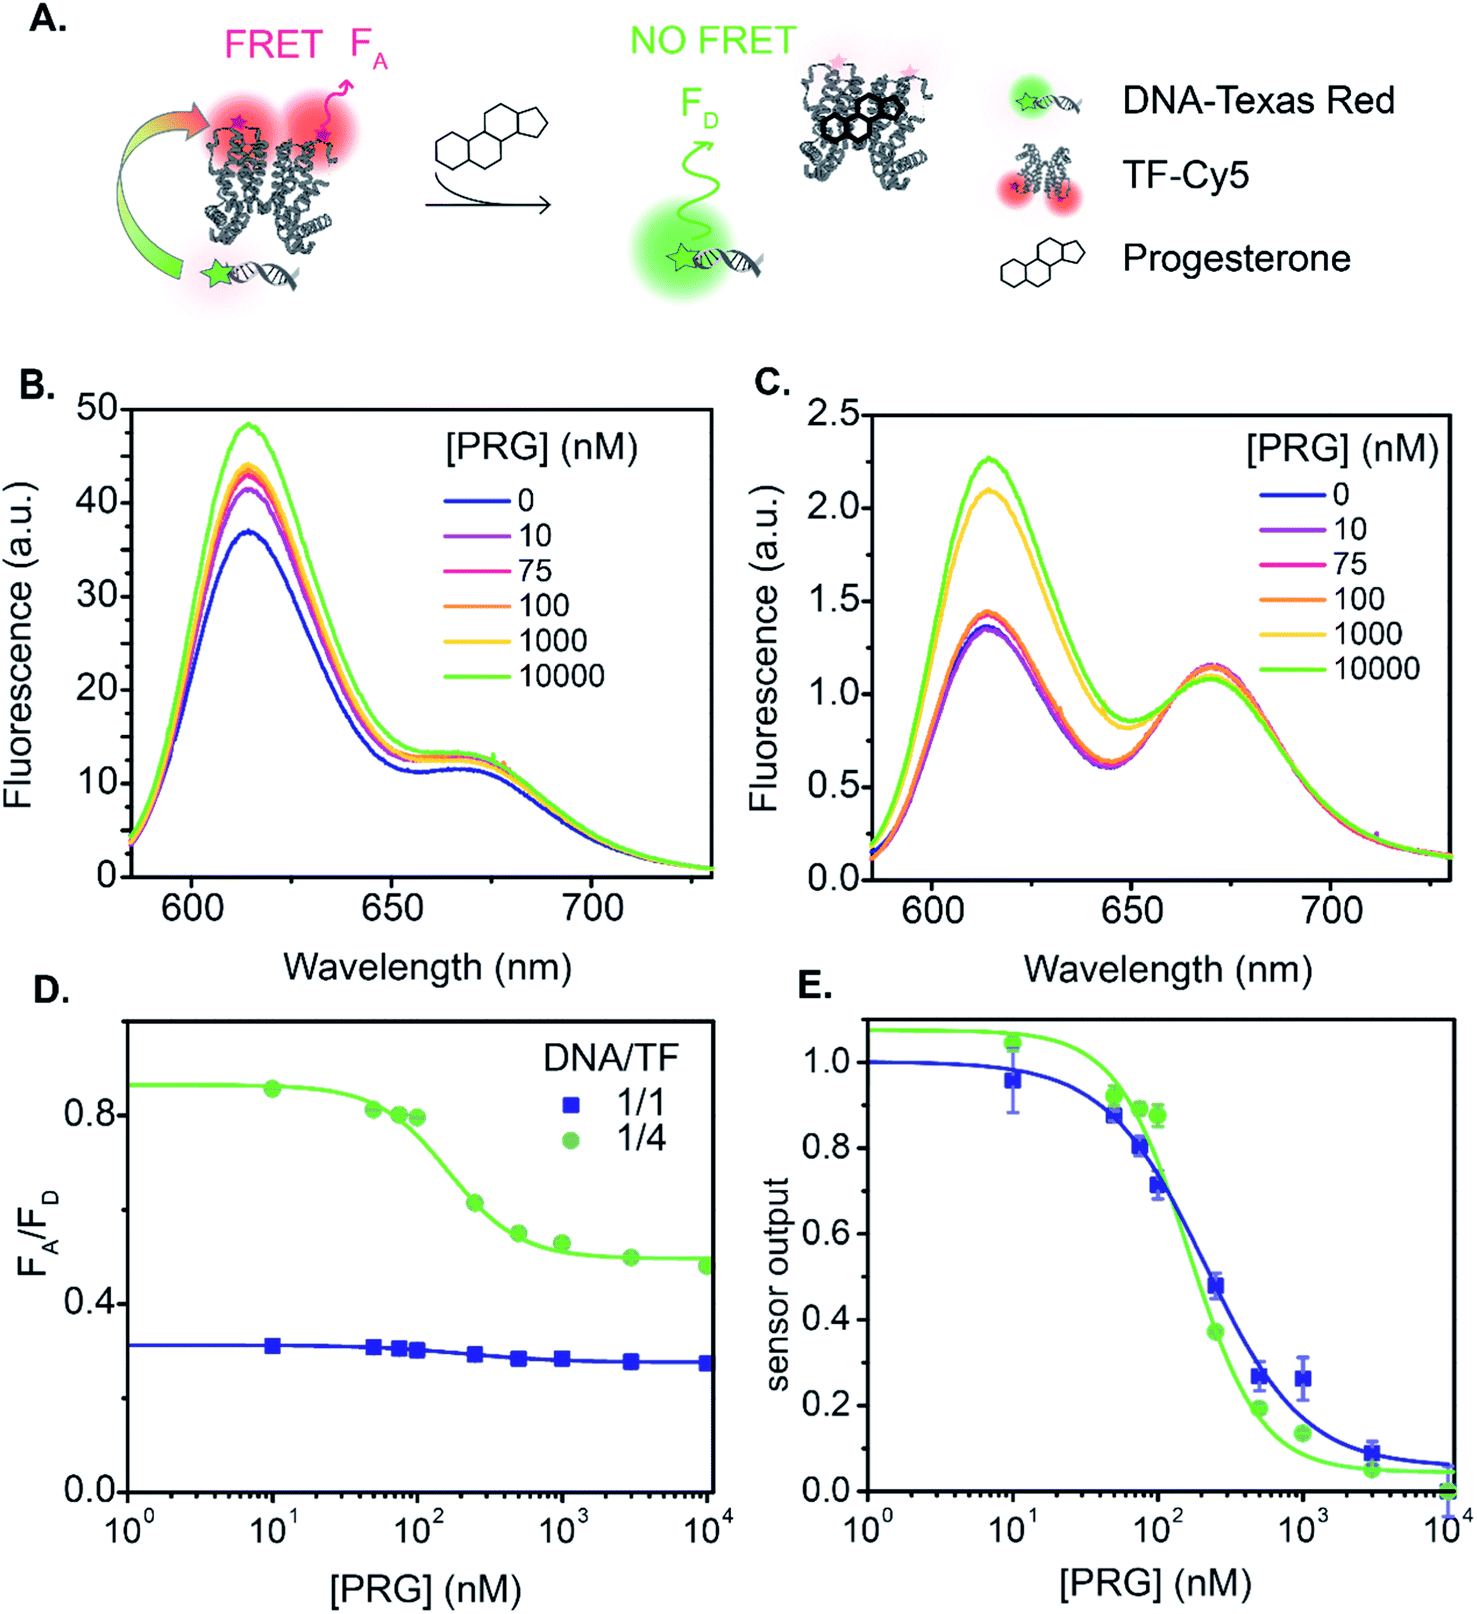 | ||
| Fig. 4 DNA1-TR to TF-Cy5 FRET sensor. (A) Biosensor schematic. (B) and (C) Fluorescence emission (λexc = 550 nm) spectra normalized at the isosbestic point upon PRG addition with a ratio of DNA1-TR:TF-Cy5 = 1:1 ((B) λiso = 728 nm) and =1:4 ((C) λiso = 661 nm). (D) and (E) are the raw and normalized dose–response curve upon PRG addition, respectively. Data are mean ± standard deviation of n = 3. | ||
In sensor system B, increasing the ratio of DNA1-TR to TF-Cy5 (i.e., number of acceptors) from 1:1 to 1:4 increases the FRET efficiency from 7 to 37% (lifetime measurement, Fig. 1, S7 and Table S3†). The addition of extra acceptors favors the binding of acceptors to the donors thus decreasing the concentration of unbound donors and increasing FRET efficiency. In this sensor design, the TF-Cy5 acts more as a quenching acceptor than a fluorescent dye (TF-Cy5 QY = 9%, Table 1), and its fluorescence does not change substantially upon PRG addition (Fig. 4B and C). As before, increasing the ratio of TF-Cy5 to DNA-TR also increases the amplitude of FA/FD and decreases the normalized pool standard deviation of the assay by a factor 2 (Table 3). The IC50 of the DNA1-TR:TF-Cy5 1:1 sensor is 236 ± 27 nM, while it is 196 ± 11 nM for the 1:4 biosensor. Increasing the relative amount of TF does not significantly change the IC50 of the sensor. Between sensor designs A and B, A exhibits a lower LOD.
In both sensors A and B, a control experiment using a scrambled DNA (Fig. S8 and S10†) shows some change in the sensor output. The amplitude of FA/FD for sensors A and B using the scrambled DNA is 19% and 14% of the amplitude of the corresponding sensor using DNA1, respectively. Upon addition of PRG, allosteric changes in the TF configuration may alter the relative position of the dyes on the protein. Given that the protein dimerizes with the dyes facing each other, a subtle conformational change could consequently change the interaction between the TF-bound dyes and their fluorescence. Notably, sensor A exhibits a slight increase in FA/FD when PRG is titrated to the scrambled DNA sensor, while sensor B exhibits a minimal decrease in FA/FD. That the sensors respond in opposite ways could support the hypothesis that allosteric changes impact the dye on the TF, causing this DNA-sequence independent response. We do not see this behavior using the QDs as a donor, discussed below, as the TF modification has no impact on the QD configuration.
Transitioning the sensor design from a dye-to-dye FRET pair to a nanoparticle-dye FRET pair in C and D results in two major design differences: (i) the overall hydrodynamic diameter of the biosensor and donor to acceptor distance increases; and (ii) the multivalent nanoparticle system provides a donor with multiple binding sites (i.e., TF or DNA) instead of the stoichiometrically limited dye–dye systems. In order to compare with the above fluorophore biosensors A and B, we decorated the QDs with an average of 4 TFs per QD and incubated them with a 16-fold molar excess of DNA-Cy5 (TF–QD:DNA-Cy5; 4–1:16; i.e., TF:DNA = 1:4) (Fig. 5A). Similar to the dye system, upon PRG titration from 0 to 10 μM, the donor fluorescence (TF–QD) increases while the acceptor fluorescence (DNA-Cy5) decreases, consistent with unbinding of the DNA from the TF. The IC50 is 768 ± 38 nM, calculated from the dose–response curve, which is almost eight times greater than the value determined from the similar dye system (TF-TR to DNA-Cy5 IC50 = 91 ± 7 nM for a TF:DNA ratio of 1:4). In the dye pair, the TF concentration in the sensor is the same as the sensor concentration ([TF] = 25 nM), while in the QD-based system the TF concentration is four times higher, i.e., [TF] = 100 nM. The higher concentration of TFs, meaning a higher concentration of analyte binding sites increases the IC50.3 Using the same ratio of TFs, donor fluorophores, and DNA strands as used in sensors A and B (i.e., TF–QD:DNA-Cy5 = 1–1:1 or 1–1:4) is not practical because the FRET efficiency is too low when the low number of TFs leaves many TF-free QDs present in the solution. However, with the higher ratio of TFs ensuring that most QDs are active sensors, the QD–TF:DNA-Cy5 system is analyte responsive and very bright, resulting in a small normalized pool standard deviation for this QD-based biosensor (Table 3). The combination of a small LOD (LOD = 36 nM) and high IC50 value results in a biosensor with a wide dynamic range (69 nM to 3060 nM).
 | ||
| Fig. 5 (A) TF–QD to DNA1-Cy5 (TF/QD/DNA:4/1/16) and (B) DNA1–QD to TF-Cy5 (DNA/QD/TF:18/1/18) FRET pairs. From left to right: scheme of the sensor, fluorescence emission spectra (λexc = 400 nm) normalized at the isobestic point ((A) λiso = 645 nm; (B) λiso = 650 nm) of the sensor upon PRG addition from 0 to 10 μM, normalized dose–response curve of the sensor. Data are mean ± standard deviation of n = 3. | ||
The flipped nanoparticle biosensor system D composed of DNA–QD mixed with TF-Cy5 (DNA–QD:TF; 18:1:18, Fig. 5B) exhibits very weak fluorescence change upon PRG addition, yielding a dose–response curve with large standard deviations (Table 3). We determined an IC50 of 435 ± 97 nM from the data. Compared to the previous biosensor systems, this IC50 value is higher than the one obtained using the dye pair B DNA-TR:TF-Cy5; 1:1 (IC50 = 236 ± 27 nM) but lower than the symmetric QD system TF–QD:DNA-Cy5; 4–1:16 (IC50 = 768 ± 38 nM). Due to the weak fluorescence change upon PRG addition, the pooled standard deviation of this assay is larger than in the other biosensors and thus the LOD is the highest (LOD = 310 nM). The poor performance of this sensor design compared to the others may indicate that longer oligos on the QD are needed to ensure effective TF–DNA binding or that the orientation of the TF–DNA binding pairs on the surface of the QD in this configuration increase the donor–acceptor distance to a point that significantly hinders the energy transfer efficiency and sensor output. Another possibility for this poorer performance is that the TF (analyte-binding site) is located on the acceptor dye. Since this FRET-biosensor is based on an equilibrium between bound and free biomacromolecules (DNA and TF), biosensor output requires the analyte to bind the TF bound on the DNA–QD. Upon PRG titration, it might be more favorable to bind free TF-Cy5 in solution than TF-Cy5 bound to the DNA–QD due to steric hindrance. Binding free TF is useless from a sensing standpoint in this design. Moreover, with 18 DNA per QD on average, it is likely that substantial PRG binding must occur to afford a significant number of TF-Cy5 to unbind the DNA–QD and, thus, observe a change in fluorescence.
When comparing the four FRET biosensor design and resulting performances, we conclude that: (i) for a given dye or QD system, lower IC50 and LOD are obtained when the TF is bound to the acceptor dye, as such a design minimizes its concentration in solution (i.e., configurations A and C), and (ii) the broader dynamic range obtained with the TF–QD sensor arises due to the multiple TF binding sites per donor QD.
Expanding the biosensor with another DNA sequence
Given that reducing the binding affinity between the TF and the DNA increases sensitivity and reduces the IC50 value,25 we repeated the above studies using a DNA sequence possessing a lower affinity for the TF (DNA2, Table S2†) to determine the impact on both IC50 and LOD of the biosensors.3 From biolayer interferometry (BLI) experiments, the equilibrium constant Kd for PRG and DNA1:TF and DNA2:TF, are 4.5 nM and 7.1 nM, respectively. The FRET efficiency for all four biosensor remains essentially unchanged (Fig. 1 and Table 2). Overall, for all biosensors, replacement of DNA1 with DNA2 slightly decreases the IC50 and LOD (Table 3 and Fig. 6, S9, S11–S13†). Similar outcomes and trends are observed with DNA2 like with DNA1 including: (i) the TF-donor and DNA-acceptor systems (biosensors A and C) exhibit a lower LOD, and (ii) biosensors using dyes possess a lower IC50 than QD-based biosensors. Of the biosensors, the TF-TR:DNA2-Cy5; 1:1 and 1:4 exhibit LODs of 18 nM and 12 nM, respectively. This LOD is in the range required for detection of progesterone in female urine (3–20 nM).44 In comparison, using the TF–QD:DNA2-Cy5 = 4–1:16 gives an LOD of 25 nM.
 | ||
| Fig. 6 Dose–response curves of the different systems (A) through (D) with DNA2 for a ratio of donor to acceptor =1:1 or 1:4. Data are mean ± standard deviation of n = 3. | ||
Conclusion
Improving the limit of detection and dynamic range of biosensors as well as expanding the analytes to be sensed has been and continues to be a priority for both academic and industry research programs, with substantial efforts focused on optimization of the biomolecular recognition parts.45–48 Few studies discuss the importance of selecting the fluorophore in a FRET-based biosensor i.e., organic fluorophore vs. inorganic nanoparticle (QD).27 To our knowledge, this is the first report of a comprehensive QD vs. dye comparative study, which assesses the type and position of the fluorophore, FRET efficiency, and biosensor response (LOD and dynamic range). Below we summarize the following main conclusions and broader implications from this systematic study on inter-molecular biosensors using FRET-based conformational regulation:FRET efficiency
Of the sensors compared, those using fluorescent proteins13 and dyes as the donor/acceptor achieve the highest FRET efficiency. In this FRET biosensor configuration, the dyes are closer to each other than in the QD-dye system, although the QD can bind multiple acceptors. A traditional CdSe-based QD with emission wavelengths comparable to TR was chosen for the purpose of comparing the different FRET systems in this report. However, a variety of considerations are relevant when designing QDs for use in FRET sensing. Two of our previous reports discuss the effect of QY as well as core and shell composition and morphology on energy transfer efficiency in the context of QD-dye and QD–QD FRET.43,49 Generally, the FRET efficiency of QD-donor FRET sensors can be improved by decreasing QD size. Choosing a different QD semiconductor material (e.g., InP) or surface coating (e.g., small ligands vs. polymers) can improve the FRET efficiency of the QD-based sensors provided that the QD QY is commensurate.A high FRET efficiency provides substantial quenching of the donor fluorescence upon analyte titration. However, the quantum yield (QY) of the acceptor is also important as a larger QY will ensure that more of that transferred energy is emitted as acceptor fluorescence. These components work in tandem to generate a greater ratiometric fluorescence response, i.e., a larger change in the sensor response (FA/FD).
Brightness
Due to their very large molar extinction coefficients, the QDs are almost ten times brighter than the Texas Red-labelled biomacromolecules (Table 1). Consequently, QD-based biosensors can produce the same amount of photoluminescent signal at a concentration 10 times lower than the dyes. The IC50 values of antibodies and TF-based biosensors directly correlate to the concentration of binding sites in solution.28,32,50 As such, QDs may enable lower concentrations of the TF or recognition biomolecule to be used, and reduce the LOD of the biosensor.Position of the dye
To keep the concentration of the recognition biomolecule (e.g., TF) at a minimum, while increasing the binding biomolecule (in this case, DNA), we recommend labeling the recognition biomolecule with the donor dye. The acceptor should be attached to the biomacromolecule for which the concentration in solution does not affect the sensor performance.32Cooperative binding & dynamic range
Multiple binding sites on the QD increase the dynamic range of the sensor, with the caveat that the binding sites must remain accessible for optimal sensing performance.Stokes shift
QDs exhibit a large Stokes compared to dyes. When designing a cost-effective device, this attribute is advantageous as it is easier to filter the excitation light from the fluorescence. QD-based biosensors are also amenable to multiplexing and detecting multiple analytes in parallel as a single UV light source will excite different QDs. The photoluminescence spectrum of the QD is also narrow and symmetric as opposed to the organic dye fluorescence spectra. Once again, isolation of the fluorescence spectra of the QD donor and dye acceptor is easier than a dye donor to a dye acceptor.Chemistry and toxicity
Dyes are chemically distinct small molecules with well characterized photophysical properties. As discussed, FRET efficiency is higher with the dyes than with the QDs, even with multiple acceptors attached to the QDs. Further, the conjugation of biomacromolecules (e.g., TF or DNA) with dyes is easier, more reproducible, and amenable to standard characterization methods, as compared to nanoparticles. From a translational perspective, the dye systems involve known and well-practiced preparation methods. With the dyes, the fluorophore is covalently attached to the biomacromolecule, while non-covalent self-assembly based bioconjugation methods may be used with the nanoparticles.30 Consequently, nanoparticle biosensors may be less stable in highly diluted conditions. Dyes are, in general, less toxic than conventional QDs composed of heavy metals such as cadmium.51From a FRET-based biosensor perspective, organic fluorophores and inorganic QDs both possess advantages and disadvantages, and one sensor system is not best for all applications. Fluorophore selection is application specific. Practically, the biomolecular recognition parts also dictate which fluorophore to use and how best to conjugate it to the sensor component. For TF–DNA based FRET biosensors, we recommend labeling the TF with the donor dye and the DNA with the acceptor, because the TF concentration should be kept minimal since it contains the analyte binding site (here PRG). The lessons learned herein will spur the development of brighter and more stable dyes, less toxic QDs, and new conjugation chemistries, as well as guide the development of new FRET based biosensors via careful consideration of the fluorophore choice in the design phase. Finally, be agnostic with regards to fluorophore selection and focus on your application (LOD, dynamic range required …) for your biosensor design.
Experimental procedures
Chemicals
HEPES (4-(2-hydroxyethyl)-1-piperazineethanesulfonic acid), sodium bicarbonate (NaHCO3) agarose, streptavidin agarose beads, isopropyl β-D-1-thiogalactopyranoside (IPTG) and ampicillin were obtained from Sigma-Aldrich. The polymer wrapping the QD was synthesized according to our previous study.28 Oligonucleotides were bought from IDT Technologies. SulfoCy5 maleimide was bought from Lumiprobe, while Texas Red maleimide was bought from Vector Laboratories. HEPES 1× is a solution of 25 mM of HEPES and 150 mM of NaCl, adjusted to pH 7.6.Protein expression
![[S with combining low line]](https://www.rsc.org/images/entities/char_0053_0332.gif)
![[C with combining low line]](https://www.rsc.org/images/entities/char_0043_0332.gif) WSHPQFQK. Then, the codon-optimized version of TF-SH was ordered from IDT as a GeneBlock fragment, with 5′-EcoRV and 3′-KpnI restriction sites added to each end. The TF-SH fragment was ligated into EcoRV and KpnI-digested pETDuet-1 (Novagen) to create the expression plasmid pET-TF-SH. To begin the protein induction process, pET-TF-SH was transformed into Rosetta 2(DE3)pLysS chemically-competent cells (Novagen) and grown on LB agar, under ampicillin and chloramphenicol selections and 0.4% glucose repression overnight at 37 °C. Then, an overnight 10 mL starter culture grown from single colony transformants (1× LB + amp + chloramphenicol + 0.4% glucose) was diluted into 1 L of fresh media and re-grown to mid-log phase at 37 °C. At an OD600 of approximately 0.6, protein expression was induced by adding IPTG at 1 mM final, and the flask was transferred to a 25 °C shaker and induced for 4 h. Culture was then pelleted by centrifugation and frozen at −80 °C until further need. Protein was purified using a Strep-Tactin resin (Qiagen). Cells (10 mL) were lysed by adding lysozyme at 0.1 mg mL−1 final. 40 mL of PBS were added to the solution to decrease its viscosity, and the mixture was incubated on ice 60 min and then centrifuged. The supernatant was loaded on the Strep-Tactin column and eluted with desthiobiotin-buffer (from supplier). The purity of the protein is evaluated by an SDS-PAGE gel stained with Instant Blue (Expedeon).
WSHPQFQK. Then, the codon-optimized version of TF-SH was ordered from IDT as a GeneBlock fragment, with 5′-EcoRV and 3′-KpnI restriction sites added to each end. The TF-SH fragment was ligated into EcoRV and KpnI-digested pETDuet-1 (Novagen) to create the expression plasmid pET-TF-SH. To begin the protein induction process, pET-TF-SH was transformed into Rosetta 2(DE3)pLysS chemically-competent cells (Novagen) and grown on LB agar, under ampicillin and chloramphenicol selections and 0.4% glucose repression overnight at 37 °C. Then, an overnight 10 mL starter culture grown from single colony transformants (1× LB + amp + chloramphenicol + 0.4% glucose) was diluted into 1 L of fresh media and re-grown to mid-log phase at 37 °C. At an OD600 of approximately 0.6, protein expression was induced by adding IPTG at 1 mM final, and the flask was transferred to a 25 °C shaker and induced for 4 h. Culture was then pelleted by centrifugation and frozen at −80 °C until further need. Protein was purified using a Strep-Tactin resin (Qiagen). Cells (10 mL) were lysed by adding lysozyme at 0.1 mg mL−1 final. 40 mL of PBS were added to the solution to decrease its viscosity, and the mixture was incubated on ice 60 min and then centrifuged. The supernatant was loaded on the Strep-Tactin column and eluted with desthiobiotin-buffer (from supplier). The purity of the protein is evaluated by an SDS-PAGE gel stained with Instant Blue (Expedeon).
Protein labelling
Quantum dots
Oligonucleotides
Labelled and bare oligonucleotides were purchased from IDT Technologies. DNA-Cy5 are labelled with one Cy5 on each end (5′ and 3′) in order to increase the FRET efficiency and have more acceptors, while DNA-TR are only labelled on the 5′ end. Details of the different sequences and affinity regarding the TF are provided Tables S1 and S2.†Sensor assembly
:DNA = 1:1, 320 μL of TF at 0.15 μM in HEPES 1× with 1% BSA is mixed with 320 μL of DNA in HEPES 1×. After 30 min, 576 μL of HEPES 1× and 384 μL of 5× binding buffer are added to the mixture and incubated at RT for 15 min.
:DNA-Cy5 = 4–1:16:320 μL QDs at 0.15 μM in 1× HEPES with 1% BSA, were mixed with 320 μL SRTF1-his6 at 0.6 μM in 1× HEPES, at room temperature for 45 min. Double-stranded DNA labelled with a Cy5 fluorescent probe at the 3′ and 5′ ends (320 μL, 2.7 μM in 1× HEPES) was added to the mixture. After 30 min, 256 μL of 1× HEPES, and 384 μL of 5× binding buffer (25 mM MgCl2, 25% glycerol, and 250 mg L−1 Invitrogen™ UltraPure™ Salmon Sperm DNA in 0.1 M Tris–HCl) were added and the mixture incubated for 15 min at RT.
:TF-Cy5 = 20–1:18:320 μL of DNA–QD at 0.15 μM in HEPES 1× are mixed with 320 μL of SRTF1-Cy5 at 2.7 μM in HEPES 1× with 1% BSA. After 30 min, 576 μL of HEPES and 384 μL of 5× binding buffer were added to the mixture and incubated for 15 min at RT.
Characterization
:TF-Cy5 = 18:1:18 = 500 nM (DNA)–25 nM (QD):450 nM(TF-Cy5). Fluorescence measurements on dyes-based sensors were recorded on a Horiba Nanolog spectrofluorometer using the cuvette holder. 150 μL of the sensor (QD/TF/DNA) was split in 10 centrifuge tubes to which 30 μL of progesterone at the desired concentration is added (10 × 180 μL). A quartz microcuvette is filled with 180 μL of the sensor and the fluorescence measurement is performed 3 times by moving in and out and turning the cuvette in the holder. The fluorescence intensity was monitored from 585 to 730 nm with excitation at 550 nm. Ratiometric analysis using single wavelength point measurements of FA and FD was used to measure the dose–response curve. The sensor output is a normalization of FA and FD between [PRG] = 0 to 10 μM (see data analysis).
 | (1) |
 | (2) |
 | (3) |
Förster distance, R0, defined as the distance at which EFRET is 50%, is a function of the transition dipole orientation factor, κ2, donor QY, QD, overlap integral, and solvent refractive index, η:
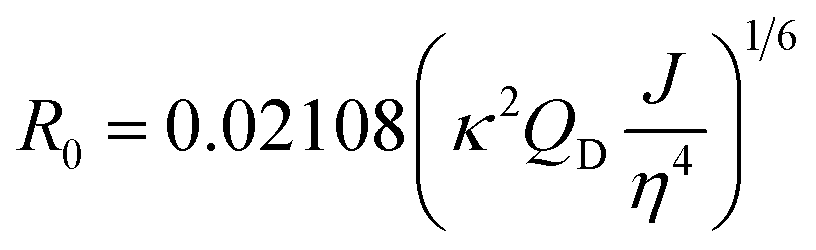 | (4) |
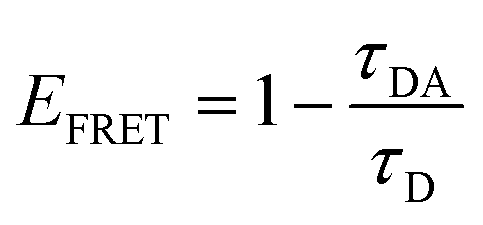
The transition dipole orientation has been assumed to be random, so κ2 has been set to 2/3 for all calculations. EFRET is experimentally determined by the degree of donor quenching using lifetime measurements:
 | (5) |
:acetonitrile = 1:1 with 0.1% TFA.
Simulations
In all cases, we begin with a simple TF–DNA binding model (Fig. 2), defined by a system of equations (eqn (6)–(11)) according to the law of mass action that dictates the rate of change in concentration for each species, reaction rates are described in Table S4.† The change in DNA concentration is described in the following equation: | (6) |
The change in TF monomer concentration is described in the following equation:
 | (7) |
The change in TF dimer concentration is governed by the following:
 | (8) |
The concentrations of DNAs with a monomer already bound to either half-site are governed by the following two equations:
 | (9) |
 | (10) |
Lastly, the concentration of dimer-bound DNA changes according to the following equation:
 | (11) |
To initialize each physical simulation, there are three items that are defined: a set of reaction rate constants that describe the speed of each transition, a matrix of the possible state transitions for a sensor, and a set of initial conditions denoting the starting concentration of each species. All reaction rates are effectively free parameters, except in cases where we replicate TF-dimer:DNA binding affinities that were experimentally determined. We assume that the measured TF:DNA binding affinities were determined for dimeric TF, and thus sweep across a set of TF-dimer:DNA binding equilibrium values. For each simulation, we use constants to scale down the affinities of TF monomer for unbound DNA, and TF monomer for DNA with a half-site bound; while the TF-dimerization affinity is constant across applicable simulations. All rates and scaling constants are described in Table S4.† In cases where dimerization is not included in the model, all reaction rates are scaled the same way, but reactions related to the dimerization are omitted from the transition matrix (i.e. those rate constants are set to 0).
The transition matrix consists of six rows, one for each species described in eqn (6)–(11), where each column gives the stoichiometry of the possible state transitions. In the TF-TR and TF-Cy5 configurations (A, B & D), there are six columns to describe the state transitions: TF monomer binding each half of unbound DNA (totaling two columns), TF monomer binding the other half of a monomer-bound DNA (totaling two columns), two TF monomers binding to form a dimer (one column), and TF dimer binding unbound DNA (one column). For the TF–QD configuration (C), the transitions related to dimerization are omitted, resulting in a 6 × 3 transition matrix. In this case, only the transitions for TF monomer binding each half of unbound DNA (two columns) and TF dimer binding unbound DNA (one column) are included.
The initial concentrations of each species are set based on the sensor configuration. In configurations A & B (TF-TR and DNA-TR), the donor is held constant at 167 nM as in the experiments, while we sweep across a range of acceptor concentrations, and TF-dimer:DNA binding affinities. When TF-Cy5 is the acceptor it always begins as a monomer and is allowed to dimerize in solution, or on the DNA. To simulate the DNA–QD configuration (D), we begin with a DNA concentration 18 times the QD ratio based on the experiments shown in Fig. 1, treating the simulation as if all the QD-bound DNA were in solution. The TF–QD simulation is different in that we assume TF units bound to the QD are immobilized and unable to dimerize in solution or on DNA. Therefore we take the arbitrary dimerization rate from Table S4,† a starting concentration of TF monomer that is 4 times the donor concentration (in accordance with the TF:QD ratio), and use those to approximate the ratio of TF monomer:dimer in solution. That ratio is used to scale the starting concentration of monomer and dimer for the simulation. In all cases, simulations run until equilibrium is achieved, and we calculate the proportion of donors bound by at least one acceptor.
Once the proportion of bound donors has been determined, we scale this to a FRET signal by multiplying by the FRET efficiency of a given species according to the following equation:
 | (12) |
:donor ratio of a species, and r is the actual distance between donor and acceptor fluorophores. In all cases, we use experimental FRET parameters to determine R0 as in the following equation (see eqn (4)):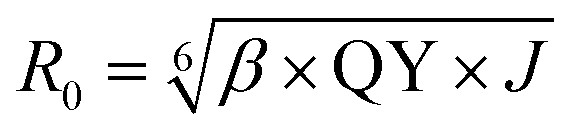 | (13) |
All parameters for each FRET species are shown in Table S5,† along with their corresponding FRET efficiencies they produce. When calculating R0, we again assume that the experimental FRET parameters in Table 2 are determined for primarily dimeric TF. This is important as dimeric TF appears to lower the Qy of the donor in TF-TR. Thus, for bound TF-TR monomers in configuration A, we substitute Qy of DNA-TR, while keeping J the same. Conversely, in configuration B, the absorbance spectra of TF-Cy5 appears bimodal. We hypothesized that this was also due to differences between monomeric and dimeric TF-Cy5, and therefore substituted J of the TF-Cy5 monomer with that of DNA-Cy5. With QY, J, and n, all predetermined, r can be used to scale the output FRET signals such that the simulations of experimental DNA affinities saturate at a level similar to those in the experimental plots.
Our DNA–QD simulation (configuration D) functioned differently in regard to acceptor:donor ratios. While we still use the same QY and J as determined experimentally, we obtain the acceptor:donor ratio, n, by assuming TFs bound to DNAs on the QD are distributed according to a Poisson distribution, where the rate parameter, λ, is given by the expected value of TF monomers bound to a DNA at equilibrium.
For each DNA–QD simulation, we determine the proportion of QDs having different numbers of TF-Cy5 acceptors (![[p with combining right harpoon above (vector)]](https://www.rsc.org/images/entities/i_char_0070_20d1.gif) ), thus acceptor:donor ratios. We then convert these to a concentration of QDs with each acceptor:donor ratio in a given simulation by linear combination of with the concentration of bound DNAs. These concentrations of QD are then scaled by the FRET efficiency with each acceptor:donor ratio as in eqn (12).
), thus acceptor:donor ratios. We then convert these to a concentration of QDs with each acceptor:donor ratio in a given simulation by linear combination of with the concentration of bound DNAs. These concentrations of QD are then scaled by the FRET efficiency with each acceptor:donor ratio as in eqn (12).
Data availability
Data are found in the supporting information or available from the authors upon request.Author contributions
The manuscript was written through contributions of all authors. All authors have given approval to the final version of the manuscript.Funding sources
The authors recognize support and funding in part from NIH (U54EB015403, CK; CTSI 1KL2TR001411; R01GM129437, AMD, and R01EB029795, JG), DARPA (W911NF-16-C-0044, JG, MWG, CK, AMD), ONR (N00014-21-1-2433, JG), DoD Uniformed Services University (HU00011810022; MWG, JEG), BU Kilachand (JG), Clare Booth Luce Graduate Fellowship (MC), and Marie-Curie Fellowship from the European Union under the program H2020 (Grant 749973, CG). Research reported in this publication was supported by the Boston University Micro and Nano Imaging Facility and the Office of the Director, National Institutes of Health of the National Institutes of Health under Award Number S10OD024993. The content is solely the responsibility of the authors and does not necessarily represent the official views of the funders.Conflicts of interest
The authors are inventors on a patent filed and owned by Boston University describing the TF–DNA biosensor. The patent is available for licensing.Abbreviations
| Cy5 | cyanine 5 |
| E | FRET efficiency |
| IC50 | half maximal inhibitory concentration |
| LOD | limit of detection |
| QD | quantum dot |
| QY | quantum yield |
| R 0 | Förster radius |
| TF | allosteric transcription factor |
| TR | Texas Red |
References
- A. Turner, Biosensors: then and now, Trends Biotechnol., 2013, 31(3), 119–120 CrossRef CAS PubMed.
- G. Evtugyn, Biosensors: Essentials, Springer, 2014, vol. 84 Search PubMed.
- A. A. Mary and S. Aleksandr, Novel trends in affinity biosensors: current challenges and perspectives, Meas. Sci. Technol., 2014, 25(3), 032001 CrossRef.
- C. Lertvachirapaiboon, A. Baba, K. Shinbo and K. Kato, A smartphone-based surface plasmon resonance platform, Anal. Methods, 2018, 10(39), 4732–4740 RSC.
- N. Arroyo-Currás, J. Somerson, P. A. Vieira, K. L. Ploense, T. E. Kippin and K. W. Plaxco, Real-time measurement of small molecules directly in awake, ambulatory animals, Proc. Natl. Acad. Sci. U. S. A., 2017, 114(4), 645–650 CrossRef PubMed.
- E. Petryayeva and W. R. Algar, Toward point-of-care diagnostics with consumer electronic devices: the expanding role of nanoparticles, RSC Adv., 2015, 5(28), 22256–22282 RSC.
- S. Pennathur and D. K. Fygenson, Improving fluorescence detection in lab on chip devices, Lab Chip, 2008, 8(5), 649–652 RSC.
- U. Resch-Genger, M. Grabolle, S. Cavaliere-Jaricot, R. Nitschke and T. Nann, Quantum dots versus organic dyes as fluorescent labels, Nat. Methods, 2008, 5(9), 763–775 CrossRef CAS PubMed.
- W. R. Algar, M. Massey, K. Rees, R. Higgins, K. D. Krause, G. H. Darwish, W. J. Peveler, Z. Xiao, H.-Y. Tsai, R. Gupta, K. Lix, M. V. Tran and H. Kim, Photoluminescent Nanoparticles for Chemical and Biological Analysis and Imaging, Chem. Rev., 2021, 121(15), 9243–9358 CrossRef CAS PubMed.
- Förster Theory, in FRET – Förster Resonance Energy Transfer, ed. I. L. Medintz and N. Hildebrandt, Wiley-VCH, 2013, pp. 23–62 Search PubMed.
- W. R. Algar, N. Hildebrandt, S. S. Vogel and I. L. Medintz, FRET as a biomolecular research tool — understanding its potential while avoiding pitfalls, Nat. Methods, 2019, 16(9), 815–829 CrossRef CAS PubMed.
- X. Zhang, Y. Hu, X. Yang, Y. Tang, S. Han, A. Kang, H. Deng, Y. Chi, D. Zhu and Y. Lu, FÖrster resonance energy transfer (FRET)-based biosensors for biological applications, Biosens. Bioelectron., 2019, 138, 111314 CrossRef CAS PubMed.
- T. T. Nguyen, M. Chern, R. C. Baer, J. Galagan and A. M. Dennis, A Förster Resonance Energy Transfer-Based Ratiometric Sensor with the Allosteric Transcription Factor TetR, Small, 2020, 16(17), 1907522 CrossRef CAS PubMed.
- S. Umrao, S. Anusha, V. Jain, B. Chakraborty and R. Roy, Smartphone-based kanamycin sensing with ratiometric FRET, RSC Adv., 2019, 9(11), 6143–6151 RSC.
- H. Youn, K. Lee, J. Her, J. Jeon, J. Mok, J.-i. So, S. Shin and C. Ban, Aptasensor for multiplex detection of antibiotics based on FRET strategy combined with aptamer/graphene oxide complex, Sci. Rep., 2019, 9(1), 7659 CrossRef PubMed.
- L. Y. Chen, W. H. Tse, Y. Chen, M. W. McDonald, J. Melling and J. Zhang, Nanostructured biosensor for detecting glucose in tear by applying fluorescence resonance energy transfer quenching mechanism, Biosens. Bioelectron., 2017, 91, 393–399 CrossRef CAS PubMed.
- N. C. Surdo, M. Berrera, A. Koschinski, M. Brescia, M. R. Machado, C. Carr, P. Wright, J. Gorelik, S. Morotti, E. Grandi, D. M. Bers, S. Pantano and M. Zaccolo, FRET biosensor uncovers cAMP nano-domains at β-adrenergic targets that dictate precise tuning of cardiac contractility, Nat. Commun., 2017, 8(1), 15031 CrossRef CAS PubMed.
- H. Li, L. Shi, D.-e. Sun, P. Li and Z. Liu, Fluorescence resonance energy transfer biosensor between upconverting nanoparticles and palladium nanoparticles for ultrasensitive CEA detection, Biosens. Bioelectron., 2016, 86, 791–798 CrossRef CAS PubMed.
- H. Li, X. Fang, H. Cao and J. Kong, Paper-based fluorescence resonance energy transfer assay for directly detecting nucleic acids and proteins, Biosens. Bioelectron., 2016, 80, 79–83 CrossRef CAS PubMed.
- N. Melnychuk and A. S. Klymchenko, DNA-Functionalized Dye-Loaded Polymeric Nanoparticles: Ultrabright FRET Platform for Amplified Detection of Nucleic Acids, J. Am. Chem. Soc., 2018, 140(34), 10856–10865 CrossRef CAS.
- B. R. Jin, S. R. Wang, M. Lin, Y. Jin, S. J. Zhang, X. Y. Cui, Y. Gong, A. Li, F. Xu and T. J. Lu, Upconversion nanoparticles based FRET aptasensor for rapid and ultrasensitive bacteria detection, Biosens. Bioelectron., 2017, 90, 525–533 CrossRef CAS PubMed.
- D. M. Jones and S. Padilla-Parra, The β-Lactamase Assay: Harnessing a FRET Biosensor to Analyse Viral Fusion Mechanisms, Sensors, 2016, 16(7), 950 CrossRef.
- R. Gupta, W. J. Peveler, K. Lix and W. R. Algar, Comparison of Semiconducting Polymer Dots and Semiconductor Quantum Dots for Smartphone-Based Fluorescence Assays, Anal. Chem., 2019, 91(17), 10955–10960 CrossRef CAS PubMed.
- M. Chern, P. M. Garden, R. C. Baer, J. E. Galagan and A. M. Dennis, Transcription Factor Based Small-Molecule Sensing with a Rapid Cell Phone Enabled Fluorescent Bead Assay, Angew. Chem., Int. Ed., 2020, 59(48), 21597–21602 CrossRef CAS PubMed.
- C. Grazon, R. C. Baer, U. Kuzmanović, T. Nguyen, M. Chen, M. Zamani, M. Chern, P. Aquino, X. Zhang, S. Lecommandoux, A. Fan, M. Cabodi, C. Klapperich, M. W. Grinstaff, A. M. Dennis and J. E. Galagan, A progesterone biosensor derived from microbial screening, Nat. Commun., 2020, 11(1), 1276 CrossRef CAS PubMed.
- R. Fernandez-López, R. Ruiz, F. de la Cruz and G. Moncalián, Transcription factor-based biosensors enlightened by the analyte, Front. Microb., 2015, 6, 648 Search PubMed.
- W. R. Algar, Heroes or Villains? How Nontraditional Luminescent Materials Do and Do Not Enhance Bioanalysis and Imaging, Chem. Mater., 2020, 32(12), 4863–4883 CrossRef CAS.
- C. Grazon, M. Chern, K. Ward, S. Lecommandoux, M. W. Grinstaff and A. M. Dennis, A versatile and accessible polymer coating for functionalizable zwitterionic quantum dots with high DNA grafting efficiency, Chem. Commun., 2019, 55(74), 11067–11070 RSC.
- M. Chern, C. Grazon and A. M. Dennis, Phase Transfer and DNA Functionalization of Quantum Dots Using an Easy-to-Prepare, Low-Cost Zwitterionic Polymer, in Quantum Dots. Applications in Biology, ed. F. Adriana and S. S. Beate, Humana Press, 2020, vol. 2135, pp. 125–139 Search PubMed.
- K. E. Sapsford, T. Pons, I. L. Medintz, S. Higashiya, F. M. Brunel, P. E. Dawson and H. Mattoussi, Kinetics of Metal-Affinity Driven Self-Assembly between Proteins or Peptides and CdSe–ZnS Quantum Dots, J. Phys. Chem. C, 2007, 111(31), 11528–11538 CrossRef CAS.
- T. Pons, I. L. Medintz, X. Wang, D. S. English and H. Mattoussi, Solution-Phase Single Quantum Dot Fluorescence Resonance Energy Transfer, J. Am. Chem. Soc., 2006, 128(47), 15324–15331 CrossRef CAS PubMed.
- J. Galagan, A. Dennis, C. Klapperich, M. Grinstaff, T. Nguyen, R. Baer, U. Kuzmanovic, M. Zamani, M. Chen, M. Chern and C. Grazon, Microbial-based biosensors, 2019 Search PubMed.
- J. A. Titus, R. Haugland, S. O. Sharrow and D. M. Segal, Texas Red, a hydrophilic, red-emitting flourophore for use with fluorescein in dual parameter flow microfluorometric and fluorescence microscopic studies, J. Immunol. Methods, 1982, 50(2), 193–204 CrossRef CAS PubMed.
- R. B. Mujumdar, L. A. Ernst, S. R. Mujumdar, C. J. Lewis and A. S. Waggoner, Cyanine dye labeling reagents: sulfoindocyanine succinimidyl esters, Bioconjugate Chem., 1993, 4(2), 105–111 CrossRef CAS PubMed.
- J. Kang, O. Kaczmarek, J. Liebscher and L. Dähne, Prevention of H-Aggregates Formation in Cy5 Labeled Macromolecules, Int. J. Polym. Sci., 2010, 2010, 264781 Search PubMed.
- H. v. Berlepsch and C. Böttcher, H-Aggregates of an Indocyanine Cy5 Dye: Transition from Strong to Weak Molecular Coupling, J. Phys. Chem. B, 2015, 119(35), 11900–11909 CrossRef PubMed.
- L. Cuthbertson and J. R. Nodwell, The TetR family of regulators, Microbiol. Mol. Biol. Rev., 2013, 77(3), 440–475 CrossRef CAS PubMed.
- For the J calculation, we assumed that the molar absorption coefficient of Cy5 monomer or Cy5 H-aggregates are the same.
- S. Kędracka-Krok and Z. Wasylewski, A differential scanning calorimetry study of tetracycline repressor, Eur. J. Biochem., 2003, 270(22), 4564–4573 CrossRef PubMed.
- J. R. Unruh, G. Gokulrangan, G. H. Lushington, C. K. Johnson and G. S. Wilson, Orientational Dynamics and Dye-DNA Interactions in a Dye-Labeled DNA Aptamer, Biophys. J., 2005, 88(5), 3455–3465 CrossRef CAS PubMed.
- M. Chern, J. C. Kays, S. Bhuckory and A. M. Dennis, Sensing with photoluminescent semiconductor quantum dots, Methods Appl. Fluoresc., 2019, 7(1), 012005 CrossRef CAS PubMed.
- N. Hildebrandt, C. M. Spillmann, W. R. Algar, T. Pons, M. H. Stewart, E. Oh, K. Susumu, S. A. Díaz, J. B. Delehanty and I. L. Medintz, Energy Transfer with Semiconductor Quantum Dot Bioconjugates: A Versatile Platform for Biosensing, Energy Harvesting, and Other Developing Applications, Chem. Rev., 2017, 117(2), 536–711 CrossRef CAS PubMed.
- M. Chern, T. T. Nguyen, A. H. Mahler and A. M. Dennis, Shell thickness effects on quantum dot brightness and energy transfer, Nanoscale, 2017, 9(42), 16446–16458 RSC.
- R. M. Gifford, F. Howie, K. Wilson, N. Johnston, T. Todisco, M. Crane, J. P. Greeves, K. Skorupskaite, D. R. Woods, R. M. Reynolds and R. A. Anderson, Confirmation of ovulation from urinary progesterone analysis: assessment of two automated assay platforms, Sci. Rep., 2018, 8(1), 17621 CrossRef PubMed.
- A. Vallée-Bélisle, F. Ricci and K. W. Plaxco, Engineering Biosensors with Extended, Narrowed, or Arbitrarily Edited Dynamic Range, J. Am. Chem. Soc., 2012, 134(6), 2876–2879 CrossRef PubMed.
- R. D. Fritz, M. Letzelter, A. Reimann, K. Martin, L. Fusco, L. Ritsma, B. Ponsioen, E. Fluri, S. Schulte-Merker, J. van Rheenen and O. Pertz, A Versatile Toolkit to Produce Sensitive FRET Biosensors to Visualize Signaling in Time and Space, Sci. Signaling, 2013, 6(285), rs12 CrossRef PubMed.
- D. Sevenler, J. Trueb and M. S. Ünlü, Beating the reaction limits of biosensor sensitivity with dynamic tracking of single binding events, Proc. Natl. Acad. Sci. U. S. A., 2019, 116(10), 4129–4134 CrossRef CAS PubMed.
- V. D’Ambrosio and M. K. Jensen, Lighting up yeast cell factories by transcription factor-based biosensors, FEMS Yeast Res., 2017, 17(7) DOI:10.1093/femsyr/fox076.
- M. Chern, R. Toufanian and A. M. Dennis, Quantum dot to quantum dot Förster resonance energy transfer: engineering materials for visual color change sensing, Analyst, 2020, 145(17), 5754–5767 RSC.
- L. Kokko, K. Sandberg, T. Lövgren and T. Soukka, Europium(III) chelate-dyed nanoparticles as donors in a homogeneous proximity-based immunoassay for estradiol, Anal. Chim. Acta, 2004, 503(2), 155–162 CrossRef CAS.
- F. M. Winnik and D. Maysinger, Quantum Dot Cytotoxicity and Ways to Reduce It, Acc. Chem. Res., 2013, 46(3), 672–680 CrossRef CAS PubMed.
Footnote |
| † Electronic supplementary information (ESI) available: List of oligonucleotides, MALDI-TOF and SDS-PAGE gels of TF, additional absorption and emission spectra of the different biosensors and fluorescent species, TEM images of QD, DNA–QD characterization, data analysis. See https://doi.org/10.1039/d1sc06921g |
| This journal is © The Royal Society of Chemistry 2022 |