
 Open Access Article
 This Open Access Article is licensed under a Creative Commons Attribution-Non Commercial 3.0 Unported Licence
Tuning the photophysical properties of lanthanide(III)/zinc(II) ‘encapsulated sandwich’ metallacrowns emitting in the near-infrared range†
Svetlana V.
Eliseeva‡
 *a,
Tu N.
Nguyen‡§
b,
Jeff W.
Kampf
b,
Evan R.
Trivedi¶
b,
Vincent L.
Pecoraro
*b and
Stéphane
Petoud
*a
*a,
Tu N.
Nguyen‡§
b,
Jeff W.
Kampf
b,
Evan R.
Trivedi¶
b,
Vincent L.
Pecoraro
*b and
Stéphane
Petoud
*a
aCentre de Biophysique Moléculaire, CNRS UPR 4301, F-45071 Orléans, Cedex 2, France. E-mail: svetlana.eliseeva@cnrs-orleans.fr; stephane.petoud@inserm.fr
bDepartment of Chemistry, Willard H. Dow Laboratories, University of Michigan, Ann Arbor, Michigan 48109, USA. E-mail: vlpec@umich.edu
First published on 3rd February 2022
Abstract
A family of Zn16Ln(HA)16 metallacrowns (MCs; Ln = YbIII, ErIII, and NdIII; HA = picoline- (picHA2−), pyrazine- (pyzHA2−), and quinaldine- (quinHA2−) hydroximates) with an ‘encapsulated sandwich’ structure possesses outstanding luminescence properties in the near-infrared (NIR) and suitability for cell imaging. Here, to decipher which parameters affect their functional and photophysical properties and how the nature of the hydroximate ligands can allow their fine tuning, we have completed this Zn16Ln(HA)16 family by synthesizing MCs with two new ligands, naphthyridine- (napHA2−) and quinoxaline- (quinoHA2−) hydroximates. Zn16Ln(napHA)16 and Zn16Ln(quinoHA)16 exhibit absorption bands extended into the visible range and efficiently sensitize the NIR emissions of YbIII, ErIII, and NdIII upon excitation up to 630 nm. The energies of the lowest singlet (S1), triplet (T1) and intra-ligand charge transfer (ILCT) states have been determined. LnIII-centered total (QLLn) and intrinsic (QLnLn) quantum yields, sensitization efficiencies (ηsens), observed (τobs) and radiative (τrad) luminescence lifetimes have been recorded and analyzed in the solid state and in CH3OH and CD3OD solutions for all Zn16Ln(HA)16. We found that, within the Zn16Ln(HA)16 family, τrad values are not constant for a particular LnIII. The close in energy positions of T1 and ILCT states in Zn16Ln(picHA)16 and Zn16Ln(quinHA)16 are preferred for the sensitization of LnIII NIR emission and ηsens values reach 100% for NdIII. Finally, the highest values of QLLn are observed for Zn16Ln(quinHA)16 in the solid state or in CD3OD solutions. With these data at hand, we are now capable of creating MCs with desired properties suitable for NIR optical imaging.
Introduction
The numerous advantages of non-invasive near-infrared (NIR) optical imaging for biological applications1–4 have stimulated significant advances in the creation of novel probes for cell, tissue and organ visualization. Among the different classes of NIR imaging probes,5,6 LnIII-based molecular compounds can offer complementary advantages,7 in particular, sharp emission bands with defined positions, large energy difference between excitation and emission wavelengths, and high photostability. Apart from biological applications, the NIR emission arising from LnIII complexes can be used in material sciences, telecommunications, light-emitting diodes, night vision displays, security inks, and solar energy conversion.8,9 However, for the design of highly NIR-emitting LnIII molecular compounds, several challenges have to be addressed.10,11 The emission efficiency of LnIII complexes is quantified by the following equation: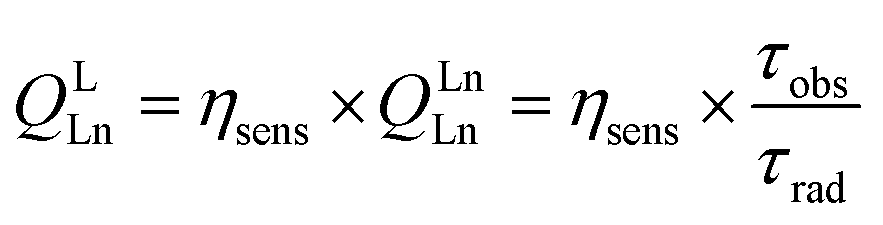 | (1) |
The first requirement to obtain high QLLn is to optimize energy migration processes, in particular ηsens. This parameter is mainly dependent on the nature of the organic ligands and the relative positions of their electronic levels (lowest singlet S1, triplet T1 or charge transfer (CT) states) with respect to the accepting levels of LnIII.10,11 In this respect, several phenomenological rules have been developed for visible-emitting LnIII complexes.12–15 On the other hand, no clear correlations have been established for coordination compounds incorporating NIR-emitting LnIII while the choice of chromophores is much wider and includes molecules absorbing light in the visible and the NIR ranges.16–20 A second important challenge is to minimize sources of non-radiative deactivation mechanisms (overtones of high-energy vibrations, CT states, back energy transfer processes) that decrease observed luminescence lifetimes and, in turn, the corresponding intrinsic quantum yields. Avoiding sources of non-radiative deactivation taking places through overtones of not only O–H and N–H, but also C–H vibrations that are widely present in complexes formed with organic ligands, is of particular importance for NIR-emitting LnIII because of the small energy gaps between the emitting and the receiving states. The most widely used strategy to overcome this limitation is by halogenation18,19,21–23 or by deuteration24–26 of the organic ligands. Another approach to minimize non-radiative deactivations is to create a protective hydrophobic environment around the LnIII ion as in the case of complexes formed with imidodiphosphonate ligands.27,28 In addition, according to eqn (1), one more parameter that can be tuned and that lead to the enhancement of QLLn is the radiative lifetime. The validity of this approach has been demonstrated in several studies.26,29–31
Recently, our group has pioneered a new approach toward the design of NIR-emitting LnIII complexes that take advantage of metallacrown (MC) scaffolds.32–38 MCs are a class of inorganic macrocycles forming repeating [metal–N–O] subunits.39 These MC complexes possess oxygen atoms oriented toward the center of the ring allowing an efficient pre-organization for cation encapsulation in a manner similar to classical organic crown ethers.
We created a family of NIR-emitting Zn16Ln(HA)16 MCs assembled using picoline- (picHA2−),33 pyrazine- (pyzHA2−),37 and quinaldine-(quinHA2−)32 hydroximate ligands (Fig. 1) and demonstrated their promising applications for NIR cell imaging.37,38 The unique ‘encapsulated sandwich’ structure of this family of MCs not only allows for highly efficient sensitization of the characteristic emissions from YbIII, NdIII and ErIII but also locates the luminescent LnIII ion at a relatively long distance (∼7 Å) from C–H oscillators present on the organic ligands, thereby minimizing the effect of non-radiative deactivation. We have demonstrated that the nature of the hydroxamate ligand affects not only the luminescence but also the functional properties, such as the water solubility obtained for MCs formed with the pyzHA2− chromophoric building-block. However, the absorption maxima of all previously reported Zn16Ln(HA)16 MCs have remained in the UV range. An excitation light in the UV domain is detrimental for practical applications such as biological optical imaging due to strong interaction with biological tissues or fluids, resulting in their disturbance or damage.
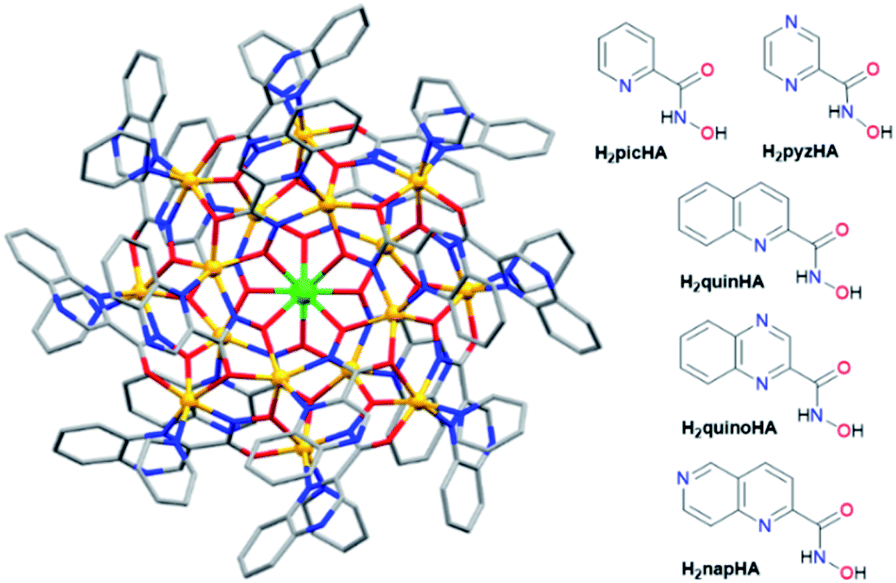 | ||
| Fig. 1 (Left) Molecular structure of the Zn16Yb(quinoHA)16 MC obtained by single crystal X-ray diffraction. Color code: green, Yb; yellow, Zn; red, O; blue, N; grey, C. H atoms and solvents have been omitted for clarity. (right) Structures of the hydroxamic acids used to assemble ‘encapsulated sandwich’ MCs. | ||
Therefore, in this work, we expand the Zn16Ln(HA)16 family by creating MCs with two new ligands, naphthyridine- (napHA2−) and quinoxaline- (quinoHA2−) hydroximate (Fig. 1) following the specific goal of shifting the absorption wavelength further into the visible region. In addition, this comprehensive study that includes Zn16Ln(HA)16 MCs with a full range of substitution patterns addresses the general goal of bringing a rationalization for the smart tuning of the functional and photophysical properties, with a specific focus on NIR emission, on the basis of the nature of the hydroximate ligand. Synthesis and characterization of new Zn16Ln(napHA)16 and Zn16Ln(quinoHA)16 MCs formed with several lanthanide cations (Ln = YbIII, ErIII, NdIII, GdIII) and YIII, including the structural analysis of Zn16Nd(quinoHA)16 and Zn16Yb(quinoHA)16, are reported. Absorption, excitation, and emission spectra, total and intrinsic quantum yields, sensitization efficiencies, observed and radiative lifetimes were acquired and extensively analyzed herein for the NIR-emitting Zn16Ln(napHA)16 and Zn16Ln(quinoHA)16 (Ln = YbIII, ErIII, NdIII) in the solid state and in CH3OH and CD3OD solutions. Moreover, we completed the detailed photophysical studies for Zn16Ln(picHA)16, Zn16Ln(pyzHA)16 and Zn16Ln(quinHA)16 by recording QLnLn for NdIII and ErIII analogues or τrad for YbIII. Our approach allows the quantification of all relevant parameters from eqn (1), in particular τobs, τrad, ηsens and QLnLn, and their impact on the total quantum yield QLLn within the series of Zn16Ln(HA)16 MCs created with the different hydroximate ligands.
Experimental
All syntheses were performed under aerobic conditions using chemicals and solvents as received unless otherwise stated. ESI-MS spectra were collected with a Micromass LCT time-of-flight electrospray mass spectrometer in a negative ion mode at a cone voltage of −40 V on samples dissolved in CH3OH. Samples were injected via a syringe pump. Data were processed with the program MassLynx 4.0. Elemental analyses were performed by Atlantic Microlabs Inc.Synthesis of quinoxalinehydroxamic acid (H2quinoHA)
In a three-neck flask, 2-quinoxalinecarboxylic acid (3.1 g, 18.0 mmol) was added into a solution of N-methylmorpholine (2.4 mL, 21.8 mmol) in dichloromethane (50.0 mL). The mixture was stirred under N2 for 15 minutes and cooled down to 0 °C. Ethylchloroformate (2.0 mL, 21.0 mmol) was added dropwise under stirring. The mixture was stirred for an additional 1 hour and filtered to obtain a brown solution. Meanwhile, a fresh hydroxylamine solution was prepared by reacting hydroxylamine hydrochloride (1.9 g, 27.0 mmol) with potassium hydroxide at 85% (1.8 g, 27.0 mmol) in methanol (16.0 mL) at 0 °C. The solution was stirred for 10 minutes, filtered, and the filtrate obtained was added dropwise into the brown solution while stirring at 0 °C. The reaction mixture was stirred for 2 hours, filtered, and the filtrate was left for slow evaporation to induce the precipitation of a white solid. The solid was recrystallized in hot water, collected by filtration, washed with a copious amount of water, and dried under vacuum to yield the pure powder of H2quinoHA. Yield ∼26% (0.90 g), ESI-MS, calc. for [M − H+], C9H6N3O2, 188.05; found 188.0. 1H NMR (400 MHz, DMSO-d6) δ ppm 11.78 (s, 1H), 9.40 (s, 1H), 9.37 (s, 1H), 8.20–8.15 (m, 2H), 8.00–7.95 (m, 2H). 13C NMR (400 MHz, DMSO-d6) δ ppm 161.0, 144.7, 143.6, 142.8, 139.8, 131.7, 131.2, 129.4, 129.1. Elem. anal., calc. (found) for (C9H7N3O2), C: 57.14 (57.42), H: 3.73 (3.85), N: 22.21 (22.06).Synthesis of naphthyridinehydroxamic acid (H2napHA)
H2napHA was synthesized in two steps.Step 1: to a stirred solution of 1,6-naphthyridine-2-carboxylic acid (0.20 g, 1.1 mmol) in 20.0 mL of CH3OH, 1.0 mL of H2SO4 was added dropwise. The solution was then refluxed for 6 hours. After cooling down to room temperature, the solution was neutralized by a CH3OH solution of NaOH until the formation of a solid which was filtered, washed with H2O, and dried under vacuum to obtain methyl naphthyridine-2-carboxylate. Yield: ∼56% (0.12 g). 1H NMR (400 MHz, CDCl3) δ ppm 9.37 (s, 1H), 8.84 (d, 1H), 8.46 (d, 1H), 8.31 (d, 1H), 8.10 (d, 1H), 4.09 (s, 3H).
Step 2: without further purification, 0.095 g (0.50 mmol) of methyl naphthyridine-2-carboxylate was added to a 15.0 mL solution of CH3OH containing 0.40 g of hydroxylamine hydrochloride. An amount of 0.32 g of NaOH was added and the resulting solution was stirred at room temperature overnight. CH3OH was then removed under vacuum to give a solid, which was washed by a dilute HCl solution to give pure H2napHA. Yield: ∼53% (0.050 g). ESI-MS, calc. for [M − H+], C9H6N3O2, 188.05; found 188.0. 1H NMR (400 MHz, DMSO-d6) δ ppm 11.71 (s, 1H), 9.50 (s, 1H), 9.32 (s, 1H), 8.82 (d, 1H), 8.76 (d, 1H), 8.21 (d, 1H), 7.95 (d, 1H). Elem. anal., calc. (found) for (C9H7N3O2), C: 57.14 (57.26), H: 3.73 (3.70), N: 22.21 (22.10).
Synthesis of Zn16Ln(quinoHA)16 and Zn16Ln(napHA)16 (Ln = NdIII, GdIII, ErIII, YbIII) and the YIII analogues
A general synthesis for these compounds is described below for the Zn16Nd(quinoHA)16 complex. Complexes with YIII, other LnIII and napHA2− were prepared by substituting the appropriate metal ion for NdIII and hydroxamic acid for H2quinoHA. Deuterated pyridine (py-d5) was used in the syntheses of the YIII analogues.[Zn16Nd(quinoHA)16(py)8](OTf)3 (Zn16Nd(quinoHA)16). H2quinoHA (0.060 g, 0.32 mmol) was added to a solution containing 1.0 mL pyridine, 5.0 mL DMF, and 5.0 mL H2O. The solution was stirred for 5 minutes in order to completely dissolve the solid. Zinc triflate (0.12 g, 0.32 mmol) and neodymium triflate (0.024 g, 0.040 mmol) were added and the orange solution was stirred at 80 °C for 2 hours. The solution was then cooled down to room temperature, and filtered. The filtrate was layered with H2O to give red–brown crystals after three days. The crystals were collected by filtration, washed with H2O, and dried in air. Yield ∼28% (31 mg). ESI-MS (CH3OH), calc. for [M]3+, Zn16NdC144H80N48O32, 1392.79; found 1393.0. Elem. anal., calc. (found) for (Zn16NdC187H120N56O41F9S3)(H2O)12, C: 40.98 (40.67), H: 2.65 (2.38), N: 14.31 (14.24).
[Zn16Gd(quinoHA)16(py)8](OTf)3 (Zn16Gd(quinoHA)16). Yield ∼35% (38 mg). ESI-MS (CH3OH), calc. for [M]3+, Zn16GdC144H80N48O32, 1398.13; found 1396.8. Elem. anal., calc. (found) for (Zn16GdC187H120N56O41F9S3)(H2O)12, C: 40.88 (40.68), H: 2.64 (2.26), N: 14.28 (14.13).
[Zn16Er(quinoHA)16(py)8](OTf)3 (Zn16Er(quinoHA)16). Yield ∼24% (26 mg). ESI-MS (CH3OH), calc. for [M]3+, Zn16ErC144H80N48O32, 1400.79; found 1400.3. Elem. anal., calc. (found) for (Zn16ErC187H120N56O41F9S3)(H2O)12, C: 40.81 (40.85), H: 2.64 (2.43), N: 14.25 (14.38).
[Zn16Yb(quinoHA)16(py)8](OTf)3 (Zn16Yb(quinoHA)16). Yield ∼23% (25 mg). ESI-MS (CH3OH), calc. for [M]3+, Zn16YbC144H80N48O32, 1403.46; found 1403.4. Elem. anal., calc. (found) for (Zn16YbC187H120N56O41F9S3)(H2O)12, C: 40.76 (40.90), H: 2.63 (2.39), N: 14.24 (14.26).
[Zn16Y(quinoHA)16(py-d5)8](OTf)3 (Zn16Y(quinoHA)16). ESI-MS (CH3OH), calc. for [M]3+, Zn16YbC144H80N48O32, 1375.12; found 1373.4.
[Zn16Nd(napHA)16(py)8](OTf)3 (Zn16Nd(napHA)16). Yield ∼27% (30 mg). ESI-MS (CH3OH), calc. for [M]3+ Zn16NdC144H80N48O32, 1392.79; found 1393.0. Elem. anal., calc. (found) for (Zn16NdC187H120N56O41F9S3)(H2O)12, C: 40.98 (40.70), H: 2.65 (2.52), N: 14.31 (14.10).
[Zn16Gd(napHA)16(py)8](OTf)3 (Zn16Gd(napHA)16). Yield ∼32% (35 mg). ESI-MS (CH3OH), calc. for [M]3+, Zn16GdC144H80N48O32, 1398.13; found 1397.7. Elem. anal., calc. (found) for (Zn16GdC187H120N56O41F9S3)(H2O)12, C: 40.88 (40.67), H: 2.64 (2.65), N: 14.28 (14.30).
[Zn16Er(napHA)16(py)8](OTf)3 (Zn16Er(napHA)16). Yield ∼24% (26 mg). ESI-MS (CH3OH), calc. for [M]3+, Zn16ErC144H80N48O32, 1400.79; found 1401.1. Elem. anal., calc. (found) for (Zn16ErC187H120N56O41F9S3)(H2O)12, C: 40.81 (40.71), H: 2.64 (2.66), N: 14.25 (14.22).
[Zn16Yb(napHA)16(py)8](OTf)3 (Zn16Yb(napHA)16). Yield ∼27% (30 mg). ESI-MS (CH3OH), calc. for [M]3+, Zn16YbC144H80N48O32, 1403.46; found 1403.0. Elem. anal., calc. (found) for (Zn16YbC187H120N56O41F9S3)(H2O)12, C: 40.76 (40.60), H: 2.63 (2.71), N: 14.24 (14.11).
[Zn16Y(napHA)16(py-d5)8](OTf)3 (Zn16Y(napHA)16). ESI-MS (CH3OH), calc. for [M]3+, Zn16YC144H80N48O32, 1375.12; found 1375.1.
X-ray crystallography
Orange blocks of Zn16Nd(quinoHA)16 and Zn16Yb(quinoHA)16 were grown from a dimethylformamide/water solution of the compound at 22 °C. A crystal of dimensions 0.20 × 0.19 × 0.14 mm for the former, and 0.12 × 0.11 × 0.08 mm for the latter, was mounted on a Rigaku AFC10K Saturn 944+ CCD-based X-ray diffractometer equipped with a low temperature sample conditioning device and a Micromax-007HF Cu-target micro-focus rotating anode (λ = 1.54187 A) operated at 1.2 kW power (40 kV, 30 mA). The X-ray intensities were measured at 85(1) K with the detector placed at a distance 42.00 mm from the crystal.For Zn16Nd(quinoHA)16, a total of 4125 images were collected with an oscillation width of 1.0° in ω. Exposure times were 5 s and 25 s for the low- and high-angle images respectively. Rigaku d*trek images were exported to CrysAlisPro for the processing of the collected data and corrected for absorption. The integration of the experimental data yielded a total of 472![[thin space (1/6-em)]](https://www.rsc.org/images/entities/char_2009.gif) 686 reflections to a maximum 2θ value of 148.15° of which 12397 were independent and 11558 were greater than 2σ(I). The final cell constants (Table S1†) were based on the xyz centroids of 129624 reflections described above 10σ(I). The analysis of the data showed a negligible intensity decay during data collection. The structure was solved and refined with the Bruker SHELXTL (version 2014/6) software package40 and using the space group P4/ncc with Z = 4 for the formula C187H120N62O57.5F9S3Zn16Nd. All non-hydrogen atoms were refined anisotropically with the hydrogen atoms placed in idealized positions. Full matrix least-squares refinements based on F2 converged at R1 = 0.0550 and wR2 = 0.1902 [based on I > 2σ(I)], R1 = 0.0572 and wR2 = 0.1943 for all data. The SQUEEZE subroutine of the PLATON program suite41 was used to address highly disordered solvent and two triflate anions present in the structure. Additional details are presented in Table S1.†
686 reflections to a maximum 2θ value of 148.15° of which 12397 were independent and 11558 were greater than 2σ(I). The final cell constants (Table S1†) were based on the xyz centroids of 129624 reflections described above 10σ(I). The analysis of the data showed a negligible intensity decay during data collection. The structure was solved and refined with the Bruker SHELXTL (version 2014/6) software package40 and using the space group P4/ncc with Z = 4 for the formula C187H120N62O57.5F9S3Zn16Nd. All non-hydrogen atoms were refined anisotropically with the hydrogen atoms placed in idealized positions. Full matrix least-squares refinements based on F2 converged at R1 = 0.0550 and wR2 = 0.1902 [based on I > 2σ(I)], R1 = 0.0572 and wR2 = 0.1943 for all data. The SQUEEZE subroutine of the PLATON program suite41 was used to address highly disordered solvent and two triflate anions present in the structure. Additional details are presented in Table S1.†
For Zn16Yb(quinoHA)16, a total of 2289 images were collected with an oscillation width of 1.0° in ω. The exposure times were 5 s and 25 s for the low- and high-angle images. The integration of the experimental data yielded a total of 386106 reflections to a maximum 2θ value of 136.49° of which 11168 were independent and 9078 were greater than 2σ(I). The final cell constants (Table S2†) were based on the xyz centroid 143200 reflections above 10σ(I). Analysis of these data showed negligible intensity decay during data collection. They were processed with CrystalClear 2.0 and corrected for their absorption. The structure was solved and refined with the Bruker SHELXTL (version 2014/6) software package,40 using the space group P4/ncc with Z = 4 for the formula C187H124.5N56O47F9S3Zn16Yb. All non-hydrogen atoms were refined anisotropically with the hydrogen atoms placed on idealized positions. Full matrix least-squares refinement based on F2 converged at R1 = 0.0687 and wR2 = 0.2087 [based on I > 2σ(I)], R1 = 0.0768 and wR2 = 0.2193 for all data. The SQUEEZE subroutine of the PLATON program suite41 was used to address highly disordered solvent and two triflate anions present in the structure. Additional details are presented in Table S2.†
Photophysical measurements
Data were collected on samples in the solid state or on freshly prepared solutions placed in 2.4 mm i.d. quartz capillaries or quartz Suprasil cells. Absorption spectra were acquired on a Varian Cary 100Bio or a Jasco V670 spectrophotometer in absorbance mode. Steady-state emission and excitation spectra were measured on a Horiba-Jobin-Yvon Fluorolog 3 spectrofluorimeter equipped with either a visible photomultiplier tube (PMT) (220–800 nm, R928P; Hamamatsu), a NIR solid-state InGaAs detector cooled to 77 K (800–1600 nm, DSS-IGA020L; ElectroOptical Systems, Inc., USA), or a NIR PMT (950–1650 nm, H10330-75; Hamamatsu). Phosphorescence spectra of GdIII MCs were acquired in the solid state at 77 K on a Fluorolog 3 spectrofluorimeter in a time-resolved mode. All spectra were corrected for the instrumental functions. Luminescence lifetimes were determined under excitation at 355 nm provided by a Nd:YAG laser (YG 980; Quantel). Signals in the NIR range were detected by the NIR H10330-75 PMT connected to an iHR320 monochromator (Horiba Scientific). The output signals generated from the detectors were fed into a 500 MHz bandpass digital oscilloscope (TDS 754C; Tektronix) and transferred to a PC for data processing with the Origin 8® software. Luminescence lifetimes are averages of three or more independent measurements. Quantum yields were determined with a Fluorolog 3 spectrofluorimeter based on the absolute method using an integration sphere (GMP SA). Each sample was measured several times. Experimental error for the determination of quantum yields is estimated as ∼10%.Results
Synthesis
Zn16Ln(napHA)16 and Zn16Ln(quinoHA)16 were prepared using a modified synthetic procedure in respect to the one reported previously for Zn16Ln(HA)16 (HA = picHA2−, pyzHA2−, quinHA2−).32,33,37 The self-assembly reaction between H2napHA or H2quinoHA, ZnII and LnIII triflates was performed in a DMF/H2O/pyridine solution. The use of an excess of LnIII triflates (molar ratio Zn(OTf)2:Ln(OTf)3 8:1) ensures the formation of pure products. All reactions can be performed at room temperature but significantly higher yields were obtained when the reaction mixtures were heated to 80 °C. All synthesized MCs were systematically characterized by ESI mass-spectrometry (ESI†) and elemental analysis. According to the elemental analysis, the general composition of the MCs can be presented as follows [Zn16Ln(HA)16(py)8](OTf)3(H2O)12, in which each MC molecule contains 1 LnIII, 16 ZnII, 16 naphthyridine- (napHA2−) or quinoxaline- (quinoHA2−) hydroximates, 8 pyridine molecules coordinated to ZnII ions, three triflate anions as counter-ions and 12 water molecules. An ESI-MS analysis has been performed in a positive mode, so only [Zn16Ln(HA)16]3+ species could be detected.
Single-crystal X-ray diffraction
X-ray quality single crystals were obtained for NdIII and YbIII analogues of Zn16Ln(quinoHA)16. The molecular structure of Zn16Yb(quinoHA)16 as obtained from X-ray single crystal diffraction is shown in Fig. 1, while that of Zn16Nd(quinoHA)16 is in Fig. S5.† Both compounds crystallize in the tetragonal space group P4/ncc. The structures of both MCs reveal the encapsulation of a LnIII ion within the Zn16 shell, with the complexes having the general formula of LnIII[12-MCZn(II), quinoHA-4]2[24-MCZn(II), quinoHA-8]. The 6-coordinate ZnII ions of the [24-MCZn(II), quinoHA-8] ring are crystallographically equivalent, and each of them is coordinated by three O atoms and two N atoms from the hydroximate ligands and one N atom from the pyridine. The ZnII ions of the two [12-MCZn(II), quinoHA-4] rings are pyridine-free, 5-coordinated and adopt a distorted square pyramidal geometry. The LnIII ion is sandwiched between two [12-MCZn(II), quinoHA-4] rings and further encapsulated by a [24-MCZn(II), quinoHA-8]. The MC molecule has a crystallographic S8 symmetry. Each LnIII ion is coordinated by eight O atoms from two [12-MCZn(II), quinoHA-4] rings. No solvent molecule is coordinated directly to YbIII ion that adopts a square-antiprismatic coordination geometry around it, whilst 1.5 water molecules bound to NdIII are observed and its coordination geometry is best described as a (bi)capped square antiprism.NMR spectroscopy
Because of the paramagnetic nature of most LnIII ions that induces fast relaxation and often causes strong line broadening in the NMR spectra, diamagnetic YIII analogues (Zn16Y(HA)16) were prepared with both napHA2− and quinoHA2− families of ligands. Deuterated pyridine was used to prevent the observation of 1H signals from the coordinated pyridine solvent molecules. 1H and COSY-NMR spectra of Zn16Y(quinoHA)16 collected in DMSO-d6 are shown in Fig. 2; the ones of Zn16Y(napHA)16 are provided in the ESI (Fig. S4†).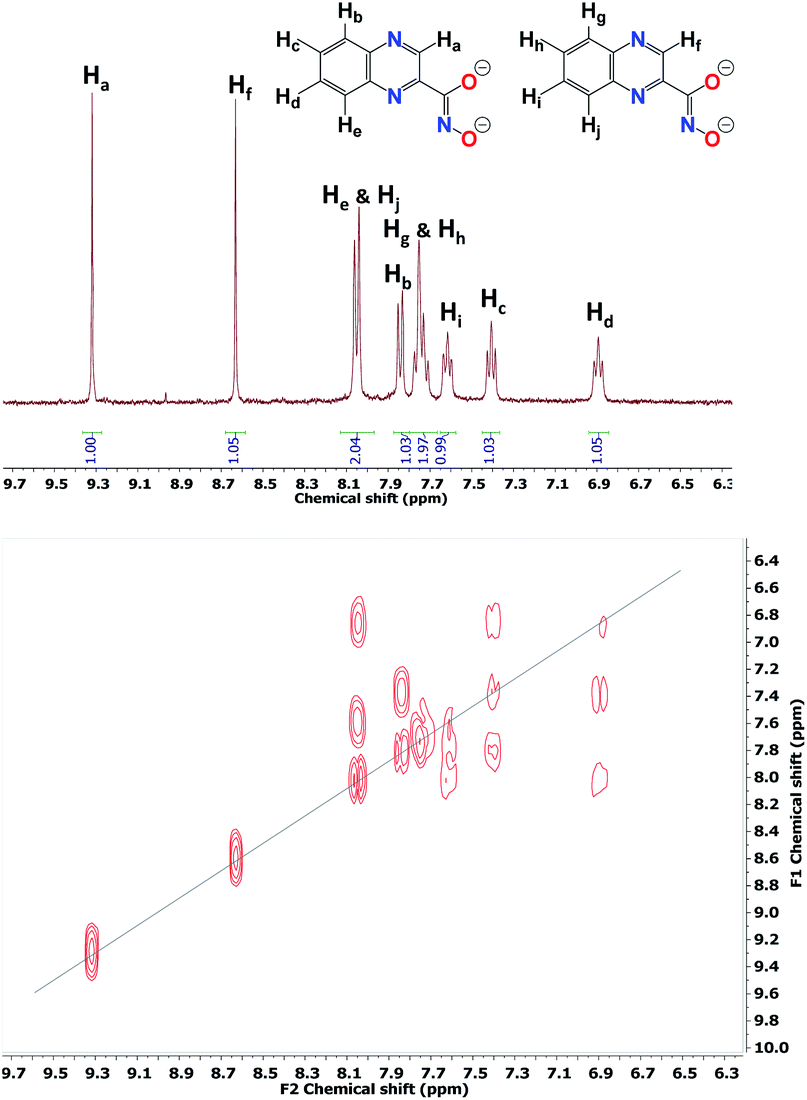 | ||
| Fig. 2 (top) 1H-NMR spectrum and (bottom) 1H–1H COSY-NMR spectrum of Zn16Y-quinoHA acquired in DMSO-d6. | ||
As can be seen from the crystal structure of Zn16Yb(quinoHA)16, crystallographically inequivalent quinoHA2− ligands are present in the molecular architecture. The first group includes eight ligands of the two [12-MC-4] and the second group contains the other eight ligands of the [24-MC-8]. The 1H NMR spectrum of Zn16Y(quinoHA)16 displays, therefore, the presence of both types of quinoHA2− ligands in the ratio of 1:1. The NMR peaks were assigned as represented in Fig. 2 (top), in agreement with the presence of a total of 10 protons belonging to the two quinoHA2−. This peak assignment was confirmed by the acquisition of an 1H–1H COSY-NMR spectrum Fig. 2 (bottom), which allows the determination of neighboring protons exhibiting correlations due to spin–spin coupling. Identical NMR spectra were obtained for the same samples after one week, confirming the long-term stability in solution of the Zn16Ln(HA)16 complexes.
Photophysical properties
320 cm−1) and 447 nm (22370 cm−1) for H2quinoHA and H2napHA, respectively (Table S4†). The deprotonation and the formation of Zn16Ln(HA)16 complexes induce a blue shift of the π → π* absorption bands and the apparition of a new intra-ligand charge transfer (ILCT) band in the (near-)visible range which extends up to 490 nm and 510 nm for Zn16Ln(napHA)16 and Zn16Ln(quinoHA)16, respectively (Fig. 3, red traces). The positions of the apparent maxima appear at 387 nm (ε387 = 68290 M−1 cm−1) for Zn16Ln(napHA)16 and at 402 nm (ε402 = 73370 M−1 cm−1) for Zn16Ln(quinoHA)16. The molar absorption coefficients of Zn16Ln(HA)16 assembled using picHA2−, pyzHA2−, and quinHA2− ligands are summarized in Table S3,† while a comparison of absorption spectra is presented in Fig. 8.
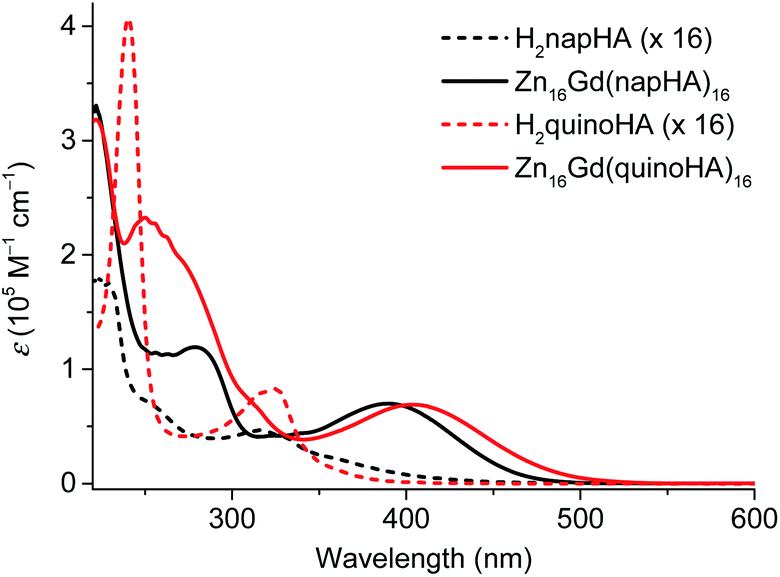 | ||
| Fig. 3 Absorption spectra of hydroxamic acids (multiplied by a factor of 16) and of Zn16Gd(HA)16 (HA = quinoHA2−, napHA2−) recorded in CH3OH at room temperature. | ||
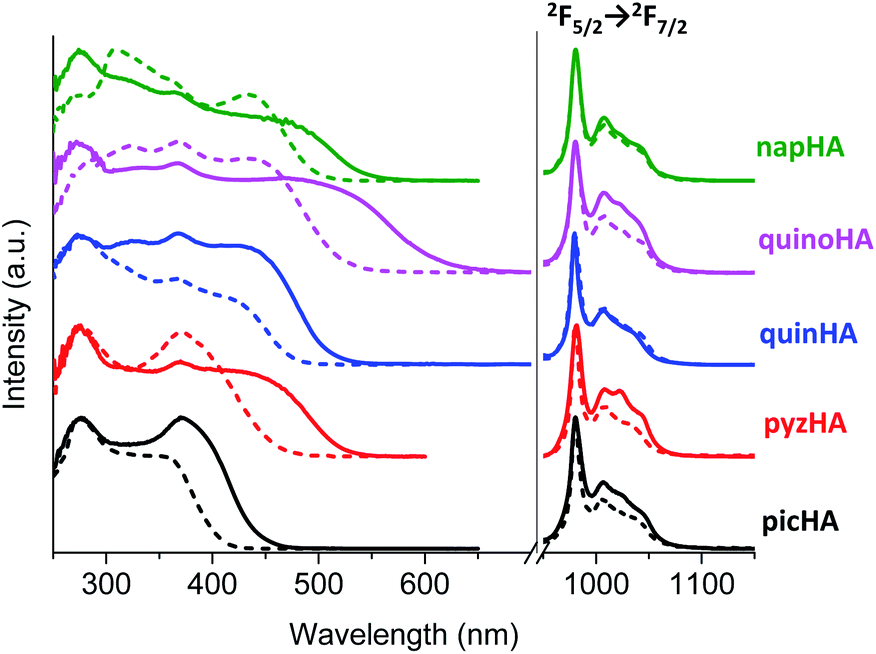 | ||
| Fig. 4 (left) Excitation (λem = 980 nm) and (right) emission (λex = 320–420 nm) spectra of Zn16Yb(HA)16 measured in the solid state (solid traces), or in 200 μM solutions in CH3OH (HA = picHA2−, quinHA2−, napHA2−, quinoHA2−) or H2O (HA = pyzHA2−) (dashed traces) at room temperature. | ||
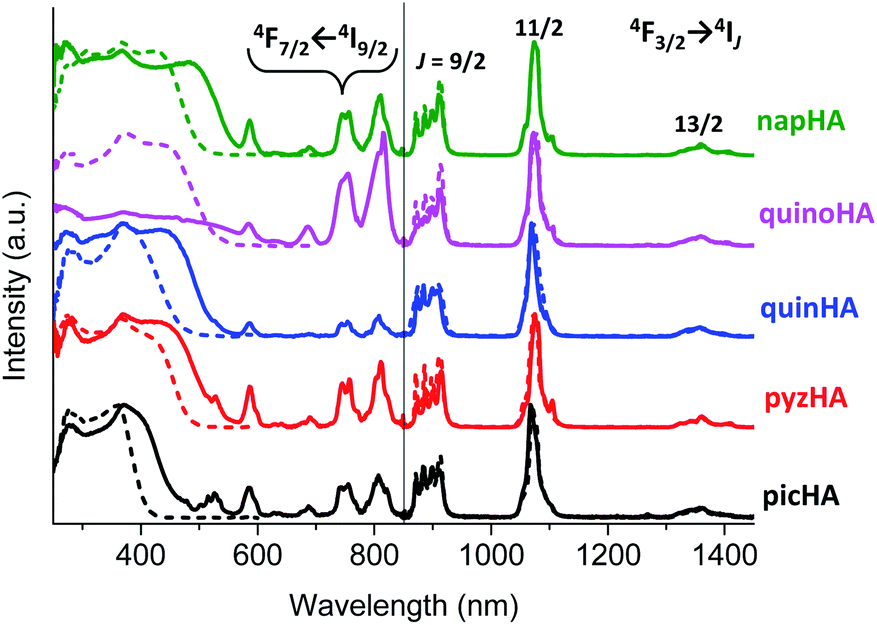 | ||
| Fig. 5 (left) Excitation (λem = 1064 nm) and (right) emission (λex = 320–420 nm) spectra of Zn16Nd(HA)16 collected on solid state samples (solid traces), in 1 mg mL−1 solutions in methanol (HA = picHA2−, quinHA2−, napHA2−, quinoHA2−) or in water (HA = pyzHA2−) (dashed traces) at room temperature. | ||
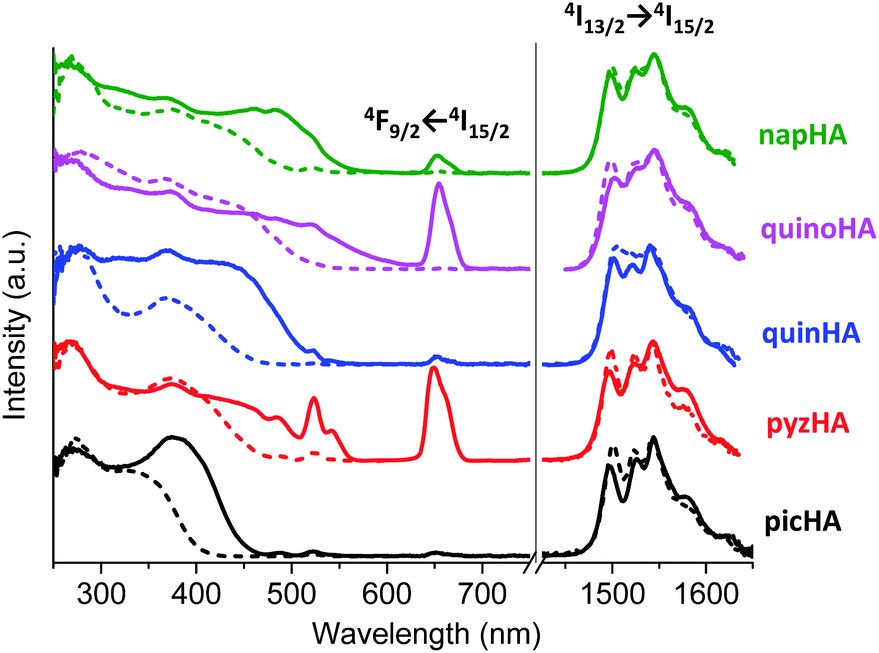 | ||
| Fig. 6 (left) Excitation (λem = 1525 nm) and (right) emission (λex = 320–420 nm) spectra of Zn16Er(HA)16 collected on solid state samples (solid traces), or in 1 mg mL−1 solutions in methanol (HA = picHA2−, quinHA2−, napHA2−, quinoHA2−) or in water (HA = pyzHA2−) (dashed traces) at room temperature. | ||
 | ||
| Fig. 7 Absorption spectra of Zn16Yb(HA)16 MCs measured in the energy range of the 2F5/2 ← 2F7/2 transition in CH3OH (HA = picHA2−, quinHA2−, napHA2−, quinoHA2−) or in H2O (HA = pyzHA2−) at room temperature (1.25–5.1 mM). | ||
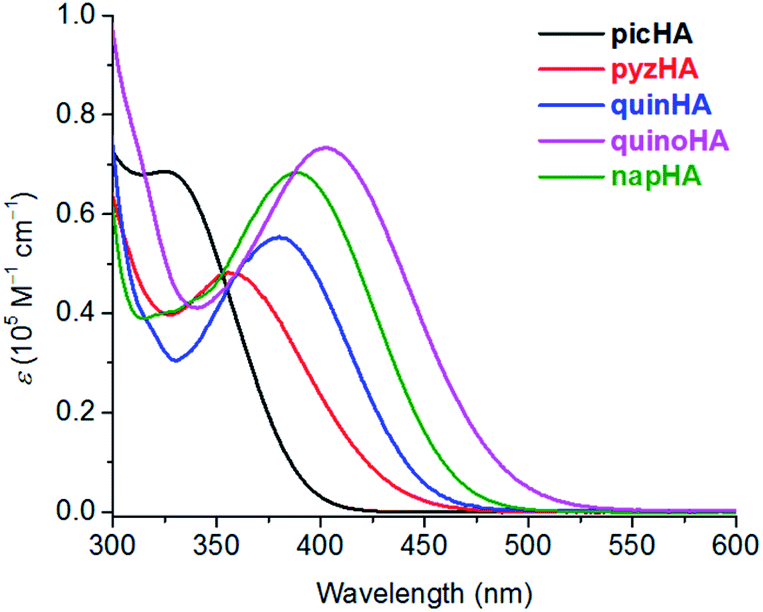 | ||
| Fig. 8 Comparison of absorption spectra of Zn16Yb(HA)16 (HA = picHA2−, quinHA2−, napHA2−, quinoHA2−) or H2O (HA = pyzHA2−) collected in CH3OH solutions at room temperature. | ||
685 cm−1 (508 nm) for Zn16Ln(quinoHA)16 and 20830 cm−1 (480 nm) for Zn16Ln(napHA)16. Corresponding GdIII complexes are often used to determine the position of the T1 state since the energy of the 6P7/2 level (32100 cm−1)47 is too high to be populated through the energy levels of most organic ligands. Moreover, the heavy-atom and paramagnetic effects of GdIII facilitate intersystem-crossing. The corresponding Zn16Gd(HA)16 complexes were synthesized and their emission spectra in the solid state were analyzed. It was observed that the excitation into ILCT bands does not produce any detectable emission at room temperature or at 77 K. Higher energy excitation wavelengths at 290–320 nm, upon application of a time delay after the excitation flash, allowed us to collect phosphorescence spectra (Fig. S7†) and to determine the positions of the T1 states: 24150 cm−1 (414 nm) for Zn16Ln(quinoHA)16 and 25510 cm−1 (392 nm) for Zn16Ln(napHA)16. (Table S4†). The diagram with the relative positions of the singlet, triplet and ILCT states for Zn16Ln(HA)16 as well as of the accepting energy levels of YbIII, NdIII and ErIII is shown in Fig. 9.
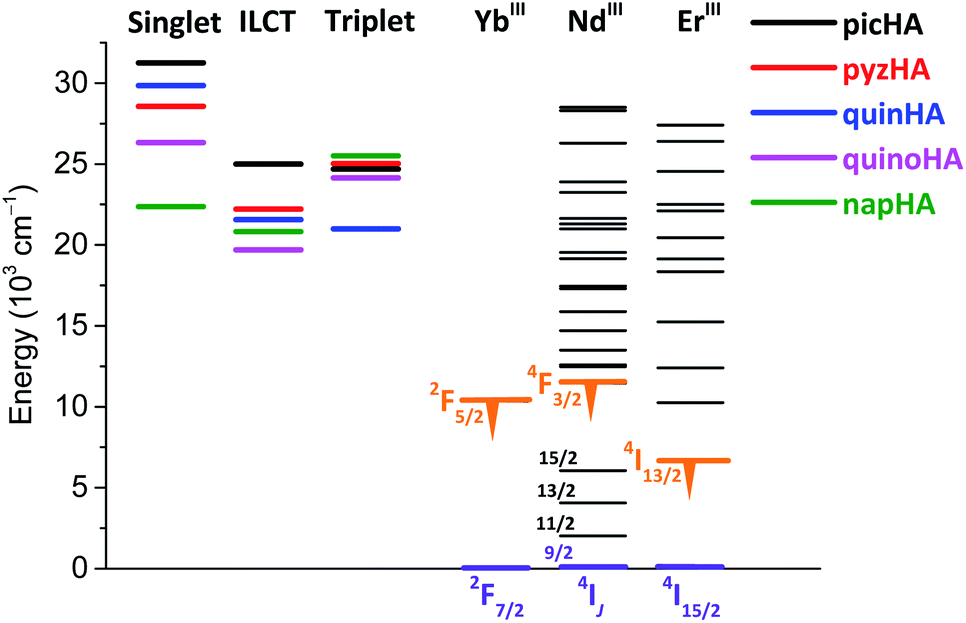 | ||
| Fig. 9 Schematic energy diagram showing the energy positions of singlet states in H2HA, as well as triplet and ILCT levels in Zn16Gd(HA)16 in respect to the accepting energy levels of NIR-emitting YbIII, NdIII, ErIII ions. | ||
LnIII-centered quantum yields (QLLn) and observed luminescence lifetimes (τobs) (Table 1) were collected under ligand excitation for all Zn16Ln(HA)16 in the solid state and in CH3OH and CD3OD solutions at room temperature. Using phenomenological equations50,51 and values of τobs obtained in CH3OH and CD3OD solutions, we can confirm that no solvent molecules are directly coordinated to YbIII or NdIII in Zn16Ln(quinoHA)16 and in Zn16Ln(napHA)16. This result suggests that in the case of Zn16Nd(quinoHA)16 in CH3OH and CD3OD solutions, water molecules coordinated to NdIII are dissociated while the coordination of larger solvent molecules is sterically hindered.
| Compound | State/solvent | τ obs (μs) | τ rad (μs) | Q LnLn (%) | Q LLn (%) | η sens (%) |
|---|---|---|---|---|---|---|
| a Data at room temperature. Standard deviation (2σ) between parentheses; estimated relative errors: τobs, ±2%; τrad, ±10–12%; QLLn, ±10%; QLnLn, ±10–12%; ηsens, ±22%. b Under excitation at 355 nm. c See text for details. d Under excitation at 320–420 nm. e Average lifetime calculated from τ1 = 1.12(1) μs (74%); τ2 = 0.39(1) μs (26%). | ||||||
| Zn16Yb(picHA)16 | Solid | 34.5(1) | 410 | 8.4 | 0.40(2) | 4.8 |
| CH3OH | 12.1(1) | 524 | 2.3 | 0.13(1) | 5.6 | |
| CD3OD | 133(1) | 526 | 25.3 | 1.60(3) | 6.3 | |
| Zn16Nd(picHA)16 | Solid | 1.18(2) | 293 | 0.40(9) | 0.40(1) | ∼100 |
| CH3OH | 0.90(1) | 375 | 0.24 | 0.22(2) | 92 | |
| CD3OD | 3.53(1) | 377 | 0.94 | 0.98(1) | ∼100 | |
| Zn16Er(picHA)16 | Solid | 3.47(4) | 11.8 × 10³ | 2.95(9) × 10−2 | 1.34(4) × 10−2 | 45 |
| CH3OH | 1.02(1) | 15.1 × 10³ | 6.75 × 10⁻³ | 1.30(3) × 10−3 | 19 | |
| CD3OD | 10.4(1) | 15.2 × 10³ | 6.8 × 10⁻² | 5.24(6) × 10−2 | 77 | |
| Zn16Yb(pyzHA)16 | Solid | 45.6(3) | 399 | 11.4 | 0.659(4) | 5.8 |
| H2O | 5.57(1) | 499 | 1.12 | 1.12(7) × 10−2 | 1.0 | |
| D2O | 81.3(1) | 508 | 16 | 0.257(3) | 1.6 | |
| Zn16Nd(pyzHA)16 | Solid | 1.71(1) | 133 | 1.82(3) | 0.444(9) | 34 |
| H2O | 0.214(4) | 166 | 0.13 | 7.7(1) × 10−3 | 6.0 | |
| D2O | 1.29(1) | 169 | 0.76 | 6.17(9) × 10−2 | 8.1 | |
| Zn16Er(pyzHA)16 | Solid | 4.96(4) | 3.82 × 10³ | 0.130(6) | 9.5(2) × 10−3 | 7.3 |
| D2O | 7.02(2) | 4.91 × 10³ | 0.14 | 1.70(4) × 10−3 | 1.2 | |
| Zn16Yb(quinHA)16 | Solid | 47.8(4) | 530 | 9.0 | 2.44(4) | 27 |
| CH3OH | 14.88(1) | 675 | 2.2 | 0.25(1) | 11.3 | |
| CD3OD | 150.7(2) | 679 | 22 | 2.88(2) | 13.0 | |
| Zn16Nd(quinHA)16 | Solid | 1.79(2) | 166 | 1.54(4) | 1.13(4) | ∼100 |
| CH3OH | 1.16(1) | 212 | 0.55 | 0.38(1) | 69 | |
| CD3OD | 4.11(2) | 214 | 1.9 | 1.35(1) | 70 | |
| Zn16Er(quinHA)16 | Solid | 5.73(2) | 3.58 × 10³ | 0.16(1) | 4.2(1) × 10−2 | 26.3 |
| CH3OH | 1.25(1) | 4.58 × 10³ | 2.7 × 10⁻² | 9.9(3) × 10−4 | 3.6 | |
| CD3OD | 11.40(3) | 4.6 × 10³ | 0.25 | 3.6(1) × 10−2 | 14.5 | |
| Zn16Yb(quinoHA)16 | Solid | 49.7(2) | 250 | 19.9 | 0.637(5) | 3.2 |
| CH3OH | 22.6(1) | 320 | 7.1 | 0.135(1) | 1.9 | |
| CD3OD | 124.0(1) | 322 | 38 | 0.88(2) | 2.3 | |
| Zn16Nd(quinoHA)16 | Solid | 1.04(1)e | 202 | 0.51(1) | 0.153(2) | 30 |
| CH3OH | 0.79(1) | 259 | 0.31 | 7.1(1) × 10−2 | 23 | |
| CD3OD | 1.50(1) | 261 | 0.57 | 0.160(5) | 28 | |
| Zn16Er(quinoHA)16 | Solid | 5.89(2) | 7.46 × 10³ | 7.9(1) × 10−2 | 1.11(5) × 10−2 | 14.1 |
| CH3OH | 1.32(1) | 9.55 × 10³ | 1.3 × 10⁻² | 3.7(3) × 10−4 | 2.7 | |
| CD3OD | 10.8(1) | 9.61 × 10³ | 0.11 | 9.8(2) × 10−3 | 8.7 | |
| Zn16Yb(napHA)16 | Solid | 41.3(2) | 351 | 11.8 | 1.10(2) | 9.3 |
| CH3OH | 20.0(1) | 454 | 4.4 | 0.156(3) | 3.5 | |
| CD3OD | 159(1) | 456 | 35 | 1.57(3) | 4.5 | |
| Zn16Nd(napHA)16 | Solid | 1.13(1) | 139 | 0.82(2) | 0.34(1) | 41 |
| CH3OH | 0.993(4) | 178 | 0.56 | 0.168(3) | 30 | |
| CD3OD | 3.73(3) | 180 | 2.1 | 0.731(3) | 35 | |
| Zn16Er(napHA)16 | Solid | 3.96(1) | 4.21 × 10³ | 9.4(3) × 10−2 | 1.29(1) × 10−2 | 13.7 |
| CH3OH | 1.27(1) | 5.39 × 10³ | 2.3 × 10⁻² | 5.2(4) × 10−4 | 2.2 | |
| CD3OD | 11.7(1) | 5.41 × 10³ | 0.22 | 1.88(2) × 10−2 | 8.7 | |
In addition, for all NdIII and ErIII samples of the Zn16Ln(HA)16 family, their intrinsic quantum yields (QLnLn) were measured in the solid state under direct excitation into the 4F7/2 ← 4I9/2 transition at 750 nm for Zn16Nd(HA)16 and the 4F9/2 ← 4I15/2 transition located at 650 nm for Zn16Er(HA)16. Taking into account QLLn, QLnLn and τobs for NdIII and ErIII samples in the solid state, the values of τrad and ηsens were calculated according to eqn (1). It has been shown previously that these MCs remain intact in solution. Therefore, τrad were adjusted for the differences in refractive indexes (n), i.e. τrad(solution) = τrad(solid state) × (nsolid state/nsolution)3.29 In the solid state, the refractive index was set to be equal to 1.5, while the nsolution values are admitted to be the ones of the neat solvents, e.g. n(CD3OD) = 1.326; n(CH3OH) = 1.329; n(D2O) = 1.328; n(H2O) = 1.34.
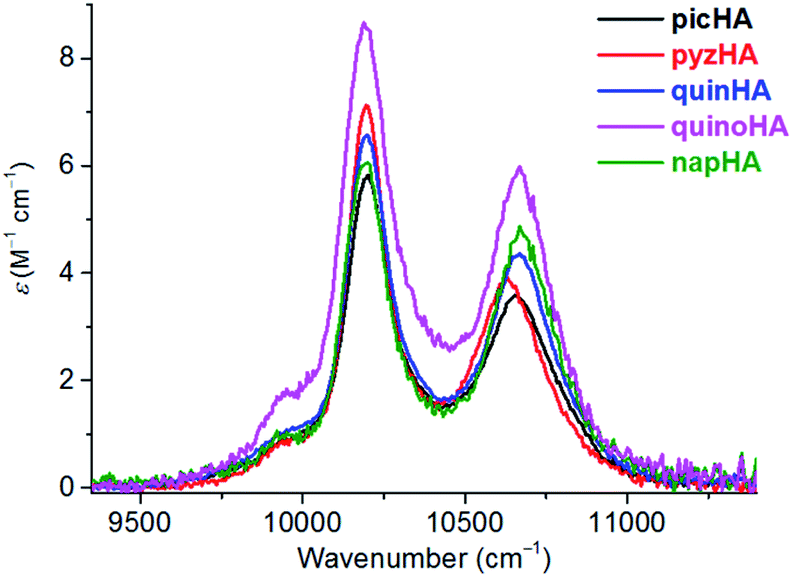
For Zn16Yb(HA)16 MCs, intrinsic quantum yields could not be measured experimentally. However, YbIII electronic transitions generating the luminescence terminate in the ground level. Therefore, if the absorption spectrum corresponding to the emission spectrum is known, τrad can be calculated using the modified Einstein's equation (eqn (2a) and (2b)):52
 | (2a) |
 | (2b) |
 is the integrated spectrum of the 2F5/2 ← 2F7/2 transition,
 ![[small nu, Greek, tilde]](https://www.rsc.org/images/entities/char_e0e1.gif) m is the barycenter of the transition. The corresponding absorption spectra were measured for all Zn16Yb(HA)16 (Fig. 7). The resulting τobs values were adjusted to the media based on the difference in refractive indexes, as explained before, and used to calculate QLnLn and ηsens according to eqn (1).
m is the barycenter of the transition. The corresponding absorption spectra were measured for all Zn16Yb(HA)16 (Fig. 7). The resulting τobs values were adjusted to the media based on the difference in refractive indexes, as explained before, and used to calculate QLnLn and ηsens according to eqn (1).
All quantitative photophysical parameters are summarized in Table 1 and presented on Fig. 10.
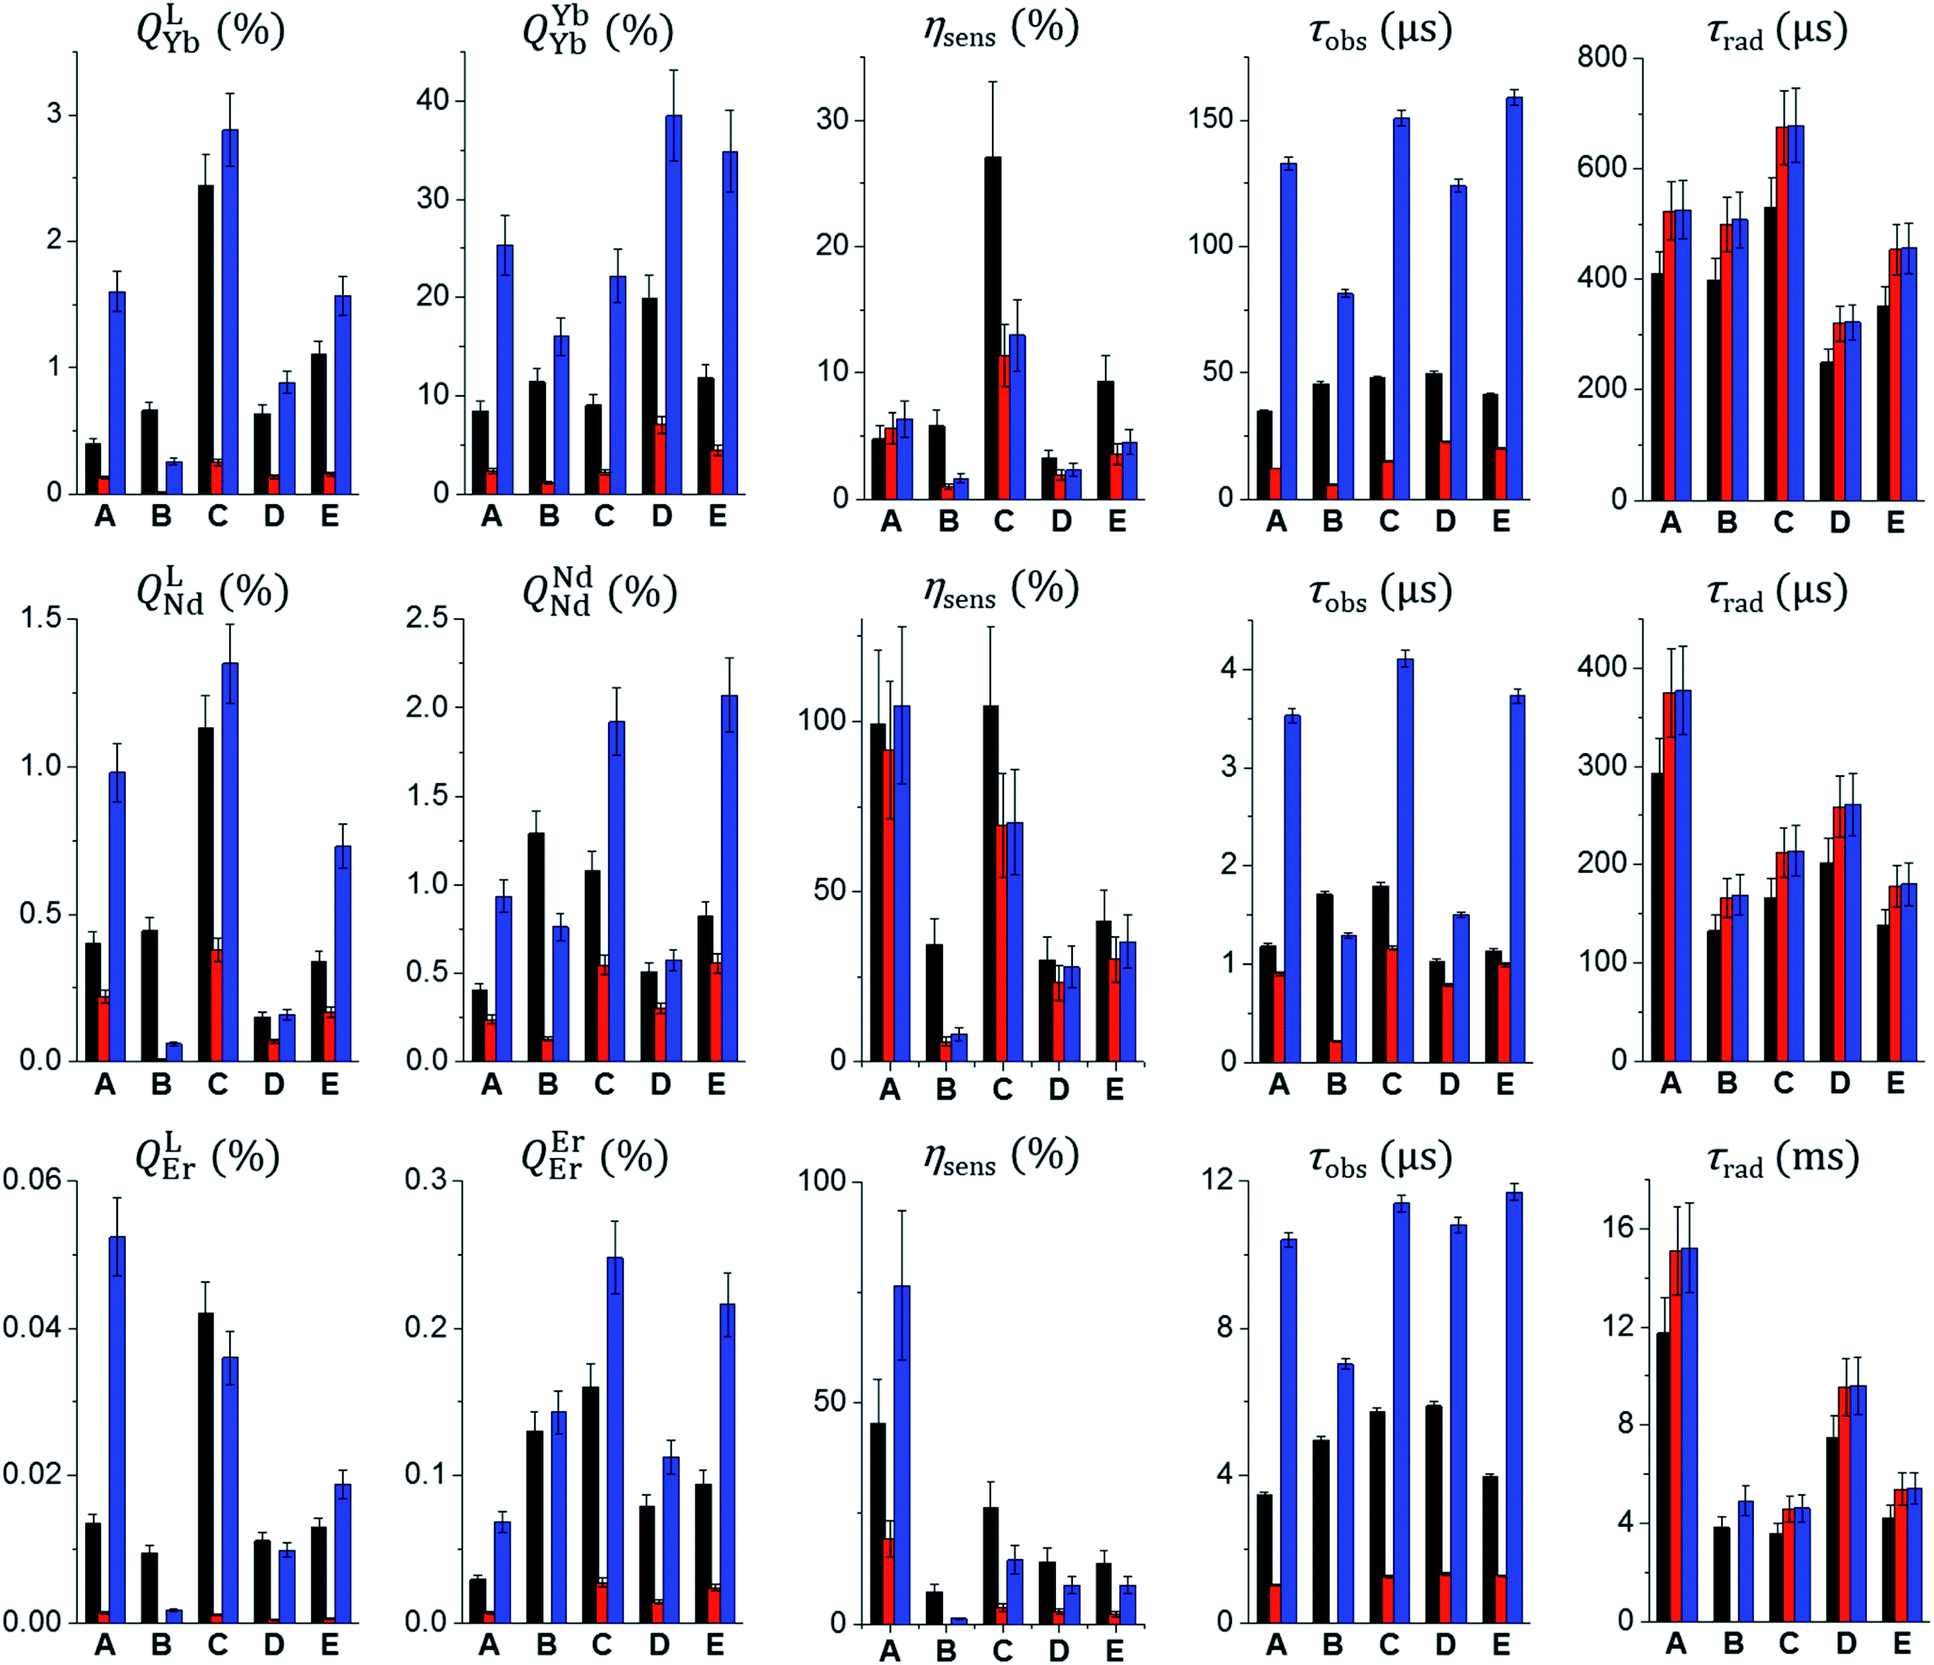 | ||
| Fig. 10 Comparison of total and intrinsic quantum yields, sensitization efficiencies, observed and radiative lifetimes for Zn16Ln(HA)16 (Ln = YbIII, NdIII, ErIII; HA = picHA2− (A), pyzHA2− (B), quinHA2− (C), quinoHA2− (D), napHA2− (E)) in the solid state (black bars) or solution in CH3OH or H2O (red bars) and CD3OD or D2O (blue bars). | ||
Discussion
MCs with the general formula, LnIII[12-MCZn(II),HA-4]2[24-MCZn(II),HA-8] (Zn16Ln(HA)16, LnIII = Yb, Nd, Er, Gd & Y; HA = picHA2−, pyzHA2−, quinHA2−, quinoHA2−, napHA2−) can be obtained by self-assembly reactions between the corresponding hydroxamic acid, ZnII and LnIII triflates in an appropriate molar ratio. Although the general synthetic strategy is the same, the solvents and the base used in the reactions have to be adjusted according to the nature of the hydroxamic acid. In the case of MCs formed with picHA2− and quinHA2−, an addition of sodium hydroxide or trimethylamine is necessary to ensure the formation of the desired Zn16Ln(HA)16 (ref. 32 and 33) while MCs formed with pyzHA2−,37 quinoHA2− and napHA2− can be obtained in the presence of pyridine in H2O or in a H2O/DMF mixture, respectively. The crystal structures of all studied Zn16Ln(HA)16 MCs show that LnIII ion is sandwiched between two [12-MCZn(II),HA-4] and are further encapsulated by a [24-MCZn(II),HA-8] unit. The LnIII ion is bonded to four hydroximate oxygens of each of the [12-MCZn(II),HA-4] motifs, forming a square antiprismatic coordination geometry. No solvent molecule is coordinated directly to the LnIII ion except for Zn16Nd(quinoHA)16 where 1.5 water molecules connected to NdIII were observed. Nevertheless, in general, the differences in the electronic structure of the hydroximate ligands have a minimal effect on the first coordination sphere around the LnIII ion, thus providing an opportunity to study systematically the effect of the nature of the ligand on the resulting photophysical properties of Zn16Ln(HA)16 MCs. In particular, we will discuss how the nature of the hydroximate ligands forming the Zn16Ln(HA)16 scaffold affects absorption, excitation and emission spectra as well as the different quantitative photophysical parameters for the newly reported NIR-emitting Zn16Ln(quinoHA)16 Zn16Ln(napHA)16 and the previously described Zn16Ln(picHA)16,33 Zn16Ln(pyzHA)16 (ref. 37) and Zn16Ln(quinHA)16.32First, we demonstrated that, by varying the nature of hydroxamic acids, i.e. the number of nitrogen atoms in the aromatic rings and the degree of conjugation, it is possible to tune the maxima of the low-energy ILCT bands in the absorption spectra of Zn16Ln(HA)16 from 330 nm (HA = picHA2−), 360 nm (HA = picHA2−), 380 nm (HA = pyzHA2−) to 387 nm (HA = napHA2−) and 402 nm (HA = quinoHA2−) (Fig. 8).
In view of the sensitization of LnIII emission, the mutual energy positions of the ligand-centered donating states and the accepting levels of LnIII are of particular importance.20,43–46 In general, the sensitization process involves an energy transfer originating from the triplet state of the chromophore unit. However, the population of LnIII excited energy levels through singlet and charge transfer states located at lower energy should also be considered. The corresponding energy diagram for Zn16Ln(HA)16 and YbIII, NdIII and ErIII is presented in Fig. 9. Several features are important to note. In the case of MCs formed with picHA2− and quinHA2−, the positions of the T1 and the ILCT states are located very closely to each other with an energy difference which is less than 600 cm−1, while the singlet state is located at least 6500 cm−1 higher in energy. For Zn16Ln(pyzHA)16, Zn16Ln(quinoHA)16 and Zn16Ln(napHA)16, the T1 state is positioned at a higher energy than the ILCT and the energy difference between these states is larger than 2800 cm−1. Singlet states in Zn16Ln(pyzHA)16, Zn16Ln(quinoHA)16 are located higher in energy than the T1 by values of 3535 cm−1 and 2170 cm−1, respectively, while in Zn16Ln(napHA)16, the energy of S1 state is lower than the one of T1. The last observation can be explained by the different nature of these electronic states, i.e. nπ* vs. ππ*. It should also be mentioned that the positions of the singlet states were determined from the edge of the absorption spectra of the corresponding hydroxamic acids and that their energies may shift in Zn16Ln(HA)16. Nevertheless, one can see that for all studied Zn16Ln(HA)16 MCs, the ligand-centered levels are located higher in energy than the 2F5/2, 4F3/2 and 4I13/2 levels of YbIII, NdIII and ErIII, respectively, so all can act as potential sensitizers of their characteristic NIR emission.
Excitation spectra of all the studied Zn16Yb(HA)16 MCs collected in the solid state and in solution upon monitoring the YbIII emission at 980 nm are dominated by broad ligand-centered bands indicating an efficient sensitization of YbIII emission through the electronic structure of the MC scaffold (Fig. 4, left). The excitation spectra of Zn16Nd(HA)16 (Fig. 5, left) and Zn16Er(HA)16 (Fig. 6, left) MCs in the solid state reveal the presence of sharp bands that correspond to f–f transitions in addition to the broad ligand-centered bands. Their intensities depend on the nature of the hydroxamic acid. The excitation spectrum of Zn16Nd(quinoHA)16 is dominated by the sharp bands arising from the f–f transitions while their intensities are significantly less important for Zn16Nd(quinHA)16. Among ErIII MCs, f–f transitions have the lowest intensities for Zn16Er(picHA)16 and Zn16Er(quinHA)16 while they have the highest intensities for Zn16Er(pyzHA)16 and Zn16Er(quinoHA)16. Such observations indicate that the sensitization of the characteristic NdIII and ErIII emissions for Zn16Ln(HA)16 in the solid state may not only occur through the MC scaffold but also through direct excitation of f–f transitions. In solution, the excitation spectra of all Zn16Nd(HA)16 and Zn16Er(HA)16 MCs exhibit only the presence of ligand-centered bands and no f–f transitions could be detected.
Upon excitation into the ILCT bands in the range of 320–420 nm, all the studied Zn16Ln(HA)16 MCs exhibit characteristic LnIII emission in the NIR range. For YbIII MCs, emission bands are observed in the range of 950–1060 nm and originate from the 2F5/2 → 2F7/2 transition (Fig. 4, right), while for ErIII bands appear in the range of 1450–1650 nm arising from the 4I13/2 → 4I15/2 transition (Fig. 6, right). The emission spectra of Zn16Nd(HA)16 are dominated by the 4F3/2 → 4I11/2 transition in the range of 1050–1120 nm, while two additional bands with lower intensities appear at 850–930 nm and 1300–1420 nm. They are assigned to 4F3/2 → 4I9/2 and 4F3/2 → 4I13/2 transitions, respectively (Fig. 5, right). It should be noted that for a specific LnIII ion, the obtained emission spectra are almost independent of the nature of the hydroxamic acid forming the MC, reflecting the similarity of coordination environments around LnIII which is in full agreement with the structural data (vide supra). Moreover, the emission spectra recorded for the Zn16Ln(HA)16 samples in the solid state and solutions are very similar by their bandwidths and crystal-field splitting as an additional indication that MCs remain intact in solution.
Experimental luminescence decay curves collected for most of the studied MCs in the solid state and solutions are best fitted with mono-exponential functions, reflecting the presence of only one emissive LnIII-containing species. The sole exception has been observed with Zn16Nd(quinoHA)16 in the solid state for which a bi-exponential luminescence decay was observed with corresponding ‘long’ (1.12(1) μs) and ‘short’ (0.39(1) μs) τobs values. The ‘short’ component corresponds most probably to MCs containing 1.5 water molecules directly coordinated to NdIII (as observed in the crystal structure of this MC, vide supra), while the ‘long’ component correspond to the Zn16Nd(quinoHA)16 that doesn't contain H2O molecules directly coordinated to NdIII. Luminescence decays collected on CH3OH and CD3OD solutions of Zn16Nd(quinoHA)16 are mono-exponential, indicating that coordinated to NdIII water molecules are dissociated while the coordination of other solvent molecules is sterically hindered. Observed luminescence lifetimes (τobs, Table 1) significantly decrease when going from the solid state samples to solutions in CH3OH or H2O (Fig. 10, black and red bars) reflecting a detrimental effect of O–H and C–H vibrations on non-radiative deactivation of the NIR-emitting LnIII ions.12 The latter is also revealed in a pronounced (2–15 times) lengthening of τobs values for solutions of MCs in deuterated solvents (Fig. 10, blue bars). The use of phenomenological equations50,51 with the values of τobs recorded in CH3OH and CD3OD, or in H2O and D2O solutions for Zn16Yb(HA)16 and Zn16Nd(HA)16 confirmed that no solvent molecules are directly coordinated to either YbIII or NdIII within the whole series of studied MCs, indicating that shortening of τobs values is induced by non-radiative deactivations through second-sphere interactions with overtones of O–H and C–H vibrations.
Values of τobs recorded on solutions of Zn16Yb(HA)16 and Zn16Nd(HA)16 in deuterated solvents are longer compared to these collected in CH3OH and H2O which results in a comparable enhancement of the QLnLn and QLLn values. On the other hand, for Zn16Er(HA)16 in CD3OD solution the τobs and QErEr values are 8–10 times larger compared to the values obtained in CH3OH, while the QLEr values increase by 26–40 times. An explanation can be found in the values of sensitization efficiencies (ηsens) that are similar for solutions of YbIII and NdIII MCs in protic and deuterated solvents while at least a 3-times enhancement is observed for the values of ErIII collected in CD3OD. In general, the lowest values of QLLn are obtained for solutions of Zn16Ln(HA)16 in CH3OH and in H2O. The comparison of QLLn values for Zn16Ln(HA)16 samples in the solid state and in solution in deuterated solvents (Fig. 10, black and blue bars) revealed different trends depending on the nature of the hydroxamic acid. Similar values of QLLn are observed for Zn16Ln(quinHA)16 and Zn16Ln(quinoHA)16, since the higher values of τobs and QLnLn in CD3OD solutions are compensated by a comparable enhancement of the sensitization efficiency in the solid state. For Zn16Ln(pyzHA)16, the values of ηsens are 3.6–6.1 times larger in the solid state than in D2O solutions leading to a significantly improved value of QLLn for the former. In the case of Zn16Ln(picHA)16 and Zn16Ln(napHA)16, QLLn are lower for samples in the solid state vs. solution in CD3OD since the values of ηsens are similar or lower in the solid state. Thus, the non-radiative deactivation of LnIII NIR emission through O–H and C–H vibrations in solutions of MCs in protic solvents has a dominating role and negatively impact the main quantitative characteristics. On the other hand, the values of QLLn for samples of Zn16Ln(HA)16 in the solid state and in deuterated solvents depend on the nature of the hydroximate ligand and LnIII ion.
Several points should be highlighted if we consider further the effect of the nature of the hydroximate ligands on the quantitative photophysical parameters of Zn16Ln(HA)16 in the solid state. For a specific LnIII ion, the values of τobs are within a relatively narrow range, i.e. 34.5–49.7 μs for YbIII, 1.04–1.79 μs for NdIII and 3.47–5.89 μs for ErIII MCs. Considering the similarity of the crystal structures, such variations are mainly caused by the coordination of water molecules (for Zn16Nd(quinoHA)16) or by the presence of sources of non-radiative deactivations through co-crystallized solvent molecules. On the other hand, the effect of the nature of the hydroximate ligand on τrad values is more pronounced. Changes as significant as >3-fold are detected in the case of Zn16Er(picHA)16 (11.8 ms) vs. Zn16Er(quinHA)16 (3.58 ms) or Zn16Er(pyzHA)16 (3.82 ms). Among NdIII MCs, the longest τrad value is observed for Zn16Nd(picHA)16 (293 μs) and the shortest for Zn16Nd(pyzHA)16 (133 μs). For YbIII MCs, the variation of the τrad values is also significant, from 530 μs for Zn16Yb(quinHA)16 to 250 μs for Zn16Yb(quinoHA)16. So, despite the highly similar coordination environments (through eight oxygen atoms) and symmetry (square antiprism) around the LnIII ions in Zn16Ln(HA)16, the nature of the hydroximate ligand appears to impact radiative lifetimes. An enhanced understanding of the factors that control this parameter is important for the design of highly luminescent LnIII compounds since the shorter τrad leads to a higher QLnLn (Eq. (1)). The validity of this approach has been demonstrated in several studies.26,29–31 Indeed, values of QLnLn are the highest for NdIII (1.5–1.8%) and ErIII (0.13–0.16%) MCs formed with pyzHA2− and quinHA2−, while in the case of YbIII for MCs formed with quinoHA2− (19.9%), all of them correspond to the lowest values of τrad. Another important parameter that is largely affected by the nature of the hydroximate ligand is the sensitization efficiency. It varies from 4.8 to 27%, from 30 to 100%, and from 7.3 to 45% for Zn16Yb(HA)16, Zn16Nd(HA)16 and Zn16Er(HA)16, respectively. The highest values of ηsens have been found in YbIII MCs formed with quinHA2− and in Zn16Er(picHA)16. The scaffolds of both MCs sensitize equally well the characteristic emission of NdIII with a ηsens of ∼100%. Here, a correlation with the mutual positions of the ILCT and the triplet states can be followed (vide supra). In particular, these energy states are located very close to each other in Zn16Ln(picHA)16 and in Zn16Ln(quinHA)16 while for other MCs, the energy of T1 is higher than the one of the ILCT state. On the basis of the values of ηsens, a high proximity in energy positions of T1 and ILCT should be preferred for the sensitization of the NIR-emitting YbIII, NdIII and ErIII. Finally, all these variations lead to the largest values of QLLn observed for Zn16Ln(quinHA)16 in the solid state.
Conclusions
In this work, we have extended the Zn16Ln(HA)16 ‘encapsulated sandwich’ family by creating MCs with two new ligands, naphthyridine- and quinoxaline-hydroximates. We have demonstrated how the nature of the hydroximate ligand impacts the photophysical properties of these MCs. In particular, by varying ligands from picoline-, pyrazine-, quinaldine-, naphthyridine- and quinoxaline-hydroximates, the low-energy ILCT bands present in the absorption spectra of Zn16Ln(HA)16 can be shifted from the UV to the visible range up to 510 nm and the corresponding maxima from 330 nm to 402 nm. MC scaffolds sensitize well the NIR characteristic emissions of YbIII, NdIII and ErIII ions in all studied Zn16Ln(HA)16 with total quantum yield values and observed luminescence lifetimes that are comparable to the highest values reported so far for LnIII coordination compounds. The extensive detailed analysis of the quantitative photophysical parameters revealed that the values of QLLn, QLnLn, ηsens and τobs depend on (i) the media, (ii) the nature of the LnIII ion and (iii) the hydroximate ligands. The values of τobs are the longest collected for Zn16Ln(HA)16 in deuterated solvents followed by those measured in the solid state and in protic solvents. Considering that no solvent molecule is directly coordinated to LnIII in solution, a negative effect of second-sphere non-radiative deactivation of LnIII ions induced by overtones of O–H and C–H vibrations is significant. For a specific LnIII ion, the measured values of QLLn are the highest for Zn16Yb(quinHA)16 and Zn16Nd(quinHA)16 in all media, for Zn16Er(quinHA)16 in the solid state and for Zn16Er(picHA)16 in solution. With few exceptions, the sensitization is more efficient in Zn16Ln(HA)16 samples in the solid state compared to the values measured in solutions and ηsens values as high as 100% are observed for Zn16Nd(picHA)16 and Zn16Nd(quinHA)16. Notably, for Zn16Ln(picHA)16 and Zn16Ln(quinHA)16, the energies of the triplet and the ILCT states are fairly similar (ΔE < 600 cm−1) while E(T1) is higher than E(ILCT) for other MCs. Despite the similarities of the coordination environments and symmetries around LnIII within the Zn16Ln(HA)16 family, radiative lifetimes of a specific LnIII ion are not constant and are largely affected by the nature of hydroximate ligand. Finally, having all of these comprehensive data in hand, it is possible to rationally design and create Zn16Ln(HA)16 with desired photophysical properties suitable for NIR imaging applications. More detailed studies that combine time-resolved measurements with theoretical calculations are required to finalize the precise assignment of energy levels and to obtain a deeper level of understanding of intricate energy transfer processes occurring in Zn16Ln(HA)16 which will be the subject of future reports.Author contributions
S. V. E.: conceptualization, photophysical data acquisition and analysis, writing – original draft, editing, funding acquisition; T. N. N.: conceptualization, synthesis and characterization, writing – review, editing; J. F. K.: crystallographic data acquisition; E. R. T.: synthesis and characterization, writing – review, editing; V. L. P.: conceptualization, supervision, funding acquisition, writing – review, editing; S. P.: conceptualization, funding acquisition, writing – review, editing.Data availability
The experimental data that support the findings of this study are provided in ESI† and available online or upon reasonable request from the corresponding authors.Conflicts of interest
There are no conflicts to declare.Acknowledgements
This research was supported in part by the National Science Foundation under grant CHE-1664964, La Ligue Contre le Cancer and La Région Centre-Val de Loire. S. P. acknowledges support from Institut National de la Santé et de la Recherche Médicale (INSERM).Notes and references
- S. He, J. Song, J. Qu and Z. Cheng, Chem. Soc. Rev., 2018, 47, 4258–4278 RSC.
- Kenry, Y. Duan and B. Liu, Adv. Mater., 2018, 30, e1802394 CrossRef CAS PubMed.
- Q. Miao and K. Pu, Adv. Mater., 2018, 30, e1801778 CrossRef PubMed.
- C. Wang, Z. Wang, T. Zhao, Y. Li, G. Huang, B. D. Sumer and J. Gao, Biomat, 2018, 157, 62–75 CrossRef CAS PubMed.
- Y. Fan and F. Zhang, Adv. Opt. Mater., 2019, 7, 1801417 CrossRef.
- I. Martinić, S. V. Eliseeva and S. Petoud, J. Lumin., 2017, 189, 19–43 CrossRef.
- Y. Y. Ning, M. L. Zhu and J. L. Zhang, Coord. Chem. Rev., 2019, 399, 213028 CrossRef CAS.
- J.-C. G. Bünzli and S. V. Eliseeva, J. Rare Earths, 2010, 28, 824–842 CrossRef.
- L. Wang, Z. Zhao, C. Wei, H. Wei, Z. Liu, Z. Bian and C. Huang, Adv. Opt. Mater., 2019, 7, 1801256 CrossRef.
- S. Comby and J.-C. G. Bünzli, in Handbook on the Physics and Chemistry of Rare Earths, ed. K. A. Gschneidner Jr, J.-C. G. Bünzli and V. K. Pecharsky, Elsevier Science B.V., Amsterdam, 2007, ch. 235, vol. 37, pp. 217–470 Search PubMed.
- J.-C. G. Bünzli and S. V. Eliseeva, in Comprehensive Inorganic Chemistry II, ed. V. W.-W. Yam, Elsevier B.V., Amsterdam, 2013, ch. 8.08, vol. 8, pp. 339–398 Search PubMed.
- J.-C. G. Bünzli and S. V. Eliseeva, in Springer Series on Fluorescence. Lanthanide Luminescence: Photophysical, Analytical and Biological Aspects, ed. P. Hänninen and H. Härmä, Springer Verlag, Berlin, 2011, vol. 7, pp. 1–45 Search PubMed.
- M. Latva, H. Takalo, V. M. Mukkala, C. Matachescu, J.-C. Rodriguez-Ubis and J. Kankare, J. Lumin., 1997, 75, 149–169 CrossRef CAS.
- R. D. Archer, H. Y. Chen and L. C. Thompson, Inorg. Chem., 1998, 37, 2089–2095 CrossRef CAS.
- S. Sato and M. Wada, Bull. Chem. Soc. Jpn., 1970, 43, 1955–1962 CrossRef CAS.
- M. H. V. Werts, R. H. Woudenberg, P. G. Emmerink, R. van Gassel, J. W. Hofstraat and J. W. Verhoeven, Angew. Chem., Int. Ed., 2000, 39, 4542–4544 CrossRef CAS PubMed.
- M. H. V. Werts, J. W. Hofstraat, F. A. J. Geurts and J. W. Verhoeven, Chem. Phys. Lett., 1997, 276, 196–201 CrossRef CAS.
- J.-Y. Hu, Y. Ning, Y.-S. Meng, J. Zhang, Z.-Y. Wu, S. Gao and J.-L. Zhang, Chem. Sci., 2017, 8, 2702–2709 RSC.
- Y. Y. Ning, J. Tang, Y. W. Liu, J. Jing, Y. S. Sun and J. L. Zhang, Chem. Sci., 2018, 9, 3742–3753 RSC.
- Z. Zhang, Y. Zhou, H. Li, T. Gao and P. Yan, Dalton Trans., 2019, 48, 4026–4034 RSC.
- I. Hernández and W. P. Gillin, in Handbook on the Physics and Chemistry of Rare Earths, ed. J.-C. G. Bünzli and V. K. Pecharsky, Elsevier, 2015, ch. 269, vol. 47, pp. 1–100 Search PubMed.
- G. Mancino, A. J. Ferguson, A. Beeby, N. J. Long and T. S. Jones, J. Am. Chem. Soc., 2005, 127, 524–525 CrossRef CAS PubMed.
- W. Wu, X. Zhang, A. Y. Kornienko, G. A. Kumar, D. Yu, T. J. Emge, R. E. Riman and J. G. Brennan, Inorg. Chem., 2018, 57, 1912–1918 CrossRef CAS PubMed.
- C. Bischof, J. Wahsner, J. Scholten, S. Trosien and M. Seitz, J. Am. Chem. Soc., 2010, 132, 14334–14335 CrossRef CAS PubMed.
- C. Doffek, N. Alzakhem, M. Molon and M. Seitz, Inorg. Chem., 2012, 51, 4539–4545 CrossRef CAS PubMed.
- M. F. K. Trautnitz, C. Doffek and M. Seitz, ChemPhysChem, 2019, 20, 2179–2186 CrossRef CAS PubMed.
- D. Davis, A. J. Carrod, Z. Guo, B. M. Kariuki, Y.-Z. Zhang and Z. Pikramenou, Inorg. Chem., 2019, 58, 13268–13275 CrossRef CAS PubMed.
- P. B. Glover, A. P. Bassett, P. Nockemann, B. M. Kariuki, R. Van Deun and Z. Pikramenou, Chem.–Eur. J., 2007, 13, 6308–6320 CrossRef CAS PubMed.
- J.-C. G. Bünzli, A.-S. Chauvin, H. K. Kim, E. Deiters and S. V. Eliseeva, Coord. Chem. Rev., 2010, 254, 2623–2633 CrossRef.
- C. Doffek and M. Seitz, Angew. Chem., Int. Ed., 2015, 54, 9719–9721 CrossRef CAS PubMed.
- S. V. Eliseeva, D. N. Pleshkov, K. A. Lyssenko, L. S. Lepnev, J.-C. G. Bünzli and N. P. Kuzmina, Inorg. Chem., 2011, 50, 5137–5144 CrossRef CAS PubMed.
- E. R. Trivedi, S. V. Eliseeva, J. Jankolovits, M. M. Olmstead, S. Petoud and V. L. Pecoraro, J. Am. Chem. Soc., 2014, 136, 1526–1534 CrossRef CAS PubMed.
- J. Jankolovits, C. M. Andolina, J. W. Kampf, K. N. Raymond and V. L. Pecoraro, Angew. Chem., Int. Ed., 2011, 50, 9660–9664 CrossRef CAS PubMed.
- C. Y. Chow, S. V. Eliseeva, E. R. Trivedi, T. N. Nguyen, J. W. Kampf, S. Petoud and V. L. Pecoraro, J. Am. Chem. Soc., 2016, 138, 5100–5109 CrossRef CAS PubMed.
- J. C. Lutter, S. V. Eliseeva, J. W. Kampf, S. Petoud and V. L. Pecoraro, Chem.–Eur. J., 2018, 24, 10773–10783 CrossRef CAS PubMed.
- T. N. Nguyen, C. Y. Chow, S. V. Eliseeva, E. R. Trivedi, J. W. Kampf, I. Martinić, S. Petoud and V. L. Pecoraro, Chem.–Eur. J., 2018, 5, 1031–1035 CrossRef PubMed.
- I. Martinić, S. V. Eliseeva, T. N. Nguyen, V. L. Pecoraro and S. Petoud, J. Am. Chem. Soc., 2017, 139, 8388–8391 CrossRef PubMed.
- I. Martinić, S. V. Eliseeva, T. N. Nguyen, F. Foucher, D. Gosset, F. Westall, V. L. Pecoraro and S. Petoud, Chem. Sci., 2017, 8, 6042–6050 RSC.
- G. Mezei, C. M. Zaleski and V. L. Pecoraro, Chem. Rev., 2007, 107, 4933–5003 CrossRef CAS PubMed.
- G. Sheldrick, Acta Crystallogr., 2015, C71, 3–8 CrossRef PubMed.
- A. Spek, Acta Crystallogr., 2015, C71, 9–18 Search PubMed.
- K. K. Innes, I. G. Ross and W. R. Moomaw, J. Mol. Spectrosc., 1988, 132, 492–544 CrossRef CAS.
- J.-C. G. Bünzli, Coord. Chem. Rev., 2015, 293–294, 19–47 CrossRef.
- W. S. Lo, W. T. Wong and G. L. Law, RSC Adv., 2016, 6, 74100–74109 RSC.
- Y. Hasegawa, Y. Kitagawa and T. Nakanishi, NPG Asia Mater., 2018, 10, 52–70 CrossRef CAS.
- A. D'Aleo, F. Pointillart, L. Ouahab, C. Andraud and O. Maury, Coord. Chem. Rev., 2012, 256, 1604–1620 CrossRef.
- W. T. Carnall, P. R. Fields and K. Rajnak, J. Chem. Phys., 1968, 49, 4443–4446 CrossRef CAS.
- H. Wei, Z. Zhao, C. Wei, G. Yu, Z. Liu, B. Zhang, J. Bian, Z. Bian and C. Huang, Adv. Funct. Mater., 2016, 26, 2085–2096 CrossRef CAS.
- M. Ganapathi, S. V. Eliseeva, N. R. Brooks, D. Soccol, J. Fransaer and K. Binnemans, J. Mater. Chem., 2012, 22, 5514–5522 RSC.
- A. Beeby, I. M. Clarkson, R. S. Dickins, S. Faulkner, D. Parker, L. Royle, A. S. de Sousa, J. A. G. Williams and M. Woods, J. Chem. Soc., Perkin Trans. 2, 1999, 493–503 RSC.
- S. Faulkner, A. Beeby, M.-C. Carrié, A. Dadabhoy, A. M. Kenwright and P. G. Sammes, Inorg. Chem. Commun., 2001, 4, 187–190 CrossRef CAS.
- M. H. V. Werts, R. T. F. Jukes and J. W. Verhoeven, Phys. Chem. Chem. Phys., 2002, 4, 1542–1548 RSC.
Footnotes |
| † Electronic supplementary information (ESI) available: 1H- and 13C NMR spectra, mass spectra, crystallographic parameters, including cif files, absorption and phosphorescence spectra, supplementary tables with photophysical parameters. CCDC 19988811998882. For ESI and crystallographic data in CIF or other electronic format see DOI: 10.1039/d1sc06769a |
| ‡ These authors contributed equally. |
| § Current address: Helen Scientific Research and Technological Development Co., Ltd, Ho Chi Minh City, Vietnam. |
| ¶ Current address: Department of Chemistry, Oakland University, Rochester, Michigan 48309, USA. |
| This journal is © The Royal Society of Chemistry 2022 |