 Open Access Article
Can super-resolution microscopy become a standard characterization technique for materials chemistry?
Shikha
Dhiman
 ab,
Teodora
Andrian
 c,
Beatriz Santiago
Gonzalez
d,
Marrit M. E.
Tholen
 d,
Yuyang
Wang
 be and
Lorenzo
Albertazzi
 *cd
*cd
aLaboratory of Macromolecular and Organic Chemistry, Eindhoven University of Technology, P. O. Box 513, 5600 MB Eindhoven, The Netherlands
bInstitute for Complex Molecular Systems, Eindhoven University of Technology, P. O. Box 513, 5600 MB Eindhoven, The Netherlands
cInstitute of Bioengineering of Catalonia (IBEC), Barcelona Institute of Science and Technology, Barcelona, Spain
dDepartment of Biomedical Engineering, Institute of Complex Molecular Systems, Eindhoven University of Technology, Eindhoven, The Netherlands. E-mail: l.albertazzi@tue.nl
eDepartment of Applied Physics, Eindhoven University of Technology, Postbus 513, 5600 MB Eindhoven, The Netherlands
First published on 1st December 2021
Abstract
The characterization of newly synthesized materials is a cornerstone of all chemistry and nanotechnology laboratories. For this purpose, a wide array of analytical techniques have been standardized and are used routinely by laboratories across the globe. With these methods we can understand the structure, dynamics and function of novel molecular architectures and their relations with the desired performance, guiding the development of the next generation of materials. Moreover, one of the challenges in materials chemistry is the lack of reproducibility due to improper publishing of the sample preparation protocol. In this context, the recent adoption of the reporting standard MIRIBEL (Minimum Information Reporting in Bio–Nano Experimental Literature) for material characterization and details of experimental protocols aims to provide complete, reproducible and reliable sample preparation for the scientific community. Thus, MIRIBEL should be immediately adopted in publications by scientific journals to overcome this challenge. Besides current standard spectroscopy and microscopy techniques, there is a constant development of novel technologies that aim to help chemists unveil the structure of complex materials. Among them super-resolution microscopy (SRM), an optical technique that bypasses the diffraction limit of light, has facilitated the study of synthetic materials with multicolor ability and minimal invasiveness at nanometric resolution. Although still in its infancy, the potential of SRM to unveil the structure, dynamics and function of complex synthetic architectures has been highlighted in pioneering reports during the last few years. Currently, SRM is a sophisticated technique with many challenges in sample preparation, data analysis, environmental control and automation, and moreover the instrumentation is still expensive. Therefore, SRM is currently limited to expert users and is not implemented in characterization routines. This perspective discusses the potential of SRM to transition from a niche technique to a standard routine method for material characterization. We propose a roadmap for the necessary developments required for this purpose based on a collaborative effort from scientists and engineers across disciplines.
Introduction
Super-resolution optical microscopy (SRM), or nanoscopy, a family of optical methods able to bypass the Abbe's diffraction limit of light,1,2 represented a breakthrough in the imaging field. While SRM initially found its main application in cell biology for the study of subcellular structures, recently its impact became very significant also in chemistry, materials science and nanotechnology.3 The minimal invasiveness of this technique aids to visualize molecular structures and processes at nanometric resolution in operando, thereby unveiling unprecedented insights in numerous fields, including supramolecular chemistry,4–12 plasmonics,13–18 catalysis,19–25 polymer chemistry,26,27 and biomaterials.28–30 Although still in its infancy, the potential of SRM has intrigued scientists across various disciplines during the last few years as highlighted by pioneering reports and reviews on SRM.29,31,32 At present, SRM is on the radar of chemists interested in the detailed characterization of their materials but its use is far from that of standard methods such as nuclear magnetic resonance (NMR), high performance liquid chromatography (HPLC), and electron microscopy (EM). The main reason for this is that SRM is still a sophisticated technique that poses several challenges to users due to lack of standardization in terms of sample preparation, analysis, environmental control and automation.In this perspective, we shall discuss the crucial question for the development of SRM in the field of materials: “can SRM become a standardized routine analytical technique in the fields of chemistry and materials chemistry?”. The development pathways of other routine methods such as atomic force microscopy (AFM), electron microscopy (EM) and light scattering will be a source of inspiration and benchmarking. Thereafter, we shall provide a roadmap for the necessary developments required in SRM during the next decade for its application as a routine measurement technique for characterization of materials and the challenges along this path.
Why super-resolution microscopy?
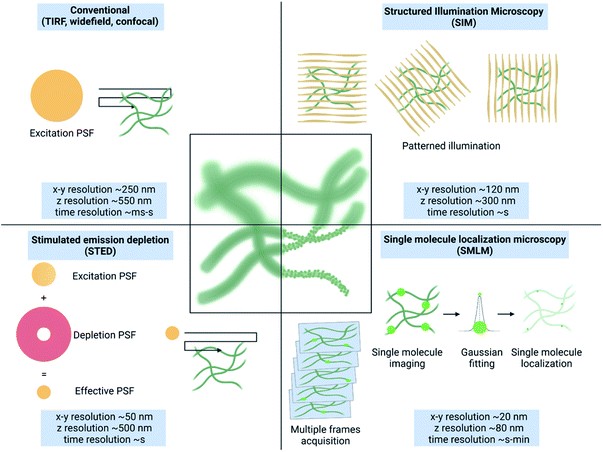
The structure and dynamics of a material are highly correlated with its functions. The rational design of a material for advanced applications requires critical understanding of its structure and dynamics that can cue the necessary adjustments. The escalating interest in complex architectures such as multicomponent systems, hierarchical structures, intricate 3-dimensional frameworks and corresponding complex dynamics is challenging to demystify with spectroscopy and microscopy techniques such as EM, AFM and FM.33Owing to the difference in the underlying principle, operational requirements, method of preparation and the output, all these techniques exhibit their advantages and intrinsic limitations. AFM34 and EM33 both can spatially resolve structures in the nanometric regime without any labelling requirement. However, it is challenging to study the structure of samples under native conditions as these techniques require invasive sample preparation methods such as drying or freezing that can destroy/alter the sample itself. Moreover, due to the limited penetration through the sample, only surface or thin sections can be analysed and it is impossible to deconvolute a multicomponent system. Overcoming this issue, FM allows multicolour imaging under native conditions using different molecular labels and facilitates study of dynamics and changes in real-time.35 However, this heavily costs the spatial resolution (∼200 nm) due to the diffraction limit of light (Fig. 1).
This contrast brings us to two conclusions: (i) there is always a need for multiple microscopy and spectroscopy techniques to provide a conclusive understanding of the structure, dynamics, and function; (ii) there is a gap between high-resolution (∼1 nm) label-free methods and lower-resolution multicolour and molecular specific methods. SRM can strongly contribute in this regard offering additional possibilities such as: (i) nanometric spatial resolution (5–25 nm), (ii) native or mild sample conditions, (iii) 3D molecular architecture resolution, (iv) multicolour imaging, (v) possible real-time study of dynamics, and (vi) quantitative molecular analysis.
Based on their approach to overcome the diffraction limit, there are three major types of SRM methods: structured illumination microscopy (SIM), stimulated emission depletion (STED) microscopy and single-molecule localization microscopy (SMLM) (Fig. 1).36 An extensive description of the principles of these techniques is provided elsewhere.1,3
Due to their principles different SRM methods present advantages and disadvantages. SIM relies on mathematical deconvolution of interference patterns (Moiré's effect) generated by spatially structured illumination patterns.37,38 A resultant spatial and temporal resolution of ∼120 nm and few seconds, respectively is achievable.39 Therefore, despite the limited gain in resolution, SIM provides faster and the least invasive sub-diffraction imaging, making it ideal for sensitive and dynamic samples.
STED uses a donut shaped illumination beam with an interior excitation laser and exterior depletion laser.40,41 This reduces the effective point spread function (PSF) of illumination, thereby enhancing the spatial resolution to ∼50 nm.42 STED provides excellent spatial resolution in a reasonable time (seconds) and requires minimal postprocessing, which makes it very appealing for a variety of samples, with the limitation of the very high power used that may result in sample damage and photobleaching. Lastly, SMLM relies on accurate localization of individual fluorophore emission achieved by the stochastic activation of dyes in wide-field illumination.43,44 With extensive postprocessing all the molecules in the sample are identified and their x, y, and z positions are identified with nanometric precision resulting in a diffraction-unlimited image. Resolution down to few nanometers is possible at the cost of slow temporal resolution compared to SIM and STED.45,46 Based on the process of dye activation, SMLM methods are further referred to as stochastic optical reconstruction microscopy (STORM),47 (direct) stochastic optical reconstruction microscopy (d(STORM)),48 photoactivated localization microscopy (PALM),49 and point accumulation for imaging in nanoscale topography (PAINT).50 These three SRM methods and their use to study complex synthetic materials and nanomedicine are extensively discussed in previous reviews.3,29,30
Contrasting computational post-processing super-resolution techniques are alternately used to overcome the diffraction limit by analyzing random fluctuations of single fluorophore signals. One of these is super-resolution optical fluctuation imaging (SOFI) that is fundamentally a post-processing method to generate super-resolved images from diffraction-limited image time series from a microscopy measurement. SOFI relies on high-order statistical analysis of temporal fluctuations recorded in a sequence of images.51 Since fluorescence signals coming from a fluctuating emitter show statistically similar behavior over time, their autocorrelation displays a high value, whereas those from the background remain uncorrelated and show a low value. SOFI is a pure software technique that is a strong alternative to SMLM-type of localization analysis.52 Following a similar principle, super-resolution radial fluctuation (SRRF) as an improved analysis framework has been developed to tackle the non-linear response to brightness in high-order correlations, and has shown to resolve SMLM data with a resolution of at least 50 nm that is comparable to localization-based SMLM analysis.53 Compared to localization analysis, SOFI tolerates a larger quantity of emitters in a diffraction-limited spot, lower SNRs, and a higher framerate and can be readily applied to time series data from any microscopy measurement.
Overall, SRM is an ideal bridge between AFM/EM and diffraction-limited optical methods (e.g. confocal) with clear potential to serve material characterization. Notably, the contrasting advantages and limitations of these microscopy techniques have led to the correlative imaging of the system to probe the target area, either simultaneously or in tandem to access maximum information about the structure, dynamics, and functions.
Correlative microscopy using a combination of light with electron microscopy (CLEM), light with AFM and more recently (cryo)-electron with SRM has been demonstrated to unveil oversights or add a new dimension of information, compared to the use of a single technique.54–56 The new opportunity of using correlative microscopy comes with its own challenges to combine contrasting techniques in terms of sample preparation and setups, but the field is advancing to overcome these limitations.57
What makes a characterization technique successful?
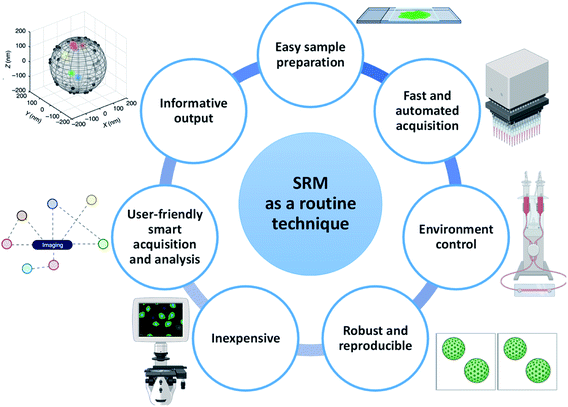
In a chemistry or materials laboratory, daily characterization of materials is performed using routine techniques such as NMR, DLS, UV/vis spectroscopy, EM, FM and nanoparticle tracking analysis58 (NTA). These techniques have several things in common that make them effective and informative to use: (i) they have an easy and optimized sample preparation protocol, (ii) they provide informative output, (iii) they are robust and provide reproducible results, (iv) they allow the characterization to be performed in a controlled environment, (v) they are often fast and/or automated, (vi) they are equipped with user-friendly software with smart data acquisition and analysis and (vii) they are (often) inexpensive (Fig. 2).Although SRM proved to be able to provide important information, many of these characteristics are either partially present or still challenging to achieve. Hence, a multitude of developments in various aspects of engineering and chemistry are required to promote SRM from a sophisticated to a routine technique. We discuss these features in detail below. In light of the wider literature and its ability to provide molecular information with maximal resolution, this perspective will mostly focus on SMLM. However, we do not exclude that SIM and STED also may be able to play an important role in the future.
Sample preparation
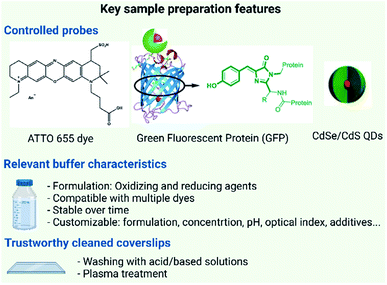
The performance of SMLM is determined by the precise localization of individual fluorophores in the sample. The localization of individual fluorophores is directly influenced by the photophysical properties i.e. switching “on” and “off”, brightness and photostability of the fluorophore59 and in some cases by the binding affinity of fluorescent probes. In practical terms three main issues have to be addressed for the sample preparation of materials: (i) the choice of a dye/probe with optimal photophysical properties; (ii) the optimization of the buffer/media for the measurement and (iii) the ideal surface for material capture and immobilization.The extensive interest in SRM has triggered the development of a plethora of organic dyes fulfilling SMLM requirements, and many of them are now commercially available. The material of interest can be covalently or non-covalently functionalized with these labels.42 More recently, new nanoparticle-based probes such as quantum dots, carbon dots, or upconversion nanoparticles have shown great promise for imaging due to their remarkable photostability and brightness (Fig. 3).60,61
Despite the plentiful options of available dyes, several challenges are hampering the streamlined labelling of synthetic samples. Interestingly, many of them are not encountered in biological samples. Firstly, many materials may be perturbed by some of the labels due to dye hydrophobicity or charge. This is particularly true for supramolecular materials as dyes can interfere with the self-assembly process. Secondly, the chemical nature of the material of interest can perturb the performance of the dyes by changing their surrounding environment. Therefore, it doesn't come as a surprise that dyes which are known to generally perform well for SMLM can give suboptimal results for specific materials while mediocre SMLM dyes can be very suitable for others. Therefore, a general workflow for labelling synthetic materials is still to be defined.
On the other hand, the use of buffer formulations, where intermolecular reactions of dyes with external additives such as thiols, ascorbic acid and metal ions are used, has a strong influence on dye properties and therefore on their performance. Buffers are known to influence both the photoswitching behaviour of STORM dyes and the binding kinetics of PAINT imagers. This has been exhaustively studied by Dempsey et al.62 where they tested 26 organic dyes in different buffers. However, the dyes were studied only in a biological environment. In this context, more in-depth investigations tailored on materials to elucidate physical mechanisms behind the photoswitching process are still needed to improve the buffer impact on dye-labelled materials.63
Besides the composition, the preparation and stability of the buffer formulations are other important factors that make the sample preparation protocol lengthy and tedious.64 The buffer formulations usually need to be freshly prepared before each measurement causing possible errors and variations in different measurements. Recently, a few formulations with long shelf stability or quick buffer preparations have been proposed, and some of them are already commercially available.65,66
An interesting approach that can further alleviate the influence of imaging conditions for controlling the photoswitching of dyes is to use spontaneously blinking probes, where there is neither any need of special buffers nor of high-power laser irradiations (∼1 kW cm−2) typically needed for the photoswitching process.62,67,68 Accordingly, we also envision great potential for label-free techniques in this area, e.g. Raman scattering, optical absorption and nonlinear response of thermoreflectance.69,70,72
Finally, one should not forget the importance of using impurity-free and background-free coverslips for the sample preparation. Typically, coverslips can be contaminated with a grease film or dust particles that need to be removed to promote the attachment of the sample to the glass avoiding any non-specific interactions and reducing the background noise due to fluorescent impurities. Furthermore, specific coating to favour the physisorption of the materials of interest can be used.71 For a routine characterization use, it is not acceptable to spend days to find the right surface chemistry to achieve sample immobilization (as it often happens now for new samples) and a universal ready-to-use sample chamber is part of the necessary developments towards a SRM characterization workflow. The recent acceptance of the reporting standard MIRIBEL (Minimum Information Reporting in Bio–Nano Experimental Literature) for material characterization and detailed experimental protocols aims to provide complete, reproducible and reliable sample preparation. The adoption of MIRIBEL as a mandatory requirement for publication will ease the challenges in reproducing experiments and facilitate smooth advancement of scientific research.72–74
Overall, for SMLM to become a routine technique, we need a collective effort from synthetic organic chemists for dye synthesis, and microscopists and nanotechnologists to optimize methods for sample preparation. The focus should be to make this crucial step easier, quicker and more global for a broader research community and variability of samples.
Informative and quantitative output
SMLM can be used to characterize a plethora of important material characteristics.3,29 This type of microscopy is particularly useful in samples where information about structural variations such as the morphology, homogeneity and extent of functionalization, at the single particle level is needed (Fig. 4).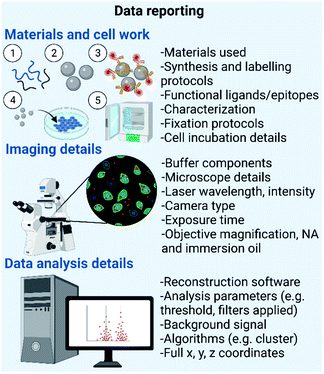 | ||
| Fig. 4 Data reporting needed for different types of synthetic materials. Created by https://Biorender.com. | ||
We can identify two types of typical readouts: morphological features (e.g. size and shape) and molecule counting/localization. While the first type of information is also provided by other techniques such as DLS, TEM or AFM, the latter is unique to SMLM thanks to single molecule sensitivity and specific labelling.
Currently, ensemble methods such as western blot, BCA assay and ζ-potential are used as indicators for changes in surface physical features and biomolecule functionalization of materials.75–79 By using STORM or DNA-PAINT, these characteristics can be resolved on the single molecule level. Later, counting of integer numbers of molecules can be achieved. In this framework an ideal technique is qPAINT, which is based on predictable kinetics of the transient binding of a dye-labelled imager and docking strands. With this kinetic information, the number of target molecules can be calculated, avoiding issues related to dye photophysics and photobleaching. Since both STORM and DNA-PAINT allow for multicolour imaging, the number and distribution of multiple different functionalities can be quantified on both the intra- and interparticle level.24,71,72 Moreover, 3D visualization of materials is possible, which could provide additional information with respect to standard analysis techniques.80
When discussing material characterization, spectroscopy also plays a pivotal role. The combination of fluorescence spectroscopy and sensor probes allows important properties to be measured such as polarity, viscosity and local pH. Recently, a combination of SMLM with spectroscopy has been proposed and named spectral SMLM (sSMLM). Nile Red (NR) is the most used probe to show the capacities of sPAINT.81 NR is a polarity-sensitive dye and exhibits a unique spectral variation upon binding to particles, which allows nonspecific binding events to be reduced on the surface of the particle. This reduces variations in size measurements, improving the localization density and resolution providing a spectroscopic evaluation of polarity at the same time.81,82 The use of 3D sPAINT imaging even allows the determination of local polarity of a material in 3-dimensions.83
As discussed before, correlative microscopy combining SRM with EM/AFM, can unveil new information about the samples combining the quantitative readouts of multiple techniques. Recently, it has been shown that TEM and SMLM can be combined into a super-resCLEM workflow, to obtain additional information about heterogeneity in a PLGA–PEG based nanoparticle system, functionalized with ssDNA.84 Remarkably, a high level of heterogeneity in both the size and ligand distribution in a single batch was found. Consequently, this results in varied outcomes in therapeutic efficacy of different particles within the same batch.84 The ability to combine SRM with spectroscopy and other imaging techniques paves the way towards the multiparametric imaging of materials at the single particle level, providing multiple informative and quantitative readouts that can be utilized for optimization of the synthetic route.85–87
Robust and reproducible
For SMLM to be a reliable routine characterization technique, it must be robust, meaning it should have the ability to obtain high quality images without being compromised by small changes of the many parameters and measuring conditions.Among several challenges for accomplishing this, the suppression of varied roots of errors, seems to offer significant promise to accelerate this transition. One of them is the susceptibility to aberrations,88 which is particularly detrimental for imaging thick samples, such as supramolecular 3D scaffolds. A possible approach for mitigating this problem is the introduction of adaptive optics, using for example deformable mirror devices to compensate refractive index changes.89 Another source of misleading data acquisition is mislocalization,90 where the actual emitter position detected is deviated from the actual emission due to the coupling of the dye to a plasmonic nanoparticle, compromising the accuracy of super-resolution imaging in plasmon-enhanced fluorescence microscopy.
Moreover, an additional limitation is the localization precision that depends on many factors typically related to the signal-to-noise ratio and it will be different from lab to lab. It is therefore particularly important to measure brightness and photophysical properties of single dyes in the sample and always report this data.
Finally, we also foresee a further dramatic increase in ready-to-use software for data analysis,91 and online research data platforms92 easing complex analysis workflows and enabling anyone to use advanced algorithms.
In order to enhance the reproducibility of SRM data, the standardization of protocols and the complete reporting of the experimental conditions are crucial as already discussed in several texts such as the ‘Nanotechnology Standards’93 and MIRIBEL standards.94 Furthermore, extensive protocols by pioneering groups would greatly help novice and even expert researchers to adopt SMLM protocols as part of routine research, expanding their use between nanomaterial research groups.50
Fig. 4 summarizes the data reporting needed for different types of materials. Briefly, there are certain fundamental parameters that should be reported – firstly, details of materials used for nanomaterial formulation, synthesis and labelling protocols, information on ligands, epitopes and fluorophores used, and complementary physicochemical characterization details, as thoroughly outlined in the MIRIBEL standards. Secondly, microscope imaging details such as buffer components, microscope details, laser wavelength and intensity, camera type, exposure time and objective details (e.g. magnification, numerical aperture, and immersion oil).50 Lastly, data analysis details including data reconstruction software, analysis parameters (e.g. threshold and filters applied), controls such as background signal without the presence of nanomaterials, algorithms used for data analysis and full x, y, and z coordinates.44,50 Maintaining consistency of these protocols and parameters between research laboratories would ensure that results arising from SMLM analysis of bio–nano interactions are reproducible and reliable, and valuable among the scientific community.
To improve the reproducibility of SMLM systems, test and calibration procedures are required prior to starting a new experiment, to ensure optimal system performance and quantitative analysis.95 NPs such as microspheres, and commercially available origami test samples such as GATTAquant slides are used for SRM 2D and 3D validation procedures.95–101 Similarly, software packages that allow analysis, visualization and quantification of SMLM images must also be validated. These systems can influence the data output, and generally use different parameters and terminologies, making the selection of an optimal software difficult for the end user. Various commonly used packages such as ThunderSTORM,99 rapidSTORM,100 simpleSTORM,101 and quickPALM102 have been tested and compared using realistic simulated data, permitting researchers to pinpoint optimal analysis software for their experiments.103,104 The implementation of standardized and user-friendly SMLM protocols and software packages will ensure that the results between different laboratories are comparable, and that scientists get the best information out of their imaging data.
Fast and automated
Fast and high-throughput analysis methods are vital to achieve unbiased characterization and statistically significant understanding of nanomaterials. This is particularly important for imaging methods where only a small subset of the sample is measured at a time. To achieve this, imaging must be fast and automated or with as little input from the user as possible. However, low throughput and slow imaging times have been major limitations of SMLM techniques, restricting their use where a large a number of samples need to be analysed (e.g. analytical chemistry facility). Fortunately, we are seeing a great effort among microscopists to improve these limitations, through increased field-of-view (FOV) and frame rates, and faster and greater multiplexing capabilities and automated protocols, amongst others, as described below.Firstly, through the rapid development of scientific CMOS (sCMOS) cameras, we have witnessed an improvement in the imaging FOV from ∼50 × 50 μm2 to ∼500 × 500 μm2 and frame rates from ∼30 fps to 400 fps as compared to electron-multiplying charge-coupled devices (EM-CCD).105,106
Secondly, the choice of fluorophores plays a crucial part in (d)STORM and (f)PALM. Photophysical properties, such as the number of photons detected per switching event and the laser power intensity can affect the time the fluorophore spends in the “on” state,62 thus switching events with high photon numbers improve the optical resolution obtained. DNA-PAINT, based on the transient binding and unbinding between complementary fluorophore-labelled imager strands and target-bound docking strands, achieves programmable dye interactions and is independent of the number of dyes used. However, it suffers from a slow image acquisition speed which can last several hours for ultra-resolution imaging (<5 nm).107 However, we have recently seen a 10× speed increase in DNA-PAINT image acquisition without sacrificing the advantages of the technique such as 1 mm2 area in 8 hours, by careful optimization of the oligonucleotide sequence and buffer conditions, paving the way for relatively fast high-throughput studies.108
Thirdly, high-throughput imaging can be achieved by simultaneously imaging multiple targets, i.e. multiplexing. In STORM and PALM this is achieved by using fixed labels (dyes attached to structures of interest) with minimal spectral overlap to give low cross-talk.62,109 For example, 2-colour dSTORM has been used to study the intracellular trafficking of siRNA—loaded polyplexes,110 polystyrene NPs111 and DNA-loaded polyplexes, and the stability of mesoporous silica NPs112 and polyplexes113 in serum, highlighting its potential in unveiling intracellular trafficking and drug delivery in nanomedicine. However, although this is a fairly easy protocol, it is limited by the availability of fluorescent probes with distinct emission spectra, which in most cases is three or four dyes.62 Newer approaches have been implemented such as maS3TORM (Fig. 5), which uses multiplex automated serial staining114,115 or quenching.116
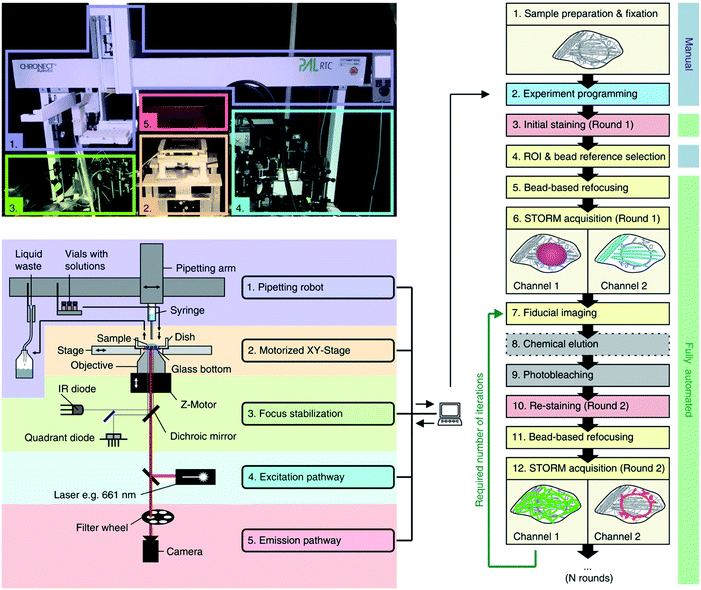 | ||
| Fig. 5 Automated maS3TORM setup and workflow indicating photographic (upper left panel), and schematic outlines (lower left panel) and experimental details for an automated multiplex system (right panel). Reused with permission from ref. 115. | ||
In contrast, in exchange-PAINT the same dye and laser are used to image all structures of interest. This eliminates the need for spectrally different dyes since multiplexing is only limited by the number of available docking strand sequences. This approach was applied to polystyrene NPs to study the intraparticle distribution in biofunctionalization of different antibodies on the NP surface.
Its multiplexing ability has also been demonstrated in 10 colours on DNA origami and in 4 colours on fixed cells,117 and more recently a method based on barcoding and precisely engineered blinking kinetics allowed 124-colour multiplexing in vitro and in situ within minutes.118 Depending on the question being answered, with further development towards the automation of this technique, we may see the use of exchange-PAINT as a standard tool for studying nanomaterials in complex biomolecular systems.
A convergent method is high content screening SMLM (HCS-SMLM) which provides an automated microscope for data acquisition, data extraction and analysis, and is able to achieve 3D imaging of a whole 96-well plate and about 100 cells within a maximum of 10 hours by dSTORM. HCS-DNA-PAINT would allow the quantification at the molecular level, but large-scale screening is still greatly limited by time requirements. Potentially, with some implementations such as optimized blinking kinetics, the application of this versatile HC-SMLM system in drug screening could allow the study of the effects of various nanomaterials and drugs with nanoscale resolution on the organization and dynamics of target proteins.119
User friendly software with smart acquisition and analysis
The development of highly specialized optomechanical hardware needs accompanying software ecosystems, to coordinate acquisition, instrument control and data analysis. Various software in SRM are employed to perform (semi)-automated tasks ranging from camera acquisition to image processing. Tailored SRM software with constantly evolving functionalities alleviates the complexity of using advanced imaging techniques, greatly reducing the learning cost for users, and making SRM an ever more accessible and routine imaging technique.In this section, we discuss key attributes of data acquisition and analysis software that will help transform SRM into a routine technique. For microscope control/data acquisition software, we propose that the speed and performance, hardware compatibility, flexibility in data manipulation, and user-friendly interface are key aspects, while for data analysis software, we highlight the efficiency and accuracy in extracting quantitative information from large image data. For both control and analysis software, we point out the advantage of fully harnessing the power of community contributions, meaning that open-source programs are essential. To be able to enjoy the benefit of the frontiers of data science, it is ideal for software to be in an accessible form or written in popular and community-driven computer languages exemplified by recent trends of development using Python and R.
Scientific cameras and commercial super-resolution microscopes are usually equipped with closed-source control and acquisition software. A review of standard commercial software is covered in more exhaustive books or reviews.120 These commercial programs are efficient and beginner-friendly when used in combination with the corresponding hardware. However, they lack the ability to coordinately control multiple instruments in the same imaging system in one graphical user interface (GUI). National Instrument's LabVIEW is the most popular choice for coordinated instrument control but it is however still proprietary and closed software.
For SRM to transform into a routine technique, in addition to closed software, we believe that lightweight and cost-friendly, yet powerful solutions will play an indispensable role. Multiple open source and research-driven programs are emerging as commercial alternatives, and some are even specialized in SRM. μManager is a free open-source program for microscope control with a wide range of hardware support and a sizable community of users.121 μManager as an ImageJ plug-in is designed for microscope control in general, but due to its openness, plug-ins and functionalities for SRM have been developed.122 Tormenta and Python Microscope Environment (PyME)123 developed in Python are fully-fledged software environments equipped with key features including full synchronization of microscope hardware, and also the support for localization-based SRM.124 They are advantageous due to the addition of even more flexibile and bigger community support due to Python, and have become reliable and efficient SRM software. Pycro-manager written in Python has recently been emerging as a powerful environment that combines the strengths of both Python and μManager by combining existing functionalities of μManager directly in Python.125 Pycro-manager allows the user to exploit the strong computation capabilities by using Python libraries such as NumPy and SciPy, and brings state-of-art development in machine learning into the loop.126,127
In SRM, especially SMLM, data analysis is a complex process and is one of the most limiting factors for SRM new users. It is a daunting task, in general, for a novice to do the jobs in data analysis from choosing the right statistical method and parameters to proper visualization and rendering of a bioimage for unbiased interpretation of the results.128 Typical SMLM analysis can be divided into two parts: Gaussian fit for molecule localization and post fit localization analysis. Gaussian fit determines the brightness, location and time of detection needed to interpret single molecule images and kinetics, whereas post fit localization involving density-based segmentation and cluster analysis reveals super-resolved features of the sample.129 An ideal software environment in a routine SRM measurement should be therefore able to first efficiently and accurately localize a single molecule from raw images, quantitatively interpret the results with high-performance using correct statistical models, and then provide high quality data visualizations, preferably all in a user-friendly GUI.
While there are closed source software bundles in commercial SRM systems, we envision that open source SRM software developed by the research community will bring more impact and continuing progress of routine SRM techniques. This is mainly because in quantitative SRM data analysis, it is often essential to fully control and test parameter choices to make sure that the reconstructed image yields reproducible and robust interpretations. This full control is usually not possible with commercial software environments that hide processing steps in black boxes hampering the accessibility to manageable software. For materials chemists, tailoring the analysis for a range of different materials to extract specific and many features is crucial.
High-performance SMLM analysis software packages as ImageJ plugins include Thunderstorm,130 and NanoJ131 for example, whereas more exhaustive reviews with longer lists can be found.132,133 These plugins are well integrated in ImageJ which itself is a fully-featured image processing tool, and allows non-expert users to start SRM analysis with a few clicks while keeping parameter choices easily accessible. In other programming languages, SMAP (Super-resolution microscopy analysis platform) in MATLAB,134 Picasso in Python,135 and SMoLR (Single Molecule Localization in R) in R136 have emerged as fully functional SRM software packages that can independently perform all steps of analysis with high efficiency and performance. These many software packages have been extensively benchmarked, and will continue to be examined by the ever-increasing SRM community to keep improving.133
We envision that the boundary between data acquisition and analysis software will be finally broken, and a single set of the SRM software package that is compatible with multiple SRM modalities will be a major part of routine SRM techniques. In general, the conventional approach of data acquisition and analysis is a two-step process where an extensive optimization of acquisition parameters is manually tested prior to imaging. This is a tedious process and may contribute to irreproducible data even by using the same parameters as they are highly influenced by physical parameters such as laser power, stage balance, etc. Therefore, a smart software that can optimize the data acquisition parameters by simultaneously analyzing the acquired data for achieving the best possible results is needed. Recent approaches of using machine learning for these purposes can create a fully automated system that can acquire better quality images.137,138 A complex technique such as SRM can only become routine, if the user can easily acquire and analyze high quality data. Although most of the existing SRM software packages are designed for biological samples, we envision that dedicated functionality will be developed for materials science as well.
Environmental control
Environment control is an important factor in realizing specific experimental designs of SRM that involve environment sensitive materials that may degrade or change properties at a certain humidity, O2 concentration or under certain temperature conditions. Like in conventional live-cell imaging, temperature, humidity, CO2 concentration, and pH levels are essential to keep the cells viable during measurement,139 similar cautions have to be taken for synthetic materials. Commercial stage-top chambers that allow gas/liquid exchange directly on microscope objectives suffer from a few challenges: cumbersome and dedicated setups, local fluctuation of the temperature/CO2 level, lack of the ability to manipulate the sample during measurement and quickly modulate multiple parameters in real-time. For SRM imaging, microfluidic techniques shall allow precise handling of solutions/buffers for environmental control.140,141Microfluidics has been integrated into several optical imaging methods, and has shown its capability to make imaging instruments cheaper and smaller with minimal influence on imaging quality.142,143 The advantages of integrated microfluidics are also appealing for more modalities of SRM imaging. In live cell imaging, custom-designed microfluidic channels contributed significantly to automated cell culturing,144 bacteria immobilization145 and controlling the local temperature and medium.146
We believe, automated environmental control including temperature, gas and solution such as pH, solvents and buffer via microfluidics or flow setups with high precision and fast equilibration will open up enormous opportunities for scientists to explore unprecedented properties of synthetic and biological materials.
Inexpensive and commercially available microscope
After its development and implementation, SMLM was quickly commercialized by several microscope manufacturers. However, the price of these microscopes is still high, which limits their availability to only a few universities and their usage is thus far-from routine characterization. We have to point out that some standard instruments in chemistry analytical labs are also quite expensive, so this is not a limit per se, but we argue that a more accessible price will for sure help the diffusion of the method.To improve this, the price of the setup has to be lowered without compromising the performance of the technique itself and the quality of the information acquired. This can be achieved with several ways: (i) reducing the price of individual components; (ii) improve the instrument design and (iii) have more dedicated and tailored setup for chemical analysis where only necessary components are used.
The first step towards a more cost-effective setup is removing the body and the ultra-stable laser table. This not only reduces the costs, but it also results in a more compact set-up that saves lab space. This also allows for more downstream modifications and a more custom set-up. Furthermore, by having a compact design, such as the liteTIRF or miCube set-up, mechanical and thermal drift are reduced, which eliminates the need for drift correction modules, which are needed for imaging a high number of frames and for 3D imaging (Fig. 6).85,147 Additionally, omitting the optical table allows for point-of-care operation in field studies and in-class demonstrations to students. As a commercialized set-up, ONI has already made some progress, and is a small device that does not require an optical table, allows for temperature control between 20 and 45 °C and is equipped with possibilities for microfluidics.148
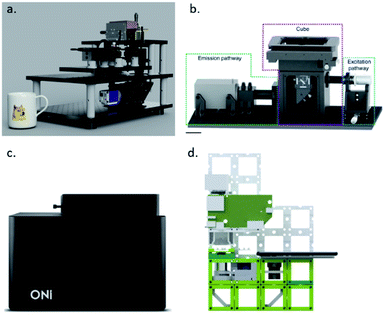 | ||
| Fig. 6 (a) LiteTIRF microscope (reprinted from ref. 85), (b) miCube set-up (reprinted from ref. 147), (c) ONI Nanoimager (reprinted from ref. 148), and (d) UC2 microscope (reprinted from ref. 153). | ||
Second, the use of lower grade components can also significantly reduce the cost of the set-up. Commercialized microscopes often have expensive high-end components, although they can easily be substituted with standard off-the-shelf components. First of all, the scientific-grade laser can be replaced with an industry-grade high-power laser diode. A multi-mode fiber, rotating diffuser and a fiber-based beam shaper are needed for uniform illumination.149–151
Regarding the camera, sCMOS cameras have an improved imaging speed and field of view size while having a significantly reduced price compared to the first EMCCD camera. The numerical aperture (NA) of the objective determines the photon collection efficiency and thus the localization precision of the resulting SMLM image. In general, commercialized microscopes are equipped with a high-NA objective lens (NA > 1.4), and by replacing this with a low-cost objective lens, e.g. an oil immersion objective with a NA of 1.3, it was observed that the localization precision is nearly the same as that of a standard SMLM set-up.150
Another approach that has been investigated, is the development of mobile microscopy, which would enable the researcher to have an hand-held device that is capable of obtaining SMLM images, by simply using a smartphone. This allows for combining acquisition and processing in a single device and it will remove barriers between educational and laboratory environments. However, the cameras that are in normal smartphones, do not have CMOS camera chips and acquiring RAW data with high-quality is very complicated.152
Third, by using cheaper manufacturing protocols, the cost can be reduced. Over the years, 3D printers have become a standard in research laboratories. Open-source projects, such as UC2 and OpenFlexure, have opened the possibility to print and assemble a microscope within the research facility. This not only reduces manufacturing costs, but also shipping has become unnecessary and it allows for usage of SMLM in developing nations (Fig. 6). The modular approach of the UC2 microscope allows for fast modification of the set-up, which is essential in the development stage of an experiment. In the OpenFlexure microscope, the optics module is interchangeable, which facilitates multiple imaging modes. Although these systems are still far from standard SRM, the first examples of subdiffraction imaging have been shown.153–155
In our opinion, all the methods discussed above are good examples of reducing costs in SMLM, however, a major drawback of these systems is that one should make these themselves and specific training will be needed, which will increase the barrier for using these set-ups. However, by sharing knowledge and experiences on online fora, the barrier will be lowered. On the other hand, commercialized microscopes will provide a ready to use set-up and a support team in case a microscope is not functioning properly. The combination of the experiences from open-science projects and commercial instruments will bring a new wave of affordable high-performance SRM instruments.
Conclusions
The breakthrough of SRM has made it possible to unveil molecular insights into the structure, dynamics and functions of materials in their native state for the rational designing and optimization of materials. In this perspective, we discussed the roadmap of the necessary developments recommended for SRM to shift from a sophisticated to a routine technique. We discussed in detail the approaches to address the limitations from sample preparation protocols to informative output. While some of these challenges are suitable for chemists (e.g. sample preparation and labeling), many other challenges will require collaboration with different scientific communities such as physics/optics, mechanical engineering, and computer science. A joint effort by expert scientists in the field along with experts in microscope manufacturing that aims to provide hands-on training on methods of SRM and their immense experimental possibilities to budding scientists would make this sophisticated technique more regular for use. In addition, clarity on both benefits and limitations of the SRM technique while imaging various materials would allow further developments at several fronts.We believe that these advances in the next decade will expand the application of SRM to new discoveries and insights into the structure, dynamics and function of complex synthetic and biological systems.
Author contributions
S. D. wrote the sections Introduction, Why SRM, What makes a technique successful, and Conclusion and compiled the perspective. T. A. wrote the section Fast and automated. T. A. and B.S.G. wrote the section Robust and reproducible. M. M. E. T. and B. S. G. wrote the sections Sample preparation and Inexpensive and commercially available microscopes. M. M. E. T. wrote the section Informative and quantitative output. Y. W. wrote the sections Environmental control and User friendly software with smart acquisition and analysis. L. A. directed the writing of the perspective, and contributed to all sections of the manuscript. All authors conceived the theme for the perspective, and contributed to decisions on the overall content and the editing of the perspective. Except for S. D. and L. A., the authorship order is alphabetically (last name) determined due to equivalent contribution.Conflicts of interest
There are no conflicts to declare.Acknowledgements
L. A. acknowledges the financial support by the Spanish Ministry of Science and Innovation (PID2019-109450RB-I00/AEI/10.13039/501100011033), European Research Council/Horizon 2020 (ERC-StG-757397), “la Caixa” Foundation (ID 100010434), and the Generalitat de Catalunya (through the CERCA program and 2017 SGR 01536). L. A. and M. M. E. T. acknowledge the support of NWO through the VIDI grant 192.028. S. D. thanks EU Horizon 2020 research and innovation programme under Marie Skłodowska-Curie grant agreement no. 899987 for “Eurotech postdoc2” fellowship. T. A. thanks Marie Skłodowska-Curie Horizon 2020 (713673), “la Caixa” Foundation (ID 100010434, code LCF/BQ/DI18/11660039) fellowship. B. S. G. thanks H2020-Marie Skłodowska-Curie IF LUCENT (844384) fellowship.Notes and references
- L. Schermelleh, R. Heintzmann and H. Leonhardt, J. Cell Biol., 2010, 190, 165–175 CrossRef CAS PubMed.
- B. Huang, M. Bates and X. Zhuang, Annu. Rev. Biochem., 2009, 78, 993–1016 CrossRef CAS PubMed.
- S. Pujals, N. Feiner-Gracia, P. Delcanale, I. Voets and L. Albertazzi, Nat. Rev. Chem., 2019, 3, 68–84 CrossRef.
- L. Albertazzi, D. Van Der Zwaag, C. M. A. Leenders, R. Fitzner, R. W. Van Der Hofstad and E. W. Meijer, Science, 2014, 344, 491–495 CrossRef CAS PubMed.
- S. Onogi, H. Shigemitsu, T. Yoshii, T. Tanida, M. Ikeda, R. Kubota and I. Hamachi, Nat. Chem., 2016, 8, 743–752 CrossRef CAS PubMed.
- A. Sarkar, T. Behera, R. Sasmal, R. Capelli, C. Empereur-mot, J. Mahato, S. S. Agasti, G. M. Pavan, A. Chowdhury and S. J. George, J. Am. Chem. Soc., 2020, 142, 11528–11539 CrossRef CAS PubMed.
- S. Sarkar, A. Sarkar, A. Som, S. S. Agasti and S. J. George, J. Am. Chem. Soc., 2021, 143, 11777–11787 CrossRef CAS PubMed.
- B. Adelizzi, A. Aloi, A. J. Markvoort, H. M. M. Ten Eikelder, I. K. Voets, A. R. A. Palmans and E. W. Meijer, J. Am. Chem. Soc., 2018, 140, 7168–7175 CrossRef CAS PubMed.
- A. Sarkar, R. Sasmal, C. Empereur-mot, D. Bochicchio, S. V. K. Kompella, K. Sharma, S. Dhiman, B. Sundaram, S. S. Agasti, G. M. Pavan and S. J. George, J. Am. Chem. Soc., 2020, 142, 7606–7617 CrossRef CAS PubMed.
- C. E. Boott, E. M. Leitao, D. W. Hayward, R. F. Laine, P. Mahou, G. Guerin, M. A. Winnik, R. M. Richardson, C. F. Kaminski, G. R. Whittell and I. Manners, ACS Nano, 2018, 12, 8920–8933 CrossRef CAS PubMed.
- R. M. P. da Silva, D. van der Zwaag, L. Albertazzi, S. S. Lee, E. W. Meijer and S. I. Stupp, Nat. Commun., 2016, 7, 11561 CrossRef CAS PubMed.
- L. H. Beun, L. Albertazzi, D. van der Zwaag, R. de Vries and M. A. Cohen Stuart, ACS Nano, 2016, 10, 4973–4980 CrossRef CAS PubMed.
- S. Chattopadhyay and J. S. Biteen, Anal. Chem., 2021, 93, 430–444 CrossRef CAS PubMed.
- M. Wang, M. Li, S. Jiang, J. Gao and P. Xi, Micron, 2020, 137, 102916 CrossRef CAS PubMed.
- E. Wertz, B. P. Isaacoff, J. D. Flynn and J. S. Biteen, Nano Lett., 2015, 15, 2662–2670 CrossRef CAS PubMed.
- K. A. Willets, A. J. Wilson, V. Sundaresan and P. B. Joshi, Chem. Rev., 2017, 117, 7538–7582 CrossRef CAS PubMed.
- H. Lin, S. P. Centeno, L. Su, B. Kenens, S. Rocha, M. Sliwa, J. Hofkens and H. Uji-i, ChemPhysChem, 2012, 13, 973–981 CrossRef CAS PubMed.
- H. Yuan, S. Khatua, P. Zijlstra, M. Yorulmaz and M. Orrit, Angew. Chem., 2013, 52, 1217–1221 CrossRef CAS PubMed.
- M. B. Roeffaers, B. F. Sels, H. Uji-i, F. C. De Schryver, P. A. Jacobs, D. E. De Vos and J. Hofkens, Nature, 2006, 439, 572–575 CrossRef CAS PubMed.
- X. Mao, C. Liu, M. Hesari, N. Zou and P. Chen, Nat. Chem., 2019, 11, 687–694 CrossRef CAS PubMed.
- Y. Zhang, J. M. Lucas, P. Song, B. Beberwyck, Q. Fu, W. Xu and A. P. Alivisatos, Proc. Natl. Acad. Sci. U. S. A., 2015, 112, 8959–8964 CrossRef CAS PubMed.
- G. Chen, N. Zou, B. Chen, J. B. Sambur, E. Choudhary and P. Chen, ACS Cent. Sci., 2017, 3, 1189–1197 CrossRef CAS PubMed.
- M. J. K. Ow, J. J. Ng, J. X. Yong, B. Y. L. Quek, E. K. L. Yeow and Z. Zhang, ACS Appl. Nano Mater., 2020, 3, 3163–3167 CrossRef CAS.
- W. Wang, J. Gu, T. He, Y. Shen, S. Xi, L. Tian, F. Li, H. Li, L. Yan and X. Zhou, Nano Res., 2015, 8, 441–455 CrossRef.
- N. Zou, G. Chen, X. Mao, H. Shen, E. Choudhary, X. Zhou and P. Chen, ACS Nano, 2018, 12, 5570–5579 CrossRef CAS PubMed.
- F. Scheffold, Nat. Commun., 2020, 11, 4315 CrossRef CAS PubMed.
- D. V. Chapman, H. Du, W. Y. Lee and U. B. Wiesner, Prog. Polym. Sci., 2020, 111, 101312 CrossRef CAS.
- C. F. Kaminski and G. S. K. Schierle, Neurophotonics, 2016, 3, 041807 CrossRef PubMed.
- S. Pujals and L. Albertazzi, ACS Nano, 2019, 13, 9707–9712 CrossRef CAS PubMed.
- Z. Yang, A. Sharma, J. Qi, X. Peng, D. Y. Lee, R. Hu, D. Lin, J. Qu and J. S. Kim, Chem. Soc. Rev., 2016, 45, 4651–4667 RSC.
- L. Schermelleh, A. Ferrand, T. Huser, C. Eggeling, M. Sauer, O. Biehlmaier and G. P. C. Drummen, Nat. Cell Biol., 2019, 21, 72–84 CrossRef CAS PubMed.
- N. Feiner-Gracia, S. Pujals, P. Delcanale and L. Albertazzi, in Smart Nanoparticles for Biomedicine, ed. G. Ciofani, Elsevier, Amsterdam, 2018, ch. 5, pp. 219–236 Search PubMed.
- Supramolecular Chemistry: From Molecules to Nanomaterials, J. W. Steed and P. A. Gale, Wiley-VCH, 2012 Search PubMed.
- G. Binnig, C. F. Quate and C. Gerber, Phys. Rev. Lett., 1986, 56, 930–933 CrossRef PubMed.
- P. Ellinger, Biol. Rev., 1940, 15, 323–347 CrossRef.
- M. Yamanaka, N. I. Smith and K. Fujita, Microscopy, 2014, 63, 177–192 CrossRef PubMed.
- R. Heintzmann and T. Huser, Chem. Rev., 2017, 117, 13890–13908 CrossRef CAS PubMed.
- Y. Wu and H. Shroff, Nat. Methods, 2018, 15, 1011–1019 CrossRef CAS PubMed.
- M. G. L. Gustafsson, J. Microsc., 2000, 198, 82–87 CrossRef CAS PubMed.
- H. Blom and J. Widengren, Chem. Rev., 2017, 117, 7377–7427 CrossRef CAS PubMed.
- C. Eggeling, K. I. Willig, S. J. Sahl and S. W. Hell, Q. Rev. Biophys., 2015, 48, 178–243 CrossRef CAS PubMed.
- S. W. Hell and J. Wichmann, Opt. Lett., 1994, 19, 780 CrossRef CAS PubMed.
- T. Klein, S. Proppert and M. Sauer, Histochem. Cell Biol., 2014, 141, 561–575 CrossRef CAS PubMed.
- M. Lelek, M. T. Gyparaki, G. Beliu, F. Schueder, J. Griffié, S. Manley, R. Jungmann, M. Sauer, M. Lakadamyali and C. Zimmer, Nat. Rev. Dis. Primers, 2021, 1, 39 CrossRef.
- M. Dai, R. Jungmann and P. Yin, Nat. Nanotechnol., 2016, 11, 798–807 CrossRef CAS PubMed.
- S. A. Jones, S.-H. Shim, J. He and X. Zhuang, Nat. Methods, 2011, 8, 499–505 CrossRef CAS PubMed.
- M. J. Rust, M. Bates and X. Zhuang, Nat. Methods, 2006, 3, 793–796 CrossRef CAS PubMed.
- S. van de Linde, A. Löschberger, T. Klein, M. Heidbreder, S. Wolter, M. Heilemann and M. Sauer, Nat. Protoc., 2011, 6, 991–1009 CrossRef CAS PubMed.
- S. T. Hess, T. P. K. Girirajan and M. D. Mason, Biophys. J., 2006, 91, 4258–4272 CrossRef CAS PubMed.
- R. Jungmann, M. S. Avendaño, M. Dai, J. B. Woehrstein, S. S. Agasti, Z. Feiger, A. Rodal and P. Yin, Nat. Methods, 2016, 13, 439–442 CrossRef CAS PubMed.
- T. Dertinger, R. Colyer, G. Iyer, S. Weiss and J. Enderlein, Proc. Natl. Acad. Sci. U. S. A., 2009, 106, 22287–22292 CrossRef CAS PubMed.
- P. Dedecker, S. Duwé, R. K. Neely and J. Zhang, J. Biomed. Opt., 2012, 17, 126008 CrossRef PubMed.
- N. Gustafsson, S. Culley, G. Ashdown, D. M. Owen, P. M. Pereira and R. Henriques, Nat. Commun., 2016, 7, 12471 CrossRef CAS PubMed.
- T. Ando, S. P. Bhamidimarri, N. Brending, H. Colin-York, L. Collinson, N. D. Jonge, P. J. de Pablo, E. Debroye, C. Eggeling, C. Franck, M. Fritzsche, H. Gerritsen, B. N. G. Giepmans, K. Grunewald, J. Hofkens, J. P. Hoogenboom, K. P. F. Janssen, R. Kaufmann, J. Klumperman, N. Kurniawan, J. Kusch, N. Liv, V. Parekh, D. B. Peckys, F. Rehfeldt, D. C. Reutens, M. B. J. Roeffaers, T. Salditt, I. A. T. Schaap, U. S. Schwarz, P. Verkade, M. W. Vogel, R. Wagner, M. Winterhalter, H. Yuan and G. Zifarelli, J. Phys. D: Appl. Phys., 2018, 51, 443001 CrossRef PubMed.
- G. Wolff, C. Hagen, K. Grünewald and R. Kaufmann, Biol. Cell, 2016, 108, 245–258 CrossRef CAS PubMed.
- T. Andrian, T. Bakkum, D. M. van Elsland, E. Bos, A. J. Koster, L. Albertazzi, S. I. van Kasteren and S. Pujals, in Methods in Cell Biology, ed. T. Müller-Reichert and P. Verkade, Academic Press, Cambridge, 2021, vol. 162, pp. 303–331 Search PubMed.
- Y. Wang, H. Friedrich, I. K. Voets, P. Zijlstra and L. Albertazzi, J. Polym. Sci., 2021, 59, 1232–1240 CrossRef CAS.
- A. Malloy and B. Carr, Part. Part. Syst. Charact., 2006, 23, 197–204 CrossRef.
- M. Minoshima and K. Kikuchi, J. Biol. Inorg Chem., 2017, 22, 639–652 CrossRef CAS PubMed.
- M. Ni, S. Zhuo, P. T. C. So and H. Yu, J. Biophotonics, 2017, 10, 11–23 CrossRef PubMed.
- D. Wöll and C. Flors, Small Methods, 2017, 1, 1700191 CrossRef.
- G. T. Dempsey, J. C. Vaughan, K. H. Chen, M. Bates and X. Zhuang, Nat. Methods, 2011, 8, 1027–1036 CrossRef CAS PubMed.
- S. van de Linde and M. Sauer, Chem. Soc. Rev., 2014, 43, 1076–1087 RSC.
- T. M. P. Hartwich, K. K. Hin Chung, L. Schroeder, J. Bewersdorf, C. Soeller and D. Baddeley, bioRxiv, 2018, 465492 Search PubMed.
- Everspark by Eternity, https://www.idylle-labs.com/everspark-by-eternity, accessed, 26 August 2021 Search PubMed.
- Smart Kit Note, https://www.calameo.com/read/00568604215a7462934e0, accessed, 26 August 2021 Search PubMed.
- S. Uno, M. Kamiya, T. Yoshihara, K. Sugawara, K. Okabe, M. C. Tarhan, H. Fujita, T. Funatsu, Y. Okada, S. Tobita and Y. Urano, Nat. Chem., 2014, 6, 681–689 CrossRef CAS PubMed.
- S. Uno, M. Kamiya, A. Morozumi and Y. Urano, Chem. Commun., 2017, 54, 102–105 RSC.
- O. Tzang, A. Pevzner, R. E. Marvel, R. F. Haglund and O. Cheshnovsky, Nano Lett., 2015, 15, 1362–1367 CrossRef CAS PubMed.
- W. R. Silva, C. T. Graefe and R. R. Frontiera, ACS Photonics, 2016, 3, 79–86 CrossRef CAS.
- A. H. Fischer, K. A. Jacobson, J. Rose and R. Zeller, Cold Spring Harb. Protoc., 2008, 2008 DOI:10.1101/pdb.prot4988.
- M. Faria, M. Björnmalm, K. J. Thurecht, S. J. Kent, R. G. Parton, M. Kavallaris, A. P. R. Johnston, J. J. Gooding, S. R. Corrie, B. J. Boyd, P. Thordarson, A. K. Whittaker, M. M. Stevens, C. A. Prestidge, C. J. H. Porter, W. J. Parak, T. P. Davis, E. J. Crampin and F. Caruso, Nat. Nanotechnol., 2018, 13, 777–785 CrossRef CAS PubMed.
- H. S. Leong, K. S. Butler, C. J. Brinker, M. Azzawi, S. Conlan, C. Dufés, A. Owen, S. Rannard, C. Scott, C. Chen, M. A. Dobrovolskaia, S. V. Kozlov, A. Prina-Mello, R. Schmid, P. Wick, F. Caputo, P. Boisseau, R. M. Crist, S. E. McNeil, B. Fadeel, L. Tran, S. F. Hansen, N. B. Hartmann, L. P. W. Clausen, L. M. Skjolding, A. Baun, M. Ågerstrand, Z. Gu, D. A. Lamprou, C. Hoskins, L. Huang, W. Song, H. Cao, X. Liu, K. D. Jandt, W. Jiang, B. Y. S. Kim, K. E. Wheeler, A. J. Chetwynd, I. Lynch, S. M. Moghimi, A. Nel, T. Xia, P. S. Weiss, B. Sarmento, J. das Neves, H. A. Santos, L. Santos, S. Mitragotri, S. Little, D. Peer, M. M. Amiji, M. J. Alonso, A. Petri-Fink, S. Balog, A. Lee, B. Drasler, B. Rothen-Rutishauser, S. Wilhelm, H. Acar, R. G. Harrison, C. Mao, P. Mukherjee, R. Ramesh, L. R. McNally, S. Busatto, J. Wolfram, P. Bergese, M. Ferrari, R. H. Fang, L. Zhang, J. Zheng, C. Peng, B. Du, M. Yu, D. M. Charron, G. Zheng and C. Pastore, Nat. Nanotechnol., 2019, 14, 629–635 CrossRef CAS PubMed.
- M. Faria, M. Björnmalm, E. J. Crampin and F. Caruso, Nat. Nanotechnol., 2020, 15, 2–3 CrossRef CAS PubMed.
- E. M. Pridgen, F. Alexis, T. T. Kuo, E. Levy-Nissenbaum, R. Karnik, R. S. Blumberg, R. Langer and O. C. Farokhzad, Sci. Transl. Med., 2013, 5, 213ra167 Search PubMed.
- J. Park, P. L. Chariou and N. F. Steinmetz, Bioconjug. Chem., 2020, 31, 1408–1416 CrossRef CAS PubMed.
- J. Bu, A. Nair, M. Iida, W.-J. Jeong, M. J. Poellmann, K. Mudd, L. J. Kubiatowicz, E. W. Liu, D. L. Wheeler and S. Hong, Nano Lett., 2020, 20, 4901–4909 CrossRef CAS PubMed.
- T. Ruks, K. Loza, M. Heggen, C. Ottmann, P. Bayer, C. Beuck and M. Epple, ChemBioChem, 2021, 22, 1456–1463 CrossRef CAS PubMed.
- K. Treerattrakoon, W. Chanthima, C. Apiwat, T. Dharakul and S. Bamrungsap, Microchim. Acta, 2017, 184, 1941–1950 CrossRef CAS.
- P. Delcanale, B. Miret-Ontiveros, M. Arista-Romero, S. Pujals and L. Albertazzi, ACS Nano, 2018, 12, 7629–7637 CrossRef CAS PubMed.
- J. L. Davis, Y. Zhang, S. Yi, F. Du, K.-H. Song, E. A. Scott, C. Sun and H. F. Zhang, Langmuir, 2020, 36, 2291–2299 CrossRef CAS PubMed.
- M. N. Bongiovanni, J. Godet, M. H. Horrocks, L. Tosatto, A. R. Carr, D. C. Wirthensohn, R. T. Ranasinghe, J.-E. Lee, A. Ponjavic, J. V. Fritz, C. M. Dobson, D. Klenerman and S. F. Lee, Nat. Commun., 2016, 7, 13544 CrossRef CAS PubMed.
- A. Purohit, S. P. Centeno, S. K. Wypysek, W. Richtering and D. Wöll, Chem. Sci., 2019, 10, 10336–10342 RSC.
- T. Andrian, P. Delcanale, S. Pujals and L. Albertazzi, Nano Lett., 2021, 21, 5360–5368 CrossRef CAS PubMed.
- A. Auer, T. Schlichthaerle, J. B. Woehrstein, F. Schueder, M. T. Strauss, H. Grabmayr and R. Jungmann, ChemPhysChem, 2018, 19, 3024–3034 CrossRef CAS PubMed.
- P. Almada, P. M. Pereira, S. Culley, G. Caillol, F. Boroni-rueda, C. L. Dix, G. Charras, B. Baum, R. F. Laine, C. Leterrier and R. Henriques, Nat. Commun., 2019, 10, 1223 CrossRef PubMed.
- S. S. Agasti, Y. Wang, F. Schueder, A. Sukumar, R. Jungmann and P. Yin, Chem. Sci., 2017, 8, 3080–3091 RSC.
- J. Demmerle, C. Innocent, A. J. North, G. Ball, M. Müller, E. Miron, A. Matsuda, I. M. Dobbie, Y. Markaki and L. Schermelleh, Nat. Protoc., 2017, 12, 988–1010 CrossRef CAS PubMed.
- M. J. Booth, Light Sci. Appl., 2014, 3, e165 CrossRef.
- H. J. Goldwyn, K. C. Smith, J. A. Busche and D. J. Masiello, ACS Photonics, 2018, 5, 3141–3151 CrossRef CAS.
- J. Ries, Nat. Methods, 2020, 17, 870–872 CrossRef CAS PubMed.
- E. Williams, J. Moore, S. W. Li, G. Rustici, A. Tarkowska, A. Chessel, S. Leo, B. Antal, R. K. Ferguson, U. Sarkans, A. Brazma, R. E. Carazo Salas and J. R. Swedlow, Nat. Methods, 2017, 14, 775–781 CrossRef CAS PubMed.
- Nanotechnology Standards, ed. V. Murashov and J. Howard, Springer, New York, 2011 Search PubMed.
- M. Faria, Nat. Nanotechnol., 2018, 13, 9 CrossRef PubMed.
- R. Lin, A. H. Clowsley, T. Lutz, D. Baddeley and C. Soeller, Methods, 2020, 174, 56–71 CrossRef CAS PubMed.
- Gattaquant DNA Nanotechnologies – Home, https://www.gattaquant.com/products/localization-based/gatta-paint-3d.html, accessed, 30 August 2021.
- M. Raab, I. Jusuk, J. Molle, E. Buhr, B. Bodermann, D. Bergmann, H. Bosse and P. Tinnefeld, Sci. Rep., 2018, 8, 1780 CrossRef PubMed.
- C. Steinhauer, R. Jungmann, T. L. Sobey, F. C. Simmel and P. Tinnefeld, Angew. Chem., Int. Ed., 2009, 48, 8870–8873 CrossRef CAS PubMed.
- M. Ovesný, P. Křížek, J. Borkovec, Z. Švindrych and G. M. Hagen, Bioinformatics, 2014, 30, 2389–2390 CrossRef PubMed.
- S. Wolter, U. Endesfelder, S. van de Linde, M. Heilemann and M. Sauer, Opt. Express, 2011, 19, 7020 CrossRef PubMed.
- U. Köthe, F. Herrmannsdörfer, I. Kats and F. A. Hamprecht, Histochem. Cell Biol., 2014, 141, 613–627 CrossRef PubMed.
- R. Henriques, M. Lelek, E. F. Fornasiero, F. Valtorta, C. Zimmer and M. M. Mhlanga, Nat. Methods, 2010, 7, 339–340 CrossRef CAS PubMed.
- D. Sage, H. Kirshner, T. Pengo, N. Stuurman, J. Min, S. Manley and M. Unser, Nat. Methods, 2015, 12, 717–724 CrossRef CAS PubMed.
- D. Sage, T.-A. Pham, H. Babcock, T. Lukes, T. Pengo, J. Chao, R. Velmurugan, A. Herbert, A. Agrawal, S. Colabrese, A. Wheeler, A. Archetti, B. Rieger, R. Ober, G. M. Hagen, J.-B. Sibarita, J. Ries, R. Henriques, M. Unser and S. Holden, Nat. Methods, 2019, 16, 387–395 CrossRef CAS PubMed.
- B. Mandracchia, X. Hua, C. Guo, J. Son, T. Urner and S. Jia, Nat. Commun., 2020, 11, 94 CrossRef CAS PubMed.
- H. Ma and Y. Liu, APL Photonics, 2020, 5, 060902 CrossRef CAS PubMed.
- J. Schnitzbauer, M. T. Strauss, T. Schlichthaerle, F. Schueder and R. Jungmann, Nat. Protoc., 2017, 12, 1198–1228 CrossRef CAS PubMed.
- F. Schueder, J. Stein, F. Stehr, A. Auer, B. Sperl, M. T. Strauss, P. Schwille and R. Jungmann, Nat. Methods, 2019, 16, 1101–1104 CrossRef CAS PubMed.
- H. Bock, C. Geisler, C. A. Wurm, C. von Middendorff, S. Jakobs, A. Schönle, A. Egner, S. W. Hell and C. Eggeling, Appl. Phys. B, 2007, 88, 161–165 CrossRef CAS.
- M. Wojnilowicz, A. Glab, A. Bertucci, F. Caruso and F. Cavalieri, ACS Nano, 2019, 13, 187–202 CrossRef CAS PubMed.
- D. van der Zwaag, N. Vanparijs, S. Wijnands, R. De Rycke, B. G. De Geest and L. Albertazzi, ACS Appl. Mater. Interfaces, 2016, 8, 6391–6399 CrossRef CAS PubMed.
- N. Feiner-Gracia, M. Beck, S. Pujals, S. Tosi, T. Mandal, C. Buske, M. Linden and L. Albertazzi, Small, 2017, 13, 1701631 CrossRef PubMed.
- N. Feiner-Gracia, R. A. Olea, R. Fitzner, N. El Boujnouni, A. H. van Asbeck, R. Brock and L. Albertazzi, Nano Lett., 2019, 19, 2784–2792 CrossRef CAS PubMed.
- J. Tam, G. A. Cordier, J. S. Borbely, Á. S. Álvarez and M. Lakadamyali, PLoS One, 2014, 9, e101772 CrossRef PubMed.
- M. Klevanski, F. Herrmannsdoerfer, S. Sass, V. Venkataramani, M. Heilemann and T. Kuner, Nat. Commun., 2020, 11, 1552 CrossRef CAS PubMed.
- C. C. Valley, S. Liu, D. S. Lidke and K. A. Lidke, PLoS One, 2015, 10, e0123941 CrossRef PubMed.
- R. Jungmann, M. S. Avendaño, J. B. Woehrstein, M. Dai, W. M. Shih and P. Yin, Nat. Methods, 2014, 11, 313–318 CrossRef CAS PubMed.
- O. K. Wade, J. B. Woehrstein, P. C. Nickels, S. Strauss, F. Stehr, J. Stein, F. Schueder, M. T. Strauss, M. Ganji, J. Schnitzbauer, H. Grabmayr, P. Yin, P. Schwille and R. Jungmann, Nano Lett., 2019, 19, 2641–2646 CrossRef CAS PubMed.
- A. Beghin, A. Kechkar, C. Butler, F. Levet, M. Cabillic, O. Rossier, G. Giannone, R. Galland, D. Choquet and J.-B. Sibarita, Nat. Methods, 2017, 14, 1184–1190 CrossRef CAS PubMed.
- A. Wheeler and R. Henriques, Standard and Super-Resolution Bioimaging Data Analysis, Wiley-VCH, New York, 2017 Search PubMed.
- A. D. Edelstein, M. A. Tsuchida, N. Amodaj, H. Pinkard, R. D. Vale and N. Stuurman, J. Biol. Methods, 2014, 1, e10 CrossRef PubMed.
- L. Li, B. Xin, W. Kuang, Z. Zhou and Z.-L. Huang, Opt. Express, 2019, 27, 21029–21049 CrossRef PubMed.
- The PYthon Microscopy Environment, http://www.python-microscopy.org/, accessed, 30 November 2021 Search PubMed.
- F. M. Barabas, L. A. Masullo and F. D. Stefani, Rev. Sci. Instrum., 2016, 87, 126103 CrossRef PubMed.
- H. Pinkard, N. Stuurman, I. E. Ivanov, N. M. Anthony, W. Ouyang, B. Li, B. Yang, M. A. Tsuchida, B. Chhun, G. Zhang, R. Mei, M. Anderson, D. P. Shepherd, I. Hunt-Isaak, R. L. Dunn, W. Jahr, S. Kato, L. A. Royer, J. R. Thiagarajah, K. W. Eliceiri, E. Lundberg, S. B. Mehta and L. Waller, Nat. Methods, 2021, 18, 226–228 CrossRef CAS PubMed.
- C. R. Harris, K. J. Millman, S. J. van der Walt, R. Gommers, P. Virtanen, D. Cournapeau, E. Wieser, J. Taylor, S. Berg, N. J. Smith, R. Kern, M. Picus, S. Hoyer, M. H. van Kerkwijk, M. Brett, A. Haldane, J. F. del Río, M. Wiebe, P. Peterson, P. Gérard-Marchant, K. Sheppard, T. Reddy, W. Weckesser, H. Abbasi, C. Gohlke and T. E. Oliphant, Nature, 2020, 585, 357–362 CrossRef CAS PubMed.
- P. Virtanen, R. Gommers, T. E. Oliphant, M. Haberland, T. Reddy, D. Cournapeau, E. Burovski, P. Peterson, W. Weckesser, J. Bright, S. J. van der Walt, M. Brett, J. Wilson, K. J. Millman, N. Mayorov, A. R. J. Nelson, E. Jones, R. Kern, E. Larson, C. J. Carey, İ. Polat, Y. Feng, E. W. Moore, J. VanderPlas, D. Laxalde, J. Perktold, R. Cimrman, I. Henriksen, E. A. Quintero, C. R. Harris, A. M. Archibald, A. H. Ribeiro, F. Pedregosa and P. van Mulbregt, Nat. Methods, 2020, 17, 261–272 CrossRef CAS PubMed.
- G. Jacquemet, A. F. Carisey, H. Hamidi, R. Henriques and C. Leterrier, J. Cell Sci., 2020, 133, jcs240713 CrossRef CAS PubMed.
- S. Hugelier, M. Sliwa and C. Ruckebusch, J. Anal. Test., 2018, 2, 193–209 CrossRef.
- M. Ovesný, P. Křížek, J. Borkovec, Z. Švindrych and G. M. Hagen, Bioinformatics, 2014, 30, 2389–2390 CrossRef PubMed.
- R. F. Laine, K. L. Tosheva, N. Gustafsson, R. D. M. Gray, P. Almada, D. Albrecht, G. T. Risa, F. Hurtig, A.-C. Lindås, B. Baum, J. Mercer, C. Leterrier, P. M. Pereira, S. Culley and R. Henriques, J. Phys. D: Appl. Phys., 2019, 52, 163001 CrossRef CAS PubMed.
- S. van de Linde, J. Phys. D: Appl. Phys., 2019, 52, 203002 CrossRef CAS.
- D. Sage, T.-A. Pham, H. Babcock, T. Lukes, T. Pengo, J. Chao, R. Velmurugan, A. Herbert, A. Agrawal, S. Colabrese, A. Wheeler, A. Archetti, B. Rieger, R. Ober, G. M. Hagen, J.-B. Sibarita, J. Ries, R. Henriques, M. Unser and S. Holden, Nat. Methods, 2019, 16, 387–395 CrossRef CAS PubMed.
- J. Ries, Nat. Methods, 2020, 17, 870–872 CrossRef CAS PubMed.
- J. Schnitzbauer, M. T. Strauss, T. Schlichthaerle, F. Schueder and R. Jungmann, Nat. Protoc., 2017, 12, 1198–1228 CrossRef CAS PubMed.
- M. W. Paul, H. M. de Gruiter, Z. Lin, W. M. Baarends, W. A. van Cappellen, A. B. Houtsmuller and J. A. Slotman, BMC Bioinform., 2019, 20, 30 CrossRef PubMed.
- A. Durand, T. Wiesner, M.-A. Gardner, L.-É. Robitaille, A. Bilodeau, C. Gagné, P. De Koninck and F. Lavoie-Cardinal, Nat. Commun., 2018, 9, 5247 CrossRef CAS PubMed.
- H. Zhang, C. Fang, X. Xie, Y. Yang, W. Mei, D. Jin and P. Fei, Biomed. Opt. Express, 2019, 10, 1044–1063 CrossRef PubMed.
- M. M. Frigault, J. Lacoste, J. L. Swift and C. M. Brown, J. Cell Sci., 2009, 122, 753–767 CrossRef CAS PubMed.
- M. D. Brennan, M. L. Rexius-Hall, L. J. Elgass and D. T. Eddington, Lab Chip, 2014, 14, 4305–4318 RSC.
- V. Miralles, A. Huerre, F. Malloggi and M.-C. Jullien, Diagnostics, 2013, 3, 33–67 CrossRef PubMed.
- J. Wu, G. Zheng and L. M. Lee, Lab Chip, 2012, 12, 3566 RSC.
- P. Paiè, R. M. Vázquez, R. Osellame, F. Bragheri and A. Bassi, Cytometry, Part A, 2018, 93, 987–996 CrossRef PubMed.
- J. Tam, G. A. Cordier, Š. Bálint, Á. S. Álvarez, J. S. Borbely and M. Lakadamyali, PLoS One, 2014, 9, e115512 CrossRef PubMed.
- D. I. Cattoni, J.-B. Fiche, A. Valeri, T. Mignot and M. Nöllmann, PLoS One, 2013, 8, e76268 CrossRef CAS PubMed.
- J. Babic, L. Griscom, J. Cramer and D. Coudreuse, BMC Cell Biol., 2018, 19, 8 CrossRef PubMed.
- K. J. A. Martens, S. P. B. van Beljouw, S. van der Els, J. N. A. Vink, S. Baas, G. A. Vogelaar, S. J. J. Brouns, P. van Baarlen, M. Kleerebezem and J. Hohlbein, Nat. Commun., 2019, 10, 3552 CrossRef PubMed.
- Nanoimager, https://oni.bio/nanoimager/, accessed, 1 July 2021 Search PubMed.
- K. Kwakwa, A. Savell, T. Davies, I. Munro, S. Parrinello, M. A. Purbhoo, C. Dunsby, M. A. A. Neil and P. M. W. French, J. Biophotonics, 2016, 9, 948–957 CrossRef PubMed.
- H. Ma, R. Fu, J. Xu and Y. Liu, Sci. Rep., 2017, 7, 1542 CrossRef PubMed.
- T. Holm, T. Klein, A. Löschberger, T. Klamp, G. Wiebusch, S. van de Linde and M. Sauer, ChemPhysChem, 2014, 15, 651–654 CrossRef CAS PubMed.
- B. Diederich, P. Then, A. Jügler, R. Förster and R. Heintzmann, PLoS One, 2019, 14, e0209827 CrossRef CAS PubMed.
- B. Diederich, R. Lachmann, S. Carlstedt, B. Marsikova, H. Wang, X. Uwurukundo, A. S. Mosig and R. Heintzmann, Nat. Commun., 2020, 11, 5979 CrossRef CAS PubMed.
- J. T. Collins, J. Knapper, J. Stirling, J. Mduda, C. Mkindi, V. Mayagaya, G. A. Mwakajinga, P. T. Nyakyi, V. L. Sanga, D. Carbery, L. White, S. Dale, Z. J. Lim, J. J. Baumberg, P. Cicuta, S. McDermott, B. Vodenicharski and R. Bowman, Biomed. Opt. Express, 2020, 11, 2447–2460 CrossRef CAS PubMed.
- S. D. Grant, G. S. Cairns, J. Wistuba and B. R. Patton, F1000Research, 2019, 8, 2003 CAS.
| This journal is © The Royal Society of Chemistry 2022 |

