
 Open Access Article
 This Open Access Article is licensed under a Creative Commons Attribution-Non Commercial 3.0 Unported Licence
Strategies for switching the mechanism of proton-coupled electron transfer reactions illustrated by mechanistic zone diagrams†
Robin
Tyburski
and
Leif
Hammarström
 *
*
Department of Chemistry – Ångström Laboratory, Uppsala University, Box 532, SE75120 Uppsala, Sweden. E-mail: leif.hammarstrom@kemi.uu.se
First published on 6th December 2021
Abstract
The mechanism by which proton-coupled electron transfer (PCET) occurs is of fundamental importance and has great consequences for applications, e.g. in catalysis. However, determination and tuning of the PCET mechanism is often non-trivial. Here, we apply mechanistic zone diagrams to illustrate the competition between concerted and stepwise PCET-mechanisms in the oxidation of 4-methoxyphenol by Ru(bpy)33+-derivatives in the presence of substituted pyridine bases. These diagrams show the dominating mechanism as a function of driving force for electron and proton transfer (ΔG0ET and ΔG0PT) respectively [Tyburski et al., J. Am. Chem. Soc., 2021, 143, 560]. Within this framework, we demonstrate strategies for mechanistic tuning, namely balancing of ΔG0ET and ΔG0PT, steric hindrance of the proton-transfer coordinate, and isotope substitution. Sterically hindered pyridine bases gave larger reorganization energy for concerted PCET, resulting in a shift towards a step-wise electron first-mechanism in the zone diagrams. For cases when sufficiently strong oxidants are used, substitution of protons for deuterons leads to a switch from concerted electron–proton transfer (CEPT) to an electron transfer limited (ETPTlim) mechanism. We thereby, for the first time, provide direct experimental evidence, that the vibronic coupling strength affects the switching point between CEPT and ETPTlim, i.e. at what driving force one or the other mechanism starts dominating. Implications for solar fuel catalysis are discussed.
Introduction
It is now widely accepted that proton-coupled electron transfer (PCET) reactions are essential to numerous processes in natural and artificial catalytic systems. It is at the heart of biological energy conversion, such as oxygenic photosynthesis and mitochondrial respiration.1,2 It also plays an important role in catalytic systems unrelated to energy conversion, such as the reduction of nucleoside triphosphates by ribonucleotide reductase.3 In the catalytic generation of solar fuels, PCET is at the core of substrate conversion.4–7 Recently, PCET has often come to be utilized in the activation of bonds in organic synthesis driven by photoredox catalysis.8–11One of the challenges in PCET-research is the determination and characterization of the mechanism with which the reaction occurs. PCET can occur through stepwise routes, with electron transfer preceding proton transfer (ETPT) or proton transfer preceding electron transfer (PTET); see Scheme 1. Alternatively, both particles can transfer from the same transition state in a single concerted step (CEPT). Determination and tuning of the operative mechanism are essential for the rational design and optimization of systems catalyzing processes involving PCET (vide infra).
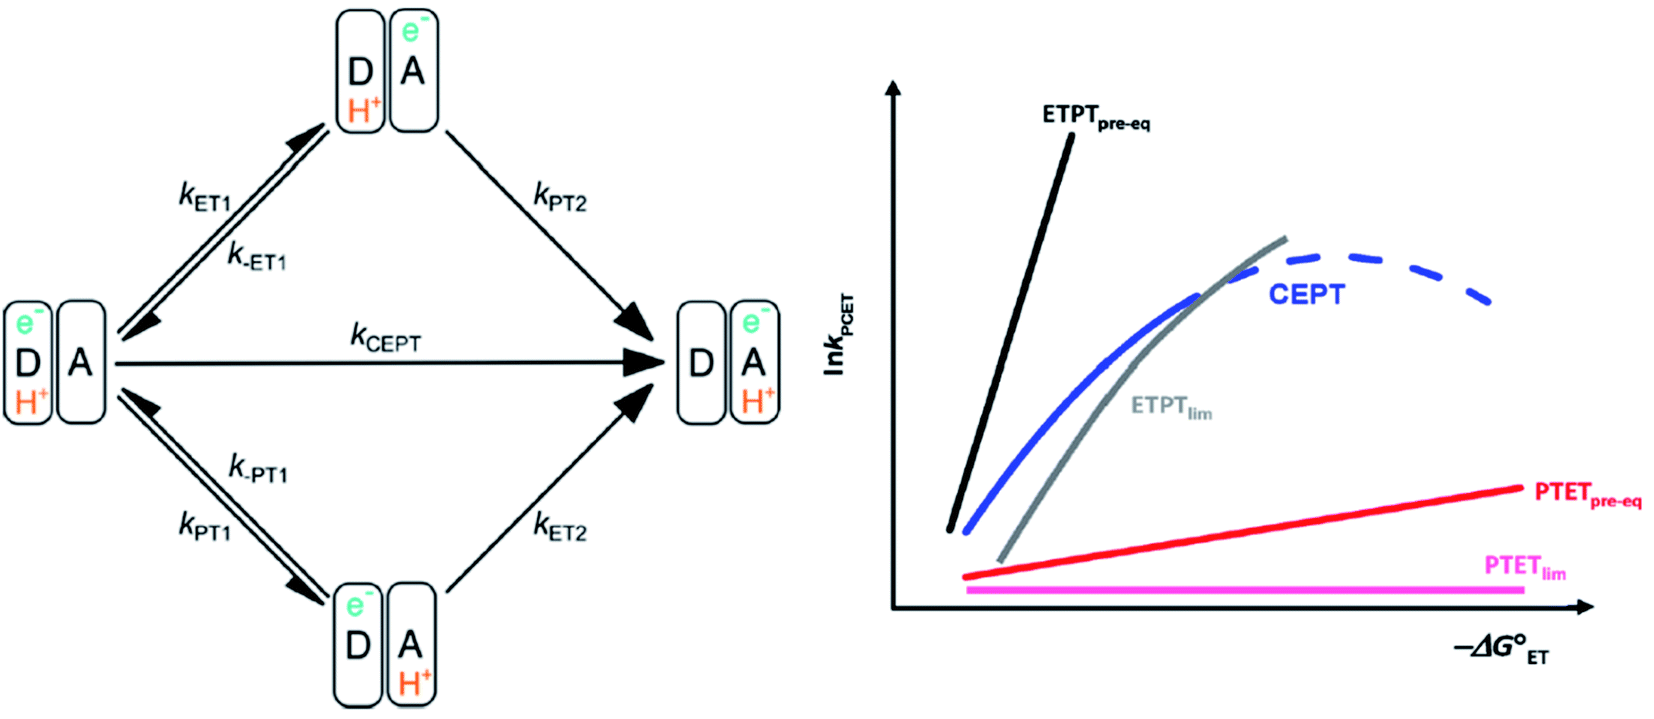 | ||
| Scheme 1 Left: square scheme representing the different PCET-mechanisms. Right: schematic dependence of the observed PCET-rate constants for different PCET mechanisms on ET driving force, see text. An analogous diagram showing the dependences of the rate constants on PT driving force is shown in ref. 31. Adapted from ref. 31, copyright American Chemical Society 2021. | ||
Determination and tuning of the PCET mechanism are often non-trivial and experimentally challenging. Nevertheless, the switching between mechanistic regimes has been demonstrated in a number of systems.12–21 A prominent example is the chemical oxidation of CpW(CO)3H in the presence of proton acceptors.14 Here, the mechanism could be tuned to CEPT at low electron and proton transfer driving forces. Building on this study, pyridine bases were linked covalently to the hydride. By varying oxidant and base strength, a wide variety of PCET mechanisms, including CEPT could be accessed.15,16
A subsequent study by Huang and co-workers investigated the oxidation of CpW-(CO)2(PMe3)H in extensive detail.17 Surprisingly, the authors found only small contributions from a concerted mechanism under all experimental conditions investigated. The authors suggested that the lack of a region where the concerted reaction dominated could be explained by a large reorganization energy for CEPT. Furthermore, the authors found the rate constant associated with the minor CEPT pathway to be less sensitive to changes in PT than in ET driving force, which is another difference to the CpW(CO)3H system. It is important to understand the reason for the different behavior in the seemingly very similar PCET reactions.
A theoretical framework describing CEPT reactions has been developed.22–24 In this theory (referred to as multistate continuum theory from hereon), both proton and electron are treated quantum mechanically. The heavy atoms of the system arrange to a combined transition state, at which a transfer coefficient for both proton and electron is calculated based on Fermi's golden rule. In the fully nonadiabatic case, rate constants for CEPT (kCEPT) are often expressed as:
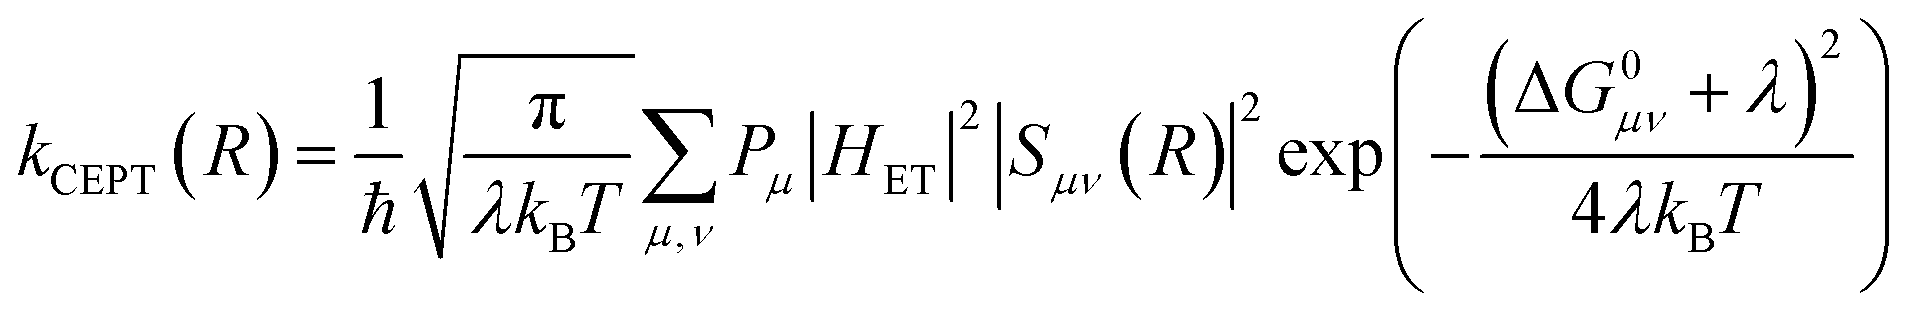 | (1) |
In eqn (1), R is the proton transfer distance, Pμ is the Boltzmann population of reactant vibronic state μ,|HET| is the electronic coupling, |Sμν| is the overlap of the vibrational wavefunctions of the vibronic reactant state μ and product state ν, ΔG0μν is the change in standard free energy and λ is the reorganization energy. The product of the electronic coupling and vibrational overlap between two contributing states, |HET|2|Sμν(R)|2, constitutes what is referred to as the vibronic coupling. Multistate continuum theory has been successful in explaining many PCET-phenomena, such as unusually large kinetic isotope effects (KIEs) and anomalous distance dependences.25–27 The expression of the rate constants is analogous to that given by Marcus theory for nonadiabatic single charge transfer reactions (kCT for pure proton or electron transfer reactions):28,29
 | (2) |
Despite the formal similarities in eqn (1) and (2), it is in practice often difficult to predict whether a PCET reaction will occur via initial ET or PT, or via CEPT. While qualitative arguments suggest factors that tend to favor one or the other mechanism,14,30,31 it would be useful to develop more quantitative guidelines for rationalizing and predicting PCET reactivity.
In the stepwise PCET-mechanisms (ETPT and PTET), the intermediate is usually short-lived, and the usual steady-state treatment shows that the observed rate either follows pre-equilibrium kinetics (eqn (3) and (4)) or is limited by the first step (eqn (5) and (6)); cf.Scheme 1 for rate constant labels.
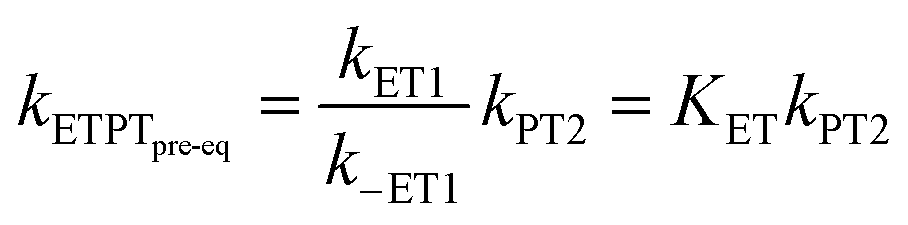 | (3) |
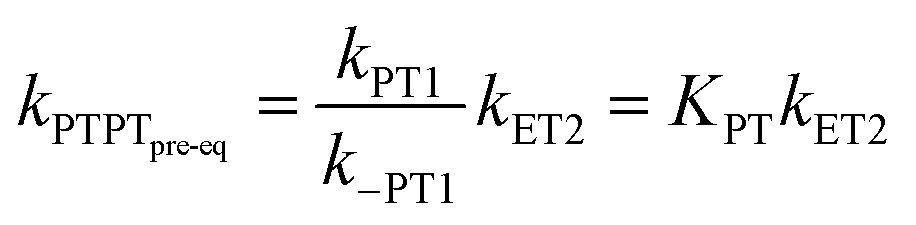 | (4) |
If the back reaction of the first step is slow compared to the second step, the initial step becomes rate limiting (ETPTlim or PTETlim):
| kETPTlim = kET1 | (5) |
| kPTETlim = kPT1 | (6) |
In concerted electron proton transfer (CEPT) reactions, both proton and electron transfer from a single transition state. In this way, the reaction utilizes the thermodynamic driving force for both reactions in a single elementary step this typically lowers the resulting activation barrier in comparison to that of the stepwise mechanisms.
The different mechanisms can be distinguished by the dependence of their observed rate constants on thermodynamic driving force (see Scheme 1). For example, the ETPTpre-eq pathway is characterized by a strong dependence on electron transfer driving force, because of the strong dependence of the pre-equilibrium constant KET1 on −ΔG0ET1 (eqn (3); the slope of RT![[thin space (1/6-em)]](https://www.rsc.org/images/entities/char_2009.gif) lnKET1vs. −ΔG0ET1 is = 1). In contrast, PT from the oxidized species typically occurs with a large driving force so that −ΔG0PT2 approaches λ (see eqn (2)). Consequently, the PT2 reaction will have a small activation barrier, so that a further increase in −ΔG0PT2 has a relatively small effect on kPT2. The rate constant of ETPTlim, kET1, is instead moderately dependent on ET-driving force (eqn (2)) and completely independent on the free energy change of the subsequent PT; the slope of RTlnKET1vs. −ΔG0ET1 is ≈ 0.5 around −ΔG0ET1 = 0. The opposite dependencies are expected for PTET reactions. Finally, the rate constant of CEPT is moderately dependent on both ET and PT driving force, since the free energy change of both steps is utilized (ΔG0CEPT = ΔG0ET1 + ΔG0PT2 = ΔG0PT1 + ΔG0ET2). The different PCET mechanisms and their characteristic dependences on changes in reaction free energy are illustrated in Scheme 1.
lnKET1vs. −ΔG0ET1 is = 1). In contrast, PT from the oxidized species typically occurs with a large driving force so that −ΔG0PT2 approaches λ (see eqn (2)). Consequently, the PT2 reaction will have a small activation barrier, so that a further increase in −ΔG0PT2 has a relatively small effect on kPT2. The rate constant of ETPTlim, kET1, is instead moderately dependent on ET-driving force (eqn (2)) and completely independent on the free energy change of the subsequent PT; the slope of RTlnKET1vs. −ΔG0ET1 is ≈ 0.5 around −ΔG0ET1 = 0. The opposite dependencies are expected for PTET reactions. Finally, the rate constant of CEPT is moderately dependent on both ET and PT driving force, since the free energy change of both steps is utilized (ΔG0CEPT = ΔG0ET1 + ΔG0PT2 = ΔG0PT1 + ΔG0ET2). The different PCET mechanisms and their characteristic dependences on changes in reaction free energy are illustrated in Scheme 1.
The considerations described have prompted the construction of mechanistic zone diagrams, which have recently been introduced to describe PCET reactions.31 These depict which PCET-mechanism dominates under a given combination of proton and electron transfer driving forces (see Scheme 2). The reaction scheme is parametrized by giving each elementary step a Marcus-type expression (eqn (1) and (2), or, in its generalized form, eqn (7), vide infra). In this way, the operative PCET mechanism under given experimental conditions can be described, given the following parameters:
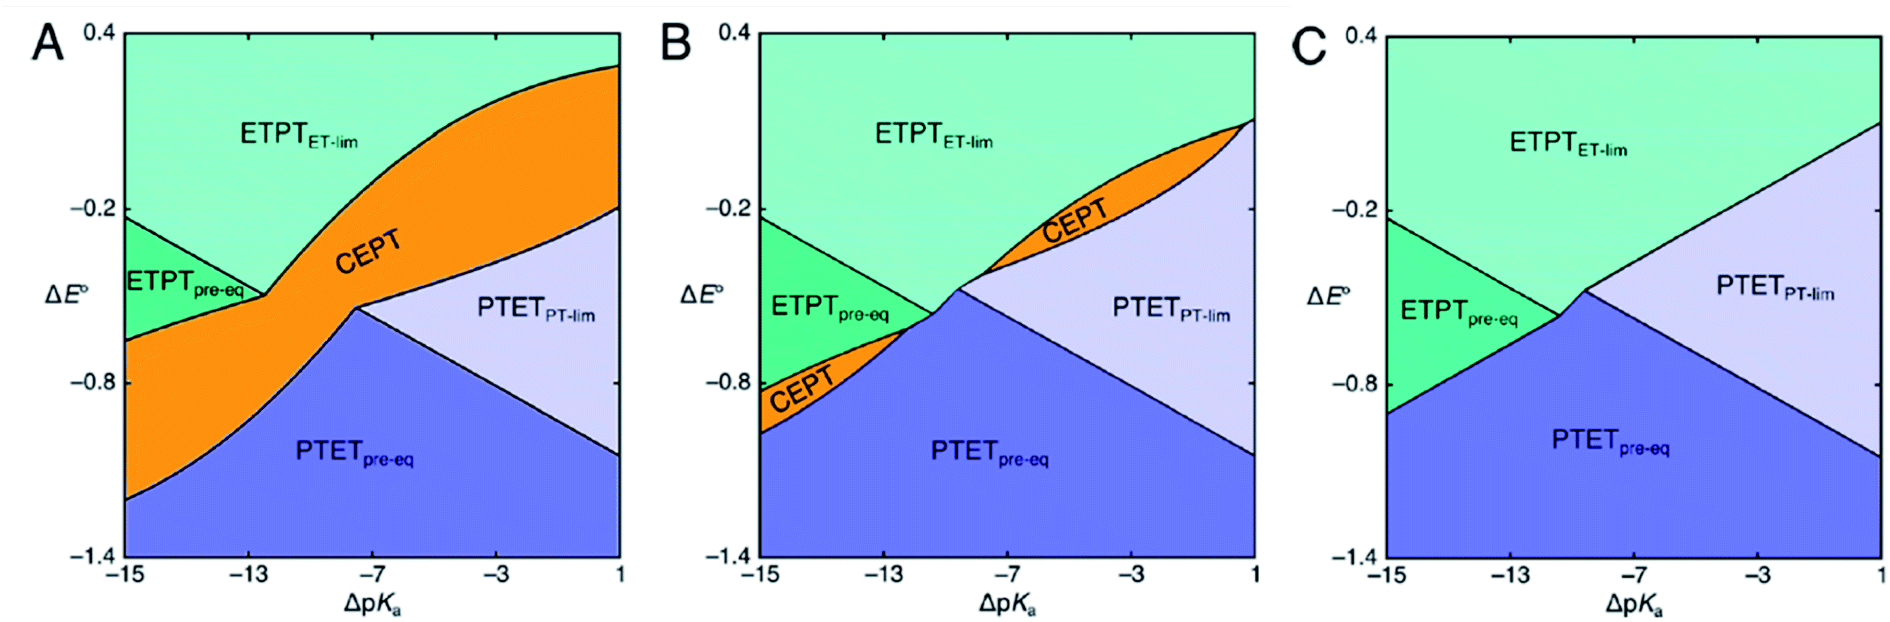 | ||
| Scheme 2 Mechanistic zone diagrams for PCET, showing the regions of different ET- and PT-driving forces (given as the difference in E0 and pKa between the PCET substrate on one hand and the oxidant and base, respectively, on the other) where a certain mechanism dominates. The three panels demonstrate the effect of a decrease in vibronic coupling on the CEPT zone. In panels B and C, the pre-exponential factor for CEPT is decreased by a factor of 10 and 100 relative to that of panel A, respectively. Adapted from ref. 31, copyright American Chemical Society. | ||
(1) The pre-exponential factors, which are related to the electronic and vibronic coupling of reactant and product at the transition state of each elementary step.
(2) The reorganization energies, related to the activation energy of each elementary step.
(3) The proton–electron energetic coupling (defined by the difference in pKa value for the oxidized and reduced forms of the PCET substrate as 2.30RTΔpKa, or equivalently, the difference in reduction potential between the acid and base forms as FΔE0).
Mechanistic Zone Diagrams are useful for qualitative discussion of the mechanistic behavior of PCET. The zones show which mechanism has the largest rate constant, and hence dominates reactivity, given a combination of PT and ET driving forces. At the dividing lines between zones, the observed rate constants of two bordering mechanisms are equal. It becomes apparent that with increasing ET driving force and all other factors being held constant, the mechanism can be switched from PTET, through CEPT to ETPT. The diagrams can also be used to illustrate how individual mechanisms can be favored or disfavored. For example, Scheme 2 shows zone diagrams where all parameters, except the vibronic coupling for CEPT, are held constant. The scheme demonstrates how the CEPT zone splits in two, and eventually disappears completely, as the vibronic coupling for CEPT is decreased. Zone diagrams aid in qualitative mechanistic discussion, but until now, they have not been applied in attempts to make quantitative predictions. However, if the above parameters can be obtained for each of the elementary steps, the operative mechanism under given experimental conditions can be predicted for specific systems.
Here, we establish the quantitative applicability of mechanistic PCET zone diagrams by parametrizing diagrams for the oxidation of 4-methoxyphenol by ruthenium-based oxidants, coupled to deprotonation to pyridine, 4-methoxypyridine and the sterically inhibited 2,6-lutidine and 2,4,6-collidine bases. By analyzing the competition between ETPT and CEPT in these systems, we parametrize zone diagrams. We thereby show that the dividing line between ETPT and CEPT shifts depending on which proton acceptor is used. The results indicate that differences in the CEPT rate constants are both due to a change in the pre-exponential factor and reorganization associated with activation. Through deuteration experiments we provide, for the first time, direct evidence that the dividing line moves depending on the proton tunneling probability, i.e. the proton wavefunction overlap |Sμν(R)|2 in eqn (1). By making use of the competition between ETPTlim and CEPT, this study provides direct experimental insight into factors governing CEPT reactivity. Implications for solar fuels catalysis are discussed.
Results
Choice of system
Construction of a zone diagram requires measurement of PCET rate constants with a large range of driving forces, spanning multiple mechanisms. The use of a termolecular system simplifies variation of the thermodynamic driving force by minimizing efforts of synthesis. In hopes of being able to switch between ETPT and CEPT mechanisms, the relatively easily oxidizable 4-methoxyphenol (4-MeOPhenol, Epeak = 1.29 V vs. SCE in benzonitrile)32 was chosen as PCET agent. Like most phenols, it displays a large energetic coupling between ET and PT, as shown by e.g. the large decrease in pKa upon oxidation (by approximately 23.8 units, see ESI†) in acetonitrile. The oxidants were flash-quench-generated Ru(III)-bipyridines (see Experimental section) with E0 spanning 1.10–1.36 V vs. SCE and a sufficiently similar structure that the ET driving force could be varied while presumably not affecting the electronic coupling or the reorganization energy. The proton acceptors were substituted pyridines with pKa = 12.53–15.00, chosen to vary the PT driving force and investigate the steric effects on the hydrogen bond and thus the proton wavefunction overlap. Acetonitrile was chosen as the solvent, mainly due to the availability of thermochemical data of the reactants. The PCET reactants are summarized in Scheme 3.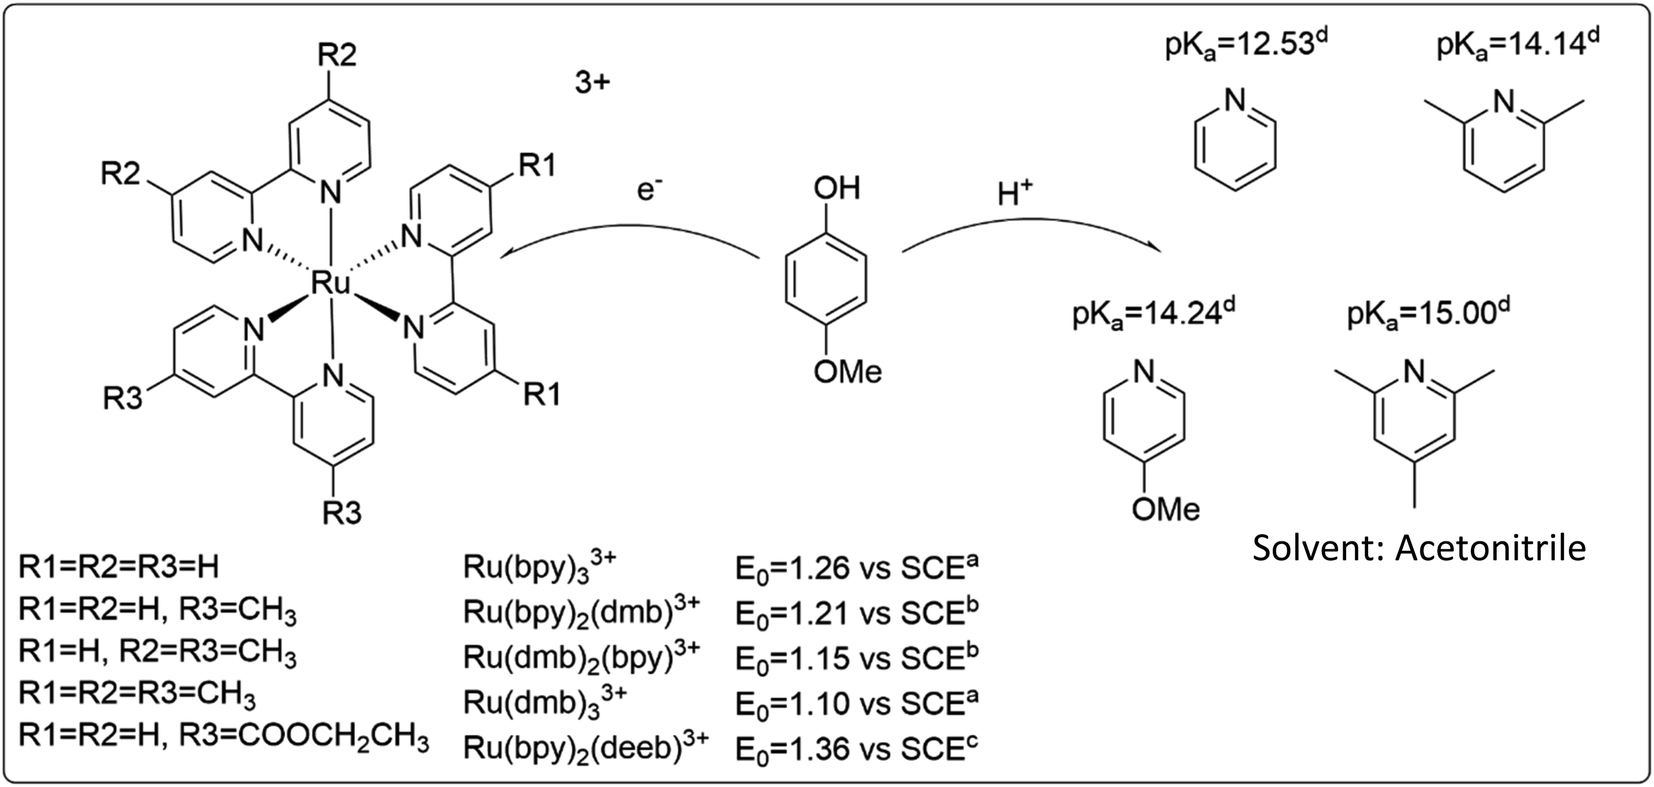 | ||
| Scheme 3 Reactants used in this study, and relevant thermodynamic values. (a) obtained from ref. 33, (b) obtained by linear interpolation between values for Ru(dmb)33+ and Ru(bpy)33+, (c) obtained from ref. 34, (d) obtained from ref. 35. | ||
The reactants chosen for this study only explore a small fraction of the tunability that is available through use of this system. More combinations of ET and PT driving forces could for example be accessed by varying the para-substituent of the phenol. The combinations of reactants in this study were mainly chosen for the PCET reaction to be in a region where CEPT competes with ETPT. For less easily oxidizable phenols, the reaction is likely to proceed exclusively through CEPT. Furthermore, changing the para-substituent on the phenol may have a large effect on hydrogen bonding properties and proton-transfer distances contributing to the PCET reaction.
Mechanistic determination
4-MeOPhenol is oxidized by the ruthenium(III) oxidants even in the absence of a proton acceptor. This reaction was followed by laser flash photolysis, using the transient absorption changes around 450 nm as the Ru(III) oxidant is reduced to Ru(II); (see Experimental section for details). Fig. 1 shows how the observed rate constant for oxidation varies with the standard potential of the ruthenium oxidant. The dependence of the rate constants on driving force is phenomenologically described by eqn (7), which is a generalized form of eqn (1) and (2). We expect the reorganization energy and pre-exponential factor for this ET reaction to be very similar to the rate-limiting ET (kET1) in the ETPTlim mechanism when a base is added. This allows for parametrization of the ETPTlim mechanism. The parameters obtained from the fit are summarized in Table 1.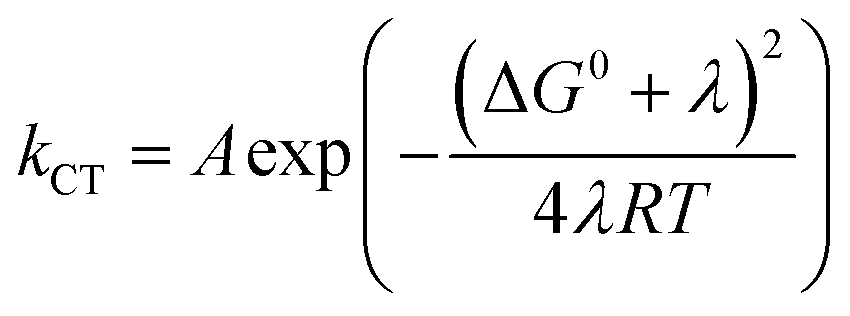 | (7) |
 | ||
| Fig. 1 Dependence of the rate constants for oxidation of 4-MeOPhenol on Ru3+/Ru2+ potential in the absence of a proton acceptor. The line shows a regression to eqn (7). Parameters are given in Table 1. | ||
| Proton acceptor | pKa | ln(A)(CEPT) | λ/eV | K HB(obs)/M−1 |
|---|---|---|---|---|
| Pyridine | 12.53 | 22.2 | 0.79 | 1.0 |
| 4-Methoxypyridine | 14.24 | 22.6 | 0.76 | 1.8 |
| 2,6-Lutidine | 14.1 | 22.5 | 0.90 | 1.3 |
| 2,4,6-Collidine | 15.0 | 22.4 | 0.92 | 1.6 |
| No base | — | 29.4 | 1.12 | — |
Due to the absence of clear curvature in the Marcus plot, it is impossible to determine the reorganization energy, standard potential for oxidation of 4-MeOPhenol (and hence ΔG0ET) and pre-exponential factor for ET independently. Furthermore, the reduction potential of 4-MeOPhenol is difficult to obtain electrochemically, due to the irreversible nature of its cyclic voltammograms.32 In order to ensure a reasonable fit, the pre-exponential factor was fixed to 6 × 10¹² s−1 (the adiabatic limit given by 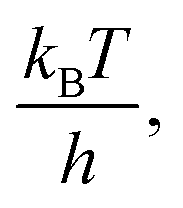 and assuming an encounter complex formation constant of 1 M−1). An apparent reduction potential for the 4-MeOPhOH˙+/4-MeOPhOH couple of 1.18 vs. SCE was then derived from the slope. This value appears realistic considering the peak potential obtained by Biczók et al. in benzonitrile.32 The authors acknowledge that there is large uncertainty in the obtained reduction potential. However, this is not expected to affect further analysis, since ET rate constants were directly measured for all oxidants used in this study and the parameters obtained here appear to describe the reaction well under reaction conditions of interest.
Oxidation is likely succeeded by fast deprotonation to trace amounts of water and radical dimerization, as is typical for phenoxyl radicals.36 The large rate constant for oxidation can however not be explained by a CEPT reaction with the small amount of water as the proton acceptor. The rate is only marginally increased (by approximately 10%) when 1% v/v is added to the solvent (see ESI Section S2†). This is too small compared to the large increase in the activity of water, to be consistent with CEPT with water as acceptor.
Upon addition of a pyridine derivative as proton acceptor, the observed oxidation rate constant increases (see Fig. 2). This indicates that oxidation occurs through a PCET mechanism. In this particular case, the dependence on the proton-acceptor concentration proves that the mechanism is CEPT. Firstly, the PTET mechanisms can be excluded. The initial PT step is thermodynamically uphill by more than 14 pKa units (830 meV) for the strongest proton acceptor. This is far too endergonic to allow for a PTETlim or PTETpre-eq mechanism to realistically reproduce even the lowest observed rate constants observed in this study. The rate of the initial ET step for an ETPT mechanism can be measured in the absence of base. Making the reasonable assumption that the ET rate constant is the same for free 4-MeOPhenol and its hydrogen-bonded complexes with the proton acceptors, this provides us with a direct measure of the rate constant for an ETPTlim mechanism. When the operative rate constant is ETPTlim, the observed oxidation rate constant is not expected to depend on proton-acceptor concentration, as the rate constant for oxidation is the same for hydrogen-bonded and free phenol. Finally, noting that an ETPTpre-eq mechanism can never be faster than the initial ET step, the only way to explain the rate acceleration with increasing additions of proton-acceptor is through contribution of a CEPT mechanism. This assignment is further strengthened by the moderate dependences on both PT and ET driving force (vide infra) and the significant KIEs (>2) observed in this study (see ESI Section S2†). The disappearance of [RuIII] follows pseudo-first order kinetics with an observed rate constant kobs. This rate constant can be expressed as.
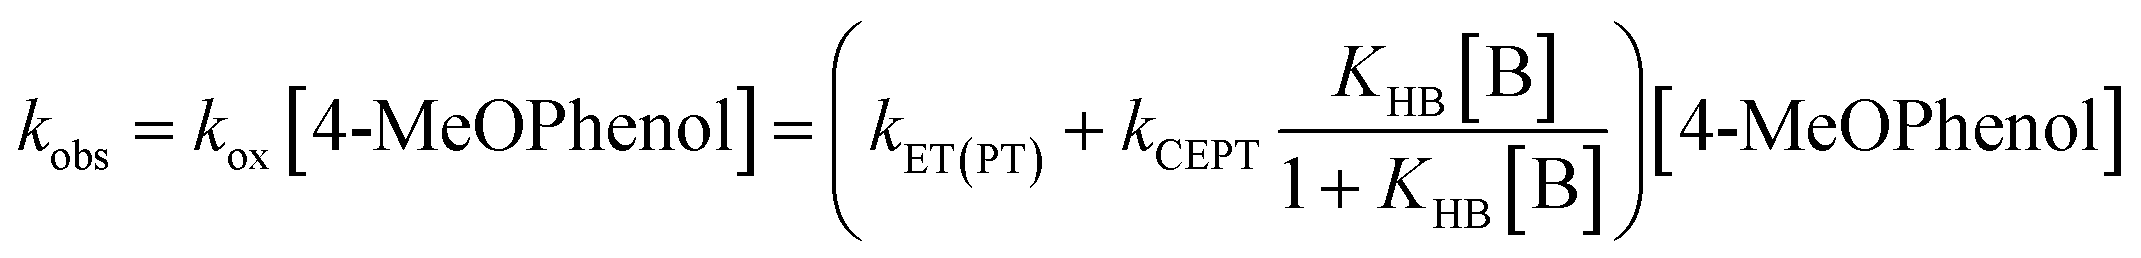 | (8) |
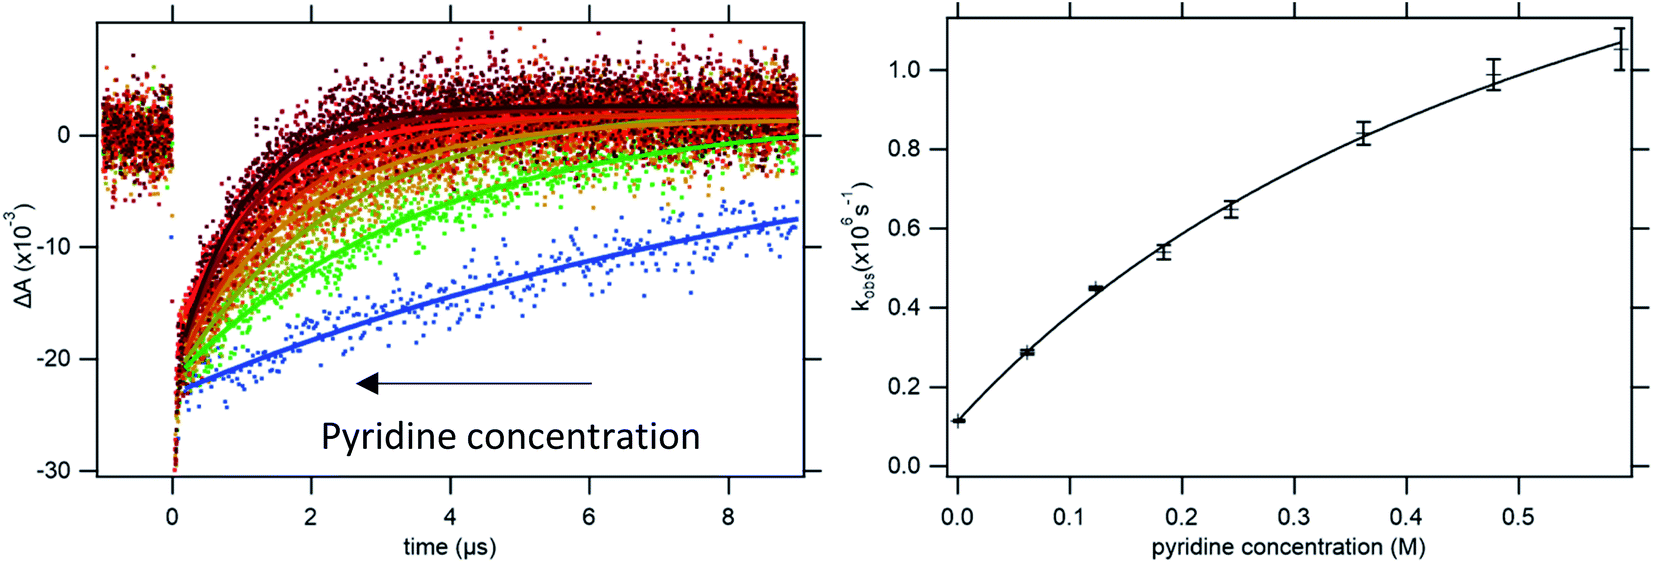 | ||
| Fig. 2 Left: Kinetic traces recorded at 450 nm, with single exponential fits, following oxidation of 4-MeOPhenol by laser flash-quench-generated Ru(dmb)33+ in upon addition of pyridine. Right: dependence of the observed rate constant on pyridine concentration. The line shows a regression to eqn (8), from which kCEPT could be obtained. For more accurate determination of KHB, the procedure was repeated at multiple temperatures (see ESI Section S1†). | ||
To determine the intrinsic CEPT rate constant in the hydrogen bonded complex it has to be separated from the association constant for hydrogen bonding (KHB). This is only possible if KHB is large enough to be measured. In the limit where KHB[B] ≪ 1, kox will depend linearly on [B]. Regression to eqn (8) will give a straight line with a slope of kPCETKHB[4-MeOPhenol], and separation of the association constant and intrinsic rate constant will be impossible. In the present case, the curvature in the dependence of the observed rate constant on pyridine concentration allows for separation of the association constant and intrinsic rate constant of PCET in the complex (see Fig. 2b). It has been pointed out that determination of the association constants in this way leads to large errors.37 In order to improve the accuracy of the measured association constants, we made use of the temperature dependence of the enthalpy term of the association constant. Briefly, kinetic measurements were conducted varying the temperature from 5 °C to 25 °C. KHB was extracted and fit to the van't Hoff equation. A value for KHB at 22 °C was obtained through interpolation and used for each proton acceptor and used for all further analysis (see ESI Section S1†).
After measurement of the CEPT rate constants, rate-driving force correlations were established for these as well. The kinetic parameters for these are summarized in Table 1. The driving force for PCET with each oxidant–base combination was calculated from the bond dissociation free energy (BDFE) of 4-MeOPhenol and an apparent BDFE calculated from the reduction potential of the oxidant couple and pKa of the protonated acceptor (see ESI Section S3†).38,39
As can be seen in Fig. 3, the dependence of the CEPT rate constants on driving force cannot be put on a single Marcus parabola. This can partially be explained by the uncertainty in the association constants leading to errors in the rate constants (vide supra). However, we do not expect these errors to be large enough to explain the large difference CEPT rate constants between reactions with 4-methoxypyridine and 2,4,6-collidine at similar driving forces. The Marcus curve seems to be shifted downward by 1.25 natural logarithmic steps, corresponding to a difference in rate constants by factor of 3.5.
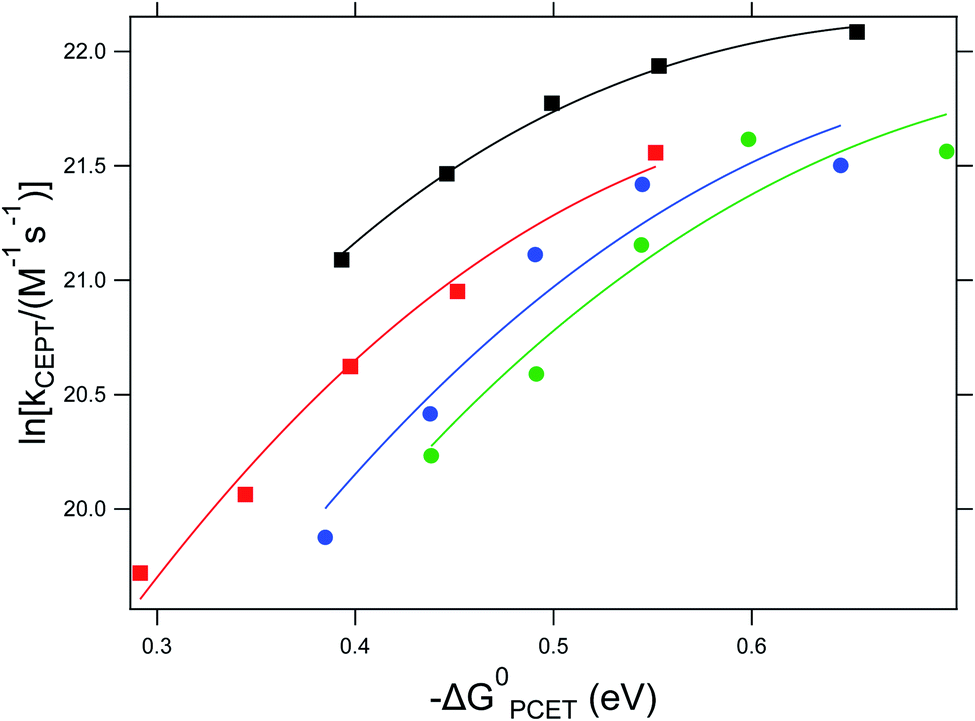 | ||
Fig. 3 Dependence of the CEPT rate constants on ΔG0PCET for reactions with 4-methoxypyridine (black squares), pyridine (red squares), 2,6-lutidine (blue circles) and 2,4,6-collidine (green circles). Lines represent regression to 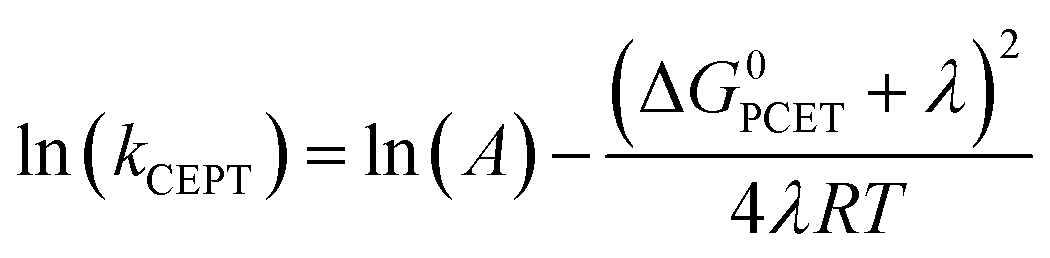 (see eqn (7)). (see eqn (7)). | ||
After parametrizing the dependence of the ETPTlim and CEPT rate constants on driving force according to eqn (7) (Table 1), mechanistic zone diagrams could be constructed. The lines were calculated following the procedure described in the ESI of ref. 31, but only taking the ETPTlim and CEPT mechanisms into account. The diagrams are shown in Fig. 4, along with the data points representing each combination of oxidant and base for which the rate constant of CEPT was measured. The dividing lines between the ETPTlim and CEPT regions for both the sterically hindered proton acceptors (2,6-lutidine and 2,4,6-collidine) fall in almost the same place, and the reactions could be adequately represented by a single zone diagram. However, the line in the diagram for pyridine is shifted downward from that for 4-methoxypyridine, due to a significant difference in the pre-exponential factor of the reactions. Possible reasons for this are discussed below. For all combinations of oxidants and bases used in this study, CEPT is the dominant mechanism.
 | ||
| Fig. 4 Left: zone diagrams for PCET reactions with 4-methoxypyridine (black squares), pyridine (red squares), 2,6-lutidine (blue circles) and 2,4,6-collidine (green circles). Points represent combinations of oxidants and bases for which kCEPT was measured and lines divide the regions where a given mechanism dominates. | ||
Fig. 5 (left) shows how the dependence of kox on [B] changes with driving force for ET (eqn (8)); the data for different oxidants are normalized by plotting kox/kET(PT). As the oxidant strength increases, kox becomes less and less dependent on proton-acceptor concentration. This can be understood, as kET(PT) is expected to be more strongly dependent on oxidant strength than kCEPT is (see Scheme 1). At sufficiently large driving force, kET(PT) will completely outcompete kCEPT and kox is expected to be completely independent of [B].
 | ||
| Fig. 5 Left: dependence of kox/kET(PT) on 2,6-lutidine concentration with oxidants Ru(dmb)33+ (squares, E0 = 1.10 vs. SCE) Ru(bpy)33+ (triangles, E0 = 1.26 vs. SCE) Ru(bpy)2(deeb)3+ (circles, E0 = 1.36 vs. SCE). Black, solid symbols illustrate reactions in protonated systems and red, hollow symbols show reactions in deuterated systems; the point-to-point lines are drawn as guides for the eye. Right: mechanistic zone diagram for 2,6-lutidine showing the dividing line between ETPTlim and CEPT with protonated (solid blue line) and deuterated (dashed blue line) 4-MeOPhenol. | ||
For the reactions with 2,6-lutidine, an interesting phenomenon can be observed. It can be seen, from the very weak dependence of kox on [B] that oxidation with the strongest oxidant is close to the border between the ETPTlim and CEPT regions (the topmost point in the right panel of Fig. 5). However, when the transferring protons are exchanged for deuterons, oxidation is shifted well into the ETPTlim region, indicating a switch in the main contributing mechanism. This is shown in Fig. 5 (right panel) as a shift of the dashed vs. solid lines dividing the ETPTlim and CEPT regions. The change in contributions from ETPTlim and CEPT pathways upon deuteration can be qualitatively seen in the different dependence of kox on proton acceptor concentration (Fig. 5, left). When protons are exchanged for deuterons (red vs. black symbols), the observed rate constant of oxidation becomes significantly less concentration-dependent and virtually concentration-independent when the strongest oxidant is used. This is, to our knowledge, the first time that a mechanistic switch is induced by the lowering of the vibronic coupling for CEPT.
It should be noted that the absolute reorganization energies obtained in this analysis depend on the exact driving force for PCET. As the calculation of this driving force depends on thermodynamic parameters for the phenol, which are hard to determine accurately, the reorganization energy may be underestimated by several hundred meV. However, the values of reorganization energies relative to the PCET driving force, i.e. the barrier defined as  in eqn (1) and (2), should be reliable.
Discussion
Fig. 4 demonstrates that zone diagrams are not only valuable for conceptual and for qualitative discussion but can also be parametrized for real systems for quantitative analysis and predictions. This adds a layer to the conventional mechanistic discussion of PCET systems. Previously, the varying contributions from the different PCET mechanisms under different conditions were rationalized by their characteristic dependence on PCET driving force, but the competition between different mechanisms was never addressed quantitatively.14–17 The reason for this is likely that such an analysis would be rather complex, and during its course it would be difficult to maintain intuitive understanding of the system. Attempts to favor a concerted mechanism have previously been based on the qualitative observation that PCET is generally favored when both electron and proton transfer driving forces are low.14 In parametrizing zone diagrams, we account for the competition between PCET mechanisms in detail, while still being able to illustrate the results in a comprehensible way. Thereby, the manner in which different parameters affect the switching points between mechanisms can be readily understood. With this representation, the following points become immediately apparent:(1) The large energetic coupling between proton and electron (i.e. the large ΔpKa or ΔE0 after initial ET or initial PT, respectively) in 4-MeOPhenol leads to a strong tendency for the compound to react via CEPT. Upon one electron oxidation of the phenol, the pKa of the phenolic proton is reduced by an estimated 23.8 pKa units, corresponding to 1.4 eV increase in −ΔG0PT (see ESI†). The PT step following initial ET (kPT2; Scheme 1) is therefore expected to be strongly exergonic with all bases used in this study. Since a concerted mechanism makes use of this added driving force, the activation barrier for CEPT is expected to be substantially smaller than that for initial ET under most conditions. A CEPT mechanism can therefore be expected with most combinations of oxidants and bases. This can be seen in the zone diagrams. ETPT can only be achieved with very weakly basic pyridines, even at a large driving force for oxidation 
(2) The vibrational wavefunction overlap (Sμν) affects the position of dividing lines between ETPT pathways and CEPT. Fig. 5 (left panel) shows the zone diagrams for oxidation of protonated and deuterated 4-MeOPhenol with 2,6-lutidine. Deuteration shifts the line between ETPT and CEPT downward, making the mechanistic switch occur at lower electron transfer driving forces. Reactions with Ru(dmb)33+ and Ru(bpy)33+ show a similar KIE (2.2 and 2.3 respectively, see ESI†); these are the weakest and strongest oxidants where the CEPT mechanism dominates (Fig. 5, right). The closely similar KIEs at quite different driving forces supports the interpretation that H/D isotopic substitution has a significant effect only on the pre-exponential factor (i.e., the proton tunneling probability).
For one of the cases, we observe a mechanistic switch following isotopic substitution. This is for the reaction of 4-MeOPhenol with Ru(deeb)(bpy)23+ and 2,6-lutidine, which corresponds to the highest data point (strongest oxidant) in the zone diagram of Fig. 5b. With protonated phenol, the contributions from CEPT is slightly larger than that of ETPTlim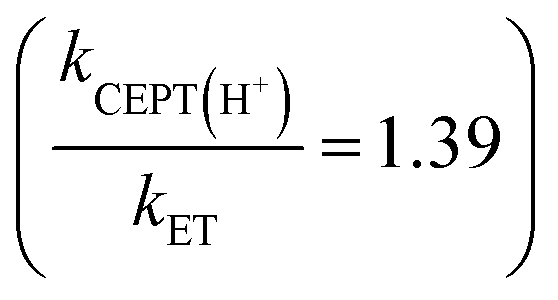 and the point in Fig. 5b lies almost on the dividing line between ETPTlim and CEPT. Upon deuteration instead, the reaction occurs predominantly through ETPTlim
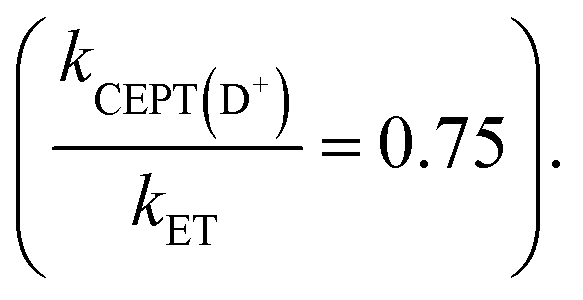 This is seen in the zone diagram of Fig. 5b, in that the point lies above the dashed dividing line, in the ETPTlim region. That CEPT is disfavored relative to ETPT, which leads to a mechanistic switch upon isotopic substitution, is directly observed in Fig. 5a. The rate constants for oxidation of the deuterated systems with a given oxidant are much less dependent on base concentration than those of their protonated analogues. This shows directly the decrease of the second term relative to the first term on the right hand side of eqn (8), due to a decrease in kCEPT relative to kET(PT) upon deuteration. For oxidation of the deuterated phenol with Ru(bpy)2(deeb)3+, the observed rate constant for oxidation becomes essentially independent of acceptor concentration, demonstrating the switch of the dominating mechanism from CEPT to ETPTlim. This is, to our knowledge, the first direct experimental demonstration that changes in vibronic overlap between homologous systems affect the switching point between PCET mechanisms. We thereby provide direct confirmation that tuning of the vibronic overlap can be a feasible strategy for tuning of the operative PCET mechanism. Many other practical strategies for switching the operative mechanism by varying the vibronic overlap than H/D-substitution can be imagined, such as for example varying the PT-distance through synthetic modifications.
(3) Steric hindrance in the proton tunneling coordinate affects the dividing lines between the ETPT mechanisms and CEPT. As shown in the zone diagrams parameterized with 2,6-lutidine and 2,4,6-collidine (Fig. 4), the reaction with these sterically hindered proton acceptors switch from CEPT to ETPT at lower ET driving forces than that with 4-methoxypyridine. This is a consequence of steric hindrance kinetically disfavoring a CEPT reaction, without negatively affecting ETPT pathways. This kind of substitution may therefore be another promising strategy for tuning the mechanism of PCET. The exact origin of the reduction in rate constant is however less clear than in the case of isotopic substitution. When the protons are exchanged for deuterons, all electronic parameters can be expected to stay constant, and only the vibronic overlap should be affected. In the case of synthetic modification of the pyridine base, other parameters (e.g. λ) may be affected. Below, we explore the effect of substituents on the proton acceptor in detail.
The effect of steric hindrance and proton transfer distance
The slowing down of CEPT reactions by steric effects has been observed previously. One example was reported by Morris and co-workers, in the termolecular CEPT oxidation of TEMPOH with ferrocenes and substituted pyridines.40 It was observed, that 2,6-lutidine acted as an outlier in the linear free energy relationship describing the dependence of the PCET rate constant on thermodynamic driving force. There was however no implication of a switch to another mechanism. A similar effect was seen by Huang and co-workers, in the oxidation of [(Cp)W(CO)2(PMe3)H] by ferrocenium-type oxidants in the presence of organic bases.17 Only small contributions of a CEPT mechanism were observed, despite the large span of PCET driving forces investigated. This contrasts with the studies in our group, where CEPT was observed with a wide variety of reaction conditions.14,16 Huang et al. suggested that this may be due to a larger activation energy for CEPT in their system, caused by steric effects that increased the reorganization energy. It was argued that proton self-exchange between [(Cp)W(CO)2(PMe3)H] and [(Cp)W(CO)2(PMe3)]− showed an unusually large reorganization energy of 1.59 eV and that similar effects may be present in the inner-sphere reorganization of the compound's CEPT reactions. We suggested instead that the absence of a clear CEPT-pathway may be due to the steric hindrance leading to weaker hydrogen bonding and reduced overlap of the proton vibrational wavefunctions.16In the present study, the rate-driving force correlations for the sterically hindered 2,6-lutidine and 2,4,6-collidine occur with smaller rate constants at a given driving force compared to those for pyridine and 4-methoxypyiridine (Fig. 3). Furthermore, the steeper increase of the rate constants with oxidant strength indicates a larger reorganization energy for the sterically hindered complexes compared to the unhindered ones. It appears, that for 2,6-lutidine and 2,4,6-collidine, more inner-sphere geometrical reorganization is necessary to reach the transition state.
There are differences in the data also between the sterically unhindered bases. When fit to the Marcus eqn (7), the rate constant for the reaction with unsubstituted pyridine shows a dependence on driving force similar to that for the reaction with 4-methoxypyridine. The curve is however shifted downward, toward smaller rate constants for the same value of ΔG0PCET. This indicates that the two reactions have similar reorganization energies, but that the reaction with pyridine has a smaller pre-exponential factor. A smaller pre-exponential factor indicates a smaller vibronic coupling (see eqn (1)). This can be explained considering the difference in formation constants of the hydrogen bonded complexes with pyridine (KHB = 1.0 M−1) and 4-methoxypyridine (KHB = 1.8 M−1), respectively. The hydrogen bond length can be expected to correlate with the hydrogen bonding strength. This, in turn, will affect the proton tunneling distance. Due to the expectedly sharp decrease in the vibronic coupling with increasing proton-transfer distance, a smaller observed pre-exponential factor is perhaps unsurprising. We note that Morris et al. did not observe a similar effect when studying the termolecular CEPT-oxidation of TEMPOH with proton transfer to substituted pyridines and ferrocenium-based oxidants.40 However, in their study, they report similar hydrogen bond association constants for complexes of TEMPOH with pyridine (1.08 M−1) and TEMPOH with 4-methoxypyridine (1.04 M−1) in CH2Cl2. This suggests that in their study, the proton transfer distances within the hydrogen bonded complexes with the respective proton-acceptors are similar.
The study by Morris et al. also observed the reaction with 2,6-lutidine to be an outlier in the linear free energy relationship, as mentioned above. However, in their case, complexation of TEMPOH with 2,6-lutidine was found to be weaker (KHB = 0.46 M−1) than complexation with pyridine (KHB = 1.08 M−1). They therefore rationalized their findings by suggesting that the proton transfer distance in the complex with 2,6-lutidine is longer. The situation appears to be different for complexes between 4-methoxyphenol and 2,6-lutidine in acetonitrile in the present study. Rather than a decrease, we observe a small increase in the hydrogen bond association constant with 2,6-lutidine compared to that with unsubstituted pyridine. This strengthens our assignment that in the present case, the difference is mainly due to an increased inner-sphere reorganization energy for CEPT in 2,6-lutidine and 2,4,6-collidine compared to pyridine, consistent with the observed trends in oxidant strength dependence (vide supra).
Asynchronicity in PCET
That the reactions with pyridine and 4-methoxypyridine are not falling on the same Marcus curve is perhaps initially surprising. Several groups have reported a seemingly related phenomenon, in which rate constants for CEPT reactions do not follow simple linear free energy relationships.17,41–44 For example, an unusually weak dependence on ET driving force in the oxidation of fluorenyl benzoates was observed by Markle et al.45 In a subsequent study, Darcy and Kolmar et al. observed, that the rate constant for oxidation of substituted fluorenyl-benzoates is more dependent on the basicity of the intramolecular proton-accepting group than on the strength of the oxidant.43 The authors rationalized this by an imbalance of proton and electron redistribution at the transition state, invoking Bernasconi's principle of Nonperfect Synchronization.46,47Following a similar approach, Bím and co-workers constructed a model, in which they defined an asynchronicity factor η, describing an effect on the reorganization energy leading to asynchronous driving force dependence.48 Later, this was linked to the kinetic energy distribution in the reactive mode.49 However, these theories appear to, in some cases, conflict with prevailing theoretical descriptions of non-adiabatic CEPT reactions as formulated by Hammes–Schiffer and co-workers.22,23
In the multistate continuum formalism by Hammes–Schiffer, both proton and electron are treated quantum mechanically. The heavy atoms in the system arrange to a common transition state, from which both electron and proton tunnel.22,23 This differs from traditional adiabatic transition state theory, in which proton transfer would be explained by the classical stretching motion of the proton. In the multistate continuum theory, the proton-stretching motion is not part of the reaction coordinate. The models constructed by Bím et al., while suitable for cases where PT is fully adiabatic (such as hydrogen atom transfer), appear less applicable for the multisite-CEPT reactions studied in this work and many other PCET studies, due to the fundamentally different nature of the reaction coordinate.
The present study shows that asynchronous dependence on PT and ET driving forces can (at least partially) be explained by pKa dependent variations in PT-distances. This appears to be the case for the differences between the rate constant/free energy relationships of CEPT reactions with pyridine and 4-methoxypyridine observed here. A recent computational study suggests that similar effects account for the asynchronous driving force dependence of fluorenyl-benzoate oxidation (vide supra).50,51 The results of the present study thus confirm that establishing simple free energy relationships for CEPT reactions is not always possible. Many factors, such as variations in the equilibrium hydrogen bonding distance and internal reorganization within the different complexes can significantly complicate the analysis. However, the present study clearly shows, that the net effect of the steric hindrance is to lower the rate constant for CEPT relative to that of ETPTlim. The results confirm the intuitive prediction, that steric effects can be a viable strategy for switching the reaction mechanism in catalytic PCET systems.
Marcusian dependence on free energy for CEPT
Due to the large energetic coupling of proton and electron in the phenol, CEPT occurs under a wide range of oxidant and base strengths. This makes it possible for us to investigate CEPT with large driving forces. With the strongest oxidants, the driving force is comparable to the reorganization energy and the reaction approaches the inverted region. This appears to be the case when collidine is used as base. The observed rate constant is smaller when Ru(bpy)2(deeb)3+ is used as oxidant instead of Ru(bpy)33+, despite the additional 100 meV of thermodynamic driving force.Marcus plots of the CEPT rate constants show clear curvature, leveling off at higher PCET driving forces (see Fig. 3). Surprisingly, such curvature is only rarely observed for PCET systems.52–54 For example, the Marcus plot for oxidation of fluorenyl-benzoates showed a linear dependence on oxidant strength for a span almost 1 eV.45 Costentin et al. proposed that this is due to a switch in mechanism between PTET and CEPT pathways.55 This might provide a possible explanation of the lack of curvature over such large span of ET driving force.
Relevance for solar fuels and photoredox catalysis
Mechanistic knowledge of PCET reactions is important for catalysis of energy conversion reactions. In this context, CEPT is often thought of as the most energy-efficient pathway. Circumventing the stepwise pathways leads to a lowering of the activation barrier of the reaction. In, for example, electrocatalytic proton reduction, this can be expected to lead to a higher turnover frequency for hydrogen evolution at lower applied potentials.Mechanistic knowledge is important also when a high turnover frequency is not the primary concern. Complex reduction reactions, such as reduction of CO2 or N2 to yield more energetic and value-added product molecules often suffer from low yields and faradaic efficiencies. Generally, they compete directly with the proton reduction reaction. For example, designing the system in a way that ensures the rate limiting step for proton reduction is in the ETPT zone may in this case be beneficial. Proton reduction will in this case be either weakly dependent or completely independent on the presence of proton sources. An increase in acid strength or pH could in this case favor the desired reaction, while leaving proton reduction unaffected, thereby increasing yield and faradaic efficiency. For photoredox catalysis, similar strategies may be employed to the increase efficiency and selectivity of the reactions.
Such mechanistic tuning is always possible when the mechanisms, and hence the relative dependences on reaction driving force, of the reactions of interest are known. Wang and co-workers recently demonstrated how to take advantage of similar rate-driving force relationships to tune the selectivity of O2-reduction with a molecular catalyst to yield either H2O2 or H2O.56 A similar approach to the one presented in the present study was also recently employed by Dempsey and co-workers.57,58 The authors constructed non-aqueous potential-pKa diagrams for the ligand and metal centered protonation states of a Ni-based proton reduction catalyst, drawing conclusions about the operative mechanism.58
Conclusion
Mechanistic zone diagrams, which were introduced in a previous paper,31 have here proven to be a valuable tool for analyzing PCET reactions. While the relationships between the observed rate constants of PCET reactions are by now well understood, quantitative predictions of when mechanistic switching should occur have to the authors' knowledge not been attempted previously. Here, we have analyzed the competition between ETPT and CEPT directly. The dividing line between the mechanisms can then easily be illustrated in mechanistic zone diagrams. With this as a starting point, we were able to demonstrate the effect of multiple strategies for synthetic tuning of the PCET mechanism. Substitution of the transferring protons for deuterons leads to a lowering of the vibronic coupling and pre-exponential factor of the CEPT reaction. Steric hindrance of the hydrogen bond leads, in the present case, to an increased internal reorganization energy associated with CEPT. The net effect of both modifications is to lower the rate constant for CEPT relative to that of ETPTlim, shifting the dividing line in the zone diagram and allowing for switching of the mechanism. These modifications thus present two strategies for enlarging or diminishing the CEPT-zone in the mechanistic zone diagram, and thereby tuning CEPT reactivity. Many more strategies can be envisioned, such as modification of the PT-distance or modifying the energetic coupling between proton and electron transfer. We believe that discussion of PCET-mechanisms in terms of zone diagrams significantly simplifies a rather complex topic and hope that this methodology will be adopted by others.Experimental
Rate constants obtained in this study were measured with laser flash photolysis, utilizing the flash quench technique as described previously.16 In brief, a sample containing ruthenium-sensitizer, methyl viologen, 4-methoxyphenol and pyridine base was excited by a 10 ns laser pulse originating from a 1064 nm Q-switched Nd:YAG laser, modified by sum-frequency generation to 532 nm or 355 nm, and in some cases tuned with an optical parametric oscillator to 460 nm. After excitation, changes in absorption were monitored at 450 nm and rate constants were obtained by linear regression to a single exponential decay. A typical sample contained 40–80 μM ruthenium(II) sensitizer with hexafluorophosphate as the counterion, 30 mM methyl-viologen hexafluorophosphate, 80 μM to 10 mM 4-methoxyphenol and concentrations ranging from 0–1 M of the proton-accepting base. In cases where the observed PCET rate constants approached the rate constant of excited state quenching of the sensitizer, the excited state decay was measured separately by monitoring the decay of emission at 620–680 nm, and PCET rate constants were obtained by a bi-exponential fit, keeping the rate constant corresponding to excited state decay fixed. The charge recombination between Ru(III) and viologen radical was always sufficiently slow compared to the oxidation of phenol that it could be neglected.4-Methoxyphenol, 4-methoxypyridine, pyridine, 2,6-lutidine, 2,4,6-collidine, methyl viologen dichloride hexahydrate, deuterium oxide and spectroscopic grade acetonitrile were purchased from Sigma-Aldrich. All chemicals were used without further purification.
Ru(bpy)3(PF6)2 and Ru(dmb)3(PF6)2 were available from previous studies.15,16 Ru(bpy)2(deeb)(PF6)2, Ru(bpy)2(dmb)3Cl2 and Ru(dmb)2(bpy)Cl2 were gifted by colleagues. Counterion exchange from Cl− to PF6− was done by solubilization of the chloride compound in a small volume of water, and subsequent addition of near-saturated KPF6 solution (obtained from Lancaster) in large excess. The product was filtered, washed with deionized water and dried.
Data availability
The kinetic traces on which this study is based are shown in the ESI.†Author contributions
RT and LH conceived the study, discussed the results and wrote the paper. RT also planned, performed and evaluated the experiments.Conflicts of interest
There are no conflicts to declare.Acknowledgements
The authors would like to thank Dr Wesley Swords for providing Ru(bpy)2(deeb)(PF6)2 and Dr Ben Johnson for providing Ru(bpy)2(dmb)3Cl2 and Ru(dmb)2(bpy)Cl2. This work was supported by The Swedish Research Council (grant no. 2020-05246).References
- N. Nelson and A. Ben-Shem, Nat. Rev. Mol. Cell Biol., 2004, 5, 971–982 CrossRef CAS.
- V. R. Kaila, M. I. Verkhovsky and M. Wikström, Chem. Rev., 2010, 110, 7062–7081 CrossRef CAS.
- C. Cui, B. L. Greene, G. Kang, C. L. Drennan, J. Stubbe and D. G. Nocera, J. Am. Chem. Soc., 2020, 143, 176–183 CrossRef.
- M. W. Kanan and D. G. Nocera, Science, 2008, 321, 1072–1075 CrossRef CAS.
- C. J. Curtis, A. Miedaner, R. Ciancanelli, W. W. Ellis, B. C. Noll, M. Rakowski DuBois and D. L. DuBois, Inorg. Chem., 2003, 42, 216–227 CrossRef CAS PubMed.
- C. Costentin, S. Drouet, G. Passard, M. Robert and J.-M. Savéant, J. Am. Chem. Soc., 2013, 135, 9023–9031 CrossRef CAS.
- M. D. Symes, Y. Surendranath, D. A. Lutterman and D. G. Nocera, J. Am. Chem. Soc., 2011, 133, 5174–5177 CrossRef CAS PubMed.
- H. G. Yayla, H. Wang, K. T. Tarantino, H. S. Orbe and R. R. Knowles, J. Am. Chem. Soc., 2016, 138, 10794–10797 CrossRef CAS PubMed.
- S. T. Nguyen, Q. Zhu and R. R. Knowles, ACS Catal., 2019, 9, 4502–4507 CrossRef CAS PubMed.
- M. H. Shaw, J. Twilton and D. W. MacMillan, J. Org. Chem., 2016, 81, 6898–6926 CrossRef CAS.
- J.-D. Yang, P. Ji, X.-S. Xue and J.-P. Cheng, J. Am. Chem. Soc., 2018, 140, 8611–8623 CrossRef CAS PubMed.
- T. Irebo, M.-T. Zhang, T. F. Markle, A. M. Scott and L. Hammarström, J. Am. Chem. Soc., 2012, 134, 16247–16254 CrossRef CAS PubMed.
- M.-T. Zhang, J. Nilsson and L. Hammarström, Energy Environ. Sci., 2012, 5, 7732–7736 RSC.
- M. Bourrez, R. Steinmetz, S. Ott, F. Gloaguen and L. Hammarström, Nat. Chem., 2015, 7, 140–145 CrossRef CAS.
- T. Liu, M. Guo, A. Orthaber, R. Lomoth, M. Lundberg, S. Ott and L. Hammarström, Nat. Chem., 2018, 10, 881–887 CrossRef CAS.
- T. Liu, R. Tyburski, S. Wang, R. Fernández-Terán, S. Ott and L. Hammarström, J. Am. Chem. Soc., 2019, 141, 17245–17259 CrossRef CAS PubMed.
- T. Huang, E. S. Rountree, A. P. Traywick, M. Bayoumi and J. L. Dempsey, J. Am. Chem. Soc., 2018, 140, 14655–14669 CrossRef CAS.
- P. Dongare, S. Maji and L. Hammarström, J. Am. Chem. Soc., 2016, 138, 2194–2199 CrossRef CAS PubMed.
- C. Bronner and O. S. Wenger, J. Phys. Chem. Lett., 2012, 3, 70–74 CrossRef CAS.
- C. Bronner and O. S. Wenger, Inorg. Chem., 2012, 51, 8275–8283 CrossRef CAS.
- J. Yuasa and S. Fukuzumi, J. Am. Chem. Soc., 2006, 128, 14281–14292 CrossRef CAS.
- A. Soudackov and S. Hammes-Schiffer, J. Chem. Phys., 1999, 111, 4672–4687 CrossRef CAS.
- A. Soudackov and S. Hammes-Schiffer, J. Chem. Phys., 2000, 113, 2385–2396 CrossRef CAS.
- S. Hammes-Schiffer, J. Am. Chem. Soc., 2015, 137, 8860–8871 CrossRef CAS PubMed.
- E. Hatcher, A. V. Soudackov and S. Hammes-Schiffer, J. Am. Chem. Soc., 2004, 126, 5763–5775 CrossRef CAS PubMed.
- E. Hatcher, A. V. Soudackov and S. Hammes-Schiffer, J. Am. Chem. Soc., 2007, 129, 187–196 CrossRef CAS PubMed.
- S. Hammes-Schiffer and A. A. Stuchebrukhov, Chem. Rev., 2010, 110, 6939–6960 CrossRef CAS.
- R. A. Marcus and N. Sutin, Biochim. Biophys. Acta, Rev. Bioenerg., 1985, 811, 265–322 CrossRef CAS.
- D. Borgis and J. T. Hynes, J. Phys. Chem., 1996, 100, 1118–1128 CrossRef CAS.
- C. Tommos and G. T. Babcock, Biochim. Biophys. Acta, Bioenerg., 2000, 1458, 199–219 CrossRef CAS.
- R. Tyburski, T. Liu, S. D. Glover and L. Hammarström, J. Am. Chem. Soc., 2021, 143, 560–576 CrossRef CAS PubMed.
- L. Biczók, N. Gupta and H. Linschitz, J. Am. Chem. Soc., 1997, 119, 12601–12609 CrossRef.
- A. Juris, V. Balzani, F. Barigelletti, S. Campagna, P. l Belser and A. von von Zelewsky, Coord. Chem. Rev., 1988, 84, 85–277 CrossRef CAS.
- K. Y.-D. Tsai and I.-J. Chang, Inorg. Chem., 2017, 56, 8497–8503 CrossRef CAS PubMed.
- S. Tshepelevitsh, A. Kütt, M. Lõkov, I. Kaljurand, J. Saame, A. Heering, P. G. Plieger, R. Vianello and I. Leito, Eur. J. Org. Chem., 2019, 2019, 6735–6748 CrossRef CAS.
- E. R. Altwicker, Chem. Rev., 1967, 67, 475–531 CrossRef CAS.
- S. V. Lymar, M. Z. Ertem, A. Lewandowska-Andralojc and D. E. Polyansky, J. Phys. Chem. Lett., 2017, 8, 4043–4048 CrossRef CAS.
- S. V. Lymar, M. Z. Ertem and D. E. Polyansky, Dalton Trans., 2018, 47, 15917–15928 RSC.
- J. J. Warren, T. A. Tronic and J. M. Mayer, Chem. Rev., 2010, 110, 6961–7001 CrossRef CAS.
- W. D. Morris and J. M. Mayer, J. Am. Chem. Soc., 2017, 139, 10312–10319 CrossRef CAS.
- D. Usharani, D. C. Lacy, A. S. Borovik and S. Shaik, J. Am. Chem. Soc., 2013, 135, 17090–17104 CrossRef CAS.
- M. K. Goetz and J. S. Anderson, J. Am. Chem. Soc., 2019, 141, 4051–4062 CrossRef CAS.
- J. W. Darcy, S. S. Kolmar and J. M. Mayer, J. Am. Chem. Soc., 2019, 141, 10777–10787 CrossRef CAS.
- M. J. Chalkley, P. Garrido-Barros and J. C. Peters, Science, 2020, 369, 850–854 CrossRef CAS PubMed.
- T. F. Markle, J. W. Darcy and J. M. Mayer, Sci. Adv., 2018, 4, eaat5776 CrossRef PubMed.
- C. F. Bernasconi, Tetrahedron, 1985, 41, 3219–3234 CrossRef CAS.
- C. F. Bernasconi, Acc. Chem. Res., 1992, 25, 9–16 CrossRef CAS.
- D. Bím, M. Maldonado-Domínguez, L. Rulíšek and M. Srnec, Proc. Natl. Acad. Sci. U. S. A., 2018, 115, E10287–E10294 CrossRef PubMed.
- M. Maldonado-Dominguez and M. Srnec, J. Am. Chem. Soc., 2020, 142, 3947–3958 CrossRef CAS PubMed.
- E. R. Sayfutyarova, Y.-C. Lam and S. Hammes-Schiffer, J. Am. Chem. Soc., 2019, 141, 15183–15189 CrossRef CAS PubMed.
- E. R. Sayfutyarova, Z. K. Goldsmith and S. Hammes-Schiffer, J. Am. Chem. Soc., 2018, 140, 15641–15645 CrossRef CAS.
- C. J. Fecenko, H. H. Thorp and T. J. Meyer, J. Am. Chem. Soc., 2007, 129, 15098–15099 CrossRef CAS.
- J. N. Schrauben, M. Cattaneo, T. C. Day, A. L. Tenderholt and J. M. Mayer, J. Am. Chem. Soc., 2012, 134, 16635–16645 CrossRef CAS PubMed.
- G. A. Parada, Z. K. Goldsmith, S. Kolmar, B. P. Rimgard, B. Q. Mercado, L. Hammarström, S. Hammes-Schiffer and J. M. Mayer, Science, 2019, 364, 471–475 CrossRef CAS.
- C. Costentin and J.-M. Savéant, Chem. Sci., 2020, 11, 1006–1010 RSC.
- Y.-H. Wang, P. E. Schneider, Z. K. Goldsmith, B. Mondal, S. Hammes-Schiffer and S. S. Stahl, ACS Cent. Sci., 2019, 5, 1024–1034 CrossRef CAS.
- B. D. McCarthy and J. L. Dempsey, Inorg. Chem., 2017, 56, 1225–1231 CrossRef CAS PubMed.
- E. S. Rountree, B. D. McCarthy and J. L. Dempsey, Inorg. Chem., 2019, 58, 6647–6658 CrossRef CAS PubMed.
Footnote |
† Electronic supplementary information (ESI) available: Experimental data for determination of association constants and rate constant, calculation of  and derivation of eqn (8). See DOI: 10.1039/d1sc05230f and derivation of eqn (8). See DOI: 10.1039/d1sc05230f |
| This journal is © The Royal Society of Chemistry 2022 |