
 Open Access Article
 This Open Access Article is licensed under a Creative Commons Attribution-Non Commercial 3.0 Unported Licence
Universal dynamical onset in water at distinct material interfaces†
Lirong
Zheng‡
 ab,
Zhuo
Liu‡
a,
Qiang
Zhang‡
*c,
Song
Li
a,
Juan
Huang
d,
Lei
Zhang
e,
Bing
Zan
a,
Madhusudan
Tyagi
fg,
He
Cheng
*hi,
Taisen
Zuo
hi,
Victoria García
Sakai
j,
Takeshi
Yamada
k,
Chenxing
Yang
a,
Pan
Tan
a,
Fan
Jiang
a,
Hao
Chen
b,
Wei
Zhuang
*bl and
Liang
Hong
*an
ab,
Zhuo
Liu‡
a,
Qiang
Zhang‡
*c,
Song
Li
a,
Juan
Huang
d,
Lei
Zhang
e,
Bing
Zan
a,
Madhusudan
Tyagi
fg,
He
Cheng
*hi,
Taisen
Zuo
hi,
Victoria García
Sakai
j,
Takeshi
Yamada
k,
Chenxing
Yang
a,
Pan
Tan
a,
Fan
Jiang
a,
Hao
Chen
b,
Wei
Zhuang
*bl and
Liang
Hong
*an
aSchool of Physics and Astronomy, Institute of Natural Sciences, Shanghai National Center for Applied Mathematics (SJTU Center), MOE-LSC, Shanghai Jiao Tong University, Shanghai 200240, China. E-mail: hongl3liang@sjtu.edu.cn
bState Key Laboratory of Structural Chemistry, Fujian Institute of Research on the Structure of Matter, Chinese Academy of Sciences, Fuzhou, Fujian 35000, China. E-mail: wzhuang@fjirsm.ac.cn
cCollege of Chemistry and Materials Science, Inner Mongolia University for Nationalities, Tongliao, Inner Mongolia 028043, China. E-mail: qzhang@imun.edu.cn
dSchool of Life Sciences and Biotechnology, Shanghai Jiao Tong University, Shanghai 200240, China
eSchool of Materials Science and Engineering, Shanghai Jiao Tong University, Shanghai 200240, China
fNIST Center for Neutron Research, National Institute of Standards and Technology (NIST), Gaithersburg, Maryland 20899, USA
gDepartment of Materials Science and Engineering, University of Maryland, College Park, Maryland 20742, USA
hChina Spallation Neutron Source (CSNS), Institute of High Energy Physics (IHEP), Chinese Academy of Science (CAS), Dongguan 523803, China. E-mail: chenghe@ihep.ac.cn
iDongguan Institute of Neutron Science (DINS), Dongguan 523808, China
jISIS Pulsed Neutron and Muon Source, Rutherford Appleton Laboratory, Science & Technology Facilities Council, Didcot OX11 0QX, UK
kNeutron Science and Technology Center, Comprehensive Research Organization for Science and Society, 162-1 Shirakata, Tokai, Naka, Ibaraki 319-1106, Japan
lInstitute of Urban Environment, Chinese Academy of Sciences, Xiamen, Fujian 361021, China
mShanghai Artificial Intelligence Laboratory, Shanghai 200232, China
nShanghai Artificial Intelligence Laboratory, Shanghai 200232, China
First published on 28th March 2022
Abstract
Interfacial water remains liquid and mobile much below 0 °C, imparting flexibility to the encapsulated materials to ensure their diverse functions at subzero temperatures. However, a united picture that can describe the dynamical differences of interfacial water on different materials and its role in imparting system-specific flexibility to distinct materials is lacking. By combining neutron spectroscopy and isotope labeling, we explored the dynamics of water and the underlying substrates independently below 0 °C across a broad range of materials. Surprisingly, while the function-related anharmonic dynamical onset in the materials exhibits diverse activation temperatures, the surface water presents a universal onset at a common temperature. Further analysis of the neutron experiment and simulation results revealed that the universal onset of water results from an intrinsic surface-independent relaxation: switching of hydrogen bonds between neighboring water molecules with a common energy barrier of ∼35 kJ mol−1.
Introduction
Interfacial water is ubiquitous on Earth, playing a crucial role in biology, chemistry, physics, materials and environmental science.1–10 The material surfaces, exhibiting a large degree of heterogeneity in their structure, chemistry and morphology, can significantly perturb the structure and dynamics of the water located inside the hydration shell.1–16 One such consequence is the prevention of ice formation upon cooling, with interfacial water remaining in a liquid phase and mobile at temperatures much below 0 °C.1–18 This non-freezing interfacial water imparts a great amount of flexibility and mobility to the underlying substrate materials, such as protein,4 DNA,19 RNA,20 polymers18 or ions,21 to activate and ensure their functions at low temperatures. Interfacial water therefore plays critical roles in a plethora of important subzero temperature phenomena such as facilitating the survival of life,5 maintaining the flexibility of hydrogel-based electronic devices or artificial muscle,7,13,14,22 and preserving the electronic conduction in aqueous batteries.15,16,21 Although the importance of low-temperature mobility of non-freezing surface water as the functional solvent is widely recognized, how this mobility of water varies across different materials remains largely unknown.Among different kinds of non-freezing interfacial water, the one on proteins has arguably attracted the most attention, as the low-temperature flexibility in proteins induced by water is connected to the thermal onset of the functions of the biomacromolecules.4,5,23,24 In the presence of one layer of hydration water, proteins exhibit a dynamical onset around 200–260 K, across which they transform from a rigid, harmonic state, to a flexible, anharmonic state.4,23,25–30 This transition is related to the onset of various protein functions, as for instance, myoglobin,31 ribonuclease,32 elastase33 and bacteriorhodopsin34 become active above the dynamical onset temperature. Such dynamical onset has also been widely observed in DNA, tRNA, lipid membranes, and other non-biological systems such as polypeptides,35 hydrogels,7 and even in mixtures of unbound amino acids,35 and it is absent when the material is dehydrated.7,20,27,36 A plethora of experimental and simulation studies further suggested that the dynamical onset of a hydrated material is coupled to or driven by the thermal activation of dynamical modes in its surface water, i.e., the dynamical onset in hydration water.8,26,37–39
Two different scenarios have been proposed to rationalize the dynamical onset in hydration water. One suggests that it arises from a critical phenomenon, i.e., the structure of hydration water makes a transition from predominantly high-density to low-density forms.40–42 The other scenario describes it as a kinetic phenomenon, which occurs when the relaxation process in water becomes fast enough upon heating to appear in the time window probed by a neutron spectrometer at the onset temperature (Ton).43–46 In other words, the dynamical onset is not a critical phenomenon but occurs as the characteristic relaxation time of water enters the resolution window of the neutron scattering spectrometers at the Ton as τ(Ton) ∼ Δt. The kinetic scenario has been supported by ref. 43, where the authors demonstrated that the same relaxation probed by dielectric spectroscopy obeys a continuous temperature dependence without showing the “cusp-like” sudden change as seen in neutron scattering when the characteristic relaxation time exceeds the neutron time window. This has also been supported by ref. 44, where the transition disappears when the author fits the neutron data using different models. In addition to the experimental results, the molecular dynamics simulation work reported in ref. 46 also favored the kinetic scenario which showed that the transition temperature is not critical but rather changes to a lower temperature when enlarging the time window to analyze the dynamical modes. As reported in the literature, distinct materials (proteins, polymers and lipid membranes) exhibit vastly different dynamical onset temperatures, varying from 200 to 260 K.4,7,29 The intriguing question then arises as to whether the onset temperature of the interfacial water is also material-specific or it is an intrinsic property of water, independent of the substrate.
Neutron scattering is highly sensitive to hydrogen atoms,47–49 and thus constitutes a valuable tool for the in situ characterization of the dynamics of the interfacial water and the underlying materials independently by selective deuteration.50–53 Here, we combined neutron experiments with isotope labelling to explore the temperature dependence of the dynamics of water and the underlying substrate independently over a broad range of materials – proteins, DNA, tRNA, polymer, and graphene oxide with different oxidation rates, in different forms (powders and membranes) and at different levels of hydration. While distinct materials show significant diversity in their characteristic dynamical onset temperatures (Table S1†), the onset temperature of hydration water is found to be universal in the systems studied, independent of the chemistry, the structure and the level of hydration. Further experiments, combining data from various neutron spectrometers with different time resolutions, demonstrated that the observed universal onset of hydration water results from an intrinsic relaxation process of water with a constant energy barrier of ∼35 kJ mol−1. Molecular dynamics simulations identified this process as the switching of surface water–water hydrogen bonds. Unlike the commonly observed reorientation and translation of water molecules, whose mobility is known to depend on the local chemical and physical environment on the material surface, the switching of surface water–water hydrogen bonds studied herein is found to be a rather surface-independent process.
Results and discussion
Dynamics of hydration water revealed by the elastic neutron scattering
Three different categories of materials were examined here: biomacromolecules (DNA, tRNA, cytochrome P450 (CYP) and green fluorescent protein (GFP)), graphene-based materials (graphene oxide (GO) and reduced graphene oxide (rGO)) and polymer (polyethylene glycol (PEG)). The chemical structures of these materials are presented in Scheme 1. The biomaterials, polymers and rGO are in the form of powders, while GO is prepared as a membrane where water molecules are sandwiched between the GO sheets.17 To highlight the dynamics of water, fully deuterated proteins and PEG were used and hydrated in H2O. For simplicity, the perdeuterated proteins and PEG are labeled as D-protein and D-PEG, respectively, while regular ones are denoted as H-protein and H-PEG. The quantity measured in the neutron experiment is the elastic intensity, i.e. the intensity of the elastic peak in the dynamic structure factor, S(q, Δt), where q is the scattering wave vector and Δt is the resolution time accessible by the neutron spectrometer. S(q, Δt) is an estimate of the average amplitude of the atomic motions up to Δt.24,47 Three neutron backscattering spectrometers with different resolutions were chosen: HFBS at the NIST Center for Neutron Scattering in the USA, DNA at the Materials and Life Science Experimental Facility at J-PARC in Japan, and OSIRIS at the ISIS Neutron and Muon Facility in the UK. The instrumental energy resolutions are 1 μeV (HFBS), 13 μeV (DNA), 25.4 μeV, and 99 μeV (OSIRIS in two different configurations), corresponding to timescales of 1 ns,54 80 ps,55,56 40 ps (ref. 57) and 10 ps,57 respectively. Details of the sample preparation and neutron experiments are provided in the ESI.† | ||
| Scheme 1 Structures of different substrate materials. Chemical structures of (a) green fluorescent protein (GFP), (b) cytochrome P450 (CYP), (c) DNA, (d) tRNA, (e) polyethylene glycol (PEG), (f) graphene oxide (GO), and (g) reduced graphene oxide (rGO). The blue, red and white spheres represent carbon atoms, oxygen atoms and hydrogen atoms, respectively. | ||
S(q, Δt) measured on all materials hydrated in H2O is presented in Fig. 1a. As the surface water contributes much more to the neutron signals than the underlying materials in these systems (see Table S2†), the results in Fig. 1a primarily reflect the dynamics of water. The onset of the rapid decrease of S(q, Δt) with increasing temperature marks the harmonic-to-anharmonic transition in the hydration water (see the gray arrow), namely the dynamical onset. Although the surfaces of the substrate materials differ significantly in chemistry, hydrophobicity, and morphology (see Scheme 1), the interfacial water therein shows approximately the same onset temperature, i.e., Ton ∼ 200 K. We also calculated the temperature dependence of the mean-square displacement (MSD) of surface water in distinct materials by Gaussian approximation. As shown in Fig. S1 and S2,†Ton obtained from the MSD curve is in good agreement with the results from analyzing S(q, Δt) presented in Fig. 1a. Furthermore, Ton is also found to be independent of the amount of hydration (Fig. 2). In sharp contrast, the dynamical onsets of the underlying materials present significantly different Ton as can been seen in Fig. 1b and Table S1.† Undoubtedly, the dynamical onset of interfacial water is a universal and intrinsic nature of water itself, while the one of the underlying substrate materials is system-specific.
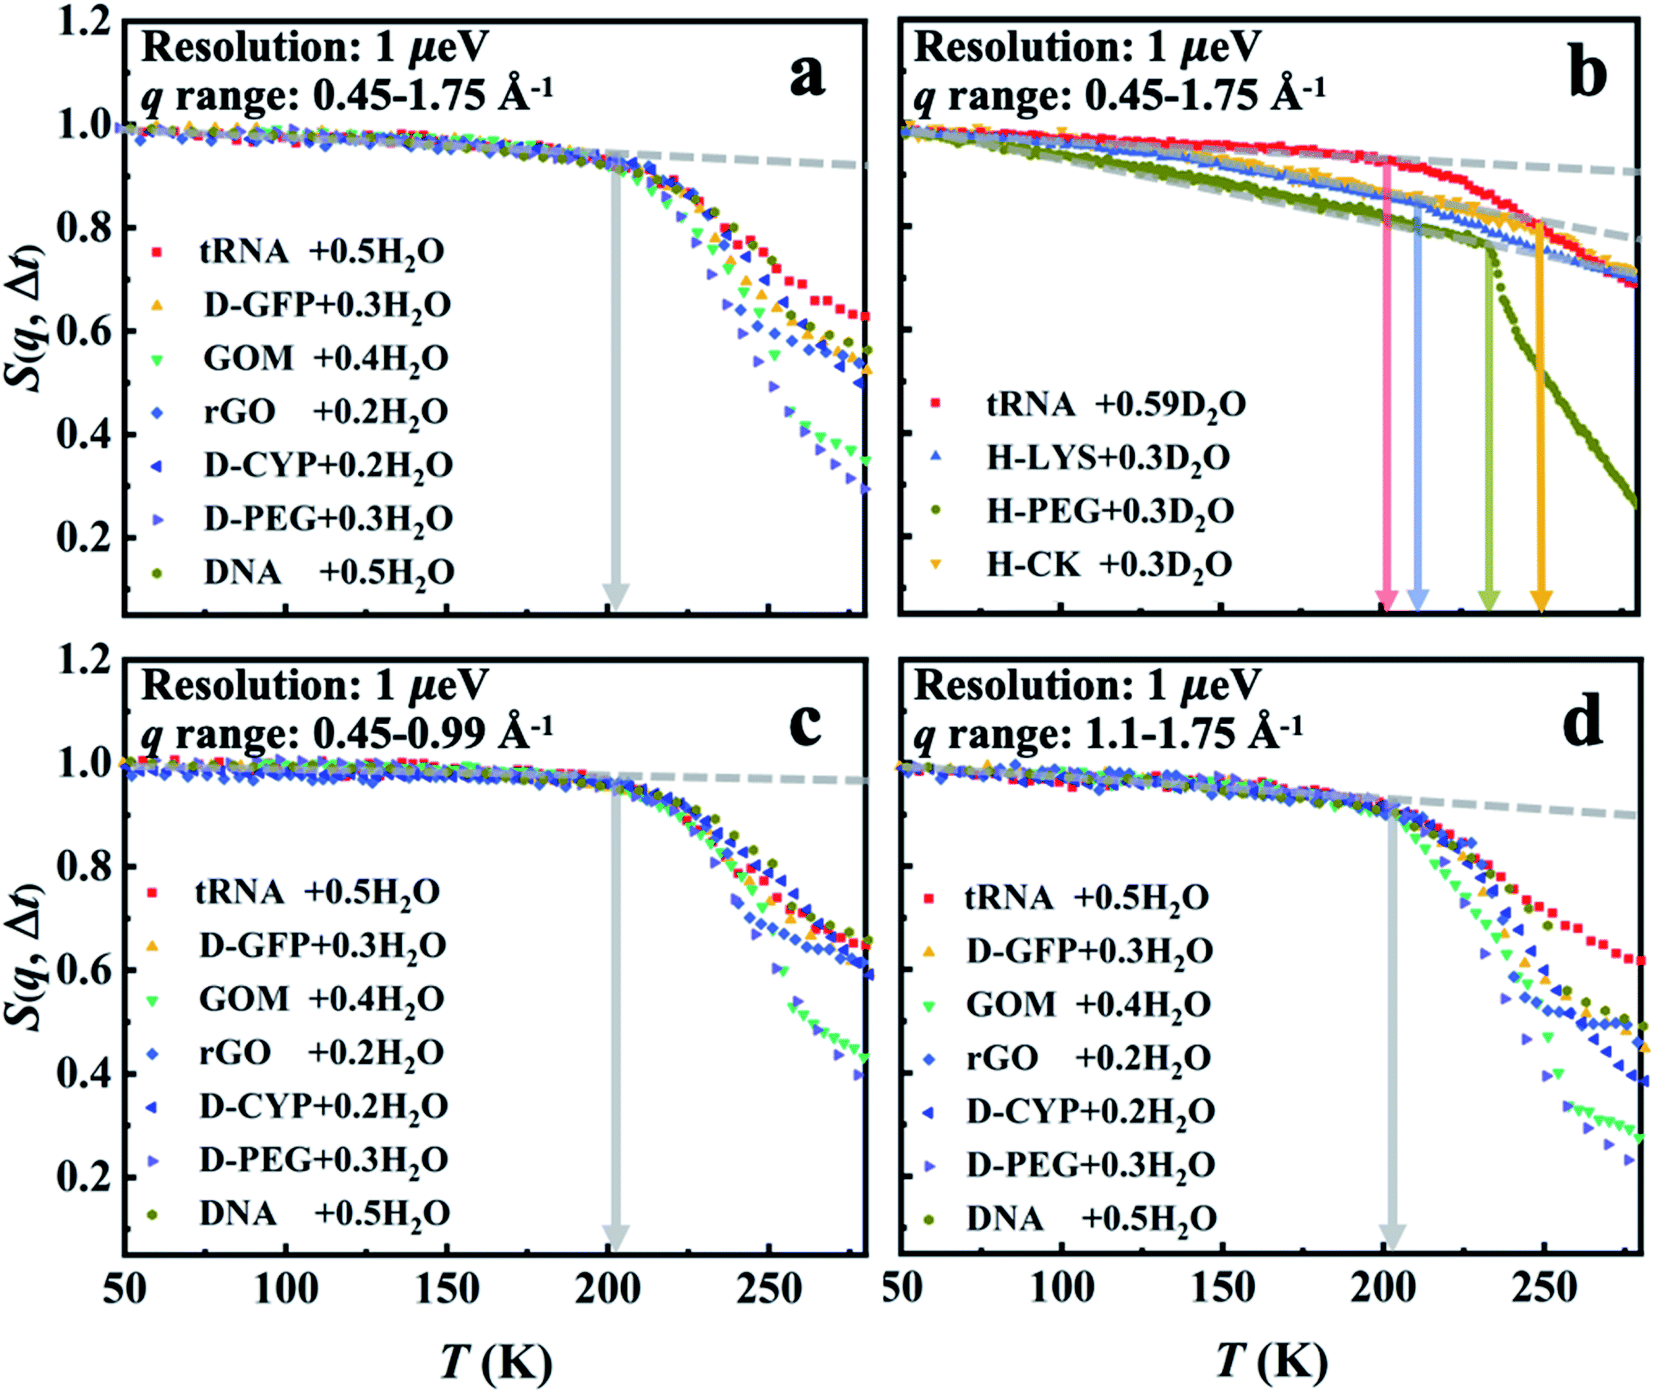 | ||
| Fig. 1 Dynamical onset in hydration water and the substrate materials as measured by HFBS at a resolution of 1 μeV (Δt = 1 ns). The temperature-dependent elastic intensity S(q, Δt) of (a) the materials (tRNA, DNA, GOM, rGO, D-CYP, D-GFP and D-PEG) hydrated in H2O and of (b) the materials (tRNA, H-lysozyme (H-LYS), H-creatine amidinohydrolase (H-CK) and H-PEG) hydrated in D2O. All the experimental S(q, Δt) are normalized to the lowest temperature, and summed over the values of q ranging from 0.45 to 1.75 Å−1. The relative contributions from the water and the underlying substrate materials to the overall neutron signals measured on the different systems are provided in Table S2.† As indicated by Table S2,† the neutron data in (a) primarily reflect the dynamics of interfacial water while those in (b) correspond to those of the encapsulated materials. The same results in (a) but summed over different ranges of q (c) from 0.45 to 0.99 Å−1 and (d) from 1.1 to 1.75 Å−1. The data for tRNA + 0.59D2O are replotted from ref. 20. In each figure, the dashed lines guide the low-temperature harmonic behavior of the materials, and the deviation from this low-temperature behavior marked as arrows identifies the temperatures of the dynamical onset, Ton. The same treatment is used in Fig. 2–7. The fractional value in front of “H2O” or “D2O” furnishes the hydration level of water (in grams) per gram material. | ||
 | ||
| Fig. 2 Dependence of the dynamical onset temperature in the hydration water on the hydration level. The neutron spectrometer, HFBS, with a resolution of 1 μeV was applied. S(q, Δt) of (a) GOM in H2O at h = 0.4 and 0.9, (b) rGO in H2O at h = 0.2 and 0.9, and (c) D-CYP in H2O at h = 0.2 and 0.4 are normalized to the lowest temperature and summed over the values of q ranging from 0.45 to 1.75 Å−1. | ||
Fig. 1c and d, S3 and S4† show that Ton of hydration water does not change when the S(q, Δt) is averaged over different ranges of q, i.e., when examined at different length scales. This indicates that the observed dynamical onset of hydration water results from a rather local process, limited within a length scale smaller than 3–4 Å (2π/qmax).51 Moreover, we performed an analysis of the elastic incoherent structure factor, EISF, which is often used to identify the geometry of the dynamical process. As shown in Fig. S5,† the EISF of hydration water in seven different materials shows almost universal behavior. A fitting using the two-site jump model provides a jump distance of ∼3.6 Å.58,59 We note that it is hard to tell whether the two-site or three-site jump models should be used as their performances are approximately indistinguishable. This results from the fact that the experimentally probed q range is too limited at high q values.58
Furthermore, we would like to distinguish whether this universal onset of interfacial water on distinct materials is a critical or a kinetic phenomenon. The two scenarios of dynamical onset in hydration water can be clearly differentiated by examining the dependence of Ton on the resolutions (Δt) of the neutron spectrometers used, as Ton of a critical phenomenon should be independent of the instrument resolution, while for a kinetic process Ton would increase as Δt is reduced.17,60 As seen in Fig. 3, Ton unambiguously increases from 200 K to 245 K when reducing the instrumental resolution from 1 ns to 10 ps for hydration water in various systems. Hence, the kinetic scenario is supported by our results, consistent with earlier dielectric and neutron scattering studies.43,44,61 Therefore, one can deduce that the universal dynamical onset of hydration water demonstrated in Fig. 1a results from a surface-independent intrinsic relaxation process in water, which crosses the resolution of the neutron instrument at Ton. By assuming Arrhenius temperature dependence and using the data in Fig. 3, the energy barrier for this relaxation process was calculated to be ∼35 kJ mol−1.
 | ||
| Fig. 3 Dependence of the dynamical onset temperature in the hydration water on the resolution of the neutron instruments. Neutron spectrometers with different energy resolutions (1, 13, 25.4 and 99 μeV, corresponding to 1 ns, 80 ps, 40 ps, and 10 ps, respectively) were used. S(q, Δt) of (a) D-CYP in H2O at h = 0.4, (b) D-GFP in H2O at h = 0.4, and (c) rGO in H2O at h = 0.1 are normalized to the lowest temperature and summed over the values of q ranging from 0.45 to 1.75 Å−1. The temperature variation of the mean-square displacement of hydration water on D-GFP at Δt = 1 ns was measured by following the method in ref. 74. | ||
Molecular mechanism of the universal dynamical onset in hydration water revealed by computer simulations
To gain further insights into the microscopic nature of the universal dynamical onsets observed in the surface water, we conducted the molecular dynamics (MD) simulations on two distinctively different materials, hydrated CYP and graphene oxide membrane (GOM) (see Fig. 4a and d). As shown in Fig. 4b and e, a prominent onset occurs in MD-derived S(q, Δt) for water in both systems at a similar temperature to that found by the experiment (Fig. 1a and 3). More importantly, Ton of hydration water in both systems shifts to higher temperature when reducing Δt, in agreement with the experimental observation. We further calculated the temperature dependence of the MSD of surface water on GOM and CYP from MD at different resolutions by simulation and experiments. As shown in Fig. S6,†Ton obtained from the MSD curve agrees with the results from analyzing S(q, Δt) presented in Fig. 4b and e. In addition, we compared the MD-derived S(q, Δt) of water around different types of residues on the protein surface (Fig. 4c), and also compared that of water around polar and nonpolar sites on the GOM (Fig. 4f). We found that Ton of the hydration water weakly depends on the local chemistry of the substrate, consistent with the experimental findings (Fig. 1a). Therefore, both experiments and simulations suggested that the dynamical onset of hydration water is independent of the surface chemistry and structure, and it results from an intrinsic relaxation process of water, whose characteristic time crosses the instrumental resolution time at Ton.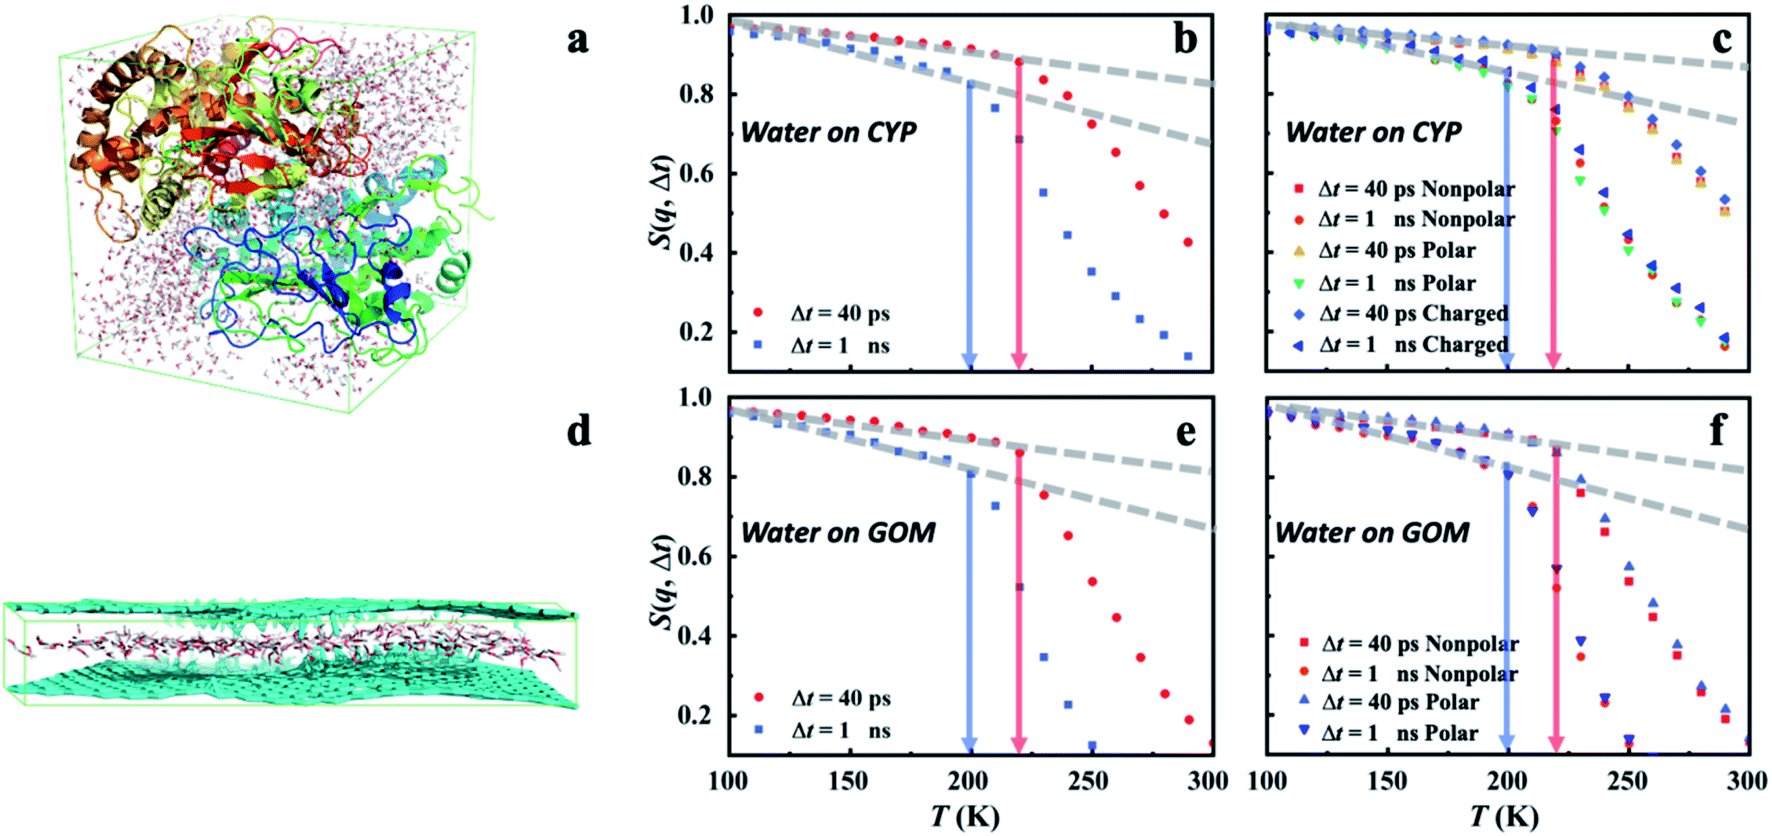 | ||
| Fig. 4 Dynamical onset of hydration water obtained from MD simulations. (a) A snapshot of the MD simulation of the protein CYP hydrated at h = 0.4. S(q, Δt) of hydration water (b) at the surface of CYP and (c) around distinct types of residues on the CYP surface. Charged: Lys, Arg, His, Asp and Glu; nonpolar: Ala, Val, Leu, Ile, Pro, Phe, Trp and Met; polar: Ser, Thr, Tyr, Asn, Gln, Cys, Gly. (d) A snapshot of the MD simulation of the GOM hydrated at h = 0.4. S(q, Δt) of hydration water in (e) GOM and (f) around the polar and nonpolar sites in GOM. Polar: hydroxy, carboxyl, ether or carbonyl groups; nonpolar: carbon atom within the planar surface. Here, water around a specific type of residue (or a specific site) is defined when the initial position of the water molecules in the MD trajectory is around that residue within a distance of 3 Å. The value of 3 Å is chosen as it is about the first minimum in the radial distribution function between oxygen atoms in bulk and hydration water, representing the thickness of water's first coordination shell.50 We note that the residence time of water molecules around a given site is much longer than the resolution time Δt at the corresponding Ton (see Fig. S7†). Hence, the water molecule stays around the site without moving away throughout the entire Δt when calculating the corresponding S(q, Δt) and defining the onset temperature, Ton. The same scheme is applied in Fig. 5–7 and S8–S11.† | ||
The switching of hydrogen bonds between neighboring water molecules is a ubiquitous elementary relaxation process in various forms of water.62–64 To reveal the connection between the interfacial inter-water hydrogen-bond switching and the intrinsic dynamical onset process observed (Fig. 1), we calculated the water–water hydrogen bond correlation function CH(t) as defined by eqn (S2) (see in the details in the ESI†). In Fig. 5a, the correlation function CH(t) of the interfacial water–water hydrogen bond at different temperatures around distinct protein-surface residues does not vary with the local chemistry.
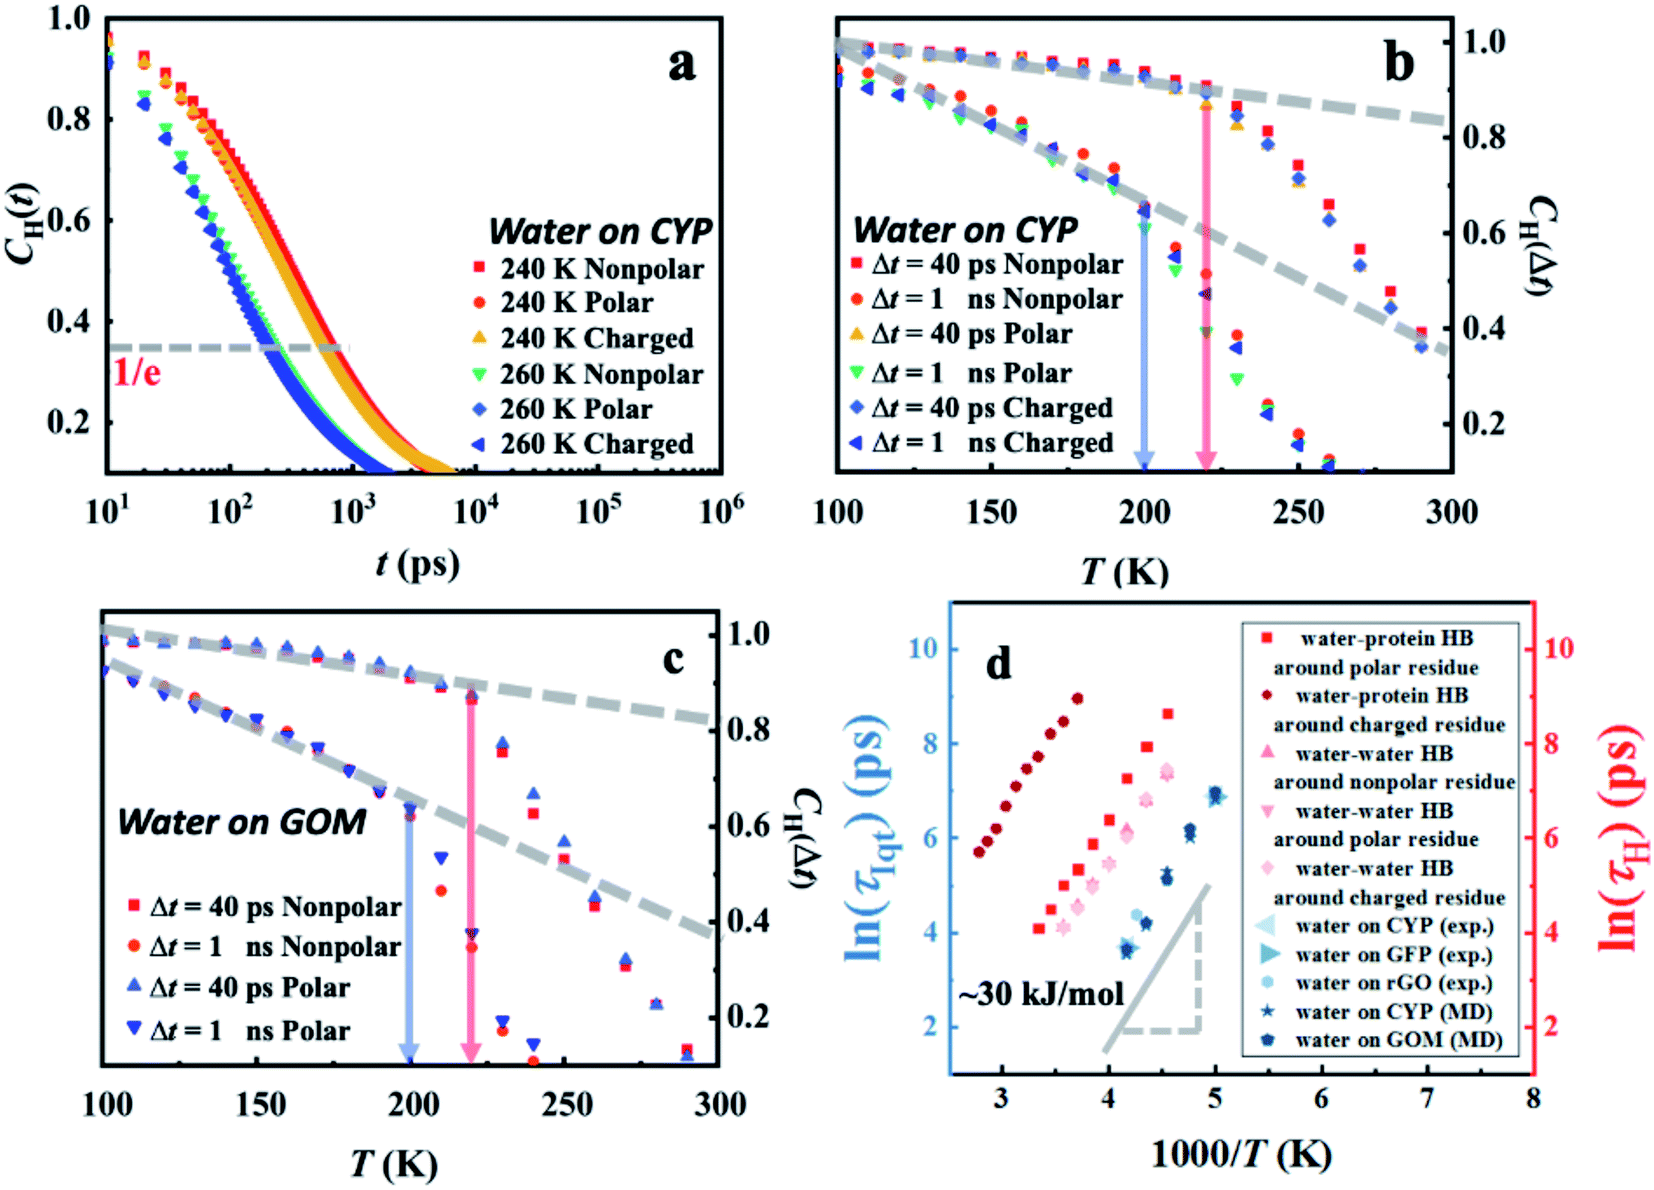 | ||
| Fig. 5 Temperature-dependent hydrogen-bond relaxation in hydration water derived from MD simulations. Correlation function CH(t) (eqn (S2)†) of the water–water hydrogen bond for water molecules around different protein-surface residues at (a) 240 K and 260 K. The temperature dependence of CH(Δt) at distinct values of Δt around (b) distinct types of residues on the surface of CYP and around (c) different sites in GOM. (d) The characteristic relaxation time, τH, of water–water and water–protein hydrogen-bond switching, is defined as the time when the correlation function CH(t) decays to 1/e. The temperature dependence of τH around distinct types of residues on the CYP surface is presented here. | ||
In analogy to the elastic neutron scattering intensity S(q, Δt), we calculated the value of CH(t) at t = Δt of water on the protein and GOM, and presented its temperature dependence in Fig. 5b and c, respectively. When comparing Fig. 5b with Fig. 4c as well as comparing Fig. 5c with Fig. 4f, one can find that the temperature dependence of CH(Δt) is very similar to that of S(q, Δt), and both of them are independent of the local chemistry of the substrates. Furthermore, the characteristic relaxation time τH, defined as the time when CH(t) decays to 1/e (Fig. 5a), has an Arrhenius-like temperature dependence with an energy barrier of ∼30 kJ mol−1 (Fig. 5d), consistent with that derived from the experimental neutron scattering data (∼35 kJ mol−1). We note that the lifetime of the hydrogen bond is sensitive to how it is defined.65,66 Thus, we calculated the correlation function CH(t) using various definitions.65,66 As shown in Fig. S9,† the definitions of the hydrogen bond correlation function do not significantly affect the relaxation time of the hydrogen bond or the associated energy barrier.
A significant similarity between CH(t) and S(q, Δt) in terms of their dependence on temperature and local chemistry and the associated energy barrier indicates that the universal dynamical onset of surface water observed experimentally results from a local relaxation process, i.e., the switching of hydrogen bonds between the neighboring water molecules.
The switching of hydrogen bonds is the elementary relaxation process underlying the hydration water rotational and translational dynamics.67–69 Several experimental as well as computational studies have suggested that the rotation and translation of hydration water are not universal (sensitive to the local surface environment).60–62 Water motion at a local substrate surface region usually consists of and is decided by not only the water–water but also water–substrate hydrogen bond switching. The relaxation time of the water–protein hydrogen bond (Fig. 5d) depends strongly on the type of residue, albeit with the same energy barrier (∼30 kJ mol−1). This result is, therefore, consistent with the non-universal hydration water rotational dynamics observed in previous studies.67–69 We also examined the temperature dependence of the characteristic time of the local translational motion of water molecules, which is defined as the residence time (τres) required for the water molecules staying around a position before moving away by a cut-off distance of 3 Å.70 Fig. S10† reveals that τres has a strong dependence on the local chemistry where water molecules around the charged residues of the protein surface need a much longer time to move away and exhibit a much steeper temperature dependence, i.e., higher energy barrier, with respect to those around the non-charged residues. Hence, although translational motions of water play an important role in lubricating the underlying materials,26,37,71 they are not responsible for the universal dynamical onset observed in hydration water (Fig. 1a).
Interestingly, there was a dielectric study performed on 18 different hydrated systems that revealed some universal dynamical behaviors of the interfacial water.72 Briefly, the experiment studied the cooperative water–water reorientations, namely Process II, which is coupled to the structural relaxation of the whole system (substrate material and water). Ref. 72 revealed that, for all 18 materials studied, Process II always exhibits a crossover from non-Arrhenius to Arrhenius behavior at the glass transition temperature, and the underlying energy barrier is substrate independent. We note that the universal dynamical onset observed in the present work is different from the finding in this dielectric work. Firstly, the water motion responsible for the dynamical onset discovered in the present work is a rather localized process and occurs at least 1000 times faster than the one reported in ref. 72. Secondly, the water motion identified here has both a substrate independent relaxation time and energy barrier while the one in ref. 72 has surface-dependent relaxation time although its energy barrier is material independent. Combining our work with ref. 72, one might deduce that the universal behavior of hydration water occurs on multi-time and spatial scales independent of the underlying substrates.
Doster et al. found that the dynamics of hydration water is modestly influenced by the nature of the proteins.44 Briefly, this revealed that the average relaxation times as a function of reciprocal temperature for hydration water on two different proteins, c-phycocyanin and myoglobin, do not differ much over a wide temperature window across the transition temperature. We note that the above work used neutron scattering to study the dynamics of water on c-phycocyanin as it is perdeuterated, but the temperature dependence of water on myoglobin, which cannot be easily deuterated in a large quantity, over the wide temperature window was characterized using NMR and dielectric spectroscopy. These two techniques give quantitatively different values of relaxation times, which also differ quantitatively from the neutron results. We emphasized that the present work reveals the universal dynamical behavior of hydration water in nine different materials including not only protein but also DNA, tRNA, graphene oxides, and polymers using the same experimental technique. To highlight the neutron signals of water, we particularly deuterated proteins and polymers. This leads to a rather general conclusion of the universality of dynamics in the hydration water over different materials.
Molecular mechanism by which the universal relaxation in hydration water is coupled to the material-specific dynamical onsets in the underlying substrates
The intriguing question arises as to how the surface-independent dynamical onset in hydration water (Fig. 1a) connects to the material-specific onsets in the underlying materials (Fig. 1b and Table S1†). We analyzed the hydrogen bond correlation functions between water and protein-surface residues, and the corresponding values of τH are reported in Fig. S11a.† The water–protein hydrogen bond relaxation time is longer than that of the water–water hydrogen bond, albeit with the same energy barrier (∼30 kJ mol−1). Similar observations are obtained in the case of GOM (see Fig. S11b†). These findings suggest that the hydrogen bond relaxation in hydration water is coupled to the relaxation of the hydrogen bond between water and the substrate materials.Hydrogen bond relaxation between water and the substrate material is inevitably coupled to the dynamics of the latter. To quantitatively examine this effect, we calculated the intermediate scattering functions of protein residues, I(q, t) (eqn (S1)†). A characteristic relaxation time, τIqt, is defined as the time when I(q, t) decays to 0.85, since it is close to the value of S(q, Δt) at Ton (Fig. 4). We note that other choices of the value of I(q, t) (e.g., e−0.5, e−1) will only alter the absolute value of τIqt but not affect the involved energy barrier (see Fig. S8†). The analysis was conducted at q = 1 Å−1, and the average q value explored experimentally. Fig. 6a presents the temperature dependence of τIqt for the heavy atoms of both surface residues and inner-core residues of the protein, as well as the oxygen atoms in hydration water. As can be seen, τIqt of the hydration water shows the same energy barrier (∼30 kJ mol−1, Fig. 6a) as that of τH (Fig. S11a†). The characteristic relaxation of water captured by τIqt therefore results from the switching of hydrogen bonds between water molecules. τIqt of the surface and inner-core residues of the protein molecule also exhibit the same energy barrier, while the absolute values of τIqt rank as τinternal_residue > τsurface_residue > τwater. Thus, one can infer that the water–water hydrogen bond relaxation in the hydration water is coupled to the relaxation of the hydrogen bond between water and the protein surface residue, and this coupling further extends to the dynamics of the protein surface and inner core residues. Hydrogen bonds between protein and water play an important role in transporting the fluctuations between the surface water and the connected protein residues, which is in general agreement with findings in numerous earlier studies.6,71,73 We note that, although the protein surface and its core have the same energy barrier, the rate of the fluctuation differs significantly as the inner-core of the protein is further away from the mobile surface water and thus shows a slower response, which will require a higher temperature to be activated (see Fig. 7a).
 | ||
| Fig. 6 Rendering of the energy barrier of relaxation of hydration water to that of the substrate materials. (a) The characteristic relaxation time, τIqt, of water, CYP internal residues and CYP surface residues as a function of inverse temperature derived from MD simulations. Here, τIqt is defined as the time when the corresponding I(q, t) decays to 0.85 at q = 1 Å−1. (b) τH of water–water hydrogen bond relaxation on CYP and GOM and τIqt of the heavy atoms in the materials (CYP and GOM). | ||
 | ||
| Fig. 7 Temperature-dependent dynamics of the substrate materials derived from MD simulations. Comparison of heavy-atom S(q, Δt) of (a) the surface and inner-core residues of the protein CYP and those of (b) CYP and GOM. | ||
In Fig. 6b, we present the simulation results for the hydrated GOM. The temperature dependence of τIqt for the carbon atoms on GOM again mimics that of hydrogen-bond relaxation in the surface water, i.e., the hydrogen bond relaxation in water triggers a fast relaxation in GOM with the same energy barrier. However, the fast relaxation of the substrate materials does differ among systems. As shown in Fig. 6b, the fast relaxation of GOM is much slower than that of the protein, while the hydrogen-bond relaxations of hydration water on the two materials behave rather similarly. The large dynamical difference between the two materials is probably due to the fact that the planar surface of GOM is formed by many π bonds and is therefore much stiffer than the protein backbone (connected via C–C or C–N bonds). The dynamics of GOM is therefore less perturbed by the surface water and requires higher temperature to activate (Fig. 7b). As a result, although the fast relaxation in the substrate materials has the same energy barrier as the surface water, the absolute rate can differ significantly due to the distinct structures, packing and interaction strength of the materials with the surface water (or distance from the water), thus causing a large diversity in the activation temperature, Ton (see Fig. 1b and Table S1†).
Conclusion
In the present work, we experimentally examined the temperature dependence of the dynamics of non-freezing interfacial water at subzero temperatures across a wide range of materials with drastically different chemical compositions, structures, and packing. In all the systems studied herein, the water molecules present a universal dynamical onset whose characteristic onset temperature is independent of the surface nature of the underlying materials as well as the level of hydration, but varies with the resolution of the neutron spectrometer used. We provided extensive experimental evidence from many different materials supporting the view that the dynamical onset of interfacial water is an intrinsic property of water itself, resulting from a surface independent relaxation process in water with an approximately universal energy barrier of ∼35 kJ mol−1. Complementary computer simulations confirmed the experimental findings and revealed that this intrinsic relaxation corresponds to the switching of the hydrogen bond between neighboring hydration water molecules.Moreover, we found that, although the fast relaxation of the materials has the same energy barrier as its surface water, its rate is strongly dependent on their structure, packing, and interaction with the surface water. The latter leads to system-dependent dynamical onsets and different flexibilities at low temperatures, which could be crucial for their functions at subzero temperatures.
Materials and methods
Elastic incoherent neutron scattering
The elastic scattering intensity S(q, Δt) is normalized to the lowest temperature and is approximately the value of the intermediate scattering function when decaying to the instrument resolution time, Δt. S(q, Δt) was obtained in the temperature range from 10 K (or 100 K) to 300 K during the heating process with a rate of 1.0 K min−1 by using the HFBS at NIST, OSIRIS at ISIS and DNA at J-PARC. The instrumental energy resolutions are 1 μeV (HFBS), 13 μeV (DNA), 25.4 μeV and 99 μeV (OSIRIS in two different configurations), corresponding to timescales of 1 ns, 80 ps, 40 ps and 10 ps, respectively. The results from instruments with various resolutions were summed over the same q from 0.45 to 1.75 Å−1.Molecular dynamics (MD) simulations
The initial structure of protein cytochrome P450 (CYP) for simulations was taken from the PDB crystal structure 1dz9. A cubic box was filled with two protein monomers (see Fig. 4a). 2025 water molecules were inserted into the box randomly to reach a mass ratio of 0.4 grams of water to 1 gram of protein, which mimics the experimental conditions. Then 34 sodium counter ions were added to keep the system neutral in charge. The CHARMM 27 force field in the GROMACS package was used for CYP, while the TIP4P/Ew model was chosen for water. The simulations were carried out at a broad range of temperatures from 360 K to 100 K, with a step of 5 K, to study the temperature-dependent properties. At each temperature, after the 5000 step energy-minimization procedure, a 10 ns NVT simulation was conducted. After that, a 30 ns NPT simulation was carried out at 1 atm with suitable periodic boundary conditions. As shown in Fig. S12,† 30 ns is sufficient to equilibrate the system. The temperature and pressure of the system are controlled by the velocity rescaling method and the method of Parrinello and Rahman, respectively. All bonds of water in all the simulations were constrained with the LINCS algorithm to maintain their equilibration length. In all the simulations, the system was propagated using the leap-frog integration algorithm with a time step of 2 fs. The electrostatic interactions were calculated using the Particle Mesh Ewald (PME) method. A non-bonded pair-list cutoff of 1 nm was used and the pair-list was updated every 20 fs.We also performed MD simulation on a hydrated GOM system at different temperatures, with a mass ratio of 0.4 gram of water to 1 gram of GOM, to mimic the experimental conditions. We used the OPLS-AA force field for GOM, and TIP4P/Ew for water. The interaction model between GOM and water is derived based on the combination rule. The simulation cell contains two layers of GO, and is periodically repeated in all dimensions (see Fig. 4d). The GO sheets contain 960 carbon atoms, 110 hydroxyl groups and 96 epoxy groups. The distribution of oxidized groups was determined based on the rate constant of the oxidation reaction. The oxidation reaction pathways and corresponding energy barrier were calculated using DFT. Then the calculated energy barrier was used to derive the rate constant based on conventional transition state theory. The net oxidation rate is 23%, mimicking the experimental sample (28%) as determined by XPS. The simulation procedures adopted are the same as those used in the CYP systems.
All MD simulations were performed using GROMACS 4.5.1 (CYP) and LAMMPS (GOM) software packages. Representative simulation snapshots of the two systems are given in Fig. 4a and d, respectively.
Data availability
All the data are shown in the ESI.†Author contributions
L. H. and W. Z. supervised the project. L. Zheng, Z. L., J. H., B. Z. and F. J. prepared the samples. L. Zheng and Z. L. designed and performed the experiments. Q. Z., P. T., H. Chen, S. L., C. Y. and L. Zheng performed the simulations. Theoretical calculations and analysis were carried out by Q. Z. and L. Zheng. J. H. and L. Zheng prepared the hydrogenated and perdeuterated CYP protein. L. Zhang prepared GO and GOM. H. Cheng and T. Z. supplied perdeuterated PEG. M. T., V. S. and T. Y. supported the elastic neutron scattering experiments at HFBS at NIST in the U.S., OSIRIS at ISIS in the U.K. and DNA at J-PARC in Japan, respectively. L. Zheng wrote the manuscript. L. H. and W. Z. revised the manuscript.Conflicts of interest
The authors declare no competing interests.Acknowledgements
This work was supported by the National Natural Science Foundation of China (11504231, 21873101, 31630002, 22063007 and U1932161), the Innovation Program of Shanghai Municipal Education Commission (2019-01-07-00-02-E00076) and the FJIRSM&IUE Joint Research Fund (No. RHZX-2019-002). Q. Z. is thankful for the support of the Natural Science Foundation of Inner Mongolia (2020MS02018) and Scientific Research Foundation of IMUN for doctors (BS581). We thank Prof. Guangyu Yang (School of Life Sciences and Biotechnology, Shanghai Jiao Tong University) for supplying the creatine amidinohydrolase protein. Access to the HFBS was provided by the Center for High Resolution Neutron Scattering, a partnership between the National Institute of Standards and Technology and the National Science Foundation under Agreement No. DMR-2010792. The neutron experiment at the Materials and Life Science Experimental Facility (MLF) of the J-PARC was performed under a user program (Proposal No. 2018A0291, 2019A0020 and 2019A0010). We thank STFC for access to neutron scattering facilities on RB1800112. The original data is accessible at DOI: 10.5286/ISIS.E.RB1800112.References
- J. G. Dash, A. W. Rempel and J. S. Wettlaufer, Rev. Mod. Phys., 2006, 78, 695–741 CrossRef CAS
.
- G. Bai, D. Gao, Z. Liu, X. Zhou and J. Wang, Nature, 2019, 576, 437–441 CrossRef CAS
- X. Zhang, Y. He, M. L. Sushko, J. Liu, L. Luo, J. J. De Yoreo, S. X. Mao, C. Wang and K. M. Rosso, Science, 2017, 356, 434 CrossRef CAS PubMed
- G. Zaccai, Science, 2000, 288, 1604–1607 CrossRef CAS
- L. Salvati Manni, S. Assenza, M. Duss, J. J. Vallooran, F. Juranyi, S. Jurt, O. Zerbe, E. M. Landau and R. Mezzenga, Nat. Nanotechnol., 2019, 14, 609–615 CrossRef CAS
- S. Wu, Z. He, J. Zang, S. Jin, Z. Wang, J. Wang, Y. Yao and J. Wang, Sci. Adv., 2019, 5, eaat9825 CrossRef CAS
- M. Zanatta, L. Tavagnacco, E. Buratti, M. Bertoldo, F. Natali, E. Chiessi, A. Orecchini and E. Zaccarelli, Sci. Adv., 2018, 4, eaat5895 CrossRef CAS
- L. Zhang, L. Wang, Y.-T. Kao, W. Qiu, Y. Yang, O. Okobiah and D. Zhong, Proc. Natl. Acad. Sci. U. S. A., 2007, 104, 18461–18466 CrossRef CAS
- K. Hatakeyama, M. R. Karim, C. Ogata, H. Tateishi, A. Funatsu, T. Taniguchi, M. Koinuma, S. Hayami and Y. Matsumoto, Angew. Chem., Int. Ed., 2014, 53, 6997–7000 CrossRef CAS PubMed
- D. Wang, Y. Tian and L. Jiang, Small, 2021, 2100788 CrossRef CAS PubMed
- B. Honig and A. Nicholls, Science, 1995, 268, 1144–1149 CrossRef CAS PubMed
- O. Björneholm, M. H. Hansen, A. Hodgson, L.-M. Liu, D. T. Limmer, A. Michaelides, P. Pedevilla, J. Rossmeisl, H. Shen, G. Tocci, E. Tyrode, M.-M. Walz, J. Werner and H. Bluhm, Chem. Rev., 2016, 116, 7698–7726 CrossRef PubMed
- X. P. Morelle, W. R. Illeperuma, K. Tian, R. Bai, Z. Suo and J. J. Vlassak, Adv. Mater., 2018, 30, 1801541 CrossRef PubMed
- Y. Jian, S. Handschuh-Wang, J. Zhang, W. Lu, X. Zhou and T. Chen, Mater. Horiz., 2021, 8, 351 RSC
- H. Jiang, W. Shin, L. Ma, J. J. Hong, Z. Wei, Y. Liu, S. Zhang, X. Wu, Y. Xu, Q. Guo, M. A. Subramanian, W. F. Stickle, T. Wu, J. Lu and X. Ji, Adv. Energy Mater., 2020, 10, 2000968 CrossRef CAS
- A. Ramanujapuram and G. Yushin, Adv. Energy Mater., 2018, 8, 1802624 CrossRef
- Z. Liu, C. Yang, L. Zhang, Y. Yu, M. Yu, V. García Sakai, M. Tyagi, T. Yamada, L. He, X. Zhang and L. Hong, J. Phys. Chem. C, 2020, 124, 11064–11074 CrossRef CAS
- W. G. Liu and K. D. Yao, Polymer, 2001, 42, 3943–3947 CrossRef CAS
- H. Nakagawa, Y. Yonetani, K. Nakajima, S. Ohira-Kawamura, T. Kikuchi, Y. Inamura, M. Kataoka and H. Kono, Phys. Rev. E: Stat., Nonlinear, Soft Matter Phys., 2014, 90, 022723 CrossRef CAS PubMed
- G. Caliskan, R. M. Briber, D. Thirumalai, V. Garcia-Sakai, S. A. Woodson and A. P. Sokolov, J. Am. Chem. Soc., 2006, 128, 32–33 CrossRef CAS PubMed
- Q. Nian, J. Wang, S. Liu, T. Sun, S. Zheng, Y. Zhang, Z. Tao and J. Chen, Angew. Chem., Int. Ed., 2019, 58, 16994–16999 CrossRef CAS PubMed
- G. Chen, J. Huang, J. Gu, S. Peng, X. Xiang, K. Chen, X. Yang, L. Guan, X. Jiang and L. Hou, J. Mater. Chem. A, 2020, 8, 6776–6784 RSC
- W. Doster, S. Cusack and W. Petry, Nature, 1989, 337, 754–756 CrossRef CAS PubMed
- L. Hong, D. C. Glass, J. D. Nickels, S. Perticaroli, Z. Yi, M. Tyagi, H. O'Neill, Q. Zhang, A. P. Sokolov and J. C. Smith, Phys. Rev. Lett., 2013, 110, 028104 CrossRef PubMed
- J. A. Rupley and G. Careri, Adv. Protein Chem., 1991, 41, 37–172 CrossRef CAS PubMed
- D. Vitkup, D. Ringe, G. A. Petsko and M. Karplus, Nat. Struct. Mol. Biol., 2000, 7, 34–38 CrossRef CAS
- J. H. Roh, V. N. Novikov, R. B. Gregory, J. E. Curtis, Z. Chowdhuri and A. P. Sokolov, Phys. Rev. Lett., 2005, 95, 038101 CrossRef CAS PubMed
- G. Schiró, F. Natali and A. Cupane, Phys. Rev. Lett., 2012, 109, 128102 CrossRef PubMed
- K. Wood, M. Plazanet, F. Gabel, B. Kessler, D. Oesterhelt, D. J. Tobias, G. Zaccai and M. Weik, Proc. Natl. Acad. Sci. U. S. A., 2007, 104, 18049–18054 CrossRef CAS PubMed
- Z. Yi, Y. Miao, J. Baudry, N. Jain and J. C. Smith, J. Phys. Chem. B, 2012, 116, 5028–5036 CrossRef CAS PubMed
- R. H. Austin, K. W. Beeson, L. Eisenstein, H. Frauenfelder and I. C. Gunsalus, Biochemistry, 1975, 14, 5355–5373 CrossRef CAS PubMed
- B. F. Rasmussen, A. M. Stock, D. Ringe and G. A. Petsko, Nature, 1992, 357, 423–424 CrossRef CAS PubMed
- X. Ding, B. F. Rasmussen, G. A. Petsko and D. Ringe, Biochemistry, 1994, 33, 9285–9293 CrossRef CAS PubMed
- M. Ferrand, A. J. Dianoux, W. Petry and G. J. Zaccaï, Proc. Natl. Acad. Sci. U. S. A., 1993, 90, 9668–9672 CrossRef CAS PubMed
- G. Schirò, C. Caronna, F. Natali, M. M. Koza and A. Cupane, J. Phys. Chem. Lett., 2011, 2, 2275–2279 CrossRef
- J. H. Roh, R. M. Briber, A. Damjanovic, D. Thirumalai, S. A. Woodson and A. P. Sokolov, Biophys. J., 2009, 96, 2755–2762 CrossRef CAS PubMed
- A. L. Tournier, J. Xu and J. C. Smith, Biophys. J., 2003, 85, 1871–1875 CrossRef CAS
- P. W. Fenimore, H. Frauenfelder, B. H. McMahon and F. G. Parak, Proc. Natl. Acad. Sci. U. S. A., 2002, 99, 16047–16051 CrossRef CAS PubMed
- H. Frauenfelder, G. Chen, J. Berendzen, P. W. Fenimore, H. Jansson, B. H. McMahon, I. R. Stroe, J. Swenson and R. D. Young, Proc. Natl. Acad. Sci. U. S. A., 2009, 106, 5129–5134 CrossRef CAS PubMed
- S.-H. Chen, L. Liu, E. Fratini, P. Baglioni, A. Faraone and E. Mamontov, Proc. Natl. Acad. Sci. U. S. A., 2006, 103, 9012–9016 CrossRef CAS PubMed
- S. H. Chen, L. Liu, X. Chu, Y. Zhang, E. Fratini, P. Baglioni, A. Faraone and E. Mamontov, J. Chem. Phys., 2006, 125, 171103 CrossRef PubMed
- P. Kumar, Z. Yan, L. Xu, M. G. Mazza, S. V. Buldyrev, S. H. Chen, S. Sastry and H. E. Stanley, Phys. Rev. Lett., 2006, 97, 177802 CrossRef PubMed
- S. Pawlus, S. Khodadadi and A. P. Sokolov, Phys. Rev. Lett., 2008, 100, 108103 CrossRef CAS PubMed
- W. Doster, S. Busch, A. M. Gaspar, M. S. Appavou, J. Wuttke and H. Scheer, Phys. Rev. Lett., 2010, 104, 098101 CrossRef CAS PubMed
- M. Vogel, Phys. Rev. Lett., 2008, 101, 225701 CrossRef CAS PubMed
- T. Becker, J. A. Hayward, J. L. Finney, R. M. Daniel and J. C. Smith, Biophys. J., 2004, 87, 1436–1444 CrossRef CAS PubMed
- Z. Liu, J. Huang, M. Tyagi, H. O'Neill, Q. Zhang, E. Mamontov, N. Jain, Y. Wang, J. Zhang and J. C. Smith, Phys. Rev. Lett., 2017, 119, 048101 CrossRef PubMed
- A. M. Gaspar, S. Busch, M.-S. Appavou, W. Haeussler, R. Georgii, Y. Su and W. Doster, Biochim. Biophys. Acta, Proteins Proteomics, 2010, 1804, 76–82 CrossRef CAS PubMed
- L. Hong, N. Smolin and J. C. Smith, Phys. Rev. Lett., 2014, 112, 158102 CrossRef PubMed
- P. Tan, Y. Liang, Q. Xu, E. Mamontov, J. Li, X. Xing and L. Hong, Phys. Rev. Lett., 2018, 120, 248101 CrossRef CAS PubMed
- L. Hong, N. Smolin, B. Lindner, A. P. Sokolov and J. C. Smith, Phys. Rev. Lett., 2011, 107, 148102 CrossRef PubMed
- G. Schirò, Y. Fichou, F.-X. Gallat, K. Wood, F. Gabel, M. Moulin, M. Härtlein, M. Heyden, J.-P. Colletier, A. Orecchini, A. Paciaroni, J. Wuttke, D. J. Tobias and M. Weik, Nat. Commun., 2015, 6, 6490 CrossRef PubMed
- S. Perticaroli, G. Ehlers, C. B. Stanley, E. Mamontov, H. O'Neill, Q. Zhang, X. Cheng, D. A. A. Myles, J. Katsaras and J. D. Nickels, J. Am. Chem. Soc., 2017, 139, 1098–1105 CrossRef CAS PubMed
- A. Meyer, R. M. Dimeo, P. M. Gehring and D. A. Neumann, Rev. Sci. Instrum., 2003, 74, 2759–2777 CrossRef CAS
- S. Fujiwara, T. Chatake, T. Matsuo, F. Kono, T. Tominaga, K. Shibata, A. Sato-Tomita and N. Shibayama, J. Phys. Chem. B, 2017, 121, 8069–8077 CrossRef CAS PubMed
- S. Fujiwara, K. Araki, T. Matsuo, H. Yagi, T. Yamada, K. Shibata and H. Mochizuki, PLoS One, 2016, 11, e0151447 CrossRef PubMed
- M. T. F. Telling and K. H. Andersen, Phys. Chem. Chem. Phys., 2005, 7, 1255–1261 RSC
- J. H. Roh, J. E. Curtis, S. Azzam, V. N. Novikov, I. Peral, Z. Chowdhuri, R. B. Gregory and A. P. Sokolov, Biophys. J., 2006, 91, 2573–2588 CrossRef CAS PubMed
- A. Jani, M. Busch, J. B. Mietner, J. Ollivier, M. Appel, B. Frick, J.-M. Zanotti, A. Ghoufi, P. Huber, M. Fröba and D. Morineau, J. Chem. Phys., 2021, 154, 094505 CrossRef CAS PubMed
- Z. Liu, C. Yang, J. Huang, G. Ciampalini, J. Li, V. García Sakai, M. Tyagi, H. O'Neill, Q. Zhang, S. Capaccioli, K. L. Ngai and L. Hong, J. Phys. Chem. B, 2018, 122, 9956–9961 CrossRef CAS PubMed
- S. Khodadadi, S. Pawlus and A. P. Sokolov, J. Phys. Chem. B, 2008, 112, 14273–14280 CrossRef CAS PubMed
- Q. Zhang, T. Wu, C. Chen, S. Mukamel and W. Zhuang, Proc. Natl. Acad. Sci. U. S. A., 2017, 114, 10023 CrossRef CAS PubMed
- Q. Zhang, H. Chen, T. Wu, T. Jin, Z. Pan, J. Zheng, Y. Gao and W. Zhuang, Chem. Sci., 2017, 8, 1429–1435 RSC
- X. Zhang, Z. Wang, Z. Chen, H. Li, L. Zhang, J. Ye, Q. Zhang and W. Zhuang, J. Phys. Chem. B, 2020, 124, 1806–1816 CAS
- A. Luzar and D. Chandler, Nature, 1996, 379, 55–57 CrossRef CAS
- K. A. Tay and F. Bresme, Phys. Chem. Chem. Phys., 2009, 11, 409–415 RSC
- N. V. Nucci, M. S. Pometun and A. J. Wand, J. Am. Chem. Soc., 2011, 133, 12326–12329 CrossRef CAS PubMed
- J. T. King and K. J. Kubarych, J. Am. Chem. Soc., 2012, 134, 18705–18712 CrossRef CAS PubMed
- F. Sterpone, G. Stirnemann and D. Laage, J. Am. Chem. Soc., 2012, 134, 4116–4119 CrossRef CAS PubMed
- P. Tan, J. Huang, E. Mamontov, V. García Sakai, F. Merzel, Z. Liu, Y. Ye and L. Hong, Phys. Chem. Chem. Phys., 2020, 22, 18132 RSC
- K. Wood, A. Frölich, A. Paciaroni, M. Moulin, M. Härtlein, G. Zaccai, D. J. Tobias and M. Weik, J. Am. Chem. Soc., 2008, 130, 4586–4587 CrossRef CAS PubMed
- S. Cerveny, Á. Alegría and J. Colmenero, Phys. Rev. E: Stat., Nonlinear, Soft Matter Phys., 2008, 77, 031803 CrossRef PubMed
- Y. Qin, L. Wang and D. Zhong, Proc. Natl. Acad. Sci. U. S. A., 2016, 113, 8424–8429 CrossRef CAS PubMed
- J. D. Nickels, H. O'Neill, L. Hong, M. Tyagi, G. Ehlers, K. L. Weiss, Q. Zhang, Z. Yi, E. Mamontov and J. C. Smith, Biophys. J., 2012, 103, 1566–1575 CrossRef CAS PubMed
Footnotes |
| † Electronic supplementary information (ESI) available. See DOI: 10.1039/d1sc04650k |
| ‡ These authors contributed equally to the work. |
| This journal is © The Royal Society of Chemistry 2022 |