 Open Access Article
Highest-Tc single-component homochiral organic ferroelectrics†
Peng-Fei
Li‡
,
Yong
Ai‡
 ,
Yu-Ling
Zeng
,
Jun-Chao
Liu
,
Zhe-Kun
Xu
and
Zhong-Xia
Wang
,
Yu-Ling
Zeng
,
Jun-Chao
Liu
,
Zhe-Kun
Xu
and
Zhong-Xia
Wang
 *
*
Ordered Matter Science Research Center, Nanchang University, 330031, P. R. China. E-mail: zhongxiawang@ncu.edu.cn
First published on 15th November 2021
Abstract
Organic single-component ferroelectrics with low molecular mass have drawn great attention for application in organic electronics. However, the discovery of high-Tc single-component organic ferroelectrics has been very scarce. Herein, we report a pair of homochiral single-component organic ferroelectrics (R)-10-camphorsulfonylimine and (S)-10-camphorsulfonylimine under the guidance of ferroelectric chiral chemistry. They crystallize in the chiral–polar space group P21, and their mirror image relations have been identified using vibrational circular dichroism spectra. They both exhibit 422F2 multiaxial ferroelectricity with Tc as high as 429 K. Besides, they possess superior acoustic impedance characteristics with a value of 2.45 × 10⁶ kg s−1 m−2, lower than that of PVDF. To our knowledge, enantiomeric (R and S)-10-camphorsulfonylimine show the highest Tc among the known organic single-component ferroelectrics and low acoustic impedance well matching with that of bodily tissues. This work promotes the development of high-performance organic single-component ferroelectrics and is of great inspiration to explore their application in next-generation flexible smart devices.
Introduction
More than 100 years ago, Valasek observed the Rochelle salt crystals’ response to the action of an external electric field, and its polarization versus the electric field exhibits a nonlinear hysteresis relationship which is similar to a ferromagnetic hysteresis loop.1 This pioneering discovery revealed the definition of ferroelectricity and kick-started the ferroelectric era. Afterward, ferroelectric materials have been found in all aspects of daily life, such as sound-controlled switches, ignition devices, sonar of submarines, color ultrasound, etc.2–9 Although molecular ferroelectrics have experienced certain progress in the early stage, such as the discovery of hydrogen-bonded ferroelectric potassium dihydrogen phosphate (KDP),10 the outbreak of the Second World War significantly promoted the military application of ceramic ferroelectrics represented by BaTiO3.11,12 They possess significant features such as high energy storage density, fast discharge speed, stable storage performance, etc. making them widely used ferroelectrics in a variety of electronic devices.6,7,13,14 However, the increasingly severe concerns about the environment, energy, and cost brought by inorganic ferroelectrics compel people to consider the future of ferroelectric developments in molecular counterparts. Importantly, molecular ferroelectrics exhibit intrinsically natural merits such as light weight, flexibility, low-cost, and acoustic impedance matching with that of the human body, and have been expected to be a beneficial supplement to inorganic ferroelectrics.15–22For decades, a series of impressive achievements have been made in molecular ferroelectrics, mainly focusing on organic ammonium salts and organic–inorganic hybrids.23–30 However, organic single-component (SC) ferroelectrics with low molecular mass showing promise for organic flexible devices are only a handful. Thiourea, as the simplest SC ferroelectric, has a Tc below 200 K, much lower than room temperature.31 SC radical ferroelectric TEMPO (2,2,6,6-tetramethylpiperidine-N-oxyl) shows a Tc of 287 K close to room temperature but with easy sublimation, which severely limits its further application.32 Organic SC trichloroacetamide crystals exhibit high-Tc ferroelectric activity at around 350 K, while the typical ferroelectric hysteresis loops are only observed in a limited temperature range.33 In comparison with the typical order–disorder and displacement ferroelectric mechanisms, it is hard for organic SC ferroelectrics to behave consistently. As a result, this stagnated the discovery of new organic SC ferroelectrics for a long time afterward. In 2010, Horiuchi et al. reported an organic SC ferroelectric croconic acid with higher spontaneous polarization which is comparable to that of BaTiO3 under low frequency.34 Stoddart et al. discovered a series of non-centrosymmetric trisubstituted haloimidazoles that display ferroelectricity resulting from their fine- tuned crystalline mechanical properties.35 In 2019, enantiomeric organic SC ferroelectrics (R and S)-3-hydroxyquinoline were discovered by us and their Tc (400 K) can reach close to that of the inorganic ferroelectric BaTiO3, showing significant application prospects.36 Very recently, we also have reported the highest number of 48 crystallographically equivalent polarization directions existing in a high-Tc (345 K) vertex organic SC ferroelectric 2-(hydroxymethyl)-2-nitro-1,3-propanediol, revealing the great potential for developing flexible and wearable devices.37 However, there are still very few high-Tc SC ferroelectrics, which urgently needs to be addressed with relevant theoretical guidance. More importantly, SC organics with low molecular mass potentially exhibit low acoustic impedance characteristics. Acoustic impedance describes how much resistance an ultrasound beam encounters as it passes through a material and is the product of the density and the velocity of the acoustic wave. A decent performance depends on the well-matching impedances of the two materials so that the sound is not reflected.38 For example, the low acoustic impedance characteristic of the polymer ferroelectric PVDF has promoted its application in ultrasonic transducer applications and medical instrumentation.39 Therefore, organic SC ferroelectrics with low acoustic impedance are also highly desirable for exploring high-performance applications in the ultrasound and radiopaedia fields. However, the related reports in organic ferroelectrics are rarely found.
Ferroelectrics must crystallize in one of the ten polar point groups (C1, Cs, C2, C2v, C4, C4v, C3, C3v, C6, and C6v). We have used the language of chemistry to deeply understand the ferroelectric principle by combining the ‘quasi-spherical theory’ and the chirality strategy to put forward the concept of ‘ferroelectrochemistry’.40 Quasi-spherical theory helps to discover phase transition compounds of the order–disorder type,41–43 and the chirality principle makes them further crystallize in chiral–polar point groups.44–46 The combination of the two greatly increases the probability of designing new organic SC ferroelectrics. Inspired by this, we noticed that simple camphorsulfonic acid is a chiral spherical molecule; however, its extremely strong water solubility makes it difficult to characterize its ferroelectric-related properties. Subsequently, the carbonyl group in the camphorsulfonic acid molecule can further be condensed and dehydrated with the amino group to form a homochiral camphorsulfonic acid imine, which is expected to be poorly water-soluble and has a higher melting point for being a candidate of high-Tc ferroelectrics.47 As expected, (R and S)-10-camphorsulfonylimine (R-CSAI and S-CSAI) exhibit high-Tc paraelectric–ferroelectric phase transition with the Aizu notation of 422F2 at around 429 K. Their enantiomeric relationship was verified using vibrational circular dichroism (VCD) spectra. The ferroelectric polarization reversal and multiaxial ferroelectricity were confirmed using the P–E hysteresis loop and piezoresponse force microscopy (PFM) measurements, respectively. As a result, we have successfully discovered a pair of SC homochiral organic R-CSAI and S-CSAI ferroelectrics with a Tc as high as 429 K. The Tc is the highest one among the reported organic SC ferroelectrics. Besides, they possess superior acoustic impedance Z0 (unit 106 kg s−1 m−2) with a value of 2.45 lower than that of PVDF (3.69), showing a well-matching impedance with that of bodily tissues. This finding not only promotes the development of high-performance organic SC ferroelectrics but also provides an alternative for potential flexible smart devices.
Results and discussion
Structural properties
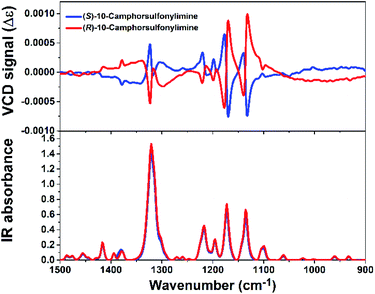
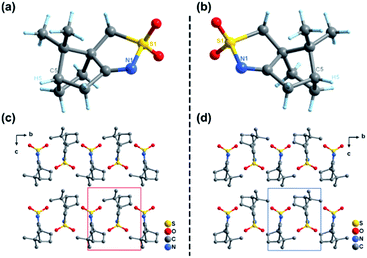
R-CSAI and S-CSAI were first investigated by VCD measurement, which can effectively identify chiral enantiomer relationships.32 As shown in Fig. 1, the VCD spectra of R-CSAI and S-CSAI show couples of obvious peaks at around 1100, 1140, 1170, 1198, 1220, and 1323 cm−1, which are consistent with the absorption peaks observed in the IR spectra. Significantly, the VCD spectra of R-CSAI and S-CSAI show almost mirror-image relation, revealing the enantiomorphic character.Single-crystal X-ray diffraction reveals that R-CSAI and S-CSAI both crystallize in the monoclinic space group P21 with the chiral–polar point group 2 (C2) at 298 K and 173 K (Table S1, ESI†). The asymmetric units of R-CSAI and S-CSAI contain one ordered 10-camphorsulfonylimine molecule, in which the chiral atom C5 has the R- and S-conformation, respectively, contributing to the molecular chirality.47 As shown in Fig. 2a and b, the molecular structures of R-CSAI and S-CSAI also present a mirror-image relationship, being consistent with the result of VCD spectra. Besides, the molecular arrangements extend along the 21 two-fold screw axis in the b-direction and the adjacent molecular layers are parallel to each other (Fig. 2c and d). The adjacent molecules in the stacking rely on the weak hydrogen bonds C–H⋯O and van der Waals forces (Fig. S1, ESI†). The intermolecular forces are mainly concentrated between H atoms and O atoms, which are calculated using Hirshfeld dnorm surfaces (around 94.3%, Fig. S2, ESI†). As shown in Fig. S3 (ESI),† both R-CSAI and S-CSAI molecules possess a large dipole moment of 7.6984 Debye. By estimating the vector sum of the dipole moments in the unit cell, the total polarization of R-CSAI and S-CSAI crystals is about 1.22 μC cm−2, whose direction is along the crystallographic b-axis. Such a polarization direction also satisfies the symmetry of the P21 space group. Rac-10-camphorsulfonylimine crystallizes in a monoclinic centrosymmetric P21/m space group with a 2/m point group. The stacking structure is similar to those of R-CSAI and S-CSAI. However, the Rac-10-camphorsulfonylimine molecule lies in a special position, where the mirror symmetry operation compels it into a highly disordered state (Fig. S4, ESI†).
Phase transition
Differential scanning calorimetry (DSC) measurements were performed on the polycrystalline samples of R-CSAI and S-CSAI to detect the thermal anomalies. As depicted in Fig. 3a, two pairs of thermal anomaly peaks upon heating and cooling were recorded, indicating that both R-CSAI and S-CSAI undergo reversible phase transitions at around 429 K. Rac-10-camphorsulfonylimine also demonstrates a reversible phase transition at around 407 K (Fig. S5, ESI†). The difference of the Tc between homochiral and racemic points to that molecular chirality significantly affects crystal packing, leading to the enhancement of Tc.36 The large thermal hysteresis (11 K) and sharp peaks observed in R-CSAI and S-CSAI suggest that they possess a first-order phase transition feature. The Tc values of R-CSAI and S-CSAI are the highest among the discovered SC ferroelectrics (Fig. S6, ESI†) and even greater than that of the inorganic ferroelectric BaTiO3 (393 K). Dielectric real part (ε′) as a function of temperature measurement is a sensitive method to investigate paraelectric–ferroelectric phase transition.20 For ferroelectrics, ε′ usually experiences dramatic variation around Tc. As shown in Fig. 3b, temperature-dependent ε′ of R-CSAI and S-CSAI presents λ-peak shape anomaly around 430 K in the heating run, agreeing with the DSC results. Upon cooling, the ε′ occurs with a similar variation. The reversible dielectric transitions with peak anomalies of R-CSAI and S-CSAI at around the Tc point to typical ferroelectric behavior. For the sake of convenience, the phase below the Tc is assigned as the room-temperature phase (RTP), and the phase above the Tc as the high-temperature phase (HTP).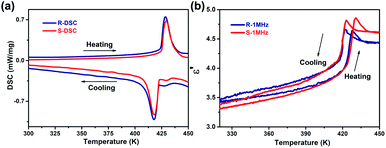 | ||
| Fig. 3 Phase transitions of R-CSAI and S-CSAI. (a) DSC curves in a heating–cooling run. (b) Temperature-dependent ε′ at 1 MHz upon heating and cooling. | ||
The attempt to obtain the crystal structures of R-CSAI and S-CSAI in the HTP was in vain because of the low angles and very weak diffraction spots observed in this phase. To understand the ferroelectric mechanism, variable-temperature powder X-ray diffraction (PXRD) measurements were then performed to analyze the structural symmetry variation. As shown in Fig. S7 (ESI),† the experimental PXRD patterns of R-CSAI and S-CSAI are in good accordance with those simulated from single-crystal structures, verifying their phase purity. As the temperature increased above Tc, the number of PXRD peaks of both R-CSAI and S-CSAI in the HTP is less than that in the RTP, indicating a higher symmetry in the HTP (Fig. 4a and b). Pawley refinements of the PXRD of R-CSAI and S-CSAI in the HTP show the most possible tetragonal lattice system with a point group of 422 (Fig. S8 and S9, ESI†). The significant variation of the PXRD patterns from the RTP to HTP with the symmetry change of 422F2 strongly reveals the ferroelectric phase transition in R-CSAI and S-CSAI.
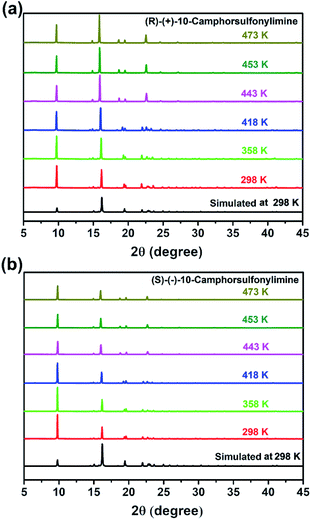 | ||
| Fig. 4 Phase transitions of R-CSAI and S-CSAI. (a) Variable-temperature PXRD patterns of R-CSAI. (b) Variable-temperature PXRD patterns of S-CSAI. | ||
Ferroelectric properties
Second-harmonic generation (SHG) is an effective tool to investigate the phase transitions involving the non-centrosymmetric phase and detect the crystal symmetry change.48 As demonstrated in Fig. 5a, temperature-dependent SHG signal response measurements for R-CSAI and S-CSAI were carried out. In the RTP, clear SHG signals with a stable intensity are observed in both enantiomers, corresponding to the polar phase P21 space group. When the temperature is above the Tc in the HTP, the SHG intensity decreases to zero rapidly. This confirms the 422 point group in the HTP because it is one of the SHG-inactive point groups according to the Kleinman symmetry transformation.20 Consequently, the PXRD analyses and SHG results both suggest that the phase transition of this pair of enantiomers is the ferroelectric phase transition followed by the 422F2 Aizu notation, which belongs to one of the 88 species ferroelectric phase transitions.49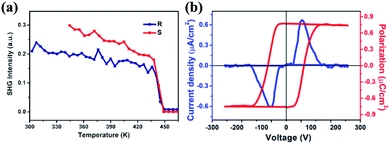 | ||
| Fig. 5 Ferroelectric properties. (a) Temperature-dependent SHG intensity of R-CSAI and S-CSAI, respectively. (b) P–E hysteresis loops of S-CSAI measured at 298 K by using the double-wave method. | ||
To directly verify the ferroelectricity, we then measured the polarization–electric field (P–E) hysteresis loop using the double-wave method on the S-CSAI thin film at 298 K as an example. Fig. 5b shows a regular P–E loop with a saturation polarization (Ps) value of 0.75 μC cm−2, which is almost in agreement with the calculated value and strongly verified its ferroelectricity. The Ps values are larger than those of the SC ferroelectrics TEMPO (0.5 μC cm−2),32 trichloroacetamide (0.2 μC cm−2)33 and Rochelle salt (0.25 μC cm−2).1
Ferroelectric domains
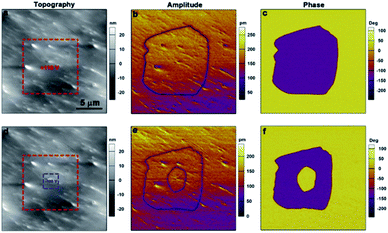
Piezoresponse force microscopy (PFM) is also an ideal and authoritative approach for both detecting and switching the local ferroelectric polarization at the nanoscale.50,51 Shown in Fig. 6a, b and c are the lateral PFM amplitude, PFM phase, and topography images of a 50 × 50 μm region in the S-CSAI thin film. The sample has been subjected to heat treatment: we heated it to the paraelectric phase and then cooled it down to room temperature. The formation of irregularly shaped domains with different polarization directions has been presented as evidenced by the clear domain walls in the amplitude image and a proper 180° phase change across the wall in the phase image. There is no obvious correlation between the PFM image and the topography image. The vertical PFM images in this region show a weak response (Fig. S10, ESI†), indicating that the polarization is mainly in the plane of the thin film surface. In addition, the domain pattern captured from the lateral and vertical PFM mapping is different, confirming the existence of non-180° domains which are yielded by the multi-axial nature of S-CSAI. To confirm the ferroelectricity of S-CSAI, switching spectroscopy PFM (SS-PFM) allows the exploration of local switching behavior. The ideal hysteresis loops are shown in Fig. 6d, confirming the switching properties of the material.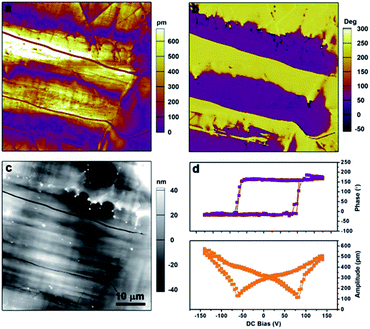 | ||
| Fig. 6 Ferroelectric domains. The diagrams of (a) lateral amplitude, (b) phase, (c) topology and (d) switching spectroscopy of the S-CSAI thin-film taken by PFM. | ||
Furthermore, a box-in-box switched domain pattern was acquired on the S-CSAI thin film, with the application of different voltages via the PFM tip. In Fig. 7a, the region marked with the red dashed box has been first poled with a +110 V tip bias. As a result, the center purple domain with a reversed polarization direction can be seen in the phase image. Also, the domain wall clearly seen in the amplitude image matches well with that in the phase image (Fig. 7b and c). Subsequently, the blue boxed region in Fig. 7d was scanned again with a negative tip bias of −100 V, and a series of PFM images were recorded and are shown in Fig. 7e and f. From the phase image of Fig. 7f, the inner part of the purple domain switched back to yellow, and a similar domain wall appears in the amplitude image. Such a domain switching has directly demonstrated the switchable polarization in S-CSAI. The PFM measurements for the R-CSAI thin film are given in the ESI (Fig. S11 and S12, ESI†). Our PFM results strongly confirmed the ferroelectricity for both R-CSAI and S-CSAI.
Acoustic impedance
Organic SC ferroelectrics showing low acoustic impedance features might work for many medical applications. The acoustic impedance Z is a parameter used for evaluating the acoustic energy transfer between two materials. For a sound wave that propagates only in one direction, the Z is found to be Z0 = ρ·c, where ρ is the density of the material and c is the speed of the wave.39 For medical concerns, the high acoustic impedance mismatch between the materials and human tissues will cause most of the propagating acoustic signals to reflect back so that poor test results are received. For most bodily tissues, the Z0 values are commonly below 2. As a comparison, we have measured the acoustic impedance Z0 values for several known ferroelectrics that are shown in Fig. 8 and Table S2 (ESI).† Inorganic ferroelectrics such as BaTiO3, LiNbO3 and PZT exhibit large Z0 values generally greater than 20. Molecular ferroelectrics including organic ammonium salts and organic–inorganic hybrids demonstrate significantly lower Z0 values mainly because of the lower molecular weight. Polymer ferroelectric PVDF has a low acoustic impedance Z0 (3.69) certainly matching with that of human tissues, which permits its brilliant performance in the fields of ultrasonic applications and medical instrumentation. For organic SC ferroelectrics, the acoustic impedance characteristics of R-CSAI and S-CSAI have a Z0 value of 2.45, lower than that of other SC molecular ferroelectrics and PVDF, showing a good match with the bodily acoustic impedance parameters. Therefore, organic SC molecules with natural features such as light weight and low acoustic impedance are highly desirable for potential medical applications and would also contribute to tremendous growth in research on novel organic SC ferroelectrics.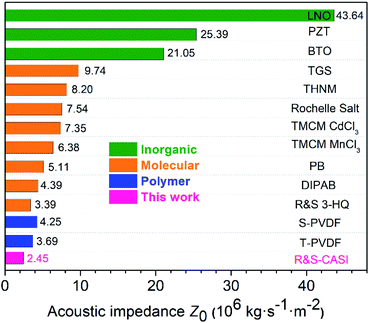 | ||
| Fig. 8 Acoustic impedance characteristics of (R and S)-CSAI compared with those of some inorganic, polymer, and molecular ferroelectrics. LiNbO3 (LNO), Pb(Zr0.52Ti0.48)O3 (PZT), BaTiO3 (BTO), triglycine sulfate (TGS), tris(hydroxymethyl)nitromethane (THNM),37 trimethylchloromethylammonium cadmium trichloride (TMCMCdCl3),29 trimethylchloromethylammonium manganese trichloride (TMCMMnCl3),29 phenylammonium bromide (PB),20 diisopropylammonium bromide (DIPAB),16 (R and S)-3-hydroxyquinoline (R&S-3-HQ),36 poly(vinylidene fluoride) standard (S-PVDF), and poly(vinylidene fluoride) thermal pressed (T-PVDF). | ||
Conclusions
To summarize, we have discovered a pair of organic SC homochiral ferroelectrics R-CSAI and S-CSAI with high Tc and low acoustic impedance characteristics. They both adopt the chiral–polar point group of 2 at room temperature and show mirror-image enantiomer relationship. DSC and dielectric measurements reveal that both R-CSAI and S-CSAI undergo thermal response phase transition at around 429 K. Their structures in the HTP cannot be accessed because of the very low diffraction angle and weak intensity of the collected spots. The PXRD patterns of R-CSAI and S-CSAI in the HTP exhibit evidently fewer peaks than those in the RTP, revealing the higher symmetry in the HTP and showing the most possible tetragonal lattice system with the point group of 422. The phase transition with the symmetry variation of 422F2 can also be supported by the temperature-dependent SHG measurements that show a step-like anomaly around Tc from the active signal to zero because the point group of 422 is SHG non-active. The P–E loop measurement confirms the macroscopic ferroelectricity, and the Ps value is 0.75 μC cm−2. PFM measurements on the polycrystalline thin films support the multiaxial ferroelectricity of the enantiomers. The box-in-box ferroelectric domain reversals strongly reveal the ferroelectric feature of R-CSAI and S-CSAI. More importantly, they possess acoustic impedance with a lower Z0 value of 2.45 than PVDF (3.69), well matching with that of bodily tissues and showing great potential for medical applications. As a result, R-CSAI and S-CSAI undergo 422F2-type multiaxial ferroelectric phase transition with a Tc around 429 K, which is the highest among the known organic SC ferroelectrics and beyond that of BaTiO3. Besides, they have lower acoustic impedance characteristics than PVDF, showing huge application potential. Inspired by the ferroelectric chiral chemistry design principle, the introduction of chirality and quasi-spherical theory in organic SC molecules facilitates the development of high-Tc homochiral organic SC ferroelectrics. This finding is also expected to be of great inspiration for designing high-performance ferroelectrics with application prospects.Experimental procedures
Crystal growth and thin-film fabrication
All reagents and solvents in the syntheses were of reagent grade and used without further purification. R-CSAI, S-CSAI and Rac-10-camphorsulfonylimine are commercially available and their crystals were obtained by evaporation of a saturated solvent of equimolar methanol and dichloromethane. For thin-film fabrication, the precursor solution was prepared by dissolving 50 mg of R-CSAI and S-CSAI in a saturated solution with a 1![[thin space (1/6-em)]](https://www.rsc.org/images/entities/char_2009.gif) :
:![[thin space (1/6-em)]](https://www.rsc.org/images/entities/char_2009.gif) 1 ratio of dichloromethane and methanol. The thin films were obtained from the precursor solution (30 μL) dripped on a clean indium–tin–oxide-coated (ITO) glass substrate at room temperature.
1 ratio of dichloromethane and methanol. The thin films were obtained from the precursor solution (30 μL) dripped on a clean indium–tin–oxide-coated (ITO) glass substrate at room temperature.
Crystallography
Crystallographic data were collected using an XtaLAB Synergy R, DW system, HyPix diffractometer equipped with a Rigaku low-temperature gas-spray cooler, with Mo Kα (λ = 0.71075 Å) and Cu Kα radiation (λ = 1.54178) from a graphite monochromator. The crystal temperature was stable to within ±1 K. Data processing including empirical absorption correction was performed using CrysAlisPro 1.171.40.82a (Rigaku Oxford Diffraction, 2020). The structures were solved by direct methods and successive Fourier synthesis and then refined by full-matrix least-squares refinements on F2 using the SHELXL-2014/7 software package (Sheldrick, 2014). Non-H atoms were refined anisotropically using all reflections with I > 2σ(I). All H atoms were found in the difference maps. The structures were drawn with DIAMOND (Brandenburg & Putz, 2005) Visual Crystal Structure Information System software. The distances between planes were calculated using DIAMOND and the other calculations were carried out using SHELXLTL. Crystallographic data and details of the data collection and refinement for structures at 100 K, 173 K, and 298 K are given in Table S1 (ESI).†DSC measurements
The DSC measurement was performed by using a PerkinElmer Diamond DSC instrument. The measurements were carried out under nitrogen at atmospheric pressure in aluminum crucibles with a heating rate of 20 K min−1. The measurements for enantiomeric single-component ferroelectrics R-CSAI and S-CSAI were performed in the temperature range of 300 to 450 K. The measurement for Rac-10-camphorsulfonylimine was carried out in the temperature range of 330 to 430 K.SHG and dielectric measurements
For temperature-dependent SHG experiments, an unexpanded laser beam with a low divergence (pulsed Nd:YAG at a wavelength of 1064 nm, 5 ns pulse duration, 1.6 MW peak power, and 10 Hz repetition rate) was used. The instrument model is Ins 1210058, INSTEC Instruments, while the laser is Vibrant 355 II, OPOTEK. The heating rate was 15 K min−1 controlled with a temperature controller (Instec, mk1000). The complex permittivity ε (ε = ε′ − iε′′) was measured with a Tonghui TH2828A impedance analyzer under the frequency of 1 MHz. The measuring AC voltage was 1 V.Infrared (IR) and vibrational circular dichroism (VCD) measurements
The IR measurement was carried out by using a Shimadzu model IR-60 spectrometer at room temperature. Before the experiments, the sample was mixed with KBr and ground into powder, and then it was pressed into a thin and transparent sheet. The VCD measurement was carried out by using a Bruker PMA-50 instrument. At room temperature, the humidity of the desiccant in the instrument does not exceed 20%, and it is protected by nitrogen purging. Moreover, an appropriate amount of liquid nitrogen should be added to provide a low-temperature working environment for the detector. The sample needs to be mixed with KBr and ground into powder, and then it should be pressed into as thin and transparent a sheet as possible.Powder X-ray diffraction
Powder X-ray diffraction (XRD) patterns were determined using a BRUKER-axs D8-Advance X-ray diffractometer and using Cu-Kα radiation (λ = 0.15406 nm, 40 kV and 30 mA). The measurement angle ranges from 5 to 50° and the temperature ranges from 298 K to 473 K.PFM measurements
PFM visualization of the ferroelectric domain structures was carried out using a commercial atomic force microscope system (MFP-3D, Asylum Research). Conductive Pt/Ir-coated silicon probes (EFM, Nanoworld) were used for domain imaging and polarization switching studies. Resonant-enhanced PFM mode was used to enhance the signal, with the ac voltage frequency of about 330–380 kHz.Acoustic impedance measurements
The absolute value of specific acoustic impedance is often called “characteristic specific acoustic impedance” and denoted by z0: z0 = ρc, where ρ is the volumetric mass density of the material and c is the speed of the sound waves traveling in the material. By measuring the volumetric mass density of the material and the sound speed in it, the characteristic specific acoustic impedance of this material can be determined. In this research, measurements of the sound speed in (R-CSAI and S-CSAI) were performed on a pressed-powder pellet of (R-CSAI and S-CSAI) in silicone oil at room temperature. All the sound speed measurements in this work were performed by using an Ultrasonic Sound Velocity Testing Device (CGN Inspection Technology Co., Ltd. China). To determine the ρ of the pressed-powder pellet, its weight, radius and thickness were measured. After that, ρ was calculated by dividing the volume into weight. Finally, z0 was determined by using the formula mentioned above. The measurements for other ferroelectrics are similar to the above.Calculations
The molecular dipoles of R-CSAI and S-CSAI were calculated using the mode b3lyp/6-31G(d) level of the Gaussian 09 package. The molecular configurations are taken from the single-crystal X-ray diffraction.Data availability
The electronic supplementary information (ESI†) footnote details the data available as part of the supplementary material.Author contributions
P.-F. L. and Y. A. contributed equally to this work. P.-F. L. synthesized the samples and carried out theoretical analysis. Y. A. carried out the PFM study. Y.-L. Z., J.-C. L., and Z.-K. X. carried out the general characterizations. Z.-X. W. conceived the study and wrote the manuscript with input from other authors.Conflicts of interest
There are no conflicts to declare.Acknowledgements
This work was supported by the National Natural Science Foundation of China (21991141, 91963106, 21903042, 21905126 and 21901099).Notes and references
- J. Valasek, Phys. Rev., 1921, 17, 475 CrossRef CAS.
- M. E. Lines and A. M. Glass, Principles and applications of ferroelectrics and related materials, Clarendon Press, Oxford University Press, 2001 Search PubMed.
- W. J. Wang, J. H. Li, H. Liu and S. H. Ge, Adv. Sci., 2021, 8, 2003074 CrossRef CAS PubMed.
- P. Muralt, J. Am. Chem. Soc., 2008, 91, 1385–1396 CAS.
- N. Setter, D. Damjanovic, L. Eng, G. Fox, S. Gevorgian, S. Hong, A. Kingon, H. Kohlstedt, N. Y. Park, G. B. Stephenson, I. Stolitchnov, A. K. Tagantsev, D. V. Taylor, T. Yamada and S. Streiffer, J. Appl. Phys., 2006, 100, 051606 CrossRef.
- C. R. Qiu, B. Wang, N. Zhang, S. J. Zhang, J. F. Liu, D. Walker, Y. Wang, H. Tian, T. R. Shrout, Z. Xu, L. Q. Chen and F. Li, Nature, 2020, 577, 350–354 CrossRef CAS PubMed.
- J. G. Wu, D. Q. Xiao and J. G. Zhu, Chem. Rev., 2015, 115, 2559–2595 CrossRef CAS PubMed.
- Y. Saito, H. Takao, T. Tani, T. Nonoyama, K. Takatori, T. Homma, T. Nagaya and M. Nakamura, Nature, 2004, 432, 84–87 CrossRef CAS PubMed.
- J. F. Scott, Science, 2007, 315, 954–959 CrossRef CAS PubMed.
- S. Koval, J. Kohanoff, R. L. Migoni and E. Tosatti, Phys. Rev. Lett., 2002, 89, 187602 CrossRef CAS PubMed.
- G. H. Jonker and J. H. van Santen, Science, 1949, 109, 632–635 CrossRef CAS PubMed.
- H. D. Megaw, Nature, 1945, 155, 484–485 CAS.
- L. T. Yang, X. Kong, F. Li, H. Hao, Z. X. Cheng, H. X. Liu, J. F. Li and S. J. Zhang, Prog. Mater. Sci., 2019, 102, 72–108 CrossRef CAS.
- C. R. Bowen, H. A. Kim, P. M. Weaver and S. Dunn, Energy Environ. Sci., 2014, 7, 25–44 RSC.
- J. Harada, T. Shimojo, H. Oyamaguchi, H. Hasegawa, Y. Takahashi, K. Satomi, Y. Suzuki, J. Kawamata and T. Inabe, Nat. Chem., 2016, 8, 946–952 CrossRef CAS PubMed.
- D. W. Fu, H. L. Cai, Y. M. Liu, Q. Ye, W. Zhang, Y. Zhang, X. Y. Chen, G. Giovannetti, M. Capone, J. Y. Li and R. G. Xiong, Science, 2013, 339, 425–428 CrossRef CAS PubMed.
- S. Horiuchi and Y. Tokura, Nat. Mater., 2008, 7, 357–366 CrossRef CAS PubMed.
- A. Katrusiak and M. Szafranski, Phys. Rev. Lett., 1999, 82, 576–579 CrossRef CAS.
- H. Morita, R. Tsunashima, S. Nishihara, K. Inoue, Y. Omura, Y. Suzuki, J. Kawamata, N. Hoshino and T. Akutagawa, Angew. Chem., Int. Ed., 2019, 58, 9184–9187 CrossRef CAS PubMed.
- D. W. Fu, J. X. Gao, P. Z. Huang, R. Y. Ren, T. Shao, L. J. Han, J. Liu and J. M. Gong, Angew. Chem., Int. Ed., 2021, 60, 8198–8202 CrossRef CAS PubMed.
- Z. L. Zhang, P. F. Li, Y. Y. Tang, A. J. Wilson, K. Willets, M. Wuttig, R. G. Xiong and S. Q. Ren, Sci. Adv., 2017, 3, e1701008 CrossRef PubMed.
- X. L. Liu, D. Li, H. X. Zhao, X. W. Dong, L. S. Long and L. S. Zheng, Adv. Mater., 2021, 2004542, DOI:10.1002/adma.202004542.
- P.-P. Shi, Y.-Y. Tang, P.-F. Li, W.-Q. Liao, Z.-X. Wang, Q. Ye and R.-G. Xiong, Chem. Soc. Rev., 2016, 45, 3811–3827 RSC.
- Y. Peng, J. Bie, X. T. Liu, L. N. Li, S. Chen, W. Fa, S. S. Wang, Z. H. Sun and J. H. Luo, Angew. Chem., Int. Ed., 2021, 60, 2839–2843 CrossRef CAS PubMed.
- W. J. Xu, K. Romanyuk, J. M. G. Martinho, Y. Zeng, X. W. Zhang, A. Ushakov, V. Shur, W. X. Zhang, X. M. Chen, A. Kholkin and J. Rocha, J. Am. Chem. Soc., 2020, 142, 16990–16998 CrossRef CAS PubMed.
- S. S. Wang, L. N. Li, W. Weng, C. M. Ji, X. T. Liu, Z. H. Sun, W. X. Lin, M. C. Hong and J. H. Luo, J. Am. Chem. Soc., 2020, 142, 55–59 CrossRef CAS PubMed.
- W. Q. Liao, Y. Zhang, C. L. Hu, J. G. Mao, H. Y. Ye, P. F. Li, S. D. Huang and R. G. Xiong, Nat. Commun., 2015, 6, 7338 CrossRef PubMed.
- H. Y. Ye, Y. Y. Tang, P. F. Li, W. Q. Liao, J. X. Gao, X. N. Hua, H. Cai, P. P. Shi, Y. M. You and R. G. Xiong, Science, 2018, 361, 151–155 CrossRef CAS PubMed.
- Y. M. You, W. Q. Liao, D. W. Zhao, H. Y. Ye, Y. Zhang, Q. H. Zhou, X. H. Niu, J. L. Wang, P. F. Li, D. W. Fu, Z. M. Wang, S. Gao, K. L. Yang, J. M. Liu, J. Y. Li, Y. F. Yan and R. G. Xiong, Science, 2017, 357, 306–309 CrossRef CAS PubMed.
- Q. Pan, Z. B. Liu, H. Y. Zhang, W. Y. Zhang, Y. Y. Tang, Y. M. You, P. F. Li, W. Q. Liao, P. P. Shi, R. W. Ma, R. Y. Wei and R. G. Xiong, Adv. Mater., 2017, 29, 1700831 CrossRef PubMed.
- G. J. Goldsmith and J. G. White, J. Chem. Phys., 1959, 31, 1175–1187 CrossRef CAS.
- D. Bordeaux, J. Bornarel, A. Capiomont, J. Lajzerowicz-Bonneteau, J. Lajzerowicz and J. F. Legrand, Phys. Rev. Lett., 1973, 31, 314–317 CrossRef.
- Y. Kamishina, Y. Akishige and M. Hashimoto, J. Phys. Soc. Jpn., 1991, 60, 2147–2150 CrossRef CAS.
- S. Horiuchi, Y. Tokunaga, G. Giovannetti, S. Picozzi, H. Itoh, R. Shimano, R. Kumai and Y. Tokura, Nature, 2010, 463, 789–792 CrossRef CAS PubMed.
- M. Owczarek, K. A. Hujsak, D. P. Ferris, A. Prokofjevs, I. Majerz, P. Szklarz, H. C. Zhang, A. A. Sarjeant, C. L. Stern, R. Jakubas, S. Hong, V. P. Dravid and J. F. Stoddart, Nat. Commun., 2016, 7, 13108 CrossRef CAS PubMed.
- P. F. Li, W. Q. Liao, Y. Y. Tang, W. C. Qiao, D. W. Zhao, Y. Ai, Y. F. Yao and R. G. Xiong, Proc. Natl. Acad. Sci. U. S. A., 2019, 116, 5878–5885 CrossRef CAS PubMed.
- Y. Ai, Y. L. Zeng, W. H. He, X. Q. Huang and Y. Y. Tang, J. Am. Chem. Soc., 2020, 142, 13989–13995 CrossRef CAS PubMed.
- P. Regtien and D. Edwin, Sensors for mechatronics, Elsevier, Washington, WA, 2nd edn, 2018 Search PubMed.
- T. C. Mike Chung and A. Petchsuk, Polymers, Ferroelectric, Academic Press, 2003 Search PubMed.
- H. Y. Liu, H. Y. Zhang, X. G. Chen and R. G. Xiong, J. Am. Chem. Soc., 2020, 142, 15205–15218 CrossRef CAS PubMed.
- J. Harada, Y. Kawamura, Y. Takahashi, Y. Uemura, T. Hasegawa, H. Taniguchi and K. Maruyama, J. Am. Chem. Soc., 2019, 141, 9349–9357 CrossRef PubMed.
- Y. M. You, Y. Y. Tang, P. F. Li, H. Y. Zhang, W. Y. Zhang, Y. Zhang, H. Y. Ye, T. Nakamura and R. G. Xiong, Nat. Commun., 2017, 8, 14934 CrossRef CAS.
- P. F. Li, Y. Y. Tang, Z. X. Wang, H. Y. Ye, Y. M. You and R. G. Xiong, Nat. Commun., 2016, 7, 13635 CrossRef CAS PubMed.
- Y. L. Zeng, X. Q. Huang, C. R. Huang, H. Zhang, F. Wang and Z. X. Wang, Angew. Chem., Int. Ed., 2021, 60, 10730–10735 CrossRef CAS PubMed.
- Y. Y. Tang, Y. Ai, W. Q. Liao, P. F. Li, Z. X. Wang and R. G. Xiong, Adv. Mater., 2019, 31, 1902163 CrossRef PubMed.
- W. X. Gao, Z. L. Zhang, P. F. Li, Y. Y. Tang, R. G. Xiong, G. L. Yuan and S. Q. Ren, ACS Nano, 2017, 11, 11739–11745 CrossRef CAS PubMed.
- A. Chakraborty, J. K. Ray, K. Chinnakali, I. A. Razak and H. K. Fun, Acta Crystallogr., Sect. C: Struct. Chem., 1997, 53, 1725–1726 CrossRef.
- N. E. Sherstyuk, E. D. Mishina, S. D. Lavrov, A. M. Buryakov, M. A. Marchenkova, A. S. Elshin and A. S. Sigov, Feroelectrics, 2015, 477, 29–46 CrossRef CAS.
- K. Aizu, J. Phys. Soc. Jpn., 1969, 27, 387–396 CrossRef CAS.
- D. A. Bonnell, S. V. Kalinin, A. L. Kholkin and A. Gruverman, MRS Bull., 2009, 34, 648–657 CrossRef CAS.
- H. Y. Zhang, X. G. Chen, Y. Y. Tang, W. Q. Liao, F. F. Di, X. Mu, H. Peng and R. G. Xiong, Chem. Soc. Rev., 2021, 50, 8248–8278 RSC.
Footnotes |
| † Electronic supplementary information (ESI) available: Crystal structures, PXRD, calculations, PFM and crystal refinement data. CCDC 2087280–2087283 and 2087461. For ESI and crystallographic data in CIF or other electronic format see DOI: 10.1039/d1sc04322f |
| ‡ The authors contributed equally to this work. |
| This journal is © The Royal Society of Chemistry 2022 |

