Development of the Water Instrument: a comprehensive measure of students’ knowledge of fundamental concepts in general chemistry†
Morgan
Balabanoff
a,
Haiyan
Al Fulaiti
a,
Brittland
DeKorver
b,
Michael
Mack
c and
Alena
Moon
 *a
*a
aDepartment of Chemistry, University of Nebraska-Lincoln, Lincoln, NE, USA. E-mail: amoon3@unl.edu
bDepartment of Chemistry, Grand Valley State University, Allendale, MI, USA
cUniversity of Washington, Seattle, WA, USA
First published on 8th December 2021
Abstract
General Chemistry serves virtually all STEM students. It has been accused of covering content in a “mile wide and inch deep” fashion. This has made it very difficult to assess, where chemistry educators have relied on assessments of specific topics. Assessing across all these different topics requires introducing many different chemical systems and contexts, which may pose a threat to validity in the measurement of students’ knowledge of general chemistry concepts. With many different systems and contexts, it is possible that students will have varying familiarity, may resort to memorization, or rely on fragments of knowledge to answer. To account for challenges which may arise with different systems and contexts, we have developed an assessment instrument for measuring students’ understanding of key concepts from a year-long sequence of general chemistry that relies on a single context: water. The Water Instrument was developed using exploratory sequential design to target eight of the ten anchoring concepts for general chemistry. Psychometric results will be presented from the final pilot administration, where an item response model was used to evaluate the assessment. Further evidence gathered through Response Process Validity interviews will be presented. The evidence gathered indicates this assessment offers a valid and reliable estimate of students’ understanding of general chemistry concepts in the context of water, which makes this instrument promising for general chemistry assessment. The comprehensive nature of the assessment can provide rich information to instructors regarding their students’ conceptual knowledge of the wide range of topics covered in a year-long sequence of general chemistry.
Introduction
Assessing general chemistry is a difficult, but necessary, undertaking for multiple reasons. Firstly, the general chemistry sequence covers a broad range of topics (Cooper and Stowe, 2018). Secondly, to assess these broad range of topics, the evaluator often must sacrifice assessing conceptual depth (i.e. coherent conceptual understanding of core concepts) (Cooper and Stowe, 2018). This trade-off relates closely to the third challenge with assessing general chemistry. Often, general chemistry courses are large and serve an array of majors including all STEM majors, most of whom do not intend to become chemists. Offering a class with this type of enrolment requires a significant investment of resources. This last characteristic necessitates assessment that is going to provide compelling evidence to a variety of stakeholders—chemistry instructors, chemistry departments, departments and colleges with students in general chemistry—that instruction “worked.” We posit that claims about effective general chemistry instruction must be supported by a body of evidence that demonstrates students’ coherent, conceptual understanding of big ideas in general chemistry (National Research Council, 2001). Because general chemistry serves all STEM majors, instructors in other fields would benefit from access to a measure that reports on what conceptions students are bringing from chemistry into their respective fields to promote effective STEM instruction. For example, an instructor of a civil engineering course might benefit from knowing how the students entering their class reason about reactions in water for teaching about water treatment in a chemical plant. Currently, a measure that can generate this evidence that also fits within the constraints of general chemistry does not exist. Such an instrument must generate evidence of coherent, conceptual knowledge of fundamental topics, be easy to interpret, and be relatively quick and easy to administer to large numbers of students.To this end, this article will present results from the development and testing of an instrument to assess learning of key general chemistry topics. This instrument targets eight of the ten anchoring concepts defined by the American Chemical Society (ACS) Examinations Institute (Holme and Murphy, 2012). The anchoring concepts in their most abstracted form were identified as “big ideas” in General Chemistry, as these are typically built on throughout an undergraduate chemistry curriculum.
One further consideration for assessing student learning in general chemistry is determining the appropriate context (Stewart et al., 2012). Important features of this context are that it be rich enough to activate knowledge resources about big ideas within chemistry, but not too rich that it overwhelms the student (Rennie and Parker, 1996; Smith et al., 2006). It is also important that this context be accessible; that is, it should be relevant and meaningful to a variety of students taking general chemistry at a variety of institutions and with a variety of instructional techniques. To this end, this instrument is entirely contextualized in water and its constituent elements. Water is a familiar molecule and is often used as a context to teach a variety of topics in chemistry. Further, water is essential across STEM (e.g., as a greenhouse gas or as the solvent for biochemical processes in our bodies). Importantly, water has an essential role in socio-political goals of sustainability (i.e., United Nations’ sustainable development goal to “ensure availability and sustainable management of water and sanitation for all”) (McCarroll and Hamann, 2020). Because of the contextualization in water, we refer to this instrument as the Water Instrument. To maintain ease of use and gather evidence of deep, conceptual knowledge, the instrument has two tiers: multiple-choice and confidence (Treagust, 1988). The objective of this article is to make an argument for the validity and reliability of data generated by the water instrument.
Background
The chemistry education research (CER) community has developed many assessments that have been used to evaluate instructional and educational interventions, and measure students’ understanding of specific chemistry concepts (Mulford and Robinson, 2002; Wren and Barbera, 2013a; Taskin et al., 2015; Atkinson et al., 2020). The most common form of these assessments are concept inventories (Chandrasegaran et al., 2007; Sreenivasulu and Subramaniam, 2013; Wren and Barbera, 2013b; Bretz and Murata Mayo, 2018), which have been used in CER for over 30 years (Treagust, 1988). Concept inventories are also commonly used in other STEM fields with some notable examples such as the Force Concept Inventory (Hestenes et al., 1992), the Genetics Concept Assessment (Smith, Wood, and Knight, 2008), and the Biology Concept Inventory (Garvin-Doxas and Klymkowsky, 2008). Concept inventories typically consist of multiple-choice questions, which identify alternate conceptions that students hold, often based on the distractor students choose for an item. Concept inventories can be used by both instructors and students to identify which target concepts may need further attention.The primary motivation for developing concept inventories is to have tools for offering instructors information about ideas held by their students so that they can tailor instruction to students’ prior knowledge (Bretz, 2014). It is especially important for instructors to have an idea of the alternate conceptions that students possess as they can be difficult to alter (Gelman, 2011; Shtulman and Lombrozo, 2016; Cooper and Stowe, 2018). By being aware of conceptions held by students, instructors can effectively help students accommodate new and scientifically accurate conceptions (Chen et al., 2019). This is especially important because students often cannot correct their own alternate conceptions without instructor guidance (Sadler et al., 2013). There have also been disciplinary calls for ensuring that assessments generate both reliable and valid data (Bunce, 2008; Lowery Bretz, 2008; Barbera and VandenPlas, 2011; Villafañe et al., 2011; The National Academies Press, 2012). Some assessments have ensured this by providing psychometric evidence to support claims about quality (Arjoon et al., 2013; Barbera, 2013; Wren and Barbera, 2014).
Most of the concept inventories existing within the CER community are topic specific and address one big idea or concept in chemistry. These content-specific concept inventories can be helpful when instructors are assessing their students’ comprehension at various points during the course; however, they do not provide holistic evidence of their comprehension of concepts targeted by a year-long general chemistry course. The Chemical Concepts Inventory (CCI) was developed in 2002 and aimed to identify students’ alternate conceptions of chemistry concepts typically introduced over first-semester general chemistry (Mulford and Robinson, 2002). This concept inventory utilized chemistry textbooks and the ACS exam to determine content coverage for this assessment. The CCI is widely used to determine common alternate conceptions held by both students (Cacciatore and Sevian, 2009; Mayer, 2011; Regan et al., 2011) and teachers (Kruse and Roehrig, 2005). The CCI has also been used to evaluate an interdisciplinary disciplinary courses such as a high school science course which employed engineering design to teach central chemistry topics such as reactions, energy changes, and atomic interactions (Apedoe et al., 2008). The frequent use of the CCI highlights the value and the need for researchers and practitioners to have access to an assessment targeting general chemistry concepts. More recently, psychometric evidence was collected from the CCI to determine the quality of this widespread assessment (Barbera, 2013). Using Classical Test Theory and a Rasch model analysis, the CCI was determined to be a suitable instrument when assessing students’ alternate conceptions (Barbera, 2013). However, the CCI provides instructors limited information about their students’ general chemistry knowledge as it only covers the first semester of General Chemistry. Further, the items developed for this assessment are limited in their capacity to target big ideas or key concepts in chemistry as the assessment primarily consists of recall items. Finally, researchers in CER continue to investigate and identify alternate conceptions in general chemistry (Kolomuç and Tekin, 2011; Becker and Cooper, 2014; Luxford and Bretz, 2014; Malkawi et al., 2018) and their findings need to be considered when designing assessments measuring general chemistry conceptions.
While the CCI provides information regarding the first semester of General Chemistry, the ACS exams provide a measure of the entire first year of general chemistry. A significant advantage of the ACS exams is that this assessment is normalized to compare across varied student samples. However, there is a call for more concept inventories in chemistry (Singer et al., 2012), specifically a conceptual measurement for the year-long sequence of General Chemistry that is shorter and easier to administer in a classroom setting. Additionally, we are motivated to create an assessment that is equitable and accessible for a diverse number of students who encounter a variety of instructional approaches and varying chemical contexts and examples. This is because varying the contexts of instructional materials resulted in varied consistency in students’ ability to answer assessment questions correctly (Stewart et al., 2012). In an effort to achieve an equitable and accessible measure of students’ knowledge, this instrument aims to assess student understanding of general chemistry concepts using the context of water and its constituent elements.
Methods
Design and development
The Water Instrument was designed to target the main concepts outlined by the Anchoring Concepts Content Map (ACCM) (Holme and Murphy, 2012; Murphy et al., 2012). As mentioned earlier, this instrument targets eight of the ten anchoring concepts including: atoms, bonding, structure and function, intermolecular interactions, reactions, energy and thermodynamics, kinetics, and equilibrium. The 9th anchoring concept, experiment, was outside the scope of this instrument. The 10th anchoring concept, visualization, is implicitly targeted by the whole instrument as many items require interaction with a chemical representation. This instrument has been split into three parts: single molecules, multiple molecules, and interactions/reactions. Associated anchoring concepts can be found in Table 1.| Single water molecule | Multiple water molecules | Interactions and reactions |
|---|---|---|
| • Atoms (1) | • Intermolecular forces (4) | • Reactions (5) |
| • Bonding (2) | • Energy and thermodynamics (6) | • Kinetics (7) |
| • Structure and function (3) | • Equilibrium (8) |
As highlighted in the background, there is an extensive body of literature that has identified chemistry students’ alternate conceptions, which has been leveraged for this assessment (Peterson and Treagust, 1989; Boo, 1998; Lewis and Lewis, 2005; Stains and Talanquer, 2007; Coştu, 2008; Devetak et al., 2009). Alternate conceptions identified in these studies were used to generate distractors for this assessment. The structure and content coverage of this assessment was developed by aligning alternate conceptions literature with anchoring concepts.
Instrument history
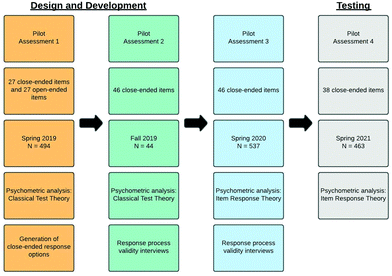
This instrument has undergone multiple pilot administrations and revisions to produce the version that generated the response data constituting these findings. Fig. 1 provides an overview of the pilot administrations including format, sample size, and evaluation. Pilot 1 was administered to a large, second-semester general chemistry course for STEM majors with a 99% response rate and a total number of 494 consenting and complete responses. Unique to Pilot 1 was that it was four-tiered with a multiple-choice item, confidence, explanation, and confidence. It was piloted with an open-ended explanation tier, which was used to construct a close-ended explanation tier based on student ideas and words. Pilot Assessment 2 was administered to a small, first-semester general chemistry course for chemistry majors with a 93% response rate and a total number of 44 consenting and complete responses. For Pilot 2, all items were close-ended. Pilot Assessment 3 was administered to a large, second-semester general chemistry course for STEM majors with an 87% response rate and a total number of 537 consenting and complete responses. Pilot Assessment 4 was administered to a large, second-semester general chemistry course for STEM majors with an 79% response rate and a total number of 463 consenting and complete responses. All pilots were administered at University of Nebraska–Lincoln.After each pilot, response data were used to inform revisions. After Pilot 1, in addition to student generated responses to open-ended items, discrimination and difficulty indices were used to flag items that were potentially problematic (0.3 > Difficulty > 0.8, Discrimination > 0.3) (Ding and Beichner, 2009) and these items were interrogated. If response data elucidated a problem with an item, revisions were made accordingly. If not, the items were tested again in Pilot 2. The same protocol was used to evaluate items in Pilot 2 where assessment items were entirely close-ended. Response data from Pilot 3 were modelled using item response theory, where a 1PL, 2PL, and 3PL models were all tested. Additionally, response process validity interviews were conducted. For Pilot 3 data, 3PL model had the best fit. The model parameters—infit and outfit statistics, discrimination estimates, difficulty estimates, and item characteristic curves—were used to evaluate how items were performing. Again, problematic items were flagged based on quantitative and qualitative data. For an item to be flagged, multiple sources of evidence had to confirm poor performance (i.e., negative discrimination and an unacceptable infit statistic). Again, if response data and qualitative data elucidated the source of the problem, items were revised. Pilots 1, 2, and 3 were administered with a four-tier structure in which multiple-choice and explanation tiers were paired. Analysis of Pilot 3 responses for local independence using Yen's Q3 statistic revealed that paired items were not actually testing as paired. That is, students’ response to the multiple-choice tier did not impact their response to the explanation tier, which was evidenced by the absence of any correlation between item residuals. For this reason, Pilot 4 was administered with a two-tier structure: multiple-choice item and confidence tier.
Data collection
Instrument administration
The instrument was administered electronically through Qualtrics. The instrument was advertised as a review opportunity for the final exam and was paired with ten extra credit points. Students elected to give their consent to their responses being used for research purposes, and all students who complete the survey received extra credit regardless of their decision to participate for research purposes. The survey was administered in the last two weeks of the semester where students could complete the survey on their own time to allow for sufficient time to complete the assessment in its entirety. Students were allowed to complete the survey in this fashion to mitigate threats to unidimensionality by removing “speediness” as an additional latent construct (de Ayala, 2009). This allowed us to target only our intended single latent construct of general chemistry content knowledge. For this administration, there was a 79% response rate with 463 complete and consenting responses.Response process interviews
Over the lifetime of the instrument, response process validity (RPV) interviews were conducted with students after completion of the instrument. In total, 27 interviews were conducted with general chemistry students. Interviews occurred after the semester had ended as the assessment was administered one week before final exams. At the end of the assessment, students were asked if they were willing to participate in RPV interviews. These interviews were used to determine if students used one or more alternate conceptions when responding to questions posed by the Water Instrument (Wren and Barbera, 2013b; Trate et al., 2019). These interviews also provided evidence of validity when a student employed a concept appropriately and selected the scientifically accurate response. RPV interviews involved students explaining their responses to a set of items. Items were selected for the interviews based on the difficulty and discrimination values from Pilots 1, 2, and 3. Students were shown a set of items with the answer they selected and asked to explain why they chose response options, how they eliminated response options, and if they found anything unclear about the items.Data analysis
Response process interviews
Interviews were transcribed and coded following a process similar to Wren and Barbera (2013) and Trate et al. (2019). Evidence was categorized into three categories: (i) no useable evidence, (ii) evidence for response process validity, and (iii) evidence for revision (Wren and Barbera, 2013a; Trate et al., 2019). A full list of codes is provided in Table 2.| Code | Description |
|---|---|
| Evidence for validity | |
| CCC | Student chose correct option and reasoning included correct conception |
| IAC | Student chose incorrect option and reasoning included intended alternate conception |
| EAC | Student eliminated the correct option and reasoning included an alternate conception |
| ECC | Student eliminated an incorrect option and reasoning included correct conception |
| Evidence for revision | |
| CAC | Student chose correct option but did not provide reasoning to support selection, or reasoning included alternate conception |
| NAC | Student chose incorrect option, but reasoning did not demonstrate holding that alternate conception |
| EXT | Student used extraneous information to eliminate or choose an item option |
| EDR | Student eliminated incorrect option because it did not seem reasonable |
| TTS | Student applied a test-taking strategy to increase chances of answering correctly |
| No usable evidence | |
| DA | Student did not attempt or answer item |
| G | Student guessed and did not use reasoning related to the item to select an option |
Interview transcripts were analysed for evidence that an item was measuring what it intended to measure (i.e., a valid measure of common student conceptions). If there was evidence that the item was not valid, it was revised. Evidence for validity included choosing the correct option while explaining the correct conception or choosing a distractor while explaining the corresponding alternate conception. Evidence for revision included choosing the correct option without evidence of conceptual understanding aligned with the scientific consensus or using extraneous information. If a student explained they guessed on a question, it was not used as evidence of validity or evidence for revision.
Item response theory
Pilot assessment responses were modelled using item response theory (IRT), which serves to connect the items and item responses to the latent construct of interest—ability—which in this case is knowledge of core concepts in general chemistry (Wilson, 2005). IRT models the relations between ability (θ), item difficulty (bi), and probability of correct response (P(Xi = 1|θ, bi)) as shown in eqn (1) below. | (1) |
Item response modelling was carried out in the software package R (R Development Core Team, 2013) using the mirt package (Chalmers, 2012) and Winsteps 5.1.1 (Linacre, 2021). One assumption of using an IRT approach is unidimensionality. Support for unidimensionality was provided by the acceptable model fit indices (Wallace et al., 2017), which will be presented in detail in the Results section.
Data processing
Data was first processed by removing students who did not provide consent, any incomplete responses, and responses that were completed too quickly (less than 10 minutes) to provide meaningful responses. Upon the removal of these responses, there was a total of 431 complete and consenting responses. We further evaluated respondents using person infit and outfit mean square values and weighted t-values values. This prompted us to remove 16 more respondents with infit and outfit values outside of the 0.75–1.33 range and weighted t-values were outside of the −2 to 2 range (Wilson, 2005). The person reliability, which ranges from 0 to 1, was found to be 0.65 indicating an acceptable fit (Nunnally, 1978). After the data processing step, the number of respondents was N = 415.Results and discussion
RPV interviews
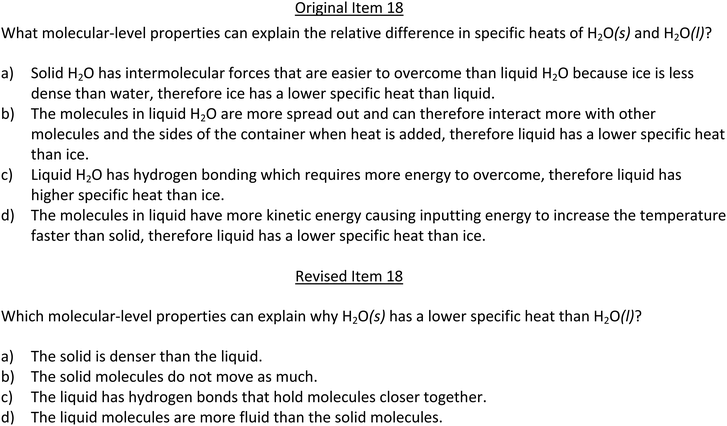
Interview transcripts were coded according to the codebook displayed in Table 2. Three examples will be used to discuss the results of these interviews. Fig. 2 shows Item 18, which asked students to use molecular-level properties to explain the differences in specific heat for bulk water in solid and liquid phases. Students struggled with this particular item (Original Item 18 in Fig. 2), saying that the response options were “lengthy.” One student explained:“I don’t think I gave it a lot of thought; I think I just selected an answer. I went with A. The answers are kind of lengthy, so I felt like I needed to reread the answer to make sure that I’m answering the question… that I’m not getting lost in the answers to the question. I probably didn’t go with the others because the answers were longer, I didn’t feel comfortable in my answer.”
Another student explained that they did not notice some of the key differences between the options: “I didn’t even realize that each option had different comparisons between specific heat of liquid and solid. I guess that would probably change my answer.”
Based on this data, we concluded that Item 18 did not adequately measure students’ understanding of the particulate nature of specific heat because a correct response also depended on a careful decoding of the question and corresponding answers. To reduce validity threats related to readability, this item was revised to simplify and shorten the response options (Revised Item 18 in Fig. 2).
As shown in Fig. 3, Item 20 targeted kinetic molecular theory by asking students to predict how the curve will change with a temperature increase. Interviews provided evidence for students choosing the correct response option while holding the correct conception. For example, one student drew how the curve would change (Fig. 4) and provided the following explanation: “With the temperature increase, the curve would get wider than if the temperature stayed the same.”
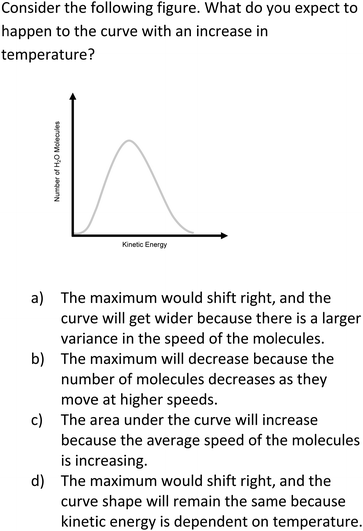 | ||
| Fig. 3 Item 20 as it appears on the Water Instrument. This item is in the “Interactions and Reactions” section of the instrument and targets Anchoring Concept 7. | ||
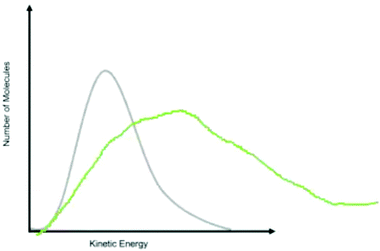 | ||
| Fig. 4 A student's drawing explaining how they predicted the curve would change with a temperature increase. | ||
Interviews also revealed instances of students holding an alternate conception and choosing the associated response option. For example, one student explained why they chose option C: “As the temperature increases, that means there's more energy so the area underneath the curve would have to increase.” Another student explained why they chose incorrect option D and demonstrated they held the associated alternate conception:
“If there is an increase in temperature, that means that the kinetic energy would change. But that wouldn’t change the number of molecules so the shape would stay the same but the values for kinetic energy would just be greater. So, I would think that the maximum would shift right, and the shape would remain constant.”
These two students chose incorrect options based on their alternate conceptions which provided evidence that these response options measured the intended alternate conceptions.
Additionally, students provided reasoning for eliminating specific response options. In this example, one student explained why they eliminated option B for Item 20: “The number of molecules wouldn’t be affected; it would just be the amount of energy. So that doesn’t make sense at all.” This student held the correct conception that the number of molecules would not change and eliminated the incorrect response option. This further provided evidence that the item is functioning for students who possess correct and alternate conceptions.
While Item 18 showed evidence for revision and Item 20 showed evidence for response process validity, some items showed evidence for both. For example, Item 4 (Fig. 5) asked students to explain why a bond forms between H and O in a water molecule. Many students provided explanations that aligned with the alternate conceptions associated with incorrect item responses. One student explained that hydrogen has a positive charge and oxygen has a negative charge which aligns with option A: “I chose it because the answer kind of explains it, but since H is positive and O is negatively charged they would attract and it would make a more stable bond.” Additionally, another student explained why they chose option B which was related to the octet rule.
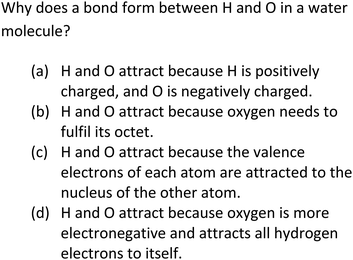 | ||
| Fig. 5 Item 4 as it appears on the Water Instrument. This item is in the “Single Water Molecule” section of the instrument and targets Anchoring Concept 2. | ||
“I know oxygen has 6 valence electrons and I know that hydrogen only has one electron and needs two to fill its valence shell. The oxygen since it has two open spots, two hydrogens donate two electrons to oxygen therefore completing its octet and they are both sharing an electron with oxygen so they are completing theirs.”
However, during the RPV interviews, no students chose the correct answer or demonstrated having correct conceptions about bonding between hydrogen and oxygen. Additionally, only 5% of students answered this item correctly during Pilot 3 administration. One student provided the following reasoning for eliminating the correct response option C:
“For C, I don’t think that is really how valence electrons work, they aren’t attracted to the other nucleus of the atom. I suppose they would be [attracted] in the sense that the nucleus holds the protons and electrons in the valence shell would be attracted to something positive. But I guess in all of our discussions in chemistry, we never once talked about how valence electrons are attracted to the other nucleus of other atoms. It is kind of beside the point to me.”
Based on this interview data, Item 4 is measuring alternate conceptions the students hold. However, with our sample population, we do not have any evidence for validity regarding the correct option (option C). We propose that to evaluate the functionality of Item 4, we need to test with more samples with varying instruction about bonding. At this time, there is evidence to support the use of the item to measure students’ alternate conceptions and further exploration is necessary to evaluate the functionality of option C. Response process validity interviews allowed for a careful evaluation of multiple items’ ability to accurately provide information about the conceptions students hold. Combining the qualitative and quantitative information provided a more holistic evaluation of item functionality. Based on the pieces of evidence gathered from the RPV interviews, items were either revised, removed, or kept the same using the same decision-making process outlined in these three examples.
Item response theory
| Item | b | INFIT | OUTFIT | ||
|---|---|---|---|---|---|
| MNSQ | ZSTD | MNSQ | ZSTD | ||
| 1 | −0.71 | 0.99 | −0.25 | 0.98 | −0.64 |
| 2 | −0.63 | 0.92 | −2.88 | 0.92 | −2.44 |
| 3 | 0.31 | 1.07 | 1.51 | 1.09 | 1.50 |
| 4 | 2.30 | 1.02 | 0.17 | 1.19 | 0.88 |
| 5 | −0.44 | 0.98 | −0.57 | 0.98 | −0.50 |
| 6 | 0.33 | 1.03 | 0.59 | 1.03 | 0.46 |
| 7 | −1.18 | 1.05 | 1.50 | 1.08 | 1.64 |
| 8 | 1.37 | 1.06 | 0.58 | 1.21 | 1.59 |
| 9 | −3.05 | 0.97 | −0.15 | 0.79 | −1.26 |
| 10 | −0.27 | 1.03 | 0.85 | 1.03 | 0.72 |
| 11 | −0.08 | 1.06 | 1.55 | 1.06 | 1.37 |
| 12 | 0.38 | 1.13 | 2.48 | 1.21 | 3.04 |
| 13 | −1.34 | 0.89 | −2.94 | 0.85 | −2.94 |
| 14 | −0.35 | 1.03 | 0.98 | 1.03 | 0.76 |
| 15 | 0.58 | 1.04 | 0.70 | 1.10 | 1.29 |
| 16 | −0.72 | 0.96 | −1.55 | 0.94 | −1.67 |
| 17 | 2.10 | 1.03 | 0.26 | 1.24 | 1.17 |
| 18 | 0.51 | 0.99 | −0.13 | 0.99 | −0.15 |
| 19 | 0.77 | 0.98 | −0.23 | 0.96 | −0.41 |
| 20 | 0.36 | 1.04 | 0.87 | 1.04 | 0.60 |
| 21 | −0.49 | 0.95 | −1.87 | 0.93 | −2.04 |
| 22 | −0.53 | 0.89 | −4.08 | 0.88 | −3.65 |
| 23 | 1.08 | 0.98 | −0.18 | 1.04 | 0.38 |
| 24 | 0.57 | 0.93 | −1.13 | 0.94 | −0.87 |
| 25 | 0.33 | 1.17 | 3.35 | 1.21 | 3.27 |
| 26 | −0.83 | 1.03 | 1.07 | 1.04 | 1.06 |
| 27 | −0.45 | 0.86 | −5.22 | 0.84 | −4.90 |
| 28 | 0.61 | 0.99 | −0.23 | 0.98 | −0.24 |
| 29 | 1.37 | 1.00 | 0.06 | 0.92 | −0.61 |
| 30 | −0.20 | 1.11 | 3.18 | 1.13 | 3.08 |
| 31 | 1.03 | 0.95 | −0.60 | 0.88 | −1.18 |
| 32 | −0.65 | 0.97 | −1.00 | 0.96 | −1.02 |
| 33 | −1.04 | 1.01 | 0.21 | 0.99 | −0.16 |
| 34 | −0.46 | 1.01 | 0.32 | 1.00 | 0.12 |
| 35 | −0.24 | 0.88 | −3.73 | 0.87 | −3.33 |
| 36 | −0.57 | 1.03 | 0.94 | 1.03 | 0.93 |
| 37 | −0.53 | 0.93 | −2.61 | 0.92 | −2.50 |
| 38 | 0.78 | 1.03 | 0.43 | 1.04 | 0.47 |
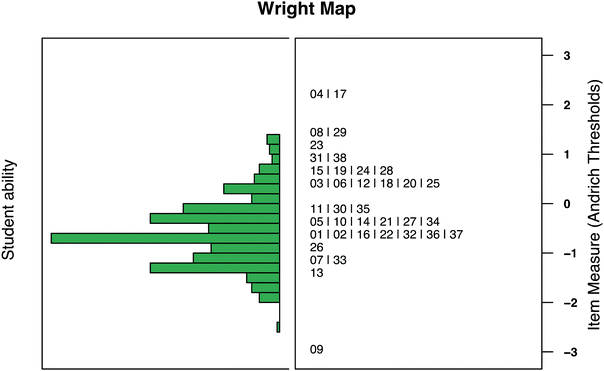
An IRT approach affords direct comparison between item difficulty and student ability, shown in the Wright map in Fig. 6. According to a Wright map, a student with a given ability has a 50% chance of responding correctly to items with equivalent difficulty and more than 50% chance for items with lower difficulty. This instrument, then, was overall difficult for students with some items falling completely outside the range of student ability (Items 4, 8, 9, 17, 29) and numerous items accessible to very few students (Items 19, 23, 31, 38). Even so, the majority of the items showed difficulty parameters close to the average student ability. When item difficulties are separated by anchoring concept as is shown in Table 4, it is evident that there were difficult items across the anchoring concepts. A more in-depth discussion of responses in the following section aims to explain some of the difficulty. As seen in Table 4, Anchoring Concept 1 has one item for the Pilot 4 administration. In earlier pilots, four items targeted Anchoring Concept 1. After evaluating difficulty and discrimination values and RPV interview data, three of the four items were considered poor measures of students’ conceptual knowledge. The misconceptions literature used to develop items targeting Anchoring Concept 1 identified more surface-level alternate conceptions such as misclassifying molecular elements as chemical compounds (Stains and Talanquer, 2007). Subsequently, this made it difficult to develop items grounded in alternate conceptions for Anchoring Concept 1 that elicited students’ deep conceptual understanding. Further, Anchoring Concept 1 is built upon in subsequent anchoring concepts such as Anchoring Concept 2 (Bonding) which explicitly targets students’ understanding of the atomic structure when considering bonding (Fig. 5).
| Anchoring concept | Associated items | Item difficulty per item |
|---|---|---|
| 1. Matter and atoms | #1 | −0.71 |
| 2. Bonding | #2, #3, #4, #5, #6 | −0.63, 0.31, 2.30, −0.44, 0.33 |
| 3. Structure and function | #7, #8, #9, #10, #11 | −1.18, 1.37, −3.05, −0.27, −0.08 |
| 4. Intermolecular forces | #12, #13, #14, #15, #16, #17, #18, #19, #21 | 0.38, −1.34, −0.35, 0.58, −0.72, 2.10, 0.51, 0.77, −0.49 |
| 5. Reactions | #22, #23 | −0.53, 1.08 |
| 6. Energy and thermodynamics | #20, #24, #25, #26, #31, #32 | 0.36, 0.57, 0.33, −0.83, 1.03, −0.65 |
| 7. Kinetics | #28, #29, #30 | 0.61, 1.37, −0.20 |
| 8. Equilibrium | #27, #33, #34, #35, #36, #37, #38 | −0.45, −1.04, −0.46, −0.24, −0.57, −0.53, 0.78 |
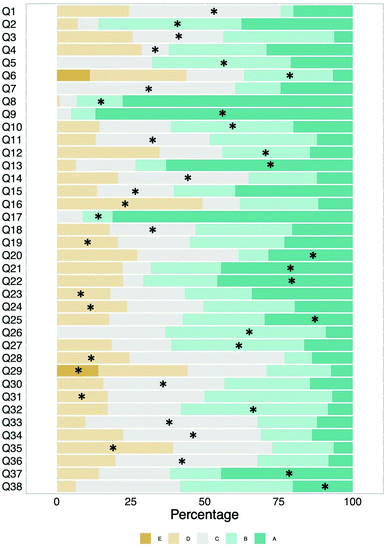 | ||
| Fig. 7 Response distribution for each item. Asterix indicates the correct answer. Items 6 and 29 have five response options. Items 5, 9, and 17 have three response options. | ||
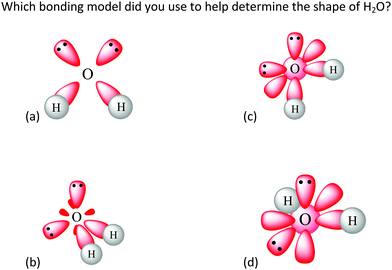 | ||
| Fig. 8 Item 8 as it appears on the Water Instrument. This item is in the “Single Water Molecule” section of the instrument and targets Anchoring Concept 3. | ||
Item 23, shown in Fig. 9, prompted students to reason about bond breaking and forming to explain the energetics of water formation. In contrast to Item 8, there was not a single distractor that obviously appealed to students. This is not surprising as the difficulty of the topic of energy of bond breaking and bond forming has been well established in the literature (Boo, 1998). The fact that items that target historically difficult concepts are notably difficult for this student sample lends further validity to the measure developed herein.
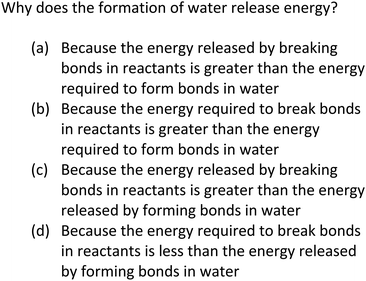 | ||
| Fig. 9 Item 23 prompts students to use bond breaking and bond forming to reason about the energetics of water formation in the “Interactions and Reactions” section and targets Anchoring Concept 5. | ||
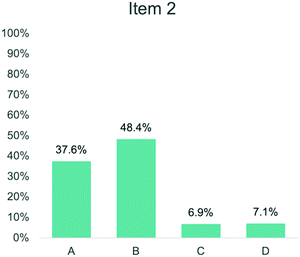
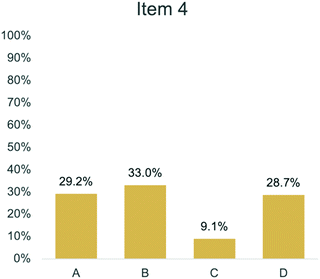
Comparing assessment items corresponding to the same anchoring concept also provides insight into the variation in student performance. For example, Items 2 and 4 both targeted Bonding (Anchoring Concept 2). Item 2 asked students to describe the role of electrons in a bond between oxygen and hydrogen (Fig. 10). In Fig. 11, 48.4% of students answered this question correctly by selecting option B. In comparison, Item 4 asked students to explain why a bond forms between oxygen and hydrogen (Fig. 5). In Fig. 12, 9.1% of students answered this question correctly by selecting option C. While both items target the same anchoring concept, Item 2 provided information about how students describe the bond between oxygen and hydrogen, whereas Item 4 focused on why the bond forms. As seen in the RPV interviews, students struggled to think about how valence electrons can be attracted to another nucleus and were more likely to choose response options in Item 4 that aligned with heuristics (Taber, 2001; Talanquer, 2007; Zohar and Levy, 2019) or assigned a charge to oxygen and hydrogen atoms.
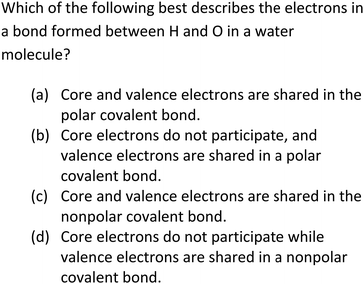 | ||
| Fig. 10 Item 2 as it appears on the Water Instrument. This item is in the “Single Water Molecule” section of the instrument and targets Anchoring Concept 2. | ||
Limitations
This assessment is designed to assess core concepts in the year-long sequence of general chemistry, however, there are some limitations. First, the assessment does not exhaustively cover every general chemistry concept in depth and there are some anchoring concepts that have a limited number of associated items. For example, Anchoring Concept 1 has only one item. This particular concept was challenging to assess at a deeper conceptual level and our analysis resulted in the removal of poorly functioning items. Moreover, this foundational concept is built upon in subsequent anchoring concepts which can provide instructors insight regarding students’ knowledge of atoms and atomic structure.Second, at this stage, the assessment was administered at one primarily white institution where the instructional practices are considered traditional. Future work includes administering at multiple institutions including a range of institution type (i.e., community college, primarily undergraduate, etc.), institutions with a more diverse student population (i.e., Hispanic Serving Institutions, Historically Black Colleges and Universities, etc.), and institutions with reformed curricula (i.e., POGIL, CLUE, etc.).
Finally, the findings presented in this paper are based on one type of administration setting. Participants completed the assessment at the end of second-semester general chemistry via online surveys and did not have an imposed time limit. While this administration type was chosen to ensure the measurement of a single latent construct (general chemistry knowledge), future work includes administering in other instructional settings (e.g., as a final exam, in a classroom setting, as a pre-assessment) to provide more information about the assessment functionality in a variety of settings for instructors.
Conclusions and implications
Both qualitative and quantitative evidence provided support that valid and reliable conclusions can be drawn from response data generated by the Water Instrument. That is, this instrument offers instructors and researchers an estimate of students’ knowledge of the core concepts typically covered in a year-long general chemistry sequence (Table 1) (Holme and Murphy, 2012). While no single study can gather all sources of validity and reliability evidence for an instrument (Arjoon et al., 2013), substantial evidence was presented in this article to establish the validity and reliability of data generated by this instrument. Particularly, an item response model fit the response data, difficulty estimates from the item response model matched difficulties identified in the literature, internal consistency is acceptable, and qualitative interview data further elucidated those difficulties and confirmed distractors were functioning well as distractors.Continued research and development of this assessment is needed to better understand how the instrument functions at various universities and for different general chemistry student groups (e.g., non-science majors, STEM majors, and chemistry majors). The instrument should also be administered at multiple sites that offer both demographic diversity and instructional diversity. Results should then be subjected to measurement invariance testing to demonstrate the instrument functions similarly for different groups (Rocabado et al., 2019). Testing at sites with reformed chemistry curricula, for example, can offer evidence that the instrument generates useful data across general chemistry sequences with varying curriculum and instruction. Finally, the instrument would benefit from testing pre- and post-instruction to demonstrate that it can generate valid data about gains in knowledge of core concepts in general chemistry (Pentecost and Barbera, 2013).
This instrument has important uses for instruction. First, it offers instructors a relatively quick and easy means of gathering data about their students’ knowledge of general chemistry principles. There are multiple motivations for collecting this data. Instructors may use it to evaluate their students’ prior knowledge when entering a general chemistry sequence. They may use it to support a transition between first-semester and second-semester general chemistry by offering data about what knowledge students are taking from first semester and bringing to second semester. Instructors can use evidence generated by the instrument to tailor their instruction to target gaps or weaknesses in students’ prior knowledge. This is often done by disrupting their existing conceptions to create motivation for adopting scientific models (Posner et al., 1982; Bretz, 2014). The instrument can generate data about students’ knowledge at the end of a year-long general chemistry sequence. Evidence generated by this kind of administration offers instructors evidence to inform reflection on their teaching practices; that is, instructors can explore ways their instruction might have activated problematic conceptions or missed opportunities to support conceptual connections. Further, this instrument can be used to evaluate students’ knowledge of general chemistry when they enter other related STEM courses where instructors want to consider the ideas students are bringing into their courses (e.g., introductory biology instructors may want to know how their students are thinking about intermolecular forces). Additionally, the context of water makes it such that it can be useful across virtually any general chemistry sequence and has implications for how students transfer their understanding of water in a chemistry context to other courses such as biochemistry, biology, and engineering. The instrument may also offer a quick and easy means of collecting data to determine the effects of curricular changes, longitudinal effects of general chemistry instruction, and how to best introduce chemistry concepts to promote effective chemistry teaching across STEM fields. These promising future directions require widespread implementation and evaluation of this instrument in varying contexts, so anyone who would like to access the instrument for either research or practice use is encouraged to contact the corresponding author.
Author contributions
Authors 3, 4, and 5 conceptualized the study. Author 1 designed assessment instrument with input from authors 3, 4, and 5. Authors 1 and 2 oversaw all data collection. All authors contributed to data analysis. Author 1 wrote draft with extensive input from Authors 2 and 5. All authors read and approved final manuscript.Conflicts of interest
There are no conflicts to declare.Acknowledgements
We acknowledge students who gave their time to complete the instrument and tell us about it and instructors who permitted us to collect data in their classes. We further acknowledge Regis Komperda who offered advice throughout this research endeavour.References
- Apedoe X. S., Reynolds B., Ellefson M. R. and Schunn C. D., (2008), Bringing engineering design into high school science classrooms: The heating/cooling unit, J. Sci. Educ. Technol., 17(5), 454–465 DOI:10.1007/s10956-008-9114-6.
- Arjoon J. A., Xu X. and Lewis J. E., (2013), Understanding the state of the art for measurement in chemistry education research: Examining the psychometric evidence, J. Chem. Educ., 90(5), 536–545 DOI:10.1021/ed3002013.
- Atkinson M. B., Popova M., Croisant M., Reed D. J. and Bretz S. L., (2020), Development of the reaction coordinate diagram inventory: Measuring student thinking and confidence, J. Chem. Educ., 97(7), 1841–1851 DOI:10.1021/acs.jchemed.9b01186.
- Barbera J., (2013), A psychometric analysis of the chemical concepts inventory, J. Chem. Educ., 90(5), 546–553.
- Barbera J. and VandenPlas J. R., (2011), All assessment materials are not created equal: The myths about instrument development, validity, and reliability, in ACS Symposium Series, ch. 11, vol. 1074, pp. 177–193 DOI:10.1021/bk-2011-1074.ch011.
- Becker N. M. and Cooper M. M., (2014), College chemistry students’ understanding of potential energy in the context of atomic–molecular interactions, J. Res. Sci. Teach., 51(6), 789–808 DOI:10.1002/tea.21159.
- Boo H. K., (1998), Students’ understandings of chemical bonds and the energetics of chemical reactions, J. Res. Sci. Teach., 35(5), 569–581 DOI:10.1002/(SICI)1098-2736(199805)35:5<569::AID-TEA6>3.0.CO;2-N.
- Brentani E. and Silvia G., (2007), Unidimensionality in the rasch model: How to detect and interpret, E. Brentari, S. Golia 1. STATISTICA, Anno LXVII, n. 3.
- Bretz S. L., (2014), Designing assessment tools to measure students’ conceptual knowledge of chemistry, in Tools of Chemistry Education Research, American Chemical Society, vol. 1166, pp. 155–168 SE – 9 DOI:10.1021/bk-2014-1166.ch009.
- Bretz S. L. and Murata Mayo A. V., (2018), Development of the flame test concept inventory: Measuring student thinking about atomic emission, J. Chem. Educ., 95(1), 17–27 DOI:10.1021/acs.jchemed.7b00594.
- Bunce D. M., (2008), Survey development, J. Chem. Educ., 85(10), 1439.
- Cacciatore K. L. and Sevian H., (2009), Incrementally approaching an inquiry lab curriculum: Can changing a single laboratory experiment improve student performance in general chemistry? J. Chem. Educ., 86(4), 498.
- Chalmers R. P., (2012), Mirt: A multidimensional item response theory package for the R environment, J. Stat. Softw., 48(6), DOI: 10.18637/jss.v048.i06.
- Chandrasegaran A. L., Treagust D. F. and Mocerino M., (2007), The development of a two-tier multiple-choice diagnostic instrument for evaluating secondary school students’ ability to describe and explain chemical reactions using multiple levels of representation, Chem. Educ. Res. Pract., 8(3), 293–307.
- Chen C., Sonnert G., Sadler P. M., Sasselov D. and Fredericks C., (2019), The impact of student misconceptions on student persistence in a MOOC, J. Res. Sci. Teach., (March) DOI:10.1002/tea.21616.
- Cooper M. M. and Stowe R. L., (2018), Chemistry education research: From personal empiricism to evidence, theory, and informed practice, Chem. Rev. DOI:10.1021/acs.chemrev.8b00020.
- Coştu B., (2008), Big bubbles in boiling liquids: Students’ views, Chem. Educ. Res. Pract., 9(3), 219–224 10.1039/b812410h.
- de Ayala R. J., (2009), The Theory and Practice of Item Response Theory, New York, NY, US: Guilford Press.
- Devetak I., Vogrinc J. and Glažar S. A., (2009), Assessing 16-year-old students’ understanding of Aqueous solution at submicroscopic level, Res. Sci. Educ., 39(2), 157–179 DOI:10.1007/s11165-007-9077-2.
- Ding L. and Beichner R., (2009), Approaches to data analysis of multiple-choice questions. Phys. Rev. Spec. Top.: Phys. Educ. Res., 5(2), 20103 DOI:10.1103/PhysRevSTPER.5.020103.
- Garvin-Doxas, K. and Klymkowsky, M. W., (2008), Understanding randomness and its impact on student learning: Lessons learned from building the biology concept inventory (BCI), CBE—Life Sci. Educ., 7(2), 227–233 DOI:10.1187/cbe.07-08-0063.
- Gelman S. A., (2011), When worlds collide – or do they? Implications of explanatory coexistence for conceptual development and change, Hum. Dev., 54(3), 185–190 DOI:10.2307/26765004.
- Hestenes D., Wells M. and Swackhamer G., (1992), Force concept inventory, Phys. Teach., 30(3), 141–158.
- Holme T. and Murphy K., (2012), The ACS exams institute undergraduate chemistry anchoring concepts content map I: General chemistry, J. Chem. Educ., 89(6), 721–723 DOI:10.1021/ed300050q.
- Kline P., (1993), The Handbook of Psychological Testing, London: Routledge.
- Kolomuç A. and Tekin S., (2011), Chemistry teachers’ misconceptions concerning concept of chemical reaction rate, Eurasian J. Phys. Chem. Educ., 3(2), 84–101.
- Komperda R., Pentecost T. C. and Barbera J., (2018), Moving beyond alpha: A primer on alternative sources of single-administration reliability evidence for quantitative chemistry education research, J. Chem. Educ., 31 DOI:10.1021/acs.jchemed.8b00220.
- Kruse R. A. and Roehrig G. H., (2005), A comparison study: Assessing teachers’ conceptions with the chemistry concepts inventory, J. Chem. Educ., 82(8), 1246 DOI:10.1021/ed082p1246.
- Lewis S. E. and Lewis J. E., (2005), The same or not the same: Equivalence as an issue in educational research, J. Chem. Educ., 82(9), 1408.
- Linacre J. M., (2021), Winsteps.
- Lowery Bretz S., (2008), Qualitative research designs in chemistry education research, in ACS symposium series, Oxford University Press, vol. 976, pp. 79–99.
- Luxford C. J. and Bretz S. L., (2014), Development of the bonding representations inventory to identify student misconceptions about covalent and ionic bonding representations, J. Chem. Educ., 91(3), 312–320 DOI:10.1021/ed400700q.
- Malkawi E. O., Obeidat S. M., Al-rawashdeh N. A. F., Tit N. and Ihab M., (2018), Misconceptions about atomic models amongst the chemistry students, Int. J. Innov. Educ. Res., 6(02), 156–263.
- Mayer K., (2011), Addressing students’ misconceptions about gases, mass, and composition, J. Chem. Educ., 88(1), 111–115 DOI:10.1021/ed1005085.
- McCarroll M. and Hamann H., (2020), What we know about water: A water literacy review, Water, 12(10) DOI:10.3390/w12102803.
- Mulford D. R. and Robinson W. R., (2002), An inventory for alternate conceptions among first-semester general chemistry students, J. Chem. Educ., 79(6), 739 DOI:10.1021/ed079p739.
- Murphy K., Holme T., Zenisky A., Caruthers H. and Knaus K., (2012), Building the ACS exams anchoring concept content map for undergraduate chemistry, J. Chem. Educ., 89(6), 715–720 DOI:10.1021/ed300049w.
- National Research Council, (2001), Knowing what students know: The science and design of educational assessment, Washington DC: National Academies Press, DOI: 10.17226/10019.
- Nunnally J., (1978), Psychometric Theory, 2nd edn, New York: McGraw-Hill.
- Pentecost T. C. and Barbera J., (2013), Measuring learning gains in chemical education: A comparison of two methods, J. Chem. Educ., 90(7), 839–845 DOI:10.1021/ed400018v.
- Peterson R. F. and Treagust D. F. (1989), Grade-12 students’ misconceptions of covalent bonding and structure, J. Chem. Educ., 66(6), 459 DOI:10.1021/ed066p459.
- Posner G. J., Strike K. A., Hewson P. W. and Gertzog W. A., (1982), Accommodation of a scientific conception: Toward a theory of conceptual change. Sci. Educ., 66(2), 211–227 DOI:10.1002/sce.3730660207.
- Regan Á., Childs P. and Hayes S., (2011), The use of an intervention programme to improve undergraduatestudents’ chemical knowledge and address their misconceptions, Chem. Educ. Res. Pract., 12(2), 219–227.
- Rennie L. and Parker L. H., (1996), Placing physics problems in real-life context: Students’ reactions and performance, Australian Sci. Teach. J., 42, 55–59.
- Rocabado G. A., Kilpatrick N. A., Mooring S. R. and Lewis J. E., (2019), Can we compare attitude scores among diverse populations? An exploration of measurement invariance testing to support valid comparisons between black female students and their peers in an organic chemistry course, J. Chem. Educ., 96(11), 2371–2382 DOI:10.1021/acs.jchemed.9b00516.
- Sadler P. M., Sonnert G., Coyle H. P., Cook-Smith N. and Miller J. L., (2013), The influence of teachers’ knowledge on student learning in middle school physical science classrooms, Am. Educ. Res. J., 50(5), 1020–1049 DOI:10.3102/0002831213477680.
- Shtulman A. and Lombrozo T., (2016), Bundles of contradiction: A coexistence view of conceptual change, Barner D. and Baron A. S. (ed.), Core Knowledge and Conceptual Change, Oxford, UK: Oxford University Press.
- Sick J., (2010), Unidimensionality equal item discrimination and error due to guessing, JALT Test. Eval. SIG Newsl., 14(2), 23–29.
- Singer S. R., Nielsen N. R. and Schweingruber H. A., (2012), Discipline-based education research, National Academies Press.
- Smith C. L., Wiser M., Anderson C. W. and Krajcik J., (2006), Focus Article: Implications of research on children's learning for standards and assessment: A proposed learning progression for matter and the atomic-molecular theory, Meas.: Interdiscip. Res. Perspect., 4(1–2), 1–98 DOI:10.1080/15366367.2006.9678570.
- Smith M., Wood W. and Knight J. K., (2008), The genetics concept assessment: A new concept inventory for gauging student understanding of genetics, CBE Life Sci. Educ., 7(1), 422–430 DOI:10.1187/cbe.08.
- Sreenivasulu B. and Subramaniam R., (2013), University students’ understanding of chemical thermodynamics, Int. J. Sci. Educ., 35(4), 601–635 DOI:10.1080/09500693.2012.683460.
- Stains M. and Talanquer V., (2007), A2: Element or Compound? J. Chem. Educ., 84(5), 880.
- Stewart J., Miller M., Audo C. and Stewart G., (2012), Using cluster analysis to identify patterns in students’ responses to contextually different conceptual problems, Phys. Rev. Spec. Top.: Phys. Educ. Res., 8(2), 20112 DOI:10.1103/PhysRevSTPER.8.020112.
- Taber K. S., (2001), Building the structural concepts of chemistry: Some considerations from educational research, Chem. Educ. Res. Pract., 2(2), 123–158 10.1039/B1RP90014E.
- Talanquer V., (2007), Explanations and teleology in chemistry education, Int. J. Sci. Educ., 29(7), 853–870.
- Taskin V., Bernholt S. and Parchmann I., (2015), An inventory for measuring student teachers’ knowledge of chemical representations: Design, validation, and psychometric analysis, Chem. Educ. Res. Pract., 16(3), 460–477 10.1039/C4RP00214H.
- The National Academies Press, (2012), Discipline-Based Education Research: Understanding and Improving Learning in Undergraduate Science and Engineering, retrieved from http://www.nap.edu/openbook.php?record_id=13362.
- Trate J. M., Fisher V., Blecking A., Geissinger P. and Murphy K. L., (2019), Response process validity studies of the scale literacy skills test, J. Chem. Educ., 96(7), 1351–1358 DOI:10.1021/acs.jchemed.8b00990.
- Treagust D. F., (1988), Development and use of diagnostic tests to evaluate students’ misconceptions in science, Int. J. Sci. Educ., 10(2), 156–169.
- Villafañe S. M., Loertscher J., Minderhout V. and Lewis J. E., (2011), Uncovering students’ incorrect ideas about foundational concepts for biochemistry, Chem. Educ. Res. Pract., 12(2), 210–218.
- Wallace C. S., Chambers T. G. and Prather E. E., (2017), An item response theory evaluation of the Light and Spectroscopy Concept Inventory national data set, Phys. Rev. Phys. Educ. Res., 14(1), 10149 DOI:10.1103/PhysRevPhysEducRes.14.010149.
- Wilson M., (2005), Constructing Measures: An Item Response Modeling Approach, New York: Psychology Press DOI:10.4324/9781410611697.
- Wren D. A. and Barbera J., (2013a), Development and evaluation of a thermochemistry concept inventory for college-level general chemistry, 3634753, 274.
- Wren D. and Barbera J., (2013b), Gathering evidence for validity during the design, development, and qualitative evaluation of thermochemistry concept inventory items, J. Chem. Educ., 90(12), 1590–1601.
- Wren D. and Barbera J., (2014), Psychometric analysis of the thermochemistry concept inventory, Chem. Educ. Res. Pract. 10.1039/C3RP00170A.
- Zohar A. R. and Levy S. T., (2019), Students’ reasoning about chemical bonding: The lacuna of repulsion. J. Res. Sci. Teach., 56(7), 881–904 DOI:10.1002/tea.21532.
Footnote |
| † Electronic supplementary information (ESI) available. See DOI: 10.1039/d1rp00270h |
| This journal is © The Royal Society of Chemistry 2022 |

