 Open Access Article
Influence of pH on the kinetics of hydrolysis reactions: the case of epichlorohydrin and glycidol†
Flavio
Tollini
 a,
Alice
Occhetta
a,
Francesca
Broglia
a,
Alice
Occhetta
a,
Francesca
Broglia
 a,
Vincenzo
Calemma
b,
Stefano
Carminati
b,
Giuseppe
Storti
 a,
Mattia
Sponchioni
 *a and
Davide
Moscatelli
 a
a
aDepartment of Chemistry, Materials, and Chemical Engineering “Giulio Natta”, Politecnico di Milano, Piazza Leonardo da Vinci 32, 20133 Milan, Italy. E-mail: mattia.sponchioni@polimi.it
bENI SPA, Via Felice Maritano 26 – 20097 San Donato Milanese, Italy
First published on 4th July 2022
Abstract
Glycidol (GL) and epichlorohydrin (EPI) are two widely used molecules in chemical, pharmaceutical and food industry applications. However, their use in aqueous environments causes the formation of compounds, like monochloropropanediol (MCPD) and dichloropropanol (DCP), reported as dangerous for human health and therefore regulated by severe law restrictions. To identify the conditions leading to such species and design the corresponding processes in order to prevent their formation, hydrolysis and chlorination of EPI and GL, together with dehydrohalogenation of DCP and MCPD, have been systematically analysed. Different reaction conditions in terms of temperature, pH and chloride ion concentration have been experimentally investigated and the concentration of the involved species was tracked over time by gas chromatography and high-performance liquid chromatography. These experimental data were fitted through a kinetic model, which allowed a general expression of the observed rate constant of each reaction as a function of temperature and pH to be quantified. In particular, the reaction rates are conveniently expressed as combinations of three contributions: alkaline, neutral and acid. The corresponding rate laws explicitly account for the critical role of pH. The developed mechanistic model exhibits good prediction ability and may represent the basis for optimising processes employing EPI and GL.
1. Introduction
Hydrolysis is one of the most important chemical reactions, either as a synthetic route or a typical environmental fate process for several organic compounds. It can be considered as a decomposition reaction involving species like alkyl halides, carboxylic acid esters, organophosphates, carbamates, epoxides, and nitriles.1 Currently, hydrolysis reactions are involved in many industrial processes like degradation of paper2,3 and plastic waste,4,5 synthesis of fuels and chemicals from biomasses,6,7 and carbohydrate chemistry.8,9 In some cases, such processes may lead to by-products that are harmful for human health.10,11 This is the case for epichlorohydrin (EPI) and glycidol (GL), two critical molecules for the chemical, pharmaceutical12 and food industries.13–15EPI is mainly used to manufacture epoxy resins; furthermore, it is also used to manufacture glycerol, glycidyl ethers,16 elastomers,17 cross-linked food starch,18 pharmaceutical products,19 lubricants, adhesives, resins, and paints, and as a stabiliser in chlorine-containing substances such as pesticide formulations.20,21 Given this wide range of industrial applications, EPI reached a world annual production of around 2 Mt in 2018.22 Nonetheless, EPI has been listed among the relevant human health-threatening compounds to be monitored as a carcinogenic molecule. According to the European Council Directive 98/83/EC on drinking water quality, its acceptable limit is 0.1 μg L−1.23 Conventionally, EPI is produced by high-temperature chlorination of propylene to allyl chloride, followed by chlorination in water with hypochlorous acid. Recently, as glycerine is increasingly supplied as a by-product of biodiesel manufacturing, a significant research effort has been devoted to developing a new chlorination process from glycerol to EPI. Such a two-step process, which utilises glycerol as a feedstock, was first developed by Solvay under the name of Epicerol® technology.24 The first step is the immediate catalysed hydrochlorination between glycerol and hydrochloric acid to produce dichloropropanol (DCP). Then DCP is dehydrochlorinated with an alkaline solution, generating EPI.25 It turns out that DCP is an essential intermediate in the process for synthesising EPI. However, as reported on its material safety data sheet, this compound is highly toxic, harmful if inhaled, and reported as carcinogenic.25 Moreover, some monochlorohydrin could remain in the environment if the conversion to dichlorohydrins is not complete. This compound is a known carcinogen and a provisional maximum tolerable daily intake of 2 μg kg−1 body weight has been established.26 The study of monochlorohydrin reactivity is also essential because it can be formed as a by-product in the manufacture of hydrolysed vegetable proteins (HVPs) and soy sauces made by acid hydrolysis.26 3-Monochloropropanediol (3-MCPD) has also been found in other foods and food ingredients, notably in a range of cereal products that have been subjected to heat treatments such as baking, roasting or toasting.13 The European Community has recently set a regulatory limit of 0.02 mg kg−1 for 3-MCPD in HVPs and soy sauce.26
The same arguments apply to GL, a versatile molecule with high reactivity due to the oxiranic and alcoholic functionalities and, accordingly, an essential monomer in synthesising polymers and rubbers, surface-active agents, varnishes and fabric dyes.27 At the same time, GL and EPI are strictly connected, as one may lead to the formation of the other by chlorination.
Kinetic studies of the hydrolysis reactions of these species have been previously reported. Carrà et al. determined the kinetic parameters for the formation of 1,3-DCP and 2,3-DCP in an aqueous solution containing an excess of Ca(OH)2 and developed a kinetic model of the overall system.28 Ma et al. studied the kinetics of the dehydrochlorination of DCP (mainly 1,3-DCP) and the side reaction of EPI hydrolysis.11 Gaca et al. studied the mechanism of the EPI hydrolysis under acidic conditions.29 However, a limited range of operating conditions was explored in all previous studies. More specifically, most of them considered highly alkaline conditions that, when coupled with a low amount of EPI, led to negligible consumption of OH− during the dehydrohalogenation reaction. For this reason, most of the proposed kinetic schemes neglect the dependence of the reaction rate on the solution pH, with a negative impact on the accuracy of the model predictions under different operating conditions.
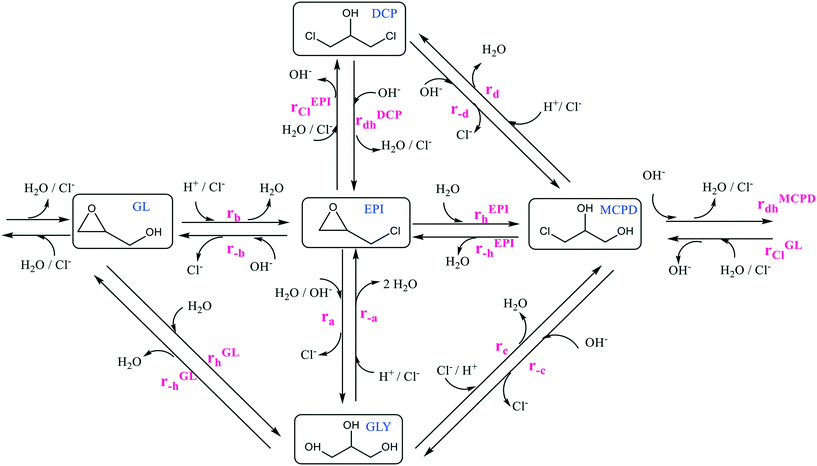
With the aim to fill such a gap and develop more comprehensive kinetic laws, in the current study a kinetic model was developed to describe the hydrolysis reactions of EPI and GL in aqueous and chlorinated environments under different conditions. Namely, multiple reactions were performed in a jacketed batch reactor at different temperatures, pH and concentration of chlorine ions. Under these conditions, by-products such as glycerol (GLY), 1,3-dichloro-2-propanol (1,3-DCP), 2,3-dichloro-1-propanol (2,3-DCP), and 3-chloro-1,2-propanediol (3-MCPD) are produced, according to the general reaction scheme reported in Fig. 1.
The concentration of each species over time was tracked by gas chromatography (GC) and high-performance liquid chromatography (HPLC). These experimental data allowed the identification of the main steps in the general kinetic scheme and the evaluation of the corresponding rate constants. The developed mechanistic model was demonstrated to accurately predict the progression of the different reactions and the time evolution of the concentration of the different species. In particular, a general expression for the observed rate constants as a function of temperature and pH could be determined, confirming the pivotal role of the latter parameter in these reactions. The proposed kinetic model represents an effective tool for optimising processes employing EPI and GL, especially to minimise the formation of toxic compounds and comply with the more and more stringent regulations.
2. Materials and methods
Materials
3-Chloro-1,2-propanediol (MCPD, Aldrich, >98%), 1,3-dichloro-2-propanol (DCP, Aldrich, >98%), 3-chloro-1-propanol (Aldrich, >98%), glycerol (GLY, Carlo Erba Reagents, >99.5%), glycidol (GL, Aldrich, >96%), epichlorohydrin (EPI, Aldrich, >99%), sodium hydroxide (NaOH, Sigma-Aldrich, ≥98%), hydrochloric acid (HCl, Sigma-Aldrich, ≥37%), sodium chloride (NaCl, Emsure), and tert-butyl methyl ether (MTBE, Sigma-Aldrich, ≥99.8%) were of analytical grade purity and used as received unless specifically noted.Reactor set-up
The hydrolysis reactions were carried out in a batch reactor (300 ml) with an external jacket and water as a thermal utility medium. The mixture was stirred using a magnetic stirrer at 200 rpm for all the experiments. The reactor was equipped with a thermocouple, sampling port, pH meter and ion-selective electrode (ISE) (Fig. 2).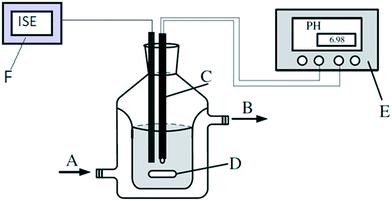 | ||
| Fig. 2 Reactor set-up. A) Thermostated water inlet; B) thermostated water outlet; C) pH electrode with a thermocouple; D) magnetic stirrer; E) pH meter; F) ion-selective electrode. | ||
Measured values of temperature and pH were recorded using a previously calibrated digital meter from Thermo Scientific Orion equipped with a thermocouple. Different reaction temperatures were explored, namely 20, 40, 50, and 60 °C. At each temperature, the reactions were carried out under alkaline, acidic, and neutral conditions to determine the relevant kinetic constants under different pH conditions. A calibrated ion-selective electrode (ISE) from Thermo Scientific allowed tracking the chlorine ion concentration over time.
The reactor was initially fed with distilled water (300 mL), followed by a pre-set amount of sodium hydroxide or hydrochloric acid to adjust the pH to the desired initial value. Then, the temperature was increased to the desired value and a given amount of reactant was injected to obtain a concentration of 10![[thin space (1/6-em)]](https://www.rsc.org/images/entities/char_2009.gif) 000 ppm. The mixture inside the reactor was intensively mixed by magnetic stirring. Samples were taken at defined times and chromatographic techniques measured the concentration of the species over time.
000 ppm. The mixture inside the reactor was intensively mixed by magnetic stirring. Samples were taken at defined times and chromatographic techniques measured the concentration of the species over time.
Characterisation techniques
Two chromatographic methods have been used to measure the concentration of residual reactant and reaction products in the system, namely HPLC and GC.In the first case, an Agilent 1100 HPLC with a diode array detector (DAD) and refractive index detector (dRI) was used, equipped with an Agilent Eclipse Plus C18 column (150 × 4.6 mm, 3 μm pore size). The mobile phase was Millipore water at a flow rate of 0.4 mL min−1 for 12 min to ensure accurate analysis of GLY, GL, MCPD, EPI and DCP. The effective concentration of the compounds in the sample was determined by integrating the resulting peaks after external calibration based on the dRI measurement (see Fig. S1, S2 and Table S1†).
A Perkin Elmer Clarus500 GC equipped with a split–splitless injector and FID detector was used to carry out the GC analysis. The liner temperature was 250 °C, helium served as carrier gas with a 1.2 mL min−1 flow rate, and an HP-INNOWAX column (30 m × 0.25 mm i.d., 0.25 μm crosslinked polyethylene glycol) from Supelco was used. The temperature program was: 50 °C for 2 min, increased at 25 °C min−1 to 150 °C, 150 °C for 9 min, increased at 10 °C min−1 to 200 °C, increased at 10 °C min−1 to 250 °C and kept for 1 min. The detector temperature was set to 300 °C. A PC was connected to the GC equipped with TotalChrome software (Perkin Elmer) for data acquisition and processing.
Each aqueous sample from the reactor was collected in a small vial and a known concentration of internal standard (3-chloro-1-propanol) was added. Then, an equal volume of MTBE was added to extract the desired molecules from the aqueous phase to the organic phase. The amount of MTBE to be added was determined from preliminary experiments by progressively increasing its volume until the mass of the extracted analyte reached a plateau. Once the optimal volume of MTBE is defined, repeated extractions were performed until no residual analyte was detected. The integrated areas obtained from the chromatograms were converted to mole percentages of each component present in the sample using the calibration curves previously evaluated for all the components. The analytical method was optimised by injecting standard calibration solutions extracted in the same way with respect to the sample to account for the recovery factor in the calibration curve (see Fig. S3 and Table S2† for details).
Kinetic model
Assuming an isothermal, well-stirred batch reactor with a constant volume, the material balances for each component involved in the kinetic scheme in Fig. 3 are the following (eqn (1.a)):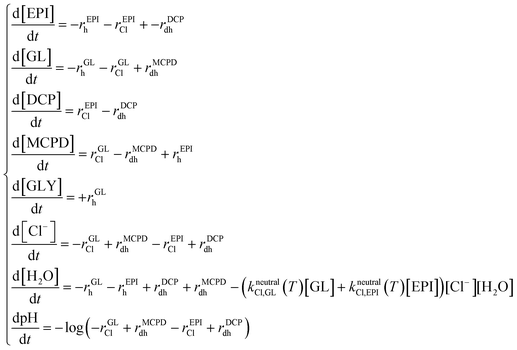 | (1.a) |
| rjh = (kalkalineh,j(T)10−Kw(T)+pH + kneutralh,j(T) + kacidh,j(T)10−pH)[j][H2O] | (1.b) |
 | (1.c) |
| rkdh = (kalkalinedh,k(T)10−Kw(T)+pH)[k] | (1.d) |
 , where A is the pre-exponential factor, Ea is the activation energy, R is the ideal gas constant and T is the absolute temperature.
The values of the kinetic constants have been estimated through non-linear regression. Namely, using the genetic algorithm (function ga) coupled with the fminsearch algorithm in Matlab®, the residual sum of squares (RSS) was minimised:
 | (2) |
 | (3) |
3. Results and discussion
3.1 General and reduced kinetic schemes
Glycidol and epichlorohydrin are two molecules that hydrolyse in water giving different products. The general reaction scheme, including all the different reactions that may take place, is proposed in Fig. 1. In order to tackle this complex kinetic scheme and reliably regress the different rate constants, the following assumptions have been introduced:• In the proposed kinetic scheme, the trimolecular reaction from EPI to glycerol was considered as a combination of rEPIh followed by rMCPDdh and rGLh having MCPD and GL as intermediates. Therefore, reaction ra was neglected.
• The nucleophilic substitution reactions, r−a, rb, rc, and rd, do not occur since Cl− is a better leaving group with respect to OH−. According to the literature, it is well accepted that reactions rb, rc and rd occur only in the presence of a suitable carboxylic acid as a catalyst,30 while reaction r−a is a reaction that cannot occur directly but it proceeds through reaction rc followed by rEPI−h, with MCPD as the intermediate.
• The nucleophilic substitution reactions, r−b, r−c, and r−d, do not occur since, under the tested conditions, the nucleophilic substitution can occur only under strongly alkaline conditions and with a catalyst.31
• In the proposed kinetic scheme, the direct reaction r−b from EPI to GL was considered as a combination of the two semi-reactions rEPIh and rMCPDdh in series with MCPD as the intermediate. Since the formation of MCPD as the intermediate was always observed experimentally, the direct path has been neglected to reduce the kinetic scheme complexity. The direct reaction r−c from MCPD to GLY for the glycerol formation proceeds only through the formation of GL as the intermediate by reaction rMCPDdh followed by rGLh. The same approach was adopted for the direct reaction r−d since the formation of MCPD proceeds through reaction rDCPdh and then rEPIh, having EPI as the intermediate.
• Dehydration reactions (rEPI−h and rGL−h) were neglected since it was experimentally verified that they do not occur. Namely, defined amounts of MCPD and GLY were placed in separate vials with deionised water and left under stirring for 24 hours at 100 °C. The concentrations of both the species, MCPD and GLY, remained constant and equal to the initial values, thus confirming the absence of any reaction. Repeating the experiment under strongly alkaline conditions, the GLY concentration remained constant, while the MCPD was converted to GL throughout reaction rMCPDdh.
With these assumptions, a reduced kinetic scheme is readily worked out, as shown in Fig. 3.
In the current study, all the reactions included in the kinetic scheme in Fig. 3 were studied at different values of pH and temperature, as summarised in Table S3.† Even though the selected kinetic scheme is simpler than the general one, a significant number of reactions is involved, making parameter evaluation quite difficult. To make this evaluation more effective, the kinetic scheme was decomposed into two subsystems: first, the reactions involving GL have been studied and the corresponding kinetic parameters were evaluated. Then, after having estimated the rate constants of reactions rGLh, rGLCl, and rMCPDdh, the reactions involving EPI have been considered, thus completing the kinetic study.
3.2 Reactions involving Glycidol
First, the glycidol hydrolysis was studied under several conditions, while the dehydrohalogenation reaction was examined in a second step since the produced glycidol decomposed to glycerol. As the final step, the chlorination reaction was studied.In an aqueous environment, GLY is formed by GL hydrolysis, rGLh, as shown in Fig. 4.
This reaction is catalysed by acids or alkali. However, it occurs under all conditions, including neutral ones, even if though different reaction mechanisms (Fig. S4†). The corresponding reaction rates under alkaline, acidic and neutral conditions are expressed in eqn (4)–(6):
| rGLh = kalkalineh,GL(T)[OH−][GL][H2O] | (4) |
| rGLh = kneutralh,GL(T)[GL][H2O] | (5) |
| rGLh = kacidh,GL(T)[H+][GL][H2O] | (6) |
| rGLh = (kalkalineh,GL(T)[OH−] + kneutralh,GL(T) + kacidh,GL(T)[H+])[GL][H2O] | (7) |
| rjh = (kalkalineh,j(T)[OH−] + kneutralh,j(T) + kacidh,j(T)[OH−])[j][H2O] | (8) |
| [OH−] = 10−pKw(T)+pH and [H+] = 10−pH | (9) |
| rjh = (kalkalineh,j(T)10−pKw(T)+pH + kneutralh,j(T) + kacidh,j(T)10−pH)[j][H2O] | (10) |
| Kw(T) = 4.5 × 10⁻²¹T4 + 4.5 × 10⁻²⁰T3 + 5 × 10⁻¹⁸T2 + 1.4 × 10⁻¹⁶T + 10−15 | (11) |
| rGLh = (kalkalineh,GL(T)10−pKw(T)+pH + kneutralh,GL(T) + kacidh,GL(T)10−pH)[GL][H2O] | (12) |
| rGLCl = kneutralCl,GL(T)[Cl−][GL][H2O] + kacidCl,GL(T)[H+][Cl−][GL] = (kneutralCl,GL(T)[H2O] + kacidCl,GL(T)10−pH)[Cl−][GL] | (13) |
| rMCPDdh = kalkalinedh,MCPD(T)[OH−][MCPD] = kalkalinedh,MCPD(T)10−pKw(T)+pH[MCPD] | (14) |
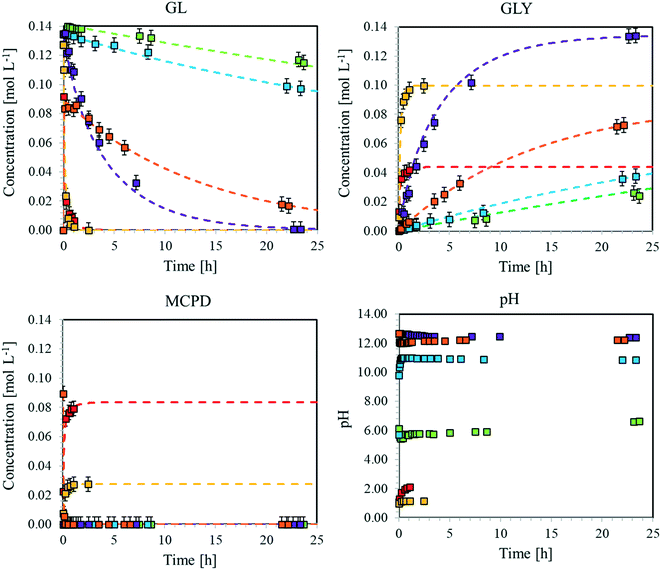 | ||
Fig. 5 Time evolution of the concentrations of GL, GLY and MCDP as well as that of pH during the hydrolysis of GL and dehydrohalogenation of MCPD at T = 40 °C. Dotted curves: model predictions. Symbols: experimental data. ( ): exp. 10, ( ): exp. 10, ( ): exp. 11, ( ): exp. 11, ( ): exp. 12, ( ): exp. 12, ( ): exp. 13, ( ): exp. 13, ( ): exp. 14, ( ): exp. 14, ( ): exp. 15. Experimental conditions as in Table S3.† ): exp. 15. Experimental conditions as in Table S3.† | ||
From these experimental data, the kinetic constants of reactions rMCPDdh, rGLCl, and rGLh have been estimated by non-linear regression as previously described. More specifically, a subset of eqn (1.a) has been used, considering only the material balances of the species involved in the three reactions under examination. The excellent model prediction ability achieved after such regression is verified by the agreement between the calculated curves and experimental results shown in Fig. 5. The same approach has been applied at all temperatures and the estimated parameter values are summarised as Arrhenius plots in Fig. S11.† The estimated values of the activation energy and pre-exponential factor for all the reactions are listed in Table 1.
| Kinetic constant | A | E a [J mol−1 K−1] |
|---|---|---|
| k acidh,GL | 2.76 × 10⁷ [L2 mol−2 s−1] | 6.6 × 10⁴ |
| k neutralh,GL | 2.77 × 10³ [L2 mol−2 s−1] | 6.5 × 10⁴ |
| k alkalineh,GL | 3.42 × 10⁵ [L2 mol−2 s−1] | 6.3 × 10⁴ |
| k acidCl,GL | 1.61 × 10⁸ [L mol−1 s−1] | 5.7 × 10⁴ |
| k neutralCl,GL | 2.68 × 10³ [L2 mol−2 s−1] | 7.0 × 10⁴ |
| k alkalinedh,MCPD | 1.10 × 10¹⁹ [L mol−1 s−1] | 1.2 × 10⁵ |
Focusing on the hydrolysis reaction, it is clear that pH strongly affects the reaction rate. In fact, the rate constant increases from neutral (no catalyst) to alkaline (OH− catalyst), to acidic (H+ catalyst) conditions. Therefore, we can conclude that hydrogen ions are the most effective catalyst for this reaction. Moreover, the reaction rate under neutral conditions, albeit slower, cannot be neglected, especially when the long-time evolution of the concentration of glycidol in an aqueous medium is of interest. About the chlorination reaction, the kinetic constant is higher under acidic conditions than under neutral conditions, although the reaction also proceeds in the absence of hydrogen ions. This behaviour has to be properly accounted for when designing a process based on GL, not to underestimate the formation of MCDP. Finally, dehydrohalogenation turns out to be the most favoured reaction among those studied, especially at high temperature. Its kinetic constant exhibits the strongest temperature dependence, as confirmed by the highest slope of the corresponding Arrhenius plot. On the other hand, the slopes of the other lines are almost parallel, thus suggesting comparable activation energy for all these reactions.
3.3 Reactions involving epichlorohydrin
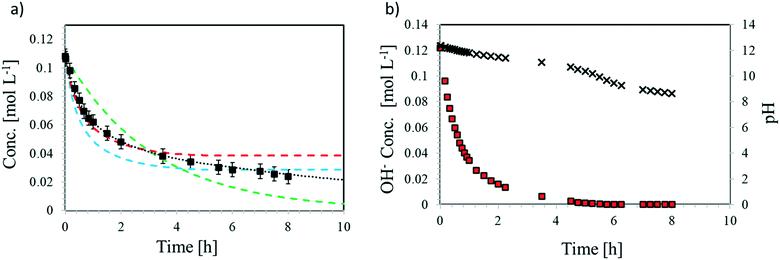
In aqueous media, EPI undergoes the hydrolysis reaction rEPIh (cf.Fig. 3). As shown in Table S4,† most of the previous studies on this reaction were carried out at high pH values. Under such alkaline conditions and with low amounts of EPI, the consumption of OH− during the dehydrohalogenation reaction is negligible and, therefore, some of the cited papers propose kinetic schemes neglecting the dependence of hydrolysis on pH. However, neglecting the consumption of water and OH− ions when working with an initial concentration of EPI of 0.1 M makes the literature model predictions not consistent with the experimental data, as shown in Fig. 6. The concentration of hydroxide ions decreases over time (Fig. 6b) due to the dehydrohalogenation reaction (rMCPDdh), bringing the system to neutral conditions after one day. EPI consumption is very fast at the beginning due to the catalytic effect of hydroxide ions; however, the reaction slowly proceeds even under neutral conditions. The model proposed by Carrà et al. predicts complete consumption of epichlorohydrin, while those by Ma et al. and Lu et al. predict a plateau concentration of EPI when the OH− concentration becomes negligible, thus providing good fitting of the experimental data only at the beginning of the reaction. The rate expression proposed in this work is the only one accounting for the kinetic behaviour under all conditions, acid, neutral, and alkaline: EPI consumption and MCPD formation rates are different under the different conditions, and the general dependence on pH is essential (eqn (15)).In summary, similar to the GL case, the EPI hydrolysis reaction (rEPIh) is catalysed under acidic and alkaline conditions, but it also occurs under neutral conditions following different reaction mechanisms (Fig. S12†). Also, this reaction rate can be expressed as a summation of the three contributions, thus accounting for the dependence on temperature and pH:
| rEPIh = (kalkalineh,EPI(T)[OH−] + kneutralh,EPI(T) + kacidh,EPI(T)[H+])[EPI][H2O] = (kalkalineh,EPI(T)10−pKw(T)+pH + kneutralh,EPI(T) + kacidh,EPI(T)10−pH)[EPI][H2O] | (15) |
| rEPICl = kneutralCl,EPI(T)[EPI][Cl−][H2O] + kacidCl,EPI(T)[H+][Cl−][EPI] = (kneutralCl,EPI(T)[H2O] + kacidCl,EPI(T)10−pH)[Cl−][EPI] | (16) |
| rDCPdh = kalkalinedh,DCP(T)[OH−][DCP] = kalkalinedh,DCP(T)10−pKw(T)+pH[DCP] | (17) |
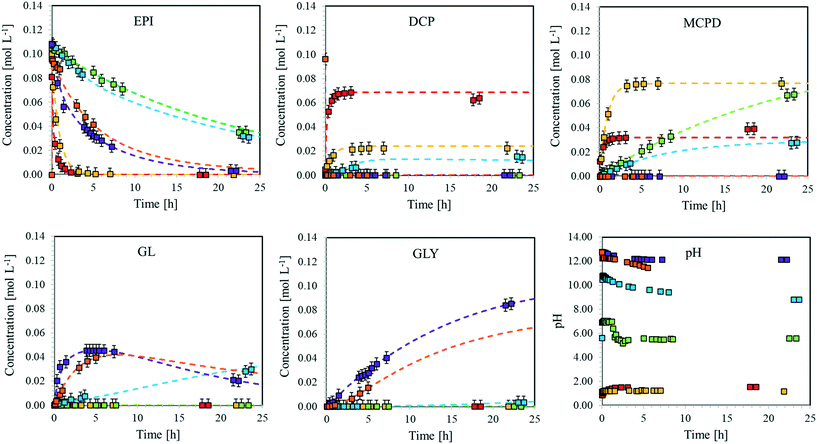 | ||
Fig. 7 Concentration of the different species involved in the hydrolysis of EPI and pH values vs. time for the reaction run at T = 40 °C. Dotted curves: model predictions. Squares: experimental data. ( ): exp. 33, ( ): exp. 33, ( ): exp. 34, ( ): exp. 34, ( ): exp. 35, ( ): exp. 35, ( ): exp. 36, ( ): exp. 36, ( ): exp. 37, ( ): exp. 37, ( ): exp. 38. Experimental conditions as in Table S3.† ): exp. 38. Experimental conditions as in Table S3.† | ||
From these experimental data, the kinetic constants of reactions rDCPdh, rEPICl, and rEPIh have been estimated. The values at different temperatures are shown in the form of Arrhenius plots in Fig. S19† and the corresponding values of activation energy and pre-exponential factor are summarised in Table 2.
| Kinetic constant | A | E a [J mol−1 K−1] |
|---|---|---|
| k acidh,EPI | 2.02 × 10⁸ [L2 mol−2 s−1] | 7.5 × 10⁴ |
| k neutralh,EPI | 2.89 × 101 [L2 mol−2 s−1] | 4.9 × 10⁴ |
| k alkalineh,EPI | 5.24 × 10⁹ [L2 mol−2 s−1] | 8.8 × 10⁴ |
| k acidCl,EPI | 2.05 × 10⁹ [L mol−1 s−1] | 6.7 × 10⁴ |
| k neutralCl,EPI | 4.95 × 101 [L2 mol−2 s−1] | 4.8 × 10⁴ |
| k alkalinedh,DCP | 1.47 × 10¹¹ [L mol−1 s−1] | 6.6 × 10⁴ |
As for glycidol, this reaction is strongly affected by pH. The most favoured reaction turns out to be dehydrohalogenation, and it is almost instantaneous in the presence of OH− ions. The slopes of the Arrhenius lines are almost parallel, thus confirming very similar values of activation energy.
3.4 Influence of pH on the kinetic constants
In the previous subsections, we demonstrated the crucial role of the environment pH in the kinetics of hydrolysis, dehydrohalogenation and chlorination reactions of epichlorohydrin and glycidol. Such an effect can be conveniently lumped into effective rate constants (here defined “observed”), whose general expression is given below for all the reactions considered so far:| kobsh,GL(T, pH) = kalkalineh,GL(T)10−pKw(T)+pH + kneutralh,GL(T) + kacidh,GL(T)10−pH | (18.a) |
 | (18.b) |
| kobsdh,MCPD(T, pH) = kalkalinedh,MCPD(T)10−pKw(T)+pH | (18.c) |
| kobsh,EPI(T, pH) = kalkalineh,EPI(T)10−pKw(T)+pH + kneutralh,EPI(T) + kacidh,EPI(T)10−pH | (18.d) |
 | (18.e) |
| kobsdh,DCP(T, pH) = kalkalinedh,DCP(T)10−pKw(T)+pH | (18.f) |
| rEPIh = kobsh,EPI(T, pH)[EPI][H2O] | (19) |
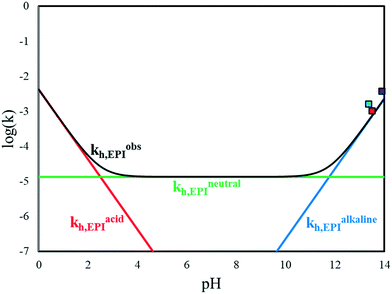 | ||
Fig. 8 EPI hydrolysis kinetic contributions vs. pH at T = 40 °C. (Red) acidic; (blue) alkaline; (green) neutral; (black) overall. Literature values:  Ma et al. Ma et al. Lu et al. Lu et al. Carrà et al. Carrà et al. | ||
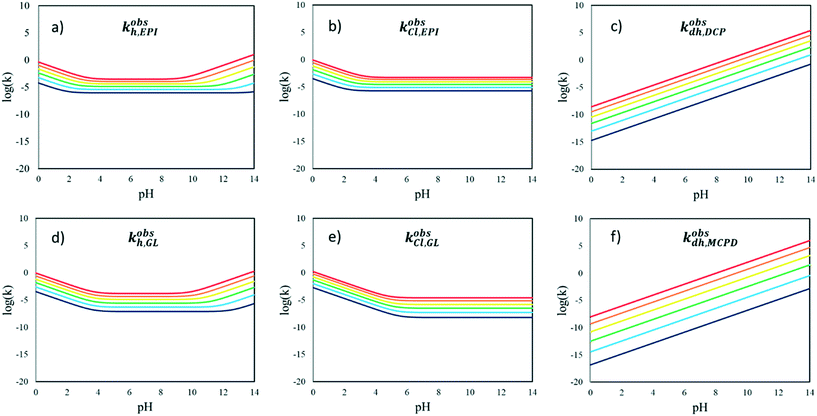
In Fig. 9, the observed kinetic constants of all the reactions considered in the kinetic scheme in Fig. 3 are reported as functions of pH and temperature. These plots highlight which contributions are operative in the different conditions at first glance.
At high pH, the fastest reaction is dehydrohalogenation, which, on the other hand, becomes negligible under neutral and acidic conditions.
Focusing on the hydrolysis reactions of EPI and GL, the reaction is more favoured under acidic conditions for both species but more markedly for EPI at low temperature, while the reaction catalysed in an alkaline environment is faster at high temperature. The chlorination reaction is more favoured in the case of EPI rather than GL, even at lower pH.
To properly compare the kinetic constants calculated by Carrà et al. (kEPIh)′′, by Lu et al. (kEPIh)′ and by Ma et al. (kEPIh)′ with those proposed in this work, let us refer to eqn (15) that under strong alkaline conditions can be simplified as:
| rEPIh ≈ kalkalineh,EPI(T)[H2O][OH−][EPI] = (kEPIh)′[OH−][EPI] = (kEPIh)′′[EPI] | (20) |
Finally, a sensitivity analysis was performed on the estimated parameters. Namely, each kinetic parameter is varied by ±10% with steps of 0.2% while keeping all the others unchanged. At each change of the selected kinetic parameter, the SSE is recalculated to evaluate the robustness of the minimisation process as well as to rank the relative impact of the parameter. The results of this analysis are shown in Fig. 10 for a specific temperature value (40 °C; the results at the other temperatures are in Fig. S22 and S23†). On one side, the reliability of the performed minimisation is verified; at the same time, it becomes clear that kacidh, kalkalineh, and kacidCl, have the strongest influence on the system behaviour.
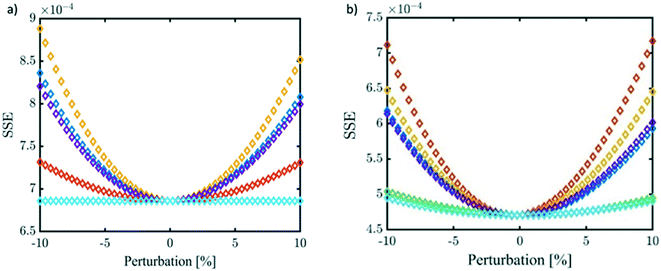 | ||
Fig. 10 Sensitivity analysis at 40 °C. a) GL reactivity and b) EPI reactivity.  kacidh, kacidh,  kneutralh, kneutralh,  kalkalineh, kalkalineh,  kacidCl, kacidCl,  kneutralCl, and kneutralCl, and  kalkalinehd. kalkalinehd. | ||
3.5 Model validation
After having determined the values of the pre-exponential factors and the activation energies for the reactions involved in the kinetic scheme in Fig. 3, the developed model was validated by predicting the evolution of EPI, DCP, MCDP, GL and GLY concentrations during an additional experiment, whose data were not used for the fitting of the kinetic constants. The experiment presented in this section was performed at 60 °C with an EPI initial concentration of 0.11 mol L−1. The test was divided into four different phases:• Phase 1 (0–230 min). The reaction starts at neutral pH. Under this condition, according to the kinetic scheme, EPI undergoes hydrolysis (rEPIh) giving MCDP. Neither chlorine nor hydroxide ions were present, thus DCP and GL were not produced. The pH slightly decreased over time due to the reaction between water and carbon dioxide present in the atmosphere, which is particularly favoured at high temperature.
• Phase 2 (230–390 min). After 230 min, NaCl was added to reach a concentration of 1.14 mol L−1, causing an increase in Cl− concentration. Under these conditions, EPI chlorination (rEPICl) becomes favoured and, in fact, an almost immediate reaction took place leading to the formation of DCP, consuming EPI and increasing OH− concentration. A fast consumption of EPI to MCPD was also experienced, as this reaction is catalysed by the same hydroxide ions produced during the chlorination, whose rate rEPICl is proportional to the chlorine ions concentration. Moreover, the pH increase allowed the dehydrohalogenation of MCPD (rMCPDdh) to start, leading to the formation of GL, which in turn could hydrolyse (rGLh) giving GLY. Therefore, MCPD reached an equilibrium concentration, depending on the rate at which rEPIh and rMCPDdh occurred. Also, GL concentration reached an equilibrium value dependent on the rMCPDdh and rGLh rates. Finally, also DCP reached equilibrium conditions, since it is produced by rEPICl and, in the presence of OH− ions, it is depleted by rDCPdh. The OH− concentration slightly decreased over time since hydroxide ions were produced by the EPI chlorination reaction but also consumed during MCPD and DCP dehydrohalogenation.
• Phase 3 (390–430 min). After 390 min, a small amount of NaOH (0.2 g in 100 mL of reacting solution) was added as a limiting reactant with respect to the amount of MCPD and DCP. This caused an initial increase in pH, which suddenly decreased due to the fast consumption of OH− by rMCPDdh and rDCPdh, resulting in the almost complete consumption of MCPD and DCP increasing the concentration of EPI and GL.
• Phase 4 (430–500 min). A further addition of NaOH (0.2 g in 100 mL of reacting solution) was performed in order to re-establish strong alkaline conditions. The catalysed hydrolysis of EPI and GL took place, forming GLY as the final product.
The model predictions for this complex process, together with the experimental data, are presented in Fig. 11. It is possible to observe how the model can reliably predict the experimental data under all the conditions reached by the pH and at the different concentrations of chlorine ions. The good predictivity of the model is also confirmed by the low values of the residual sum of squares (RSS) and sum of square errors (SSE) for EPI, MCPD, DCP, GL, and GLY concentrations, as shown in Table 3. This confirms the possibility of exploiting this model for reliably predicting the formation and evolution of hazardous species in a reactor, thus allowing the optimization of the current industrial processes in the direction of avoiding the accumulation of such species.
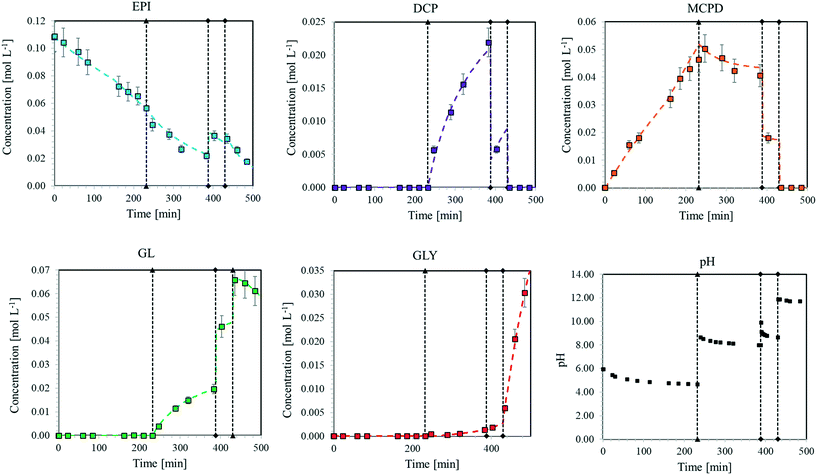 | ||
| Fig. 11 Concentration of the different species involved in the validation test. Dotted curves: model predictions. Squares: experimental data. | ||
| EPI | MCPD | DCP | GL | GLY | |
|---|---|---|---|---|---|
| RSS [−] | 8.37 × 10² | 4.88 × 10² | 8.19 × 10³ | 3.33 × 10³ | 4.87 × 10³ |
| SSE [mol2 L−2] | 1.08 × 10⁴ | 6.65 × 10⁵ | 1.52 × 10⁶ | 1.71 × 10⁷ | 9.05 × 10⁷ |
Conclusion
The hydrolysis and chlorination reaction of EPI and GL and the dehydrohalogenation of the produced products have been investigated at temperatures from 20 °C to 60 °C and pH values ranging from 1 to 13. Based on a simplified but comprehensive kinetic scheme, a temperature and pH-dependent kinetic model has been developed to describe the observed kinetic constants and the rate parameters have been determined by comparing the experimental data with model predictions. In particular, it has been proved that:• The hydrolysis kinetic constant of EPI (kEPIh) and of GL (kGLh) is the sum of three contributions: the acid-catalysed (kacidh), the base-catalysed (kalkalineh) and the non-catalysed (kneutralh);
• The chlorination kinetic constant of EPI (kEPICl) and GL (kGLCl) is the sum of two contributions: the acid-catalysed (kacidCl) and the non-catalysed (kneutralCl);
• The dehydrohalogenation of DCP (kDCPdh) and MCPD (kMCPDdh) occurs under alkaline conditions only and the relative kinetic constant has therefore just one contribution (kalkalinedh).
The proposed kinetic model is able to predict the evolution of a complex system containing one or more species such as EPI, GL, DCP, MCPD, and GLY under different pH conditions, various temperatures, and at different concentrations of chloride ions. The developed model is quite general and represents an effective tool to design process conditions suitable to keep the accumulation of dangerous species under control inside a reactor.
Symbols
| E a | Activation energy |
| K w | Autoionization constant of water |
| c exp i | Experimental concentrations |
| k acid | Kinetic constant under acid conditions |
| k alkaline | Kinetic constant under alkaline conditions |
| k neutral | Kinetic constant under neutral conditions |
| c mod i | Model predicted concentration |
| k obs | Observed kinetic constant |
| A | Pre-exponential factor |
| r Cl | Reaction rates of chlorination |
| r dh | Reaction rates of dehydrohalogenation |
| r h | Reaction rates of hydrolysis |
Abbreviations and acronyms
| DCP | Dichloropropanol |
| DAD | Diode array detector |
| EPI | Epichlorohydrin |
| GC | Gas chromatography |
| ga | Genetic algorithm |
| GL | Glycidol |
| HPLC | High-performance liquid chromatography |
| HCl | Hydrochloric acid |
| ISE | Ion-selective electrode |
| MCPD | Monochloropropanediol |
| dRI | Refractive index detector |
| RSS | Residual sum of squares |
| NaCl | Sodium chloride |
| NaOH | Sodium hydroxide |
| SSE | Sum of square errors |
| MTBE | tert-Butyl methyl ether |
Author contributions
Conceptualisation: F. T.; data curation: F. T., A. O.; investigation: F. T., A. O.; data analysis: F. T., A. O., F. B.; supervision: G. S., D. M., M. S.; funding acquisition: D. M., V. C., A. C.; original draft: F. T., A. O.; writing – review and editing: G. S., M. S. All authors have read and given approval to the final version of the manuscript.Conflicts of interest
The authors have no conflicts of interest to declare.Acknowledgements
The authors express their gratitude to ENI S.p.A for the financial support.References
- J. G. Speight, Reaction Mechanisms in Environmental Engineering: Analysis and Prediction, Elsevier, 2018 Search PubMed.
- P. Bajpai, Pulping Fundamentals, Biermann's Handbook of Pulp and Paper, 2018, pp. 295–351 Search PubMed.
- P. Bajpai, Biermann's Handbook of Pulp and Paper: Volume 1: Raw Material and Pulp Making, Elsevier, 2018 Search PubMed.
- D. Damayanti and H. S. Wu, Strategic Possibility Routes of Recycled PET, Polymers, 2021, 13(9), 1–37, DOI:10.3390/polym13091475.
- G. P. Karayannidis and D. S. Achilias, Chemical recycling of poly(ethylene terephthalate), Macromol. Mater. Eng., 2007, 292(2), 128–146 CrossRef CAS.
- P. Basu, Biomass gasification, pyrolysis and torrefaction: practical design and theory, Academic press, 2018 Search PubMed.
- A. Pandey, D. J. Lee, J. S. Chang, Y. Chisti and C. R. Soccol, Biomass, biofuels, biochemicals: biofuels from algae, Elsevier, 2018 Search PubMed.
- C. Jubsilp, T. Takeichi and S. Rimdusit, Polymerization Kinetics, in Handbook of Benzoxazine Resins, ed. H. Ishida and T. Agag, Elsevier, Amsterdam, 2011, ch. 7 Search PubMed.
- P. Bajpai, Pulping Fundamentals, Biermann's Handbook of Pulp and Paper, 2018, p. 295–351 Search PubMed.
- T. Obokata and A. Isogai, Deterioration of polyamideamine-epichlorohydrin (PAE) in aqueous solutions during storage: Structural changes of PAE, J. Polym. Environ., 2005, 13(1), 1–6 CrossRef CAS.
- L. Ma, J. W. Zhu, X. Q. Yuan and Q. Yue, Synthesis of epichlorohydrin from dichloropropanols: Kinetic aspects of the process, Chem. Eng. Res. Des., 2007, 85(12 A), 1580–1585 CAS.
- S. J. Vali, R. B. Ganduri and S. S. Sait, Estimation of epichlorohydrin content in pharmaceutical drug substances by capillary gas chromatography with flame ionisation detection, J. Chem. Pharm. Res., 2011, 3(6), 392–399 CAS.
- C. G. Hamlet, S. M. Jayaratne and W. Matthews, 3-Monochloropropane-1, 2-diol (3-MCPD) in food ingredients from UK food producers and ingredient suppliers, Food Addit. Contam., 2002, 19(1), 15–21 CrossRef CAS PubMed.
- T. Buhrke, R. Weißhaar and A. Lampen, Absorption and metabolism of the food contaminant 3-chloro-1, 2-propanediol (3-MCPD) and its fatty acid esters by human intestinal Caco-2 cells, Arch. Toxicol., 2011, 85(10), 1201–1208 CrossRef CAS PubMed.
- I. Baer, B. De La Calle and P. Taylor, 3-MCPD in food other than soy sauce or hydrolysed vegetable protein (HVP), Anal. Bioanal. Chem., 2010, 396(1), 443–456 CrossRef CAS.
- M. Deng, F. Guo, D. Liao, Z. Hou and Y. Li, Aluminium-catalyzed terpolymerization of furfuryl glycidyl ether with epichlorohydrin and ethylene oxide: synthesis of thermoreversible polyepichlorohydrin elastomers with furan/maleimide covalent crosslinks, Polym. Chem., 2018, 9(1), 98–107 RSC.
- E. J. Vandenberg, Discovery and Development of Epichlorohydrin Elastomers, J. Elastomers Plast., 1982, 14(4), 243–256 CrossRef CAS.
- O. S. Kittipongpatana and N. Kittipongpatana, Physicochemical, in vitro digestibility and functional properties of carboxymethyl rice starch cross-linked with epichlorohydrin, Food Chem., 2013, 141(2), 1438–1444 CrossRef CAS PubMed.
- S. D. Metkar, M. S. Bhatia and U. V. Desai, Synthesis and biological evaluation of novel azetidine derivatives as dopamine antagonist, Med. Chem. Res., 2013, 22(12), 5982–5989 CrossRef.
- P. Wexler, Encyclopedia of Toxicology, Elsevier, 2005, pp. 1–4 Search PubMed.
- B. Hirakawa, Epichlorohydrin, Encyclopedia of Toxicology, 3rd edn, 2014, vol. 2, pp. 431–432 Search PubMed.
- G. M. Lari, G. Pastore, M. Haus, Y. Ding, S. Papadokonstantakis, C. Mondelli and J. Pérez-Ramirez, Environmental and economical perspectives of a glycerol biorefinery, Energy Environ. Sci., 2018, 11(5), 1012–1029 RSC.
- J. Gaca and G. Wejnerowska, Determination of epichlorohydrin in water and sewage samples, Talanta, 2006, 70(5), 1044–1050 CrossRef CAS PubMed.
- S. Dmitriev Georgy and N. Leonid Zanaveskin, Synthesis of epichlorohydrin from glycerol. Hydrochlorination of glycerol, Chem. Eng. Trans., 2011, 24, 43–48 Search PubMed.
- K. R. Krijgsheld and A. van der Gen, Assessment of the Impact of the Emission of Certain Organochlorine Compounds, Chemosphere, 1986, 15(7), 861–880 CrossRef CAS.
- C. G. Hamlet and P. A. Sadd, Kinetics of 3-chloropropane-1,2-diol (3-MCPD) degradation in high temperature model systems, Eur. Food Res. Technol., 2002, 215(1), 46–50 CrossRef CAS.
- D. Cespi, R. Cucciniello, M. Ricciardi, C. Capacchione, I. Vassura and F. Passarini, et al., A simplified early stage assessment of process intensification: Glycidol as a value-added product from epichlorohydrin industry wastes, Green Chem., 2016, 18(16), 4559–4570 RSC.
- S. Carrà, E. Santacesaria, M. Morbldelll, P. Schwarz and C. Divo, Synthesis of Epichlorohydrin by Elimination of Hydrogen Chloride from Chlorohydrins. 1. Kinetic Aspects of the Process, Ind. Eng. Chem. Process Des. Dev., 1979, 18(3), 424–427 CrossRef.
- J. Gaca, G. Wejnerowska and P. Cysewski, Mechanism of the acidic hydrolysis of epichlorohydrin, J. Phys. Org. Chem., 2011, 24(11), 1045–1050 CrossRef CAS.
- B. M. Bell, J. R. Briggs, R. M. Campbell, S. M. Chambers, P. D. Gaarenstroom and J. G. Hippler, et al., Glycerin as a renewable feedstock for epichlorohydrin production. The GTE process, Clean: Soil, Air, Water, 2008, 36(8), 657–661 CAS.
- I. Devedjiev, V. Ganev, R. Stefanova and G. Borissov, Reaction of salts of hypophosphorous acid with alkylhalides, Phosphorus Sulfur Relat. Elem., 1988, 35(3–4), 261–265, DOI:10.1080/03086648808074329.
- S. I. Shabunya, V. G. Minkina, V. V. Martynenko and V. I. Kalinin, Modeling of pH of concentrated aqueous solutions of sodium metaborate, Russ. Chem. Bull., 2019, 68, 1183–1189 CrossRef CAS.
Footnote |
| † Electronic supplementary information (ESI) available: Calibration curves for the different species detected via HPLC or GC, elugrams of a mixture of the different components at two flow rates recorded via HPLC, proposed reaction mechanisms for hydrolysis, chlorination and dehydrochlorination, product concentrations determined experimentally and based on the model predictions at T = 20, 30, 50 and 60 °C, experimental conditions of all the reactions investigated, parity plots, and sensitivity analysis at T = 20, 30, 40, 50 and 60 °C. See DOI: https://doi.org/10.1039/d2re00191h |
| This journal is © The Royal Society of Chemistry 2022 |

