 Open Access Article
Influence of support texture and reaction conditions on the accumulation and activity in the gas-phase aldol condensation of n-pentanal on porous silica†
Markus
Schörner
a,
Stefanie
Kämmerle
a,
Dorothea
Wisser
b,
Benjamin
Baier
a,
Martin
Hartmann
 b,
Matthias
Thommes
c,
Robert
Franke
de and
Marco
Haumann
 *a
*a
aFriedrich-Alexander-Universität Erlangen-Nürnberg (FAU), Lehrstuhl für Chemische Reaktionstechnik (CRT), Egerlandstr. 3, 91058 Erlangen, Germany. E-mail: marco.haumann@fau.de
bFriedrich-Alexander-Universität Erlangen-Nürnberg (FAU), Erlangen Center for Interface Research and Catalysis (ECRC), Egerlandstr. 3, 91058 Erlangen, Germany
cFriedrich-Alexander-Universität Erlangen-Nürnberg (FAU), Lehrstuhl für Thermische Verfahrenstechnik (TVT), Egerlandstr. 3, 91058 Erlangen, Germany
dEvonik Operations GmbH, Paul-Baumann-Str. 1, D-45772 Marl, Germany
eRuhr-Universität Bochum, Lehrstuhl für Theoretische Chemie, Universitätsstr. 150, D-44780 Bochum, Germany
First published on 23rd August 2022
Abstract
In this work, the continuous gas-phase aldol condensation reaction of n-pentanal was investigated on silica supports. Since high aldol formation can lead to deactivation by pore blocking, the reaction is important to improve continuous gas-phase hydroformylation processes. Aldehyde conversion was monitored depending on the surface acidity. The spent catalysts were analyzed by thermogravimetric analysis (TGA) to evaluate the accumulation of substrate and product inside the pores. The pore size was altered using hydrothermal treatment. The obtained supports were analyzed using N2-sorption, mercury pore intrusion/extrusion, point-of-zero-charge measurements, temperature programmed desorption measurements (CO2 and NH3), and 29Si MAS NMR. A variation of reaction duration, pressure, and temperature was carried out. The influence of the silica texture on activity and accumulation was investigated using different particle size fractions and median pore diameters. In larger pores, the total volume-based accumulation was lower compared to the one in smaller pores. At the same time, the aldol was enriched compared to n-pentanal in the condensed liquid inside the pore network.
Introduction
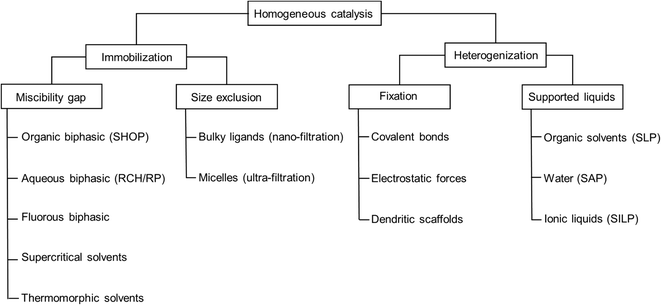
Several concepts and techniques have been reported to bridge the gap between the two major fields of heterogeneous and homogeneous catalysis. While the latter one offers significant benefits with respect to high specific activity and selectivity, it lacks the simplicity of heterogeneous catalysis when it comes to product separation and catalyst recycling. Concepts to immobilize homogeneous catalyst complexes, usually containing precious transition metals, include e.g. biphasic systems that make use of the miscibility gap between two liquids, nano-filtration of catalyst complexes containing highly bulky ligands, ultra-filtration of micellar structures, and supercritical solvents, to name the most common ones.1–4 In all of these concepts, the overall appearance of the catalyst system remains typically homogeneous by being liquid. Alternatively, the homogeneous catalyst can be heterogenized on solid supports, making it truly heterogeneous on the macroscopic level. Examples include supported organometallic complexes which are bound to the surface by covalent bonds (SOMC) or supported liquid phase (SLP) materials, containing thin films of liquid on porous supports.5,6 The heterogenised materials would allow the use of continuous gas-phase processing in classical fixed-bed reactor setups which is the embodiment of choice from an industrial point of view (Fig. 1).In order to achieve long-term stability, liquids with little to no vapor pressure must be employed. We became interested in supported ionic liquid phase (SILP) materials more than fifteen years ago for the continuous hydroformylation of small alkenes like propene and but-1-ene.7,8 In such SILP materials, the transition metal complex is dissolved in ionic liquids (see Fig. 2).9 Since these ionic liquids have an extremely low vapor pressure, they do not evaporate during continuous gas-phase processing. Several examples of SILP gas-phase catalysis have been reported over the past years.10 Most of these studies placed the focus on the proof of concept, demonstrating the performance of the SILP catalyst with respect to activity, selectivity and, to a lesser extent, stability. However, the stability is crucial when it comes to the industrial implementation and the catalyst's time on stream (TOS) should typically exceed 8000 h. Here, only few examples of longer runtimes are known in literature.11,12 We are currently developing a SLP hydroformylation process using monolithic support structures coated with a polymeric separation layer as novel membrane reactor within the course of a H2020 project.13,14
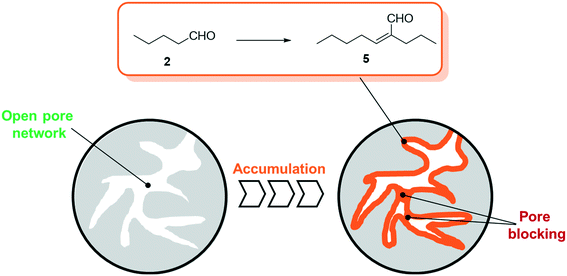 | ||
| Fig. 2 Schematic illustration of pore filling by accumulation due to the aldol condensation reaction of n-pentanal to 2-propyl-2-heptenal on porous support materials. | ||
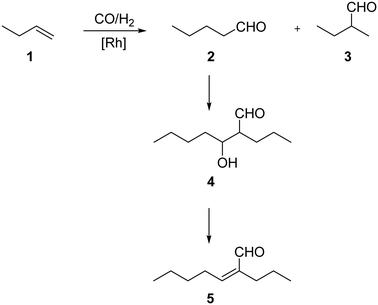
For all SLP catalyzed gas-phase hydroformylation reactions, the major challenge for long term stability is to avoid the consecutive aldol condensation reaction (see Scheme 1). The formed aldehydes are highly reactive and can undergo self-condensation, catalyzed by traces of acid or base, to yield products of twice the molecular weight. These compounds would then be prone to liquefy under reaction conditions inside the pores of the SLP catalyst.
As a result, one can expect growing of the liquid film over time (see Fig. 2) that inevitably leads to blocked transport pores and hence deactivated SLP catalysts.
The self-condensation of aldehydes or ketones has been widely studied in the literature. A variety of studies are conducted in the liquid phase using e.g. sulfuric acid,15 aqueous sodium hydroxide,16 functionalized ionic liquids,17 zeolites18 or oxides19,20 as catalysts. Studies investigating the gas-phase kinetics are mainly using zeolites, aluminosilicates or different metal oxides as active species.21–30 While some of these studies already involve observations of accumulation of coke,21 carbonaceous species28 or condensation products,25 the experimental temperature exceeds the typical temperature for SILP-hydroformylation of 373–393 K by far. Thus, to get a better understanding of the kinetics and the accumulation in the gas-phase aldol condensation of n-pentanal, a more detailed study is required. For SILP and other SLP materials the presence of the support renders the situation, since the surface acidity (or basicity) can catalyze the aldol condensation reaction significantly. In a previous study by Kaftan et al., the hydroformylation of but-1-ene was monitored by means of in situ DRIFTS.31 Here, the formed n-pentanal consecutively reacted to 2-propyl-2-heptenal which then accumulated in the pores (see Fig. 2).
In order to evaluate the influence of silica, the standard support materials for SILP catalysis in general and for hydroformylation in particular, we carried out experiments with different particle sizes as well as different pore diameters. For SILP catalyzed hydroformylation, we observed a pronounced transport limitation at large particle sizes, which only diminished at particle sizes smaller than 500 μm. This pore diffusion limitation could be overcome by the use of a support material with enlarged pores from a hydrothermal treatment.32 In the present work, we use this hydrothermal treatment to adjust the pore diameter of silica, while keeping the particle size and surface chemistry more or less intact.
Experimental part
Preparation of silica support material
Silica 60 (Carl Roth) with a particle fraction of 1–3 mm was used as starting material for all experiments. For the particle size variation, the support was crushed and sieved to achieve fractions of 63–200 μm, 200–450 μm, 450–630 μm, 630–800 μm, and 800–1000 μm. For the pore size variation, two times 4.5 g of the fraction 63–200 μm were weighed into ceramic crucibles. A metal autoclave (see Fig. S1 in ESI†) with a total volume of 300 ml was filled with 16 ml of deionized water. The crucibles were placed on PTFE spacers to avoid wetting of the particles by liquid water. The autoclave was sealed and placed in a pre-heated oven at either 393, 423 or 453 K. The time was taken from the moment the autoclave was placed in the oven and stopped when it was removed (for a detailed temperature profile see Fig. S2 in ESI†). After the silica was cooled down, the particles were dried for 1 h at 333 K. All silica samples used for experiments were calcined for 6 h at 873 K in air (heating ramp 1 K min−1) and stored in a glovebox until usage (OMNI-LAB Glovebox, VAC Vacuum Atmospheres Company).Analysis of support materials
N2-Sorption isotherms at 77 K were measured to obtain information about the pore volume, median pore size d50, and specific surface area (based on multipoint BET model and non-local density functional theory NLDFT). A QUADRASORB SI Surface Area and Pore Size analyzer from Quantachrome Instruments was used for the measurements.Mercury intrusion porosimetry (MIP) was used to determine pore volume, median pore size d50, and specific surface area of macroscopic pore systems. The measurements were carried out on a PASCAL system from Thermo Scientific/Porotec (pressure range 0.1–400 MPa).
Point-of-zero-charge (PZC) analysis and temperature-programmed desorption measurements (CO2 and NH3-TPD) were conducted to reveal the surface acidity/basicity. For the PZC analysis 50 mg of support calcined support (873 K, air) were dispersed in 12 ml pH solution (range from pH 3 to 12, HNO3 used for acidic solution, NaOH for basic solution). The dispersions were shaken at room temperature for 20 h before measuring the pH value. The measured values were plotted against the pH value of the pure solution. The PZC-value was determined at the intersection of the measured values and the bisector. For the TPD measurements, 0.4 g of sample was used. The measurements were carried out on a Thermo Scientific TPDRO 1100 instrument equipped with a TCD. The sample was calcined at 873 K in air and pretreated at 773 K for 30 min in helium before measuring. Ammonia loading was carried out at 393 K for 60 min, while CO2 loading was done at 443 K for 60 min. For the loading pure ammonia and CO2 was used. After that, the gas phase was flushed with helium for 120 min at 313 K. The analysis was carried out with a heating ramp of 10 K min−1 up to 1073 K in helium.
Magic angle spinning (MAS) NMR measurements were conducted on an Agilent 500 WB spectrometer (11.7 T) (resonance frequencies: 499.9 for 1H, 99.3 MHz for 29Si, MAS rate: 15 kHz, rotor: 3.2 mm zirconia, room temperature). The rotors were loaded in the Glovebox in argon atmosphere. The measurements were carried out as described in an earlier work.32
Gas-phase aldol condensation of n-pentanal
Measurements were carried out in a tubular reactor (SS316, 400 mm length, 10 mm inner diameter, 3 μm frit). The detailed set-up for continuous experiments is shown in Fig. S3 and S4 in the ESI.† Prior to sample loading, the reactor was assembled and connected at the bottom outlet. Then helium was flushed from bottom to top to avoid moisture contamination of the silica support materials. 2 g of silica was weighed into a flask in the glovebox under inert atmosphere, transferred to the experimental set-up and poured into the tubular reactor under helium counter-flow. The reactor was tightened at both ends and flushed with helium, now from top to bottom. Next, the valves upfront and downstream of the reactor were closed and the reactor was heated to 373 K (unless otherwise defined in the results section). By-pass measurements with n-pentanal (Sigma Aldrich, 97%, 0.02 g min−1 dosed with a TechLab Minipump) and helium (Linde AG, 99.996%, 50 mlN min−1 dosed with a Bronkhorst MFC) were carried out until a steady feed composition was achieved. Then the flow was directed to the reactor and the by-pass valve was closed. The product gas was analyzed by a DANI Master GC equipped with an FID and an Agilent J&W CP-Volamine GC Column (30 m, 0.32 mm). After the experiment was finished, n-pentanal flow was stopped and the reactor was flushed for 30 min with 50 mlN min−1 helium at reaction temperature and another 60 min with 10 mlN min−1 helium while cooling down. The sample was afterwards immediately analyzed using thermogravimetric analysis.Sample analysis using thermogravimetric analysis
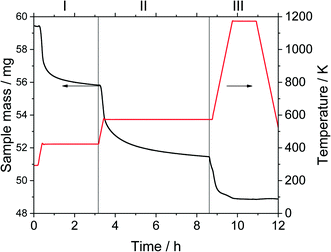
Thermogravimetric analysis was carried out on a Setsys Evolution TGA from Setaram. 50–60 mg of sample was used in each measurement. In the beginning, the sample was tempered to 293 K in inert atmosphere. After an equilibration phase of 10 min, the sample mass was steady and three measurement stages followed. In stage I the sample was heated to 423 K (heating ramp: 10 K min−1) in N2-atmosphere and kept for 3 h to evaporate the substrate n-pentanal from the pores and reach a steady mass again. In stage II the sample was heated to 573 K (heating ramp: 10 K min−1) in N2-atmosphere to evaporate the product 2-propyl-2-heptenal. This temperature was kept for 5 h. In the final stage III the sample was heated up to 1173 K (heating ramp: 10 K min−1) in air and kept for 1 h to burn remaining residues off. This mass loss is attributed to higher hydrocarbons (larger than C10) or stronger bound hydrocarbons that were not specified further. Then, the sample was cooled down to room temperature. The temperatures of step I and II were selected according to the boiling point of the pure components n-pentanal (376 K) and 2-propyl-2-heptenal (482 K) at atmospheric pressure and set 50, respectively 90 K above that. For step III, the maximal possible temperature of the instrument was used. The durations of each step were determined experimentally. Fig. 3 shows an exemplary analysis with the recorded sample mass and temperature.A mass loss Δmi of each stage i (i = I–III) was calculated from the data. Since the density of the herein used hydrocarbons are expected to be in the same range, the density of n-pentanal was used to calculate the mass loss into a volume according to eqn (1).
 | (1) |
 | (2) |
 | (3) |
Calculation of n-pentanal conversion and productivity
The conversion Xn-pentanal of n-pentanal was calculated according to eqn (4) using the inlet and outlet molar flow of the substrate ṅn-pentanal,in and ṅn-pentanal,out (see ESI† for details). | (4) |
 | (5) |
Results and discussion
Support material synthesis and characterization
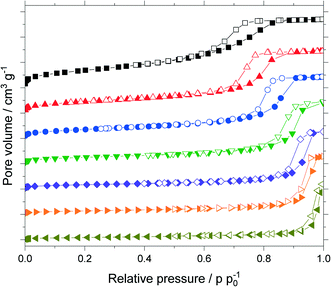
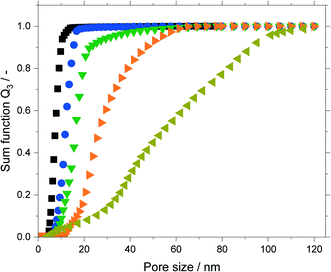
The untreated silica and all support materials obtained by hydrothermal treatment were analyzed using N2-sorption. Fig. 4 shows the adsorption/desorption isotherms (N2, 77 K) of the particle size fraction 63–200 μm. Increasing the treatment time at constant temperature or increasing the temperature at constant treatment time allowed to increase the pore size as indicated by the shift of the pore condensation/evaporation pressures to larger relative pressures p p0−1. This behavior is in good agreement with related literature.32–34 Interestingly with increasing pore size one observes a change of the observed hysteresis from type H2a (particularly for the untreated material) to type H1 indicating that pore restrictions are removed by the hydrothermal treatment.35The isotherms were analyzed using nonlocal density functional theory (NLDFT) that assume cylindrical silica pores. To obtain the pore volume and pore size distribution, the adsorption branch was used by a dedicated NLDFT kernel that takes the delay caused by metastable pore fluid quantitatively into account.36,37 In contrast to the samples treated at 393 K, the one treated at 453 K did not show a plateau close to the saturation pressure p0. This indicated pores in the macroscopic range which cannot be measured with the N2-sorption. Therefore, this sample was analyzed using mercury intrusion porosimetry (see Fig. S6 in ESI†) which revealed pores up to 120 nm. The resulting sum function graphs are summarized in Fig. 5. An increase in pore size with increasing treatment time or temperature was clearly visible. Based on these hydrothermal treatments the median value of the sum function distribution Q3(d50) was used as descriptor for the following catalytic studies. The median pore size d50 is defined as the pore size where the sum function Q3 is equal to 0.5. Here 50% of the pore volume is spread across pore sizes below the value d50 and the other 50% is spread across pore sizes larger than d50.
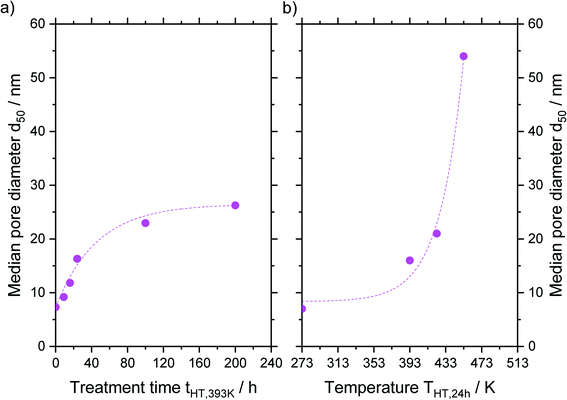
An asymptotic growth of the median diameter d50 from 7 to 26 nm was obtained when hydrothermal treatment at 393 K was carried out for up to 200 h (Fig. 6a). This asymptotic growth was already known for similar treatments32,33 and is in good agreement with the model from Leboda et al.34 This model assumes that the silica skeleton consists of globules with different sizes. Under hydrothermal treatment conditions, the smaller globules fuse to the larger ones according to Ostwald ripening. Depending on the temperature, the skeleton homogenizes at a different maximum size of the globules, since more energy and hence higher temperatures are required to fuse bigger globules. Comparing different treatment temperatures for 24 h, an exponential increase of the median pore size is achieved from 7 to 54 nm for a treatment at 453 K (Fig. 6b) as it would be expected from the temperature dependency of Ostwald ripening.38
An overview of all materials is given in Table 1. No change in pore volume, size or surface area was achieved by sole grinding of the particles (see entries 1–5). The corresponding N2-sorption isotherms are shown in the ESI† (see Fig. S5). When comparing the surface area of samples hydrothermally treated at a constant temperature for different times (entries 1, 6–7), a decrease in surface area was observed with increasing pore size while the pore volume only slightly changed. A similar behavior was found when comparing samples that were hydrothermally treated at different temperatures for the same time (entries 1, 11, 12). Point-of-zero-charge measurements for treated and untreated samples (entries 1–5, 12) gave similar values in the neutral range, as previously published.32
| Entry | d particle | d particle,av | t HT | T HT | d 50 | V pore | A | PZC |
|---|---|---|---|---|---|---|---|---|
| μm | μm | h | K | nm | cm3 g−1 | m2 g−1 | — | |
| d particle = particle range from sieved fraction, dparticle,av = averaged particle diameter of sieved fraction, tHT = time of hydrothermal treatment, THT = temperature of hydrothermal treatment, d50 = median pore diameter, Vpore = pore volume, PZC = point of zero charge. a Analyzed with N2-sorption. b Analyzed with mercury intrusion porosimetry. | ||||||||
| 1 | 63–200 | 132 | — | — | 7a | 0.811a | 503a | 7.1 |
| 2 | 200–450 | 330 | — | — | 7a | 0.817a | 512a | 7.1 |
| 3 | 450–630 | 540 | — | — | 7a | 0.820a | 514a | 7.2 |
| 4 | 630–800 | 720 | — | — | 7a | 0.835a | 519a | 7.1 |
| 5 | 800–1000 | 900 | — | — | 7a | 0.769a | 523a | 7.1 |
| 6 | 63–200 | 132 | 9 | 393 | 9a | 0.739a | 320a | — |
| 7 | 63–200 | 132 | 16 | 393 | 12a | 0.738a | 252a | — |
| 8 | 63–200 | 132 | 24 | 393 | 16a | 0.720a | 180a | — |
| 9 | 63–200 | 132 | 100 | 393 | 23a | 0.712a | 120a | — |
| 10 | 63–200 | 132 | 200 | 393 | 26a | 0.692a | 82.2a | — |
| 11 | 63–200 | 132 | 24 | 423 | 21b | 0.639b | 136.3b | — |
| 12 | 63–200 | 132 | 24 | 453 | 54b | 0.760b | 77.1b | 7.2 |
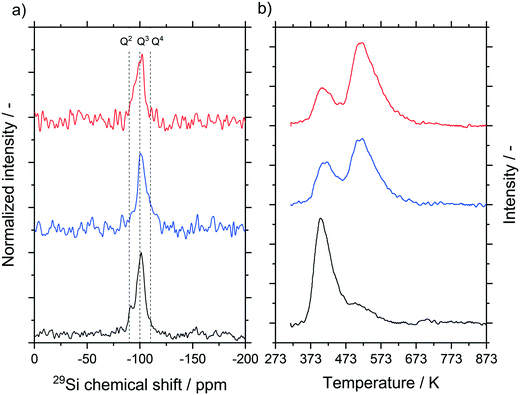
We carried out 29Si cross polarization (CP) MAS NMR studies for the untreated material as well as materials hydrothermally treated at 393 K for 24 and 100 h (see Fig. 7a). Cross polarization probes predominantly the surface of the material, where Q3 groups, indicative of one OH-group per silica, and to a smaller extent also Q2 (two OH groups per silica) and Q4 groups (zero OH groups per silica) were detected. Compared to the untreated sample, a lower concentration of Q2 groups was observed in the samples that underwent hydrothermal treatment. This is to be expected since Ostwald ripening will induce condensation of silanol groups. In all samples, the calcination step after the hydrothermal treatment dominates the final degree of hydroxylation.39,40 This step reduces the signal intensity and hence the possible changes that occur during the hydrothermal treatment, allowing only a qualitative analysis. For a quantitative analysis, NH3-TPD measurements were carried out (Fig. 7b). Again, untreated silica samples as well as samples treated at 393 K for 24 and 100 h were compared. No peaks above 673 K were detected for all samples, thus we assume the absence of strong acid sites on the silica support.41–45 The results in the low temperature range can be explained by weakly bonded ammonia on silanol groups, which is in good agreement also with the 29Si MAS NMR results.42,45–47 The plots were fitted by Gaussian peaks according to Katada et al.42 resulting in two overlapping peaks around 415 K and 525 K.
The calculated amount of acid sites for these two peaks is given in Table 2 for all samples. While the first peak decreased, the second peak increased with increasing treatment time. The total mass-based concentration remained constant. Since the hydrothermal treatment decreased the surface area of the samples, the surface-based concentration of acid sites increased from 0.05 to 0.24 μmol m−2 (see entries 1 to 3). The CO2-TPD measurement only showed a very weak signal at 450 K for all three samples without a visible trend with temperature (see Fig. S19 ESI†). The results obtained by TPD measurements were in agreement with the less sensitive point-of-zero-charge measurement which also indicated an almost neutral surface as both the acid and basic sites were only present at low concentrations.
| Entry | t HT | Weak acidic sitesb | Weak basic sitesc | |||
|---|---|---|---|---|---|---|
| T peak ≤ 415 K | T peak ≤ 525 K | Total | Total | Total | ||
| h | μmol g−1 | μmol g−1 | μmol g−1 | μmol m−2 | μmol g−1 | |
| Sample treated for 0 h represents untreated material. All samples were calcined at 873 K before analysis. a Time of hydrothermal treatment at 393 K. b Analyzed with NH3-TPD. c Analyzed with CO2-TPD. | ||||||
| 1 | 0 | 16 | 8 | 25 | 0.05 | ≤2 |
| 2 | 24 | 7 | 18 | 25 | 0.14 | ≤2 |
| 3 | 100 | 6 | 23 | 29 | 0.24 | ≤1 |
Catalytic testing and pore filling
The self-condensation of n-pentanal 2 proceeds in two steps via the intermediate 3-hydroxyl-2-propylheptanal 4 as shown in Scheme 1. While the first step is thermodynamically not favored, the second step proceeds spontaneously according to theoretical calculations.48 Equilibrium conversions and compositions were calculated using AspenPlus V10. The values of the Gibbs free energy ΔGf and the standard enthalpy ΔHf for 3-hydroxyl-2-propylheptanal 4 and 2-propyl-2-heptenal 5 were estimated using the Benson group contribution model (see ESI† Table S1) and compared to literature data.48 The values for n-pentanal and water were taken from the database APV100.PURE36. The Aspen calculations revealed that the intermediate 3-hydroxyl-2-propylheptanal is thermodynamically not favored in the studied temperature range, thus only changes in n-pentanal and 2-propyl-2-heptenal concentrations were taken into account. This is in good agreement with related literature20,48 and the conducted experiments in this study, as only two peaks, namely n-pentanal and 2-propyl-2-heptenal, were found in the GC-analysis (see ESI† Fig. S20 for a typical GC chromatogram). Increasing the temperature from 353 to 493 K leads to a linear decrease of the equilibrium conversion from 88.9 to 77.8% calculated by minimizing the free Gibbs energy in AspenPlus V10. These values exceeded the measured maximal conversion of this work (22.6% in the temperature variation), so limitation due to the equilibrium conversion can be neglected (Table 3).| T/K | 353 | 373 | 393 | 413 | 433 | 453 | 473 | 493 |
| X eq/% | 88.9 | 87.2 | 85.6 | 83.9 | 82.3 | 80.7 | 79.2 | 77.8 |
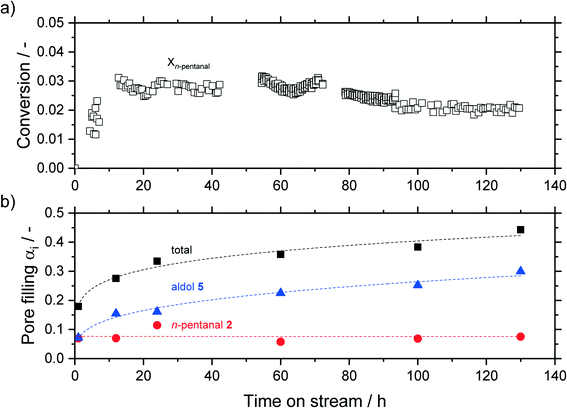
In a first series of experiments, the time on stream (TOS) behavior of the reaction was monitored. Experiments were carried out for 1, 12, 24, 60, 100 and 130 h, during which the effluent gases were monitored with an on-line GC. After the experimental run, the samples were analyzed ex situ via thermogravimetric analysis (TGA). The results are shown in Fig. 8, where the bottom half shows the pore filling degree of hydrocarbons, calculated from eqn (3), and the top half shows the conversion of n-pentanal over time (from GC data). After an induction period the conversion started to decline over time, while the total pore filling degree showed the opposite trend and continuously increased from 0.18 mlhydrocarbons mlpore−1 after 1 h to 0.44 mlhydrocarbons mlpore−1 after 130 h. This increase can be attributed to accumulation of 2-propyl-2-heptenal in the pore system, as shown by TGA of post-run samples. This pore filling increased from 0.07 mlhydrocarbons mlpore−1 after 1 h to 0.30 mlhydrocarbons mlpore−1 after 130 h. The amount of higher hydrocarbons (not shown, 0.6 mlhydrocarbons mlpore−1) and n-pentanal (0.8 mlhydrocarbons mlpore−1) on the other hand remained at a constant level over the observed time. A similar trend was observed by Kaftan et al. using operando DRIFTS (diffuse reflectance IR spectroscopy) measurements in the Rh-catalyzed gas-phase hydroformylation of but-1-ene on silica support.31 The high accumulation after only 1 h TOS can be explained by an adsorber-like behavior right after starting the experiment. A decrease to almost zero of the n-pentanal signal is detected in the online GC for the first 0.25 h. This observation suggests, that all substrate within this time is accumulated in the pores as this behavior was not observed in an empty reactor (see ESI† Fig. S21). A similar stepwise accumulation was observed by Rekoske et al. after exposure of TiO2 with acetaldehyde.49 In contrary to the accumulation, the conversion decreased after an induction period of 5 h continuously from 3 to 2%. A similar deactivation pattern was observed in the gas-phase aldol condensation of acetone on zeolites by Herrmann et al. as a result of the blockage of active sites by reaction compounds.22,23
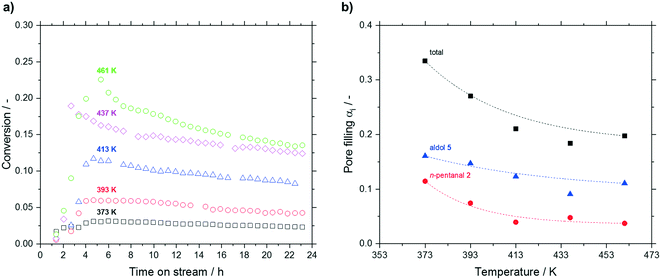
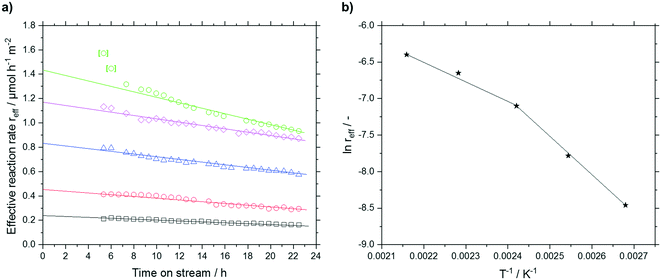
Increasing the reaction temperature from 373 to 461 K led to a significant increase in conversion from 3.1 to 22.6% after 5 h. However, at higher temperatures a more pronounced deactivation was observed (see Fig. 9a). A reverse trend was observed regarding the post-run pore filling degree. Here, a decrease of total pore filling was measured up to 437 K, which leveled off above that temperature (see Fig. 9b). While higher hydrocarbons remained more or less unaffected by temperature at a value around 0.05 mlhydrocarbons mlpore−1 (not shown), accumulation of n-pentanal (decrease from 0.11 mlhydrocarbons mlpore−1 at 373 K to 0.04 mlhydrocarbons mlpore−1 above 417 K) and 2-propyl-2-heptenal (decrease from 0.16 to 0.10 mlhydrocarbons mlpore−1 above 437 K) became less prominent above 437 K. The fraction of the low-boiling substrate in the accumulating species decreased from 34 to 22% with increasing temperature. Given the large difference in boiling point of 2 and 5 (376 K to 482 K), this result can be expected.
An approach developed by Wolf et al. was used to account for the deactivation and to calculate the effective reaction rates reff.50 The deactivation rate constant kd(T) was expressed as a function of a reference temperature T0 according to eqn (6) and (7). As shown later, no dependency of substrate or product partial pressure on the deactivation was observed (see Fig. S23 ESI†). Hence it is not included in eqn (6).
reff(t) = r0![[thin space (1/6-em)]](https://www.rsc.org/images/entities/char_2009.gif) exp−kd(T)t exp−kd(T)t | (6) |
 | (7) |
The deactivation could be sufficiently fitted with a value for kd,0 (423 K) of 0.0167 h−1 and a temperature dependency of EA,kd of 19.7 kJ mol−1. The low temperature dependency of the deactivation suggests that no bond formation or cleavage is present in the deactivation mechanism but rather blocking of active sites by physisorbed compounds.
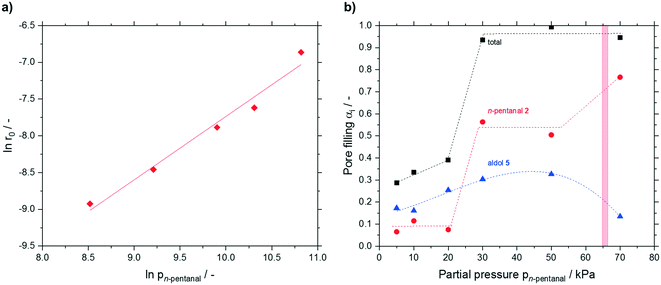
Next, a partial pressure variation of the substrate n-pentanal was carried out. Between 5 and 50 kPa, the effective reaction rate increased linearly (see Fig. S23†) from 0.13 × 10⁻³ to 1.1 × 10⁻³ mmol h−1 m−2. In this work an effective reaction order of 0.9 for n-pentanal was obtained (see Fig. 11a). A similar value was measured for n-butanal by Shylesh et al. on a silica-supported amine catalyst in the gas-phase.27 Herrmann and Iglesia showed, that the theoretical reaction order present at saturation coverage is 1 for the heterogeneous acid-catalyzed aldol condensation of acetone.22 Regarding the measured accumulation, saturation coverage can be also assumed in the present work. No dependency of the deactivation on the substrate or product partial pressure was observed in our study. After 24 h time on stream the runs were deliberately stopped and the catalysts were again analyzed by TGA (see Fig. 11b). A minor increase in pore filling degree due to higher 2-propyl-2-heptenal accumulation was detected up to 20 kPa. Increasing the partial pressure to 30 kPa resulted in a steep increase in n-pentanal condensation from approx. 0.1 to 0.56 mlhydrocarbons mlpore−1. As a result, the total pore filling degree almost reached 1, indicating completely filled pores. A further increase of the pressure did not have significant effect on the composition of accumulated species until a partial pressure of 70 kPa was used. Here, a significant change in the composition was found with 80% n-pentanal (from 50%) and 14% 2-propyl-2-heptenal (from 33%). At the same time, the measurement in the GC started to fluctuate strongly (see ESI† Fig. S24), which made a proper evaluation impossible. Using the Kelvin-equation for cylindrical pores, a value of p = 66 kPa was calculated for pore condensation of pure n-pentanal at 373 K in 7 nm pores (for calculation details see ESI†). The presence of pore condensation would lead to the increased amount of n-pentanal in the pores as well as the fluctuating GC-values. Although this calculated pressure for pore condensation is in good agreement with the observations at 70 kPa, it cannot serve as good explanation for the steep increase of n-pentanal condensation at 30 kPa.
In a next set of experiments the support characteristics, e.g. the influence of the particle and the pore size, were investigated. Table 4 summarizes the results for different particle size fractions at 393 K. No clear trend can be found with respect to the initial reaction rate or the final conversion level. This again hints for the absence of internal diffusion limitations, hence all n-pentanal can reach the active sites faster than it is converted at these sites. Comparing the total pore filling degrees after a reaction time of 24 h revealed no influence of the total filling degrees with particle size, which ranged between 0.33 and 0.37. However, 2-propyl-2-heptenal accumulated stronger while the n-pentanal fraction declined with increasing particle size. It can be assumed that the longer diffusion times inside the larger supports allowed more aldehyde to be converted into aldols. In addition, these aldols now have a smaller effective diffusion coefficient and a higher tendency for pore condensation.
![[V with combining dot above]](https://www.rsc.org/images/entities/i_char_0056_0307.gif) helium = 50 mlN min−1
helium = 50 mlN min−1
| Entry | d particle | r 0 | α tot | x n-pentanal | x aldol | x higher hydrocarbons |
|---|---|---|---|---|---|---|
| μm | 10−3 mmol h−1 m−2 | ml mlpore−1 | % | % | % | |
| d particle = particle range from sieved fraction, r0 = initial reaction rate, αtot = total pore filling degree, xi = composition of liquid phase in pores. | ||||||
| 1 | 63–200 | 0.21 | 0.33 | 34 | 48 | 18 |
| 2 | 200–450 | 0.13 | 0.35 | 28 | 54 | 18 |
| 3 | 450–630 | 0.14 | 0.35 | 24 | 58 | 18 |
| 4 | 630–800 | 0.20 | 0.34 | 23 | 60 | 17 |
| 5 | 800–1000 | 0.15 | 0.37 | 24 | 58 | 18 |
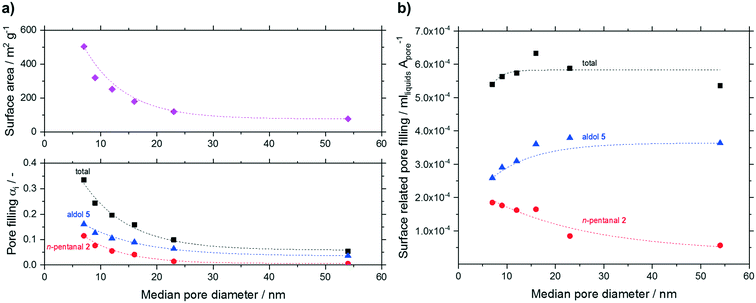
To evaluate the condensation behavior in more detail, we varied the median pore diameter for the smallest particle fraction. The measured pore filling degrees (total, n-pentanal, 2-propyl-2-heptenal) are shown in Fig. 12. Next to the measured volume-based pore filling degrees, Fig. 12a shows the decline in surface area with increasing median pore size as discussed earlier (see Table 1). All filling degrees declined exponentially with increasing pore size. This result can be expected assuming reduced condensation inside wider pores (see Kelvin equation in ESI†). When relating the pore filling to the surface area (in mlhydrocarbons Apore−1) and plotting it over the median pore size (see Fig. 12b), a more or less constant overall filling degree was obtained independent of the median pore size. Interestingly, larger pores led to an increased fraction of high-boilers over n-pentanal in the liquid phase. The fraction of 2-propyl-2-heptenal increased from 48% at 7 nm pores to 68% at 54 nm, while the opposite trend was visible for the low boiling n-pentanal (from 34 to 10%). The latter will have less tendency to condensate in wider pores while 2-propyl-2-heptenal is formed to a larger extent given the increased acidic site density (see Table 2).
The activity data for different median pore sizes is summarized in Table 5. The measured conversion over time and the calculated reff over time graphs are given in the ESI† in Fig. S26 and S27. Both, the initial reaction rate (r0) and the deactivation rate constant (kd) scaled linearly with increasing median pore size. According to Knudsen diffusion, the mass transport is proportional to the pore size (DiK ∼ d). As mass transport limitation could be excluded by the temperature variation for T < 403 K (see Fig. 10) and the particle size variation for particles up to 1 mm (see Table 4), a strong influence of the enhanced mass transport is unlikely. The reason for the higher activity most probably stems from the increased density of acidic sites and not from the improved internal diffusion in the enlarged pores. This assumption is supported by similar findings from Zhao et al. and Ordomsky et al. in related studies.19,24 As the concentration of active sites increased, blocking of such sites seemed more likely. As a result, a faster deactivation was observed. In conclusion, the pore size does not affect the activity or the deactivation significantly in the present study.
![[V with combining dot above]](https://www.rsc.org/images/entities/i_char_0056_0307.gif) helium = 50 mlN min−1
helium = 50 mlN min−1
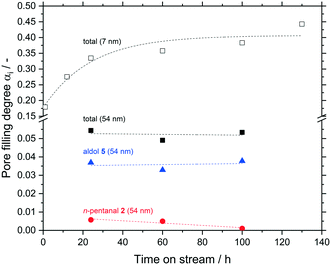
In a last set of experiments, the accumulation inside the macro-porous support was observed for up to 100 h TOS and compared to the meso-porous one. Inside the meso-pores a significantly higher amount of hydrocarbons accumulated after 24 h compare 0.33 to 0.05 mlhydrocarbons mlpore−1. Within the error margins, no further change was observed for both the macro-porous silica even at long time on streams up to 100 h (Fig. 13).
In addition, the composition of the liquid phase also remained constant for the macro-porous silica (10% n-pentanal, 70% 2-propyl-2-heptenal, rest higher hydrocarbons). It can be assumed, that the accumulation in larger pores also follows an asymptotic pattern as it was shown in Fig. 8 for a meso-porous support. Depending on the pore size, the maximum value of pore filling as well as the time to reach this value decrease with increasing pore size. Hence, larger pores should have a positive effect on the long-term stability in supported liquid phase catalysis.
Conclusion
In this work, we investigated the influence of support texture and reaction conditions on the activity and accumulation in the gas-phase aldol condensation of n-pentanal. Using a hydrothermal treatment procedure, the median pore size of the silica support was altered stepwise from initially 7 to 54 nm. The support was analyzed both with nitrogen sorption and mercury intrusion porosimetry. The latter one revealed pores also in the macro-porous range for a treatment at 433 and 453 K. An asymptotic dependency of the median pore size with treatment time was observed at a constant temperature of 393 K. Changing the treatment temperature from 393 to 453 K for a given treatment time of 24 h, an exponential increase of the median pore size was observed. This behavior is in agreement with the temperature dependency of the Ostwald ripening process, associated with hydrothermal treatment. Support analysis using 29Si CP MAS NMR showed mainly Q3-groups. The surface acidity and basicity was measured by PZC and TPD analysis and all data indicated a weakly acidic to neutral surface behavior. As the surface area decreased during the hydrothermal treatment, the surface area-based concentration of acid sites increased with increasing treatment time. The obtained supports were used in gas-phase experiments along with the untreated silica support. Post-run TGA measurements allowed to determine the accumulation in the pores. With increasing time on stream, the accumulation in the meso-porous support increased asymptotically over 130 h. The dominant compound of this accumulation was 2-propyl-2-heptenal, while the amount of n-pentanal remained constant over time. The low-boiling component n-pentanal decreased more rapidly than the high-boiling aldol upon temperature increase.Here, an effective activation energy of 43.4 kJ mol−1 was found, which is in good agreement with literature data for liquid-phase condensation reactions. At temperatures higher than 413 K, this apparent activation energy dropped to 22 kJ mol−1, indicating pronounced influence of internal diffusion now. An effective first order dependency was measured in a partial pressure variation of n-pentanal from 5 to 50 kPa. Interestingly, when increasing the pressure from 20 to 30 kPa, a drastic increase of accumulated n-pentanal occurred, which resulted in completely filled pores. Between 50 to 70 kPa, further n-pentanal accumulation occurred, while at the same time the aldol accumulation declined. This result is in line with the estimated pressure for pentanal condensation based on the Kelvin equation. However, liquefied pentanal should have a higher tendency for aldol condensation. It seems that the blocking of acidic site access is a key parameter for the condensation behavior. This was also exemplified by the stronger deactivation in large pore systems, which had a higher density of acidic surface sites. Increasing the pore size from 7 to 54 nm did not affect the activity or deactivation significantly, but the volumetric pore filling degree decreased while the surface area-based accumulation remained constant. Nonetheless, an enrichment of the high-boiling aldol compared to n-pentanal was measured with larger pores. The same trend was observed when increasing the particle size from 200 μm to 1000 μm. A variation of the reaction time with the macro-porous support showed that no change in accumulation was measured between 24 and 100 h TOS. This behavior differed significantly from the meso-porous support and therefore a change to larger pores in supported liquid phase catalysis should lead to an improved long-term stability as pore flooding can be suppressed.
Author contributions
Markus Schörner – investigation, formal analysis, methodology, visualization of experiments and writing original draft; Stefanie Kämmerle – investigation, formal analysis; Dorothea Wisser – investigation, formal analysis of NMR; Benjamin Baier – investigation, formal analysis; Martin Hartmann – supervision, review & editing; Matthias Thommes – supervision, review & editing; Robert Franke – funding acquisition, review & editing; Marco Haumann – conceptualization, funding acquisition, supervision, writing original draft and review & editing.Conflicts of interest
There are no conflicts to declare.Acknowledgements
The authors gratefully acknowledge financial support from the European Commission within the Horizon2020-SPIRE project MACBETH (grant agreement number 869896) and from the Deutsche Forschungsgemeinschaft (DFG, German Research Foundation) – Project-ID 431791331 – SFB 1452 (CLINT). The authors thank Narayanan Raman for TPD-measurement and evaluation.References
- Applied Homogeneous Catalysis with Organometallic Compounds: A Comprehensive Handbook in Four Volumes, ed. B. Cornils, W. A. Herrmann, M. Beller and R. Paciello, Wiley-VCH, Weinheim, 2017 Search PubMed.
- Catalyst Immobilization: Methods and Applications, ed. M. Benaglia and A. Puglisi, Wiley-VCH, Weinheim, 2019 Search PubMed.
- Catalyst Separation, Recovery and Recycling, ed. D. J. Cole-Hamilton and R. P. Tooze, Springer, Dordrecht, 2006 Search PubMed.
- Multiphase Homogenous Catalysis, ed. B. Cornils, W. A. Herrmann, I. T. Horváth, W. Leitner, S. Mecking and H. Olivier-Bourbigou, et al., Wiley-VCH, Weinheim, 2005 Search PubMed.
- U. Hintermair, T. Chinnusamy and W. Leitner, Transition-Metal Complexes in Supported Liquid Phase and Supercritical Fluids – A Beneficial Combination for Selective Continuous-Flow Catalysis with Integrated Product Separation, in New Strategies in Chemical Synthesis and Catalysis, Wiley-VCH, Weinheim, 2012 Search PubMed.
- M. K. Samantaray, S. K. Mishra, A. Saidi and J.-M. Basset, Surface organometallic chemistry: A sustainable approach in modern catalysis, J. Organomet. Chem., 2021, 945, 121864 CrossRef CAS.
- M. Haumann, K. Dentler, J. Joni, A. Riisager and P. Wasserscheid, Continuous Gas-Phase Hydroformylation of 1-Butene using Supported Ionic Liquid Phase (SILP) Catalysts, Adv. Synth. Catal., 2007, 349(3), 425–431 CrossRef CAS.
- A. Riisager, R. Fehrmann, S. Flicker, R. van Hal, M. Haumann and P. Wasserscheid, Very stable and highly regioselective supported ionic-liquid-phase (SILP) catalysis: continuous-flow fixed-bed hydroformylation of propene, Angew. Chem., Int. Ed., 2005, 44(5), 815–819 CrossRef CAS PubMed.
- Supported Ionic Liquids - Fundamentals and Applications, ed. A. Riisager, R. Fehrmann and M. Haumann, Wiley-VCH, Weinheim, 2014 Search PubMed.
- M. Haumann, Continuous catalytic processes with supported ionic liquid phase (SILP) materials in Commercial Applications of Ionic Liquids: Springer, Nature, 2020, 49–67 Search PubMed.
- M. Jakuttis, A. Schönweiz, S. Werner, R. Franke, K. D. Wiese and M. Haumann, et al., Rhodium-phosphite SILP catalysis for the highly selective hydroformylation of mixed C4 feedstocks, Angew. Chem., Int. Ed., 2011, 50(19), 4492–4495 CrossRef CAS PubMed.
- J. Zhao, Y. Yu, X. Xu, S. Di, B. Wang and H. Xu, et al., Stabilizing Au(III) in supported-ionic-liquid-phase (SILP) catalyst using CuCl2 via a redox mechanism, Appl. Catal., B, 2017, 206, 175–183 CrossRef CAS.
- https://www.macbeth-project.eu/ [17.05.2022].
- M. Logemann, J. M. Marinkovic, M. Schörner, E. José García-Suárez, C. Hecht and R. Franke, et al., Continuous gas-phase hydroformylation of but-1-ene in a membrane reactor by supported liquid-phase (SLP) catalysis, Green Chem., 2020, 22(17), 5691–5700 RSC.
- M. Casale, A. Richman, M. Elrod, R. Garland, M. Beaver and M. Tolbert, Kinetics of acid-catalyzed aldol condensation reactions of aliphatic aldehydes, Atmos. Environ., 2007, 41(29), 6212–6224 CrossRef CAS.
- S. Lee and A. Varma, Kinetic study of biphasic aldol condensation of n-butyraldehyde using stirred cell, Chem. Eng. Sci., 2013, 104, 619–629 CrossRef CAS.
- X. Zhang, H. An, H. Zhang, X. Zhao and Y. Wang, n-Butyraldehyde Self-Condensation Catalyzed by Sulfonic Acid Functionalized Ionic Liquids, Ind. Eng. Chem. Res., 2014, 53(43), 16707–16714 CrossRef CAS.
- S. K. Sharma, P. A. Parikh and R. V. Jasra, Solvent free aldol condensation of propanal to 2-methylpentenal using solid base catalysts, J. Mol. Catal. A: Chem., 2007, 278(1–2), 135–144 CrossRef CAS.
- L. Zhao, H. An, X. Zhao and Y. Wang, TiO2-Catalyzed n-Valeraldehyde Self-Condensation to 2-Propyl-2-Heptenal: Acid Catalysis or Base Catalysis?, Ind. Eng. Chem. Res., 2016, 55(48), 12326–12333 CrossRef CAS.
- L. Zhao, H. An, X. Zhao and Y. Wang, TiO2-Catalyzed n-Valeraldehyde Self-Condensation Reaction Mechanism and Kinetics, ACS Catal., 2017, 7(7), 4451–4461 CrossRef CAS.
- A. M. Hernández-Giménez, J. Ruiz-Martínez, B. Puértolas, J. Pérez-Ramírez, P. C. A. Bruijnincx and B. M. Weckhuysen, Operando Spectroscopy of the Gas-Phase Aldol Condensation of Propanal over Solid Base Catalysts, Top. Catal., 2017, 60(19–20), 1522–1536 CrossRef.
- S. Herrmann and E. Iglesia, Elementary steps in acetone condensation reactions catalyzed by aluminosilicates with diverse void structures, J. Catal., 2017, 346, 134–153 CrossRef CAS.
- S. Herrmann and E. Iglesia, Selective conversion of acetone to isobutene and acetic acid on aluminosilicates: Kinetic coupling between acid-catalyzed and radical-mediated pathways, J. Catal., 2018, 360, 66–80 CrossRef CAS.
- V. V. Ordomsky, V. L. Sushkevich and I. I. Ivanova, Study of acetaldehyde condensation chemistry over magnesia and zirconia supported on silica, J. Mol. Catal. A: Chem., 2010, 333(1–2), 85–93 CrossRef CAS.
- J. E. Rekoske and M. A. Barteau, Competition between acetaldehyde and crotonaldehyde during adsorption and reaction on anatase and rutile titanium dioxide, Langmuir, 1999, 15(6), 2061–2070 CrossRef CAS.
- S. Shylesh, D. Hanna, J. Gomes, C. G. Canlas, M. Head-Gordon and A. T. Bell, The role of hydroxyl group acidity on the activity of silica-supported secondary amines for the self-condensation of n-butanal, ChemSusChem, 2015, 8(3), 466–472 CrossRef CAS PubMed.
- S. Shylesh, D. Hanna, J. Gomes, S. Krishna, C. G. Canlas and M. Head-Gordon, et al., Tailoring the Cooperative Acid-Base Effects in Silica-Supported Amine Catalysts: Applications in the Continuous Gas-Phase Self-Condensation ofn-Butanal, ChemCatChem, 2014, 6, 1283–1290 CAS.
- D. Sun, Y. Yamada and S. Sato, Amorphous SiO2 catalyst for vapor-phase aldol condensation of butanal, Appl. Catal., A, 2019, 570, 113–119 CrossRef CAS.
- R. Young and N. Sheppard, Infrared spectroscopic studies of adsorption and catalysis: Acetone and acetaldehyde on silica and silica-supported nickel, J. Catal., 1967, 7(3), 223–233 CrossRef CAS.
- T. He, Y. Qu and J. Wang, Aldol Condensation Reaction of Methyl Acetate and Formaldehyde Over Cesium Oxide Supported on Silica Gel: An Experimental and Theoretical Study, Catal. Lett., 2018, 149(2), 373–389 CrossRef.
- A. Kaftan, A. Schönweiz, I. Nikiforidis, W. Hieringer, K. M. Dyballa and R. Franke, et al., Supported homogeneous catalyst makes its own liquid phase, J. Catal., 2015, 321, 32–38 CrossRef CAS.
- M. Schörner, P. Rothgängel, K. Mitländer, D. Wisser, M. Thommes and M. Haumann, Gas-Phase Hydroformylation Using Supported Ionic Liquid Phase (SILP) Catalysts – Influence of Support Texture on Effective Kinetics, ChemCatChem, 2021, 13(19), 4192–4200 CrossRef.
- M. Fankam, Strukturelle und texturelle Modifizierung von potentiellen Katalysatorträgern durch hydrothermale Behandlung unter dem Einfluss von ionischen Flüssigkeiten, PhD thesis, Friedrich-Alexander-Universität Erlangen-Nürnberg, Erlangen, 2014 Search PubMed.
- R. Leboda and E. Mendyk, Hydrothermal Modification of Porous Structure of Silica Adsorbents, Mater. Chem. Phys., 1991, 27(2), 189–212 CrossRef CAS.
- M. Thommes, K. Kaneko, A. V. Neimark, J. P. Olivier, F. Rodriguez-Reinoso and J. Rouquerol, et al., Physisorption of gases, with special reference to the evaluation of surface area and pore size distribution (IUPAC Technical Report), Pure Appl. Chem., 2015, 87(9–10), 1051–1069 CrossRef CAS.
- J. Landers, G. Y. Gor and A. V. Neimark, Density functional theory methods for characterization of porous materials, Colloids Surf., A, 2013, 437, 3–32 CrossRef CAS.
- M. Thommes, B. Smarsly, M. Groenewolt, P. I. Ravikovitch and A. V. Neimark, Adsorption hysteresis of nitrogen and argon in pore networks and characterization of novel micro- and mesoporous silicas, Langmuir, 2006, 22(2), 756–764 CrossRef CAS PubMed.
- G. Madras and B. J. McCoy, Temperature effects during Ostwald ripening, J. Chem. Phys., 2003, 119(3), 1683–1693 CrossRef CAS.
- J. P. Gallas, J. M. Goupil, A. Vimont, J. C. Lavalley, B. Gil and J. P. Gilson, et al., Quantification of water and silanol species on various silicas by coupling IR spectroscopy and in-situ thermogravimetry, Langmuir, 2009, 25(10), 5825–5834 CrossRef CAS PubMed.
- C. C. Liu and G. E. Maciel, The Fumed Silica Surface: A Study by NMR, J. Am. Chem. Soc., 1996, 118(21), 5103–5119 CrossRef CAS.
- F. J. Hidalgo, I. Aguilar and R. Zamora, Model Studies on the Effect of Aldehyde Structure on Their Selective Trapping by Phenolic Compounds, J. Agric. Food Chem., 2017, 65(23), 4736–4743 CrossRef CAS PubMed.
- N. Katada, H. Igi, J.-H. Kim and N. Miki, Determination of the Acidic Properties of Zeolite by Theoretical Analysis of Temperature-Programmed Desorption of Ammonia Based on Adsorption Equilibrium, J. Phys. Chem. B, 1997, 101(31), 5969–5977 CrossRef CAS.
- H. Sato, Acidity Control and Catalysis of pentasil Zeolites, Catal. Rev.: Sci. Eng., 1997, 39(4), 395–424 CrossRef CAS.
- M. Sawa, M. Niwa and Y. Murakami, Relationship between acid amount and framework aluminum content in mordenite, Zeolites, 1990, 10(6), 532–538 CrossRef CAS.
- N. Topsoe, K. Pedersen and E. G. Derouane, Infrared and temperature-programmed desorption study of the acidic properties of ZSM-5-type zeolites, J. Catal., 1981, 70(1), 41–52 CrossRef CAS.
- B. M. Lok, B. K. Marcus and C. L. Angell, Characterization of zeolite acidity. II. Measurement of zeolite acidity by ammonia temperature programmed desorption and FTi.r. spectroscopy techniques, Zeolites, 1986, 6(3), 185–194 CrossRef CAS.
- F. Lónyi and J. Valyon, On the interpretation of the NH3-TPD patterns of H-ZSM-5 and H-mordenite, Microporous Mesoporous Mater., 2001, 47(2–3), 293–301 CrossRef.
- P. Mäki-Arvela, N. Shcherban, C. Lozachmeur, K. Eränen, A. Aho and A. Smeds, et al., Aldol Condensation of Cyclopentanone with Valeraldehyde Over Metal Oxides, Catal. Lett., 2019, 149(5), 1383–1395 CrossRef.
- J. E. Rekoske and M. A. Barteau, Kinetics, Selectivity, and Deactivation in the Aldol Condensation of Acetaldehyde on Anatase Titanium Dioxide, Ind. Eng. Chem. Res., 2011, 50(1), 41–51 CrossRef CAS.
- E. Wolf and E. Petersen, On the Kinetics of Self-Poisoning Catalytic Reactions, J. Catal., 1977, 47, 28–32 CrossRef CAS.
- A. Jess and P. Wasserscheid, Chemical Technology, Wiley-VCH, Weinheim, 2013 Search PubMed.
Footnote |
| † Electronic supplementary information (ESI) available: Hydrothermal treatment procedure, reactor details, detailed texture data, detailed activity data, TGA data. See DOI: https://doi.org/10.1039/d2re00143h |
| This journal is © The Royal Society of Chemistry 2022 |

