 Open Access Article
Creative Commons Attribution 3.0 Unported Licence
Convenient and accurate insight into solution-phase equilibria from FlowNMR titrations†
Daniel B. G.
Berry
 ab,
Ian
Clegg
c,
Anna
Codina
c,
Catherine L.
Lyall
 ab,
John P.
Lowe
 ab and
Ulrich
Hintermair
 *abd
*abd
aDepartment of Chemistry, University of Bath, Claverton Down, BA2 7AY Bath, UK. E-mail: u.hintermair@bath.ac.uk
bDynamic Reaction Monitoring Facility, University of Bath, Claverton Down, BA2 7AY Bath, UK
cBruker UK Ltd, Banner Lane, CV4 9GH Coventry, UK
dCentre for Sustainable and Circular Technologies, University of Bath, Claverton Down, BA2 7AY Bath, UK
First published on 9th June 2022
Abstract
Chemical solution-phase equilibria such as acid/base reactions and complex formation are typically investigated by titration studies that either use in situ analysis of a continuously changing sample with techniques that measure single attributes (e.g. pH or UV-vis absorbance at a specific wavelength) or ex situ analysis of multiple samples with high-resolution techniques (e.g. high field NMR spectroscopy). Here we present multi-nuclear high resolution FlowNMR spectroscopy as an effective technique for the online analysis of complex solution-phase equilibria that combines the accuracy and convenience of simple in situ measurements with the high specificity and information content of high-resolution NMR spectroscopy. With a closed-loop flow setup reagent addition can be automated using a simple syringe pump and complimentary sensors (such as pH probes and UV-vis flow cells) may be added to the setup. By conducting the titration inside a glovebox connected to the FlowNMR setup even highly air- and moisture-sensitive systems may be investigated. The effectiveness of this approach is demonstrated with examples of Brønsted acid/base titrations (incl. multi-component mixtures and systems with solvent participation), hydrogen bonding interactions, Lewis acid/base interactions, and dynamic metal–ligand binding.
1. Introduction
Accurate thermodynamic data of reagent interactions in solution are the foundation of synthetic chemistry and key to reaction understanding and process design. While computational techniques may give useful information on the relative strengths of chemical interactions under idealised conditions, absolute equilibrium positions under real reaction conditions are still best measured experimentally, not least due to the significance of specific solvent effects which can be difficult to model. Amongst the most fundamental and widely used thermodynamic parameters are pKa values of acids and bases, which in aqueous solvents may easily be quantified via the hydronium ion concentration in mixtures of known composition using a proton-responsive electrode. In addition to the need for maintenance and calibration of pH meters, limitations are met in non-aqueous solvents and with mixtures of different acids and bases, or large molecules that possess multiple reactive sites. Similarly, other molecular association phenomena such as hydrogen bonding and ligand binding may be at least equally complex, solvent dependent, and difficult to measure accurately with simple techniques such as UV-vis or vibrational spectroscopies that quantify a selected attribute known (or assumed) to be indicative of the interaction in question. More specific and information-rich techniques such as multi-nuclear high-resolution NMR spectroscopy are thus required for investigations of complex solution phase equilibria.Although a relatively slow and insensitive technique (at least when compared to electrochemical and optical methods), NMR chemical shift titrations have become an integral part of probing chemical interactions in acid/base, supramolecular1,2 and coordination3 chemistry due to their ability to distinguish between different sites and species in solution. Hetero-nuclear NMR measurements using 13C, 15N, 19F and 31P and multi-dimensional correlation techniques allow for deeper insights into chemical interactions in solution.4–7 Dynamic exchange within equilibrated mixtures may be probed and quantified by variable-temperature measurements and magnetisation transfer (EXSY)8 or saturation transfer (CEST)9 experiments, while aggregation states are amenable to study by diffusion ordered spectroscopy (DOSY).10–12
However, a practical limitation of NMR titrations is the necessity of carrying out these experiments ex situ on a large number of individual samples of precisely controlled concentration, or by repeatedly altering a single sample to build a titration curve with a suitable number of data points.13,14 Considering that in typical settings sample insertion, locking, shimming and ejection take about as much time as the actual data collection (at least for high receptivity nuclei such as 1H and 19F) NMR titration studies using individual tube samples are thus time and resource demanding.‡ In addition, the small scale of the individual samples containing milligrams or microlitres of analyte can introduce relatively large errors on each measurement. Simpler techniques using pH meters or UV-vis spectrometers are adaptable and fast enough to be used in situ to quickly generate a large number of data points during the controlled, gradual composition change of a single sample (Fig. 1). With simple feedback loops automated titration setups have even been realised, both on lab15,16 and process scales.17,18
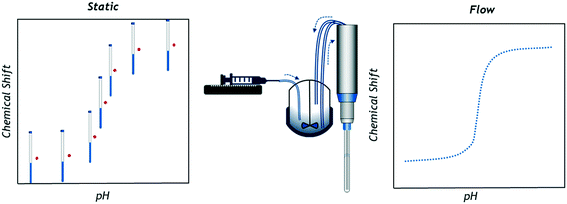 | ||
| Fig. 1 Graphical representation of data collection principles in single sample chemical shift titrations (left) and online FlowNMR titrations (right; schematic not to scale). | ||
The use of a closed-loop flow system through a high-field NMR spectrometer may combine the advantages of the high specificity and information content of high-resolution NMR with the convenience and accuracy of simple in situ pH probes. Hägele et al. pioneered this idea of NMR-controlled titrations in the 1990ies and reported several examples of successful investigations of Brønsted acid/base behaviour and binding of organophosphorus compounds in aqueous media via1H, 13C and 31P FlowNMR spectroscopic analysis using a combination of custom-built hardware and bespoke software controls with a high-field NMR spectrometer.6,19,20§ Despite the obvious appeal of this setup, due to the relatively large scales involved (reagent volumes of around 100 mL) and the need for specialist equipment their work has not been taken up and used more widely, however. With the recent commercial availability of versatile, small-scale FlowNMR hardware solutions that are compatible with standard high-field spectrometers, the use of FlowNMR spectroscopy for titrations is becoming relevant again, especially when also considering the advances in NMR methodology over the past 30 years.21 Here we demonstrate the application of a simple FlowNMR setup for accurate and precise titrations of Brønsted acid/base systems in aqueous and organic media (including mixtures and examples of solvent participation), associations of Lewis acid/base pairs (including air- and moisture-sensitive frustrated Lewis pairs), hydrogen bonding interactions, and dynamic metal–ligand binding using 1H, 11B, 13C, 19F and 31P FlowNMR methods. The use of mid-acquisition variable temperature and diffusion analysis is demonstrated, and aspects of technique hyphenation and process automation are discussed.
2. Results and discussion
Closed-loop recirculating batch titrations were carried out using a FlowNMR setup similar to those previously described in literature (Fig. 2; further details can be found on page S3 of the ESI†).22 These small-scale FlowNMR setups have proven effective for the precise control of flow and temperature, which are essential for accurate equilibrium measurements.23–25 Transfer lines for the flow path (red, Fig. 2) and flow tube (black, Fig. 2) were composed of fluorinated polyethylene/propylene (FEP) tubing on account of its high chemical resistance relative to other tubing materials.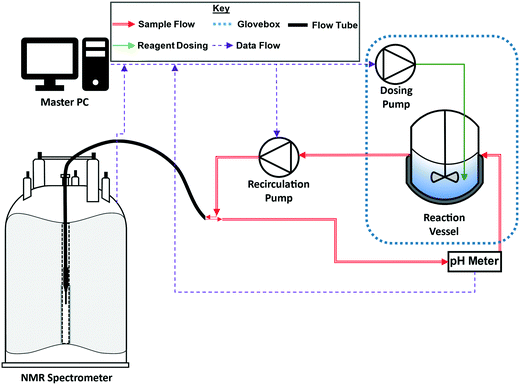 | ||
| Fig. 2 Schematic of the recirculating flow setup (see the ESI† for details). | ||
To give accurate results the titrand solution must be efficiently mixed within the reagent vessel (blue) but not back-mixed with the sample analysed in the flow path (red).26 Residence time distribution (RTD) measurements have previously been used to characterise the degree of back-mixing of the FlowNMR apparatus used in this work,24,26 showing an RTD of ∼50 s at an average RT of 73 s with a recirculation flow rate of 4 mL min−1.¶ Thus, with a steady titration rate of 0.11 mL min−1 using a high-precision syringe pump the setup will accurately analyse the equilibrated sample composition in each NMR spectrum without steps or oscillations in the titration curve. As depicted in Fig. 1, the dosing tubing was submerged in the sample solution to ensure that titrant was released gradually and not added dropwise. A control experiment using triethylamine and pivalic acid with the dosing pump periodically paused showed no noticeable signal drifts and the time-adjusted plot perfectly matched that of a continuous titration curve (Fig. S2†), showing effective equilibration and sampling under the conditions applied.
Flow effects can have a marked impact on NMR data acquisition,26 as moving a sample through the magnetic field during acquisition impacts the signal intensity of an NMR peak. Chemical shift positions remain unaffected by flow, however, so chemical shift titrations carried out with continuous sample flow do not require correction factors and are accurate as recorded.
a. Brønsted acid–base titrations
To benchmark the accuracy of 1H FlowNMR titrations we first investigated simple Brønsted acid/base pairs in aqueous solvent and included a flow pH probe (Fig. S4†) to independently verify the results (Scheme 1). | ||
| Scheme 1 Protonation of triethylamine (100 mM) with acetic acid (100 mM) at 293 K with 1H NMR resonances used for chemical shift titration highlighted. | ||
As can be seen in Fig. 3, a straight titration curve was obtained from the titration experiment where both reagent addition and data acquisition were automated. Plotting of chemical shift evolution over pH (derived from pD according to literature methods27) gave a pKa value for triethylamine of 10.95 which is within 2% of the reported literature value of 10.74.28
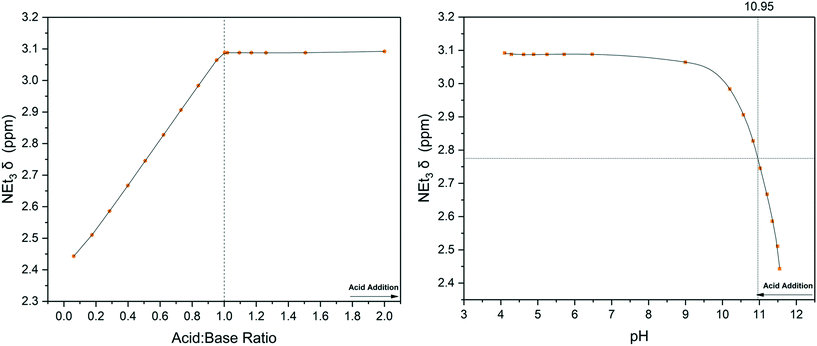 | ||
| Fig. 3 Chemical shift titration of triethylamine with acetic acid using the highlighted resonances in Scheme 1 (Fig. S8†). Left: 1H NMR over reagent ratio, right: 1H NMR over solution pH from flow probe. | ||
pKa values are highly solvent-dependent and require careful correlation if compared between different solvents.29,30 While these empirical scales can be useful indicators, accurate experimental determination of reagent pKa under the reaction conditions applied is desirable for the understanding of reactivity and solution speciation. While most pH probes are restricted to aqueous conditions24 NMR chemical shift titrations may in principle be performed in any solvent that give a homogeneous solution of all species throughout the titration.
To demonstrate this point and illustrate the importance of solvent, a simple Brønsted acid/base titration was compared in acetonitrile, tetrahydrofuran, and toluene. The aqueous pH probe was removed from the flow path and the titration curve obtained from 1H FlowNMR spectroscopy was plotted over reagent ratio as derived from the pump rate (and verified by relative peak integration) instead. Pivalic acid (pKa H2O 5.03) was used as opposed to acetic acid (pKa H2O 4.75) for this experiment (Scheme 2) as its proton resonance was less likely to overlap with solvent or base during the titration.
 | ||
| Scheme 2 Reaction of triethylamine (100 mM) with pivalic acid (100 mM) at 293 K in different solvents with 1H NMR resonances used for chemical shift titration highlighted. | ||
Unlike in aqueous media, in organic solvents there was no clear endpoint in the titration profile even after the addition of an excess of acid (Fig. 4). This observation is consistent with the known influence of weakly basic, non-hydrogen bond donating solvents such as acetonitrile or THF hindering ionisation and proton transfer that is facile in polar, protic solvents such as water.31 For instance, the equilibrium constant for triethylamine protonation with acetic acid is known to change from log![[thin space (1/6-em)]](https://www.rsc.org/images/entities/char_2009.gif) K = +5.9 in water to log
K = +5.9 in water to log![[thin space (1/6-em)]](https://www.rsc.org/images/entities/char_2009.gif) K = −5.0 in MeCN.32 This is also due to the carboxylic acids existing as cyclic homodimers in organic media34–36 that may form solvated clusters if sufficient levels of water are present.37,38 These collective solvent effects are reflected in the relative pKa values of for example acetic acid in different solvents, which is 4.75 for H2O but 22.48 for THF and 23.51 for MeCN, showing the same acid to be effectively 17 pKa units weaker (1017 times less acidic) in the aprotic solvent. Triethylamine (pKa THF = 12.5, pKa MeCN = 18.6) is therefore no longer strong enough to deprotonate the carboxylic acid, resulting in hydrogen bonding in organic media as opposed to proton transfer in water (Scheme 2).29,33
K = −5.0 in MeCN.32 This is also due to the carboxylic acids existing as cyclic homodimers in organic media34–36 that may form solvated clusters if sufficient levels of water are present.37,38 These collective solvent effects are reflected in the relative pKa values of for example acetic acid in different solvents, which is 4.75 for H2O but 22.48 for THF and 23.51 for MeCN, showing the same acid to be effectively 17 pKa units weaker (1017 times less acidic) in the aprotic solvent. Triethylamine (pKa THF = 12.5, pKa MeCN = 18.6) is therefore no longer strong enough to deprotonate the carboxylic acid, resulting in hydrogen bonding in organic media as opposed to proton transfer in water (Scheme 2).29,33
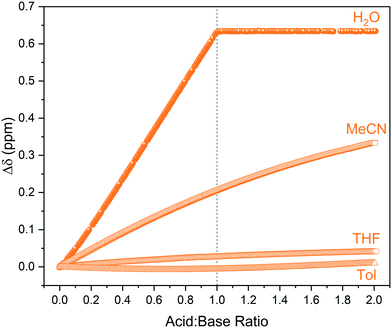 | ||
| Fig. 4 1H NMR chemical shift of triethylamine titrated with pivalic acid using the highlighted resonances in Scheme 2 over reagent ratio (Fig. S9–S12†). | ||
Hydrogen bonding in these mixtures was not only inferred by the lack of a clear endpoint in the titration curve but also directly observed as broad, low intensity signals around 12–16 ppm in the 1H NMR spectra. These resonances shifted downfield and increased in signal intensity with acid addition (Fig. 5), providing an example of what additional information NMR spectroscopy may offer over simpler titration techniques such as UV-vis spectroscopy. Although the broad, weak signals of the shared proton are not immediately obvious in single NMR spectra they are readily identified in multi-spectra stack plots obtained from the FlowNMR titration experiment (Fig. S11, S13 and S15†).||
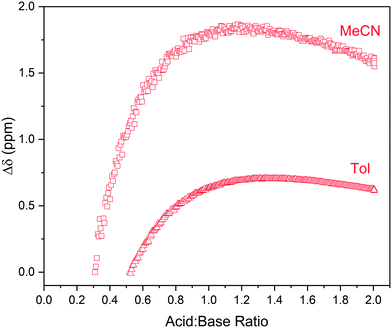 | ||
| Fig. 5 1H NMR chemical shift of RCOOH peaks observed during the titration of triethylamine with pivalic acid in acetonitrile and toluene using the highlighted resonances in Scheme 2 over reagent ratio (Fig. S14 and S15†). | ||
Hydrogen bonding is a key interaction in Brønsted acid catalysis39–41 and organocatalysis,42,43 and analytical insight into their occurrence is key to understanding their mode of action. More in-depth studies into their binding strengths, atomic distances44 and bond angles45 may be derived from systematic analysis of 1H and 15N NMR chemical shifts and their coupling constants across a series of analogous compounds if required.
Brønsted acids dissolved in aprotic solvents of low polarity have low dissociation constants as ions are poorly solvated in these media.32 As such, acid–base equilibria in these solvents are biased towards ion pair formation and hydrogen-bond association rather than ionisation. The presence of residual water in such media can have a large impact on these equilibria by shifting the charge localisation due to specific solvation.46 Indeed, repeating the titration of triethylamine with pivalic acid using laboratory-grade, non-dried THF showed the residual water peak in the 1H FlowNMR spectra to gradually shift by more than 1.5 ppm upon acid addition (Fig. 6). This data indicates that the water participated in the hydrogen bonding equilibrium without affecting distinct protonation events, an important interaction that may have been missed by techniques other than high resolution NMR spectroscopy.
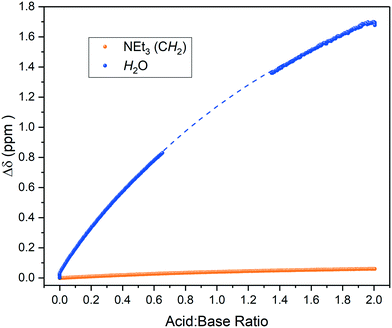 | ||
| Fig. 6 1H NMR chemical shift change of residual water and base during the titration of triethylamine with acetic acid in wet THF using the highlighted resonance in Scheme 2 over reagent ratio. Some data was excluded due to solvent overlap with the water resonance (dashed line, see also Fig. S16†). | ||
While NMR spectroscopy is unique in its potential to directly observe such hydrogen bonding equilibria, exchanging resonances are observed as a time average of all species present. Therefore, proton signals can not only shift but also broaden and collapse depending on the rate of exchange relative to the frequency separation of the signals.47 The matrix dependant nature of these observations can become a hinderance to titrimetric investigations, especially where residual moisture is present in organic solvent.48 All titrations in non-aqueous media were thus carried out using dried reagents and performed under the exclusion of atmospheric moisture (see section 4 of the ESI†).
In addition to the influences of solvent and residual moisture on acid/base equilibria, challenges may also arise when trying to analyse mixtures of multiple (potential) bases and acids. These cases can often only be addressed with NMR spectroscopy, as simple pH measurements or UV-vis spectral analysis do not allow deciphering the sites of protonation or hydrogen bonding with confidence. Using an equimolar mixture of triethylamine and pyridine titrated with p-toluene sulfonic acid (TsOH) in dry MeCN as an example (Scheme 3), we investigated the effectiveness of an automated 1H FlowNMR titration in dealing with more complicated systems. As shown in Fig. 7, the preferential protonation of triethylamine (pKa MeCN = 18.6) over pyridine (pKa MeCN = 12.5) upon steady addition of p-toluene sulfonic acid (pKa MeCN = 8.01) was clearly distinguishable as expected from their respective pKa values.33,49
 | ||
| Scheme 3 Protonation of triethylamine (100 mM) and pyridine (100 mM) with p-toluene sulfonic acid (200 mM) at 293 K, 1H NMR resonances used for chemical shift titration highlighted. | ||
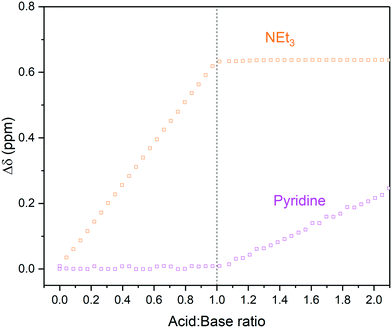 | ||
| Fig. 7 1H NMR chemical shift changes during the titration of triethylamine and pyridine with p-toluene sulfonic acid in MeCN using highlighted resonances from Scheme 3 over reagent ratio (Fig. S18 and S19†). | ||
In addition to chemical shift evolution, characteristic 3JHH coupling between the methylene protons of triethylamine and the proton added to nitrogen was observed (Fig. S17†), further confirming protonation at this site. Due to their distinct pKa difference of four units, pyridine protonation did not set in until all the triethylamine had been fully protonated by the strong acid TsOH. Additionally, throughout the protonation of the two bases, three broad hydrogen bonding resonances were identified in the 1H FlowNMR spectra (Fig. S18 and S19†).
One of these resonances around 3–5 ppm was observed to reversibly shift throughout the titration in a typewriter-like fashion where it would reset to its original chemical shift position following full protonation of each base, and then continuing to shift and intensify after both bases had been fully protonated (Fig. 8). Correlation spectroscopy (COSY) identified this resonance as a hydrogen bonding interaction between protonated acetonitrile and the conjugate base of the acid (Fig. S20†). The basic MeCN solvent thus mediates proton transfer from the acid to the bases akin to hydronium ion formation water. The fact that intermediate MeCNH+ formation may be observed during the titration of two moderately strong bases with a strong acid is likely due to the high concentration of the mildly basic MeCN solvent (aq. pKa = 25).
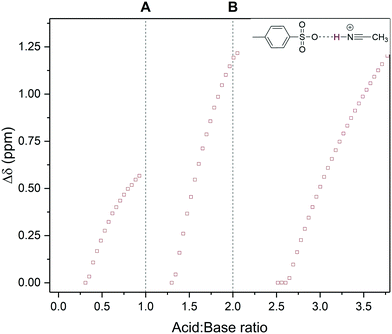 | ||
| Fig. 8 1H NMR chemical peak shift of an acetonitrile/tosylate hydrogen bonding interaction observed during the titration of triethylamine and pyridine with p-toluene sulfonic acid using the resonance highlighted in Scheme 3 over reagent ratio (Fig. S18†). Dashed lines mark stoichiometric protonation of triethylamine (A) and pyridine (B) respectively. | ||
The other two broad resonances were only visible after the protonation of triethylamine and pyridine, respectively. COSY showed the first resonance at 8–10 ppm to be hydrogen bonding between triethylammonium and the conjugate base of the acid as Et3N–H–OTs (Fig. S20 and S21†). The third broad resonance at 14–16 ppm, which resolved to a broad triplet with a 60 Hz coupling constant after the addition of four equivalents of acid, showed no cross peaks in the COSY spectrum. A 1H{14N} NMR spectrum revealed this resonance to be pyridinium hydrogen bonding with the conjugate base of the acid as Py–H–OTs (Fig. S22†). Hence, high-resolution FlowNMR allowed the observation of multiple hydrogen bonding interactions during the titration of mixtures that would not be discernible by other methods.
The differentiation of multiple acidic or basic sites within a single molecule can be even more challenging than analysing mixtures of acids and bases that have distinct NMR signatures, because (de)protonation at one site may induce chemical shift changes across the entire molecule during the titration experiment. Nevertheless, such information is often crucial for understanding the reactivity of large bioactive molecules.50,51 We thus decided to investigate the acid/base chemistry of the amino acid L-leucyl-L-alanine (Leu-Ala) via FlowNMR titration (Scheme 4).
 | ||
| Scheme 4 Deprotonation of protonated Leu-Ala (63 mM) with NaOH (200 mM) at 293 K, 1H NMR resonances used for chemical shift titration are highlighted. CH-2 (purple) and CH-7 (green) are assigned according to the structure in Fig. S23.† | ||
Hägele et al. have previously analysed this system using 13C{1H} NMR spectroscopy in a stepwise dose-mix-acquire experiment.19§ Although successful in distinguishing NH from OH deprotonation of Leu-Ala in aqueous solvent, their apparatus required 4 hours of setup and took 8 hours to build a titration curve with 64 data points on a scale of 80 mL.** With our setup we carried out the continuous-flow titration and analysis of protonated Leu-Ala on a 20 mL scale using an ASAP 1H–13C HMQC pulse sequence52 that allowed the collection of 64 2-dimensional data points within 4 hours. Another advantage of using fast 2D techniques for complex FlowNMR titrations is that both 1H and 13C dimensions (including their connectivities) are collected throughout the experiment, and the evolution of changes in either may be matched and verified for maximum confidence in the differentiation of the various reactive sites in the analyte. In the case of Leu-Ala, the first deprotonation of the carboxylic acid was best seen in the 1H chemical shift evolution of H7 (Fig. 9, S23 and S24†). The pKa values thus obtained matched literature well within 0.6% (pKa COOH/COO– = 3.44, pKaNH3+/NH2 = 8.30).19§
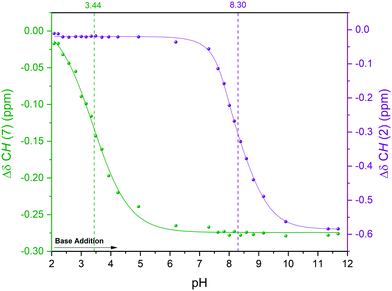 | ||
| Fig. 9 Titration curves for the deprotonation of protonated Leu-Ala with NaOH in H2O at 293 K using the highlighted resonances in Scheme 4. 1H NMR (extracted from 1H–13C HMQC) over solution pH from static pH probe (Fig. S23†). | ||
b. Guest–host complexation
Specific interactions such as hydrogen bonding not only relate to proton transfer in Brønsted acid/base pairs but also underpin supramolecular chemistry,53 molecular recognition and sensing,1,54 and organocatalysis.42,55,56 Substituted ureas have emerged as powerful reagents that bind and activate a variety of hydrogen bond acceptors including simple halides.57–59 To test the utility of automated FlowNMR titrations for investigating such equilibria, we chose to study the urea–fluoride interaction previously investigated by Monzani et al.2 using UV-visible spectroscopy by 1H and 19F FlowNMR (Scheme 5).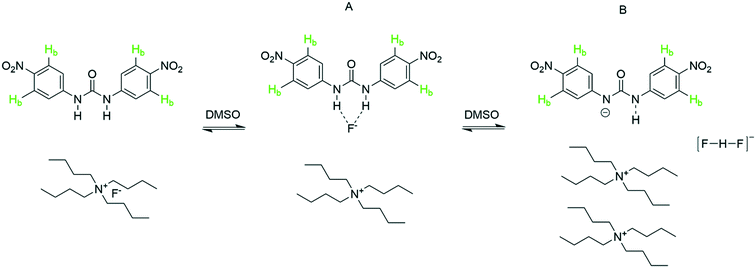 | ||
| Scheme 5 Titration of 1,3-bis(4-nitrophenyl) urea (5 mM) with tetra-n-butylammonium fluoride (10 mM) at 293 K, resonances used for chemical shift titration are highlighted. | ||
Upon gradual addition of anhydrous [NBu4]F to a DMSO solution of 1,3-bis(4-nitrophenyl) urea, the 1H NMR data showed a significant downfield shift and broadening of the Hb resonances in the urea indicative of hydrogen bonding with fluoride (Fig. 10). Consistent with the UV-vis data reported by Monzani,2 an endpoint was observed upon addition of three equivalents of fluoride due to the need for an excess of [NBu4]F to convert all of the urea to a mixture of the two adduct forms of 1![[thin space (1/6-em)]](https://www.rsc.org/images/entities/char_2009.gif) :
:![[thin space (1/6-em)]](https://www.rsc.org/images/entities/char_2009.gif) 1 (A) and 2
1 (A) and 2![[thin space (1/6-em)]](https://www.rsc.org/images/entities/char_2009.gif) :
:![[thin space (1/6-em)]](https://www.rsc.org/images/entities/char_2009.gif) 1 (B) stoichiometry.
1 (B) stoichiometry.
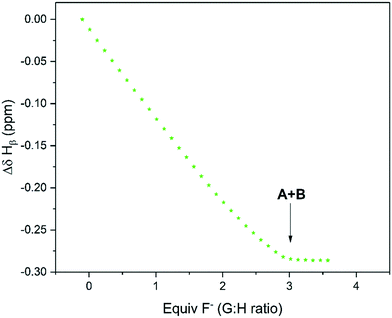 | ||
| Fig. 10 1H NMR chemical shift of Hb during the titration of 1,3-bis(4-nitrophenyl) urea with tetra-n-butyl ammonium fluoride using the resonance highlighted in Scheme 5 over reagent ratio (Fig. S27†). | ||
In addition to the ability of conveniently collecting an accurate titration curve from the 1H FlowNMR data, analysis of the 19F NMR spectra recorded at the same time served to confirm the identity of the adducts formed. [HF2]− could be clearly characterised by its distinct 19F NMR chemical shift and H–F coupling constant (Fig. 11) which in the case of new systems would be a distinct advantage over UV-vis spectroscopy for example.
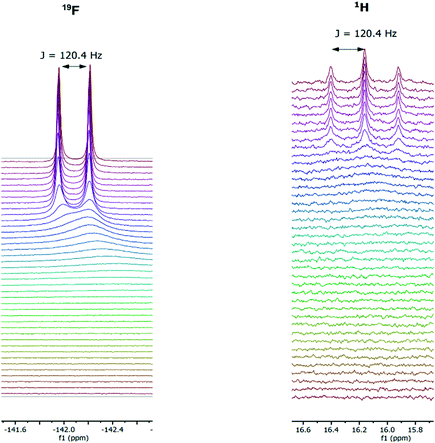 | ||
| Fig. 11 Representative 19F (left) and 1H (right) NMR spectra during the titration of 1,3-bis(4-nitrophenyl) urea (5 mM) with tetrabutylammonium fluoride (10 mM) in dimethyl sulfoxide at 293 K. | ||
c. Lewis acid/base association
Lewis acid/base interactions have widespread applications in both synthesis and catalysis.60 These strongly solvent-dependent and often highly air-sensitive interactions are routinely analysed by 1H, 11B, 19F and 31P NMR spectroscopy.4,61 Due to the specific nature of Lewis acid/base interactions universal indicators such as pKa values are difficult to define, although the Gutmann–Beckett method is an example of a useful Lewis acidity scale based on the 31P NMR chemical shift of triethylphosphine oxide.62–65 Specific interactions, as for example between sterically encumbered (electronically “frustrated”) Lewis acids and bases that exhibit unusual reactivity,66 are still best investigated with a combination of multi-dimensional, variable temperature (VT) and diffusion ordered NMR spectroscopy (DOSY) under strictly inert conditions. In this area, Lewis acidic boranes have emerged as powerful catalysts, co-catalysts and stoichiometric reagents for numerous chemical transformations such as small molecule activation, cyclisation, and borylation.67,68 Of these, tris(pentafluorophenyl)borane has been the most prolific on account of its high Lewis acidity paired with steric shielding.69–71The combination of tris(pentafluorophenyl)borane (BCF) and pyridine (Py) has been described as a classical Lewis acid/base pair in which complete adduct formation is observed (Scheme 6),61 so we investigated this system as a test case of automated Lewis acid/base titration with multi-nuclear FlowNMR spectroscopy. Due to the pronounced oxygen and moisture sensitivity of the Lewis acid, the titration experiments had to be carried out in an inert atmosphere. Whilst FlowNMR studies have been previously conducted under a variety of atmospheres,22,72–77 to the best of our knowledge this is the first report of a FlowNMR analysis being conducted directly from a glovebox (see section 8 in the ESI† for further details).
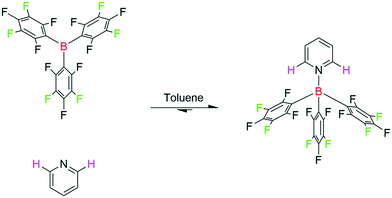 | ||
| Scheme 6 Titration of tris(pentafluorophenyl)borane (20 mM) with pyridine (40 mM) in toluene at 293 K, resonances used for titration are highlighted. | ||
When studying chemical associations in solution by NMR spectroscopy either peak integrals or chemical shift values may be used to determine the equilibrium position. If the exchange rate between the individual components and the formed complex is fast relative to the NMR timescale, an average signal of changing chemical shift will be observed as the equilibrium position changes. When this exchange rate is slow (or naught) individual peaks for bound and unbound states are observed, and their relative peak integrals reflect the equilibrium position.56,78 Unlike the above examples of proton transfer and hydrogen bonding that exchange rapidly and are thus investigated via average chemical shift evolution, the titration of BCF with pyridine to form a strongly bound Lewis acid/base adduct is a case where exchange rate is slow on the NMR timescale, and separate signals for free and bound BCF and pyridine were thus observed in the 1H, 11B and 19F NMR spectra throughout the titration. As expected for a strong interaction leading to essentially complete adduct formation, all three data sets showed a linear titration curve ending sharply at one equivalent (Fig. 12).
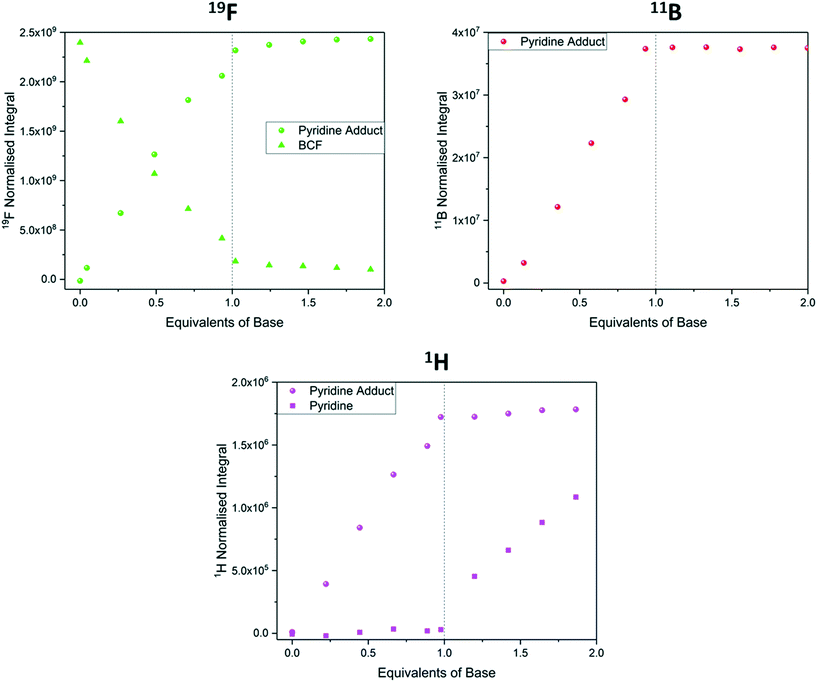 | ||
| Fig. 12 19F NMR integrals (green, Fig. S31†), 11B NMR integrals (red, Fig. S33†) and 1H NMR integrals (pink, Fig. S30†) during the titration of tris(pentafluorophenyl)borane with pyridine using the resonances highlighted in Scheme 6. | ||
To confirm the formation of a monomeric 1![[thin space (1/6-em)]](https://www.rsc.org/images/entities/char_2009.gif) :
:![[thin space (1/6-em)]](https://www.rsc.org/images/entities/char_2009.gif) 1 adduct we applied diffusion ordered spectroscopy (DOSY) to quantify the hydrodynamic radius of the product formed.79 Capitalising on the abundant signal intensity and large chemical shift dispersion, 19F DOSY spectra were acquired periodically throughout the titration (Fig. S35†). The data showed a 16% decrease in the molecular diffusion coefficient from 9.42 × 10⁻¹⁰ m2 s−1 for BCF to 7.95 × 10⁻¹⁰ m2 s−1 for BCF–Py which is consistent with a small increase in molecular weight when pyridine binds to BCF (511.98 g mol−1 to 591.98 g mol−1).
1 adduct we applied diffusion ordered spectroscopy (DOSY) to quantify the hydrodynamic radius of the product formed.79 Capitalising on the abundant signal intensity and large chemical shift dispersion, 19F DOSY spectra were acquired periodically throughout the titration (Fig. S35†). The data showed a 16% decrease in the molecular diffusion coefficient from 9.42 × 10⁻¹⁰ m2 s−1 for BCF to 7.95 × 10⁻¹⁰ m2 s−1 for BCF–Py which is consistent with a small increase in molecular weight when pyridine binds to BCF (511.98 g mol−1 to 591.98 g mol−1).
Both the rate of chemical exchange and the equilibrium position of adduct formation are affected by temperature. Heating the 1![[thin space (1/6-em)]](https://www.rsc.org/images/entities/char_2009.gif) :
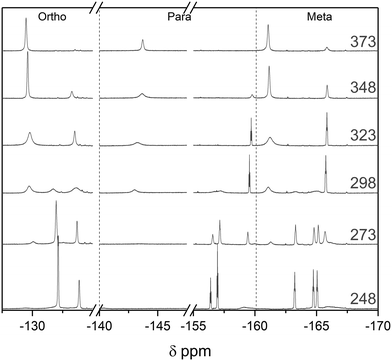
:![[thin space (1/6-em)]](https://www.rsc.org/images/entities/char_2009.gif) 1 BCF–Py complex to 348 K did not change the speciation in the 19F NMR spectra, consistent with the high stability of this classic Lewis acid–base adduct. Cooling the sample to 248 K led to broadening of the meta and ortho19F NMR resonances of the complex, attributable to a slowing of the ring rotation (Fig. 13). The ease of carrying out DOSY and VT NMR investigations to gain insight into dynamics and aggregation states at any point during an air-sensitive, automated titration with FlowNMR from a glovebox will prove useful in the study and understanding of more complex or unknown systems.
1 BCF–Py complex to 348 K did not change the speciation in the 19F NMR spectra, consistent with the high stability of this classic Lewis acid–base adduct. Cooling the sample to 248 K led to broadening of the meta and ortho19F NMR resonances of the complex, attributable to a slowing of the ring rotation (Fig. 13). The ease of carrying out DOSY and VT NMR investigations to gain insight into dynamics and aggregation states at any point during an air-sensitive, automated titration with FlowNMR from a glovebox will prove useful in the study and understanding of more complex or unknown systems.
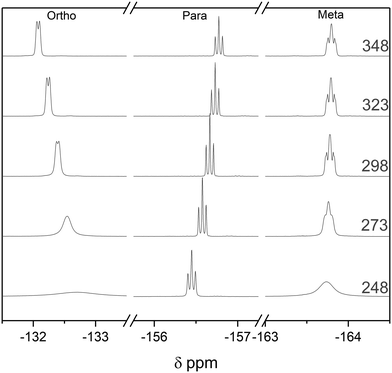 | ||
| Fig. 13 19F NMR spectra of the pyridine adduct of tris(pentafluorophenyl)borane at 20 mM in toluene at variable temperature as indicated. | ||
Lewis adduct formation can be hindered by steric congestion, a concept which has become known as frustrated Lewis pairs (FLP). The degree of this frustration has been found to lead to interesting reactivities and subsequently widespread use in small molecule activation and catalysis.4,60,79–85 An important metric for the reactivities and understanding of association in FLPs is their respective binding constant (hence their degree of frustration) in solution.61,86 Sterically hindered pyridines in particular and their association with BCF have been studied to determine their binding strength.85,87 Of the sterically hindered pyridines previously studied, 2,6-lutidine (Lut) has received interest because of its moderate steric bulk resulting in so-called borderline FLP reactivity (Scheme 7).66
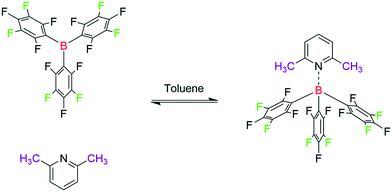 | ||
| Scheme 7 Titration of tris(pentafluorophenyl)borane (20 mM) with 2,6-lutidine (40 mM) at 293 K, resonances used for titration are highlighted. | ||
The binding of BCF with lutidine was notably weaker than with pyridine, and free and bound base exchanged more rapidly. This difference in binding strength is attributed to steric hinderance as the bases have similar pKa values in organic solvent (Lut pKa MeCN = 14.16, Py pKa MeCN = 12.53).33 While separate peaks for free and bound BCF were observed in the 11B and 19F NMR data during the titration, the 1H NMR signals of lutidine appeared as an average that evolved in chemical shift (Fig. 14). This was due to the frequency separation between the two states being smaller in the 1H spectra than in the 19F spectra (1110 Hz vs. 5170 Hz), so coalescence occurs at lower temperatures.47 Using this frequency separation in each of the spectra we can determine that the rate of exchange kex must be between 1110 s−1 and 5170 s−1 (see section 8 of the ESI†). Although the 11B NMR titration data was less clear than the 19F NMR data due to lower signal intensities and broader resonances (Fig. S38†), both agreed with the 1H data to show the gradual formation of a 1![[thin space (1/6-em)]](https://www.rsc.org/images/entities/char_2009.gif) :
:![[thin space (1/6-em)]](https://www.rsc.org/images/entities/char_2009.gif) 1 adduct that was complete after addition of about four equivalents of lutidine.
1 adduct that was complete after addition of about four equivalents of lutidine.
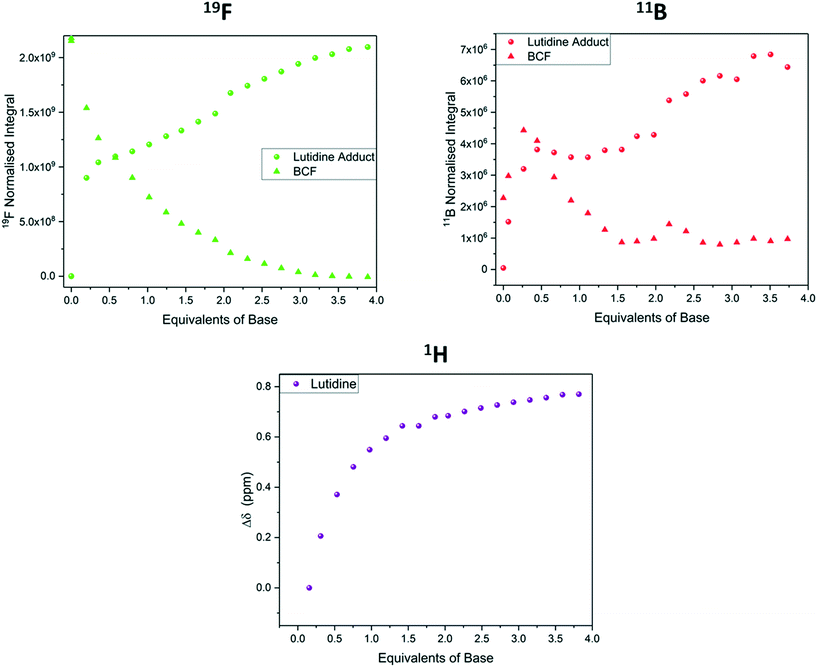 | ||
| Fig. 14 19F NMR integrals (green, Fig. S37†), 11B NMR integrals (red, Fig. S38†) and 1H NMR chemical shift (purple, Fig. S36†) during the titration of tris(pentafluorophenyl)borane with 2,6-lutidine using the resonances highlighted in Scheme 7. | ||
The binding constant Keq of the adduct was measured independently by two nuclei using different spectral information. Using 19F NMR peak integrals of bound vs. unbound BCF at 1![[thin space (1/6-em)]](https://www.rsc.org/images/entities/char_2009.gif) :
:![[thin space (1/6-em)]](https://www.rsc.org/images/entities/char_2009.gif) 1 stoichiometry,56Keq in toluene was determined to be 195 ± 10 M−1 at 293 K (Fig. S39†). This was verified by the 1H NMR chemical shift of the lutidine CH3 resonance in the same experiment,86 where Keq was calculated to be 195 ± 26 M−1 (Fig. S40†). Previous reports have measured the Keq for this system at 55 ± 10 M−1 at 295 K in dichloromethane,86 suggesting adduct formation to be more favourable in toluene than in DCM. VT 19F NMR investigation of a 1
1 stoichiometry,56Keq in toluene was determined to be 195 ± 10 M−1 at 293 K (Fig. S39†). This was verified by the 1H NMR chemical shift of the lutidine CH3 resonance in the same experiment,86 where Keq was calculated to be 195 ± 26 M−1 (Fig. S40†). Previous reports have measured the Keq for this system at 55 ± 10 M−1 at 295 K in dichloromethane,86 suggesting adduct formation to be more favourable in toluene than in DCM. VT 19F NMR investigation of a 1![[thin space (1/6-em)]](https://www.rsc.org/images/entities/char_2009.gif) :
:![[thin space (1/6-em)]](https://www.rsc.org/images/entities/char_2009.gif) 1 Lut/BCF mixture led to almost complete dissociation of the adduct at 373 K, and upon cooling to 248 K the equilibrium shifted to almost exclusively adduct with rotational isomers of each of the adduct peaks resolved (Fig. 15).66
1 Lut/BCF mixture led to almost complete dissociation of the adduct at 373 K, and upon cooling to 248 K the equilibrium shifted to almost exclusively adduct with rotational isomers of each of the adduct peaks resolved (Fig. 15).66
The VT data thus collected may be used to determine the thermodynamic stability of the FLP through a van't Hoff plot (Fig. 16). Comparing our results of this analysis with previously reported values in different solvents61,66 gave good agreement (Table 1), showing the full range of advanced NMR spectroscopic methods to be applicable to highly reactive systems during automated FlowNMR titrations under inert conditions.
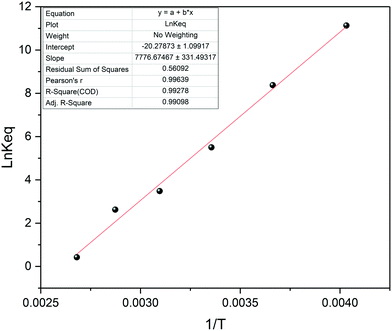 | ||
Fig. 16 van't Hoff plot for a 1![[thin space (1/6-em)]](https://www.rsc.org/images/entities/char_2009.gif) : :![[thin space (1/6-em)]](https://www.rsc.org/images/entities/char_2009.gif) 1 mixture of 2,6-lutidine and tris(pentafluorophenyl)borane at 20 mM in toluene. 1 mixture of 2,6-lutidine and tris(pentafluorophenyl)borane at 20 mM in toluene. | ||
d. Metal–ligand binding
Binding equilibria also play a crucial role in the understanding of organometallic and structural biochemistry. The study and quantification of substrate complexation by a protein or ligand binding to a metal centre can be used to determine binding site location, complex structure and equilibrium constants.3,89–92 Binding constants of ligands to metal centres are important parameters for understanding complex stabilities and ligand exchange pathways that underpin applications in sensing and catalysis. Metal–ligand affinities are typically quantified in titration experiments where the ligand investigated displaces weakly bound solvent molecules. One prominent example is the consecutive binding of up to three equivalents of PPh3 to PdII in MeCN to give [Pd(PPh3)3(MeCN)][BF4]2 (Scheme 8).93,94 Due to the air-sensitivity of this system the experiment was carried out from a glovebox in a similar manner to the above Lewis acid/base titrations. | ||
| Scheme 8 Titration of [Pd(NCCH3)4](BF4)2 (20 mM) with PPh3 (up to 160 mM) in MeCN at 293 K, resonances used for plotting are highlighted. | ||
Using 31P{1H} FlowNMR we were able to observe the progressive substitution of bound acetonitrile by PPh3 (Fig. 17). Concurrent with literature93,94 it was observed that the mono, trans-bis and tris PPh3 complexes were formed stoichiometrically with 1, 2 and 3 equivalents of phosphine, respectively. Due to ligand exchange on PdII being slow relative to the NMR acquisition, separate signals were observed for all complexes and the titration was quantified from relative 31P NMR peak integrals. Two broad singlets were observed for the tris complex at room temperature which resolved into a mutually coupling triplet and doublet integrating to 1 and 2 respectively at 253 K (Fig. S43†) as expected for a square planar coordination geometry.
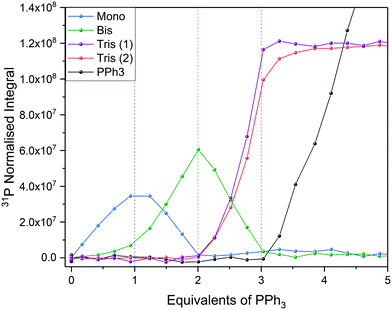 | ||
| Fig. 17 Titration of [Pd(NCCH3)4](BF4)2 with PPh3 in MeCN using highlighted resonances from Scheme 8 (Fig. S42†). | ||
Due to a relatively acute L-M-L angle of 90° no tetra substitution was observed even after addition of a large excess of PPh3, unlike in the case of Pd0 where steric congestion is reduced in a tetrahedral coordination environment.94,95
3. Conclusions
High-resolution FlowNMR spectroscopy with automated, continuous dosing of a titrant has been shown to be an effective technique for carrying out solution-phase titrations in an accurate and time-efficient manner. With reagent dosing rates of 0.1 mL min−1 and recirculation flow rates of 4 mL min−1 using a small-scale flow setup of 4.6 mL internal volume (∼70 s residence time), true equilibrium measurements are possible without the need for external calibration. Faster or more detailed analyses are easily possible, as unlike with kinetic measurements the user may alter the rates of titrant addition and sampling to either increase temporal resolution (number of spectra per time) or improve data quality (number of scans per spectrum). It is advisable however to conduct paused-flow control experiments to ensure effective sampling and equilibration under the conditions applied.Depending on the rate of exchange relative to the NMR signal acquisition, either chemical shift evolution or relative peak integrations may be used to quantify equilibrium positions. Multi-nuclear NMR analysis can be applied in a continuous, interleaved manner such that complementary data are acquired from a single titration experiment. Fast 2D techniques such as ASAP 1H–13C HMQC pulse sequences may be used in flow to collect even more information per unit time, and mid-run VT analyses may be carried out on the static aliquot in the tip of the flow tube to derive thermodynamic parameters of the interactions titrated. DOSY analysis is possible in a similar manner to ascertain the degree of analyte association and, although not demonstrated here, NOESY and EXSY will be possible in the same way if required.8
We have shown that a range of chemical equilibria may be investigated with high specificity under different conditions, including multi-component mixtures, non-aqueous solvents, and highly air-sensitive reagents. Previous studies have described methods for effective thermal regulation of such small scale FlowNMR setups, an important factor in the study of thermodynamic equilibria.22–24 Our results also demonstrate that even for deceptively simple systems, such as the interaction of a carboxylic acid with a tertiary amine in organic solvent, high-resolution NMR spectroscopy is superior to simpler techniques such as UV-vis spectroscopy due to extra information on solvent participation and coupling constants to provide detailed insights that may have been missed otherwise.
The analysis of high-value materials or use of reagents of low solubility may pose challenges where millimolar concentrations cannot be achieved in the ∼10 mL of solution required for the FlowNMR apparatus used here. We believe that the combination of modern NMR techniques such as fast and ultra-fast (UF) 2D NMR96,97 or spectral aliasing7 with low internal volume systems98 can be used to overcome many of these barriers. Similarly, modern pure shift techniques99 can be used to address challenges of spectral crowding resulting from peak overlap when dealing with large molecules or complex mixtures. Solvent suppression100 and selective excitation101,102 techniques may be applied to tackle sensitivity issues as required.
While this study has primarily explored the use of high-field NMR spectroscopy, the principles shown are equally valid for low-field NMR (where commercially available flow apparatus is becoming increasingly common103–105) if mobility or cost are valued over data quality. In addition, the hyphenation of several analytical techniques with FlowNMR, including UV-vis and IR spectroscopies can be used to great effect for the enhanced analysis of solution phase equilibria.22,74,106 We hope that our report will be of use to the wider chemistry community to effectively carry out investigations at the frontiers of supramolecular, co-ordination and acid/base chemistry.
Conflicts of interest
A. C. and I. C. are employees of Bruker UK Ltd., manufacturer and supplier of NMR hard- and software solutions that have been used in this research. The other authors declare no competing interests.Acknowledgements
This work was supported by the Royal Society (UF160458 to U. H.), the EPSRC Dynamic Reaction Monitoring Facility at the University of Bath (EP/P001475/1), and Bruker UK Ltd (CASE studentship to D. B.). The authors would like to thank Dr Dan Pantoş for useful discussions regarding supramolecular chemistry, Rachael Broomfield-Tagg for advice on FLP chemistry, and Dr David Liptrot for the original suggestion that led to this work.References
- P. D. Beer and P. A. Gale, Angew. Chem., Int. Ed., 2001, 40, 486–516 CrossRef CAS.
- M. Boiocchi, L. Del Boca, D. E. Gómez, L. Fabbrizzi, M. Licchelli and E. Monzani, J. Am. Chem. Soc., 2004, 126, 16507–16514 CrossRef CAS PubMed.
- M. P. Williamson, Prog. Nucl. Magn. Reson. Spectrosc., 2013, 73, 1–16 CrossRef CAS PubMed.
- L. Rocchigiani, G. Ciancaleoni, C. Zuccaccia and A. Macchioni, J. Am. Chem. Soc., 2014, 136, 112–115 CrossRef CAS PubMed.
- G. Platzer, M. Okon and L. P. McIntosh, J. Biomol. NMR, 2014, 60, 109–129 CrossRef CAS PubMed.
- G. Hägele, Molecules, 2019, 24, 3238 CrossRef PubMed.
- R. Shivapurkar and D. Jeannerat, Anal. Methods, 2011, 3, 1316–1322 RSC.
- K. Nikitin and R. O'Gara, Chem. – Eur. J., 2019, 25, 4551–4589 CrossRef CAS PubMed.
- E. Vinogradov, A. D. Sherry and R. E. Lenkinski, J. Magn. Reson., 2013, 229, 155–172 CrossRef CAS PubMed.
- P. Groves, Polym. Chem., 2017, 8, 6700–6708 RSC.
- L. Avram and Y. Cohen, Chem. Soc. Rev., 2015, 44, 586–602 RSC.
- G. S. Kapur, E. J. Cabrita and S. Berger, Tetrahedron Lett., 2000, 41, 7181–7185 CrossRef CAS.
- J. J. H. Ackerman, G. E. Soto, W. M. Spees, Z. Zhu and J. L. Evelhoch, Magn. Reson. Med., 1996, 36, 674–683 CrossRef CAS PubMed.
- J. Bezencon, M. B. Wittwer, B. Cutting, M. Smiesko, B. Wagner, M. Kansy and B. Ernst, J. Pharm. Biomed. Anal., 2014, 93, 147–155 CrossRef CAS PubMed.
- M. Fais, C. Schwarz and F. C. Leinweber, Chem. Ing. Tech., 2016, 88, 793–797 CrossRef CAS.
- A. A. Bedermann, T. A. McTeague and T. F. Jamison, Org. Process Res. Dev., 2019, 23, 278–282 CrossRef CAS.
- Schmidt-Haensch, On-line Titration, https://schmidt-haensch.com/product/on-line-titration/, (accessed 22/12/2021, 2021) Search PubMed.
- E. A. G. Zagatto and F. R. P. Rocha, Talanta, 2021, 233, 122479 CrossRef CAS PubMed.
- G. Hägele, Bruker NMR Guide Collection, 2002 Search PubMed.
- G. Hägele, Z. Szakács, J. Ollig, S. Hermens and C. Pfaff, Heteroat. Chem., 2000, 11, 562–582 CrossRef.
- P. Hentschel, K. Holtin, L. Steinhauser and K. Albert, Chirality, 2012, 24, 1074–1076 CrossRef CAS PubMed.
- D. B. G. Berry, A. Codina, I. Clegg, C. L. Lyall, J. P. Lowe and U. Hintermair, Faraday Discuss., 2019, 220, 45–57 RSC.
- A. Bara-Estaún, C. L. Lyall, J. P. Lowe, P. G. Pringle, P. C. J. Kamer, R. Franke and U. Hintermair, Faraday Discuss., 2021, 229, 422–442 RSC.
- A. Saib, A. Bara-Estaún, O. J. Harper, D. B. G. Berry, I. A. Thomlinson, R. Broomfield-Tagg, J. P. Lowe, C. L. Lyall and U. Hintermair, React. Chem. Eng., 2021, 6, 1548–1573 RSC.
- N. Zientek, K. Meyer, S. Kern and M. Maiwald, Chem. Ing. Tech., 2016, 88, 698–709 CrossRef CAS.
- A. M. R. Hall, J. C. Chouler, A. Codina, P. T. Gierth, J. P. Lowe and U. Hintermair, Catal. Sci. Technol., 2016, 6, 8406–8417 RSC.
- A. Krȩżel and W. Bal, J. Inorg. Biochem., 2004, 98, 161–166 CrossRef PubMed.
- A. V. Rayer, K. Z. Sumon, L. Jaffari and A. Henni, J. Chem. Eng. Data, 2014, 59, 3805–3813 CrossRef CAS.
- A. Kütt, S. Selberg, I. Kaljurand, S. Tshepelevitsh, A. Heering, A. Darnell, K. Kaupmees, M. Piirsalu and I. Leito, Tetrahedron Lett., 2018, 59, 3738–3748 CrossRef.
- E. Rossini, A. D. Bochevarov and E. W. Knapp, ACS Omega, 2018, 3, 1653–1662 CrossRef CAS PubMed.
- C. Reichardt, in Solvents and Solvent Effects in Organic Chemistry, ed. C. Reichardt, Wiley-VCH Verlag GmbH & Co. KGaA, 3rd edn, 2002, pp. 93–145 Search PubMed.
- B. G. Cox, Acids and Bases: Solvent Effects on Acid-Base Strength, OUP Oxford, 2013 Search PubMed.
- S. Tshepelevitsh, A. Kütt, M. Lõkov, I. Kaljurand, J. Saame, A. Heering, P. G. Plieger, R. Vianello and I. Leito, Eur. J. Org. Chem., 2019, 2019, 6735–6748 CrossRef CAS.
- Y. Fujii, H. Yamada and M. Mizuta, J. Phys. Chem., 1988, 92, 6768–6772 CrossRef CAS.
- L. L. Kimtys and V. J. Balevičius, Adv. Mol. Relax. Interact. Processes, 1979, 15, 151–161 CrossRef CAS.
- D. Lengvinaitė, K. Aidas and L. Kimtys, Phys. Chem. Chem. Phys., 2019, 21, 14811–14820 RSC.
- P. Krishnakumar and D. K. Maity, Comput. Theor. Chem., 2017, 1099, 185–194 CrossRef CAS.
- L. Pu, Y. Sun and Z. Zhang, J. Phys. Chem. A, 2009, 113, 6841–6848 CrossRef CAS PubMed.
- K. Rothermel, M. Žabka, J. Hioe and R. M. Gschwind, J. Org. Chem., 2019, 84, 13221–13231 CrossRef CAS PubMed.
- T. A. To, C. Pei, R. M. Koenigs and T. V. Nguyen, Angew. Chem., Int. Ed., 2022, 61, e202117366 Search PubMed.
- M. Fleischmann, D. Drettwan, E. Sugiono, M. Rueping and R. M. Gschwind, Angew. Chem., Int. Ed., 2011, 50, 6364–6369 CrossRef CAS PubMed.
- D. W. C. Macmillan, Nature, 2008, 455, 304–308 CrossRef CAS PubMed.
- A. G. Doyle and E. N. Jacobsen, Chem. Rev., 2007, 107, 5713–5743 CrossRef CAS PubMed.
- K. Rothermel, M. Melikian, J. Hioe, J. Greindl, J. Gramüller, M. Žabka, N. Sorgenfrei, T. Hausler, F. Morana and R. M. Gschwind, Chem. Sci., 2019, 10, 10025–10034 RSC.
- N. Sorgenfrei, J. Hioe, J. Greindl, K. Rothermel, F. Morana, N. Lokesh and R. M. Gschwind, J. Am. Chem. Soc., 2016, 138, 16345–16354 CrossRef CAS PubMed.
- K. Kaupmees, I. Kaljurand and I. Leito, J. Phys. Chem. A, 2010, 114, 11788–11793 CrossRef CAS PubMed.
- T. D. W. Claridge, in High-Resolution NMR Techniques in Organic Chemistry (Third Edition), ed. T. D. W. Claridge, Elsevier, Boston, 2016, pp. 11–59 Search PubMed.
- C. Reichardt, in Solvents and Solvent Effects in Organic Chemistry, ed. C. Reichardt, Wiley-VCH Verlag GmbH & Co. KGaA, 3rd edn, 2002, pp. 471–507 Search PubMed.
- A. Kütt, S. Tshepelevitsh, J. Saame, M. Lõkov, I. Kaljurand, S. Selberg and I. Leito, Eur. J. Org. Chem., 2021, 2021, 1407–1419 CrossRef.
- M. Arai, J. C. Ferreon and P. E. Wright, J. Am. Chem. Soc., 2012, 134, 3792–3803 CrossRef CAS PubMed.
- H. J. Dyson and P. E. Wright, J. Biomol. NMR, 2019, 73, 651–659 CrossRef CAS PubMed.
- E. Kupče and R. Freeman, Magn. Reson. Chem., 2007, 45, 2–4 CrossRef PubMed.
- M. J. Mayoral, N. Bilbao and D. González-Rodríguez, ChemistryOpen, 2016, 5, 10–32 CrossRef CAS PubMed.
- M. J. Langton, C. J. Serpell and P. D. Beer, Angew. Chem., Int. Ed., 2016, 55, 1974–1987 CrossRef CAS PubMed.
- G. Jakab, C. Tancon, Z. Zhang, K. M. Lippert and P. R. Schreiner, Org. Lett., 2012, 14, 1724–1727 CrossRef CAS PubMed.
- P. Thordarson, Chem. Soc. Rev., 2011, 40, 1305–1323 RSC.
- S. J. Connon, Chem. Commun., 2008, 2499–2510 RSC.
- P. R. Schreiner, Chem. Soc. Rev., 2003, 32, 289 RSC.
- Z. Zhang, Z. Bao and H. Xing, Org. Biomol. Chem., 2014, 12, 3151–3162 RSC.
- J. Paradies, Coord. Chem. Rev., 2019, 380, 170–183 CrossRef CAS.
- A. Karkamkar, K. Parab, D. M. Camaioni, D. Neiner, H. Cho, T. K. Nielsen and T. Autrey, Dalton Trans., 2013, 42, 615–619 RSC.
- U. Mayer, V. Gutmann and W. Gerger, Monatsh. Chem., 1975, 106, 1235–1257 CrossRef CAS.
- V. Gutmann, Coord. Chem. Rev., 1976, 18, 225–255 CrossRef CAS.
- M. A. Beckett, D. S. Brassington, S. J. Coles and M. B. Hursthouse, Inorg. Chem. Commun., 2000, 3, 530–533 CrossRef CAS.
- M. A. Beckett, D. S. Brassington, M. E. Light and M. B. Hursthouse, J. Chem. Soc., Dalton Trans., 2001, 1768–1772 RSC.
- S. J. Geier and D. W. Stephan, J. Am. Chem. Soc., 2009, 131, 3476–3477 CrossRef CAS PubMed.
- J. R. Lawson and R. L. Melen, in Organometallic Chemistry: Volume 41, The Royal Society of Chemistry, 2017, vol. 41, pp. 1–27 Search PubMed.
- J. L. Carden, A. Dasgupta and R. L. Melen, Chem. Soc. Rev., 2020, 49, 1706–1725 RSC.
- J. R. Lawson and R. L. Melen, Inorg. Chem., 2017, 56, 8627–8643 CrossRef CAS PubMed.
- T. Beringhelli, D. Donghi, D. Maggioni and G. D'Alfonso, Coord. Chem. Rev., 2008, 252, 2292–2313 CrossRef CAS.
- F. Focante, P. Mercandelli, A. Sironi and L. Resconi, Coord. Chem. Rev., 2006, 250, 170–188 CrossRef CAS.
- M. A. Vargas, M. Cudaj, K. Hailu, K. Sachsenheimer and G. Guthausen, Macromolecules, 2010, 43, 5561–5568 CrossRef CAS.
- M. Goldbach, E. Danieli, J. Perlo, B. Kaptein, V. M. Litvinov, B. Blümich, F. Casanova and A. L. L. Duchateau, Tetrahedron Lett., 2016, 57, 122–125 CrossRef CAS.
- D. A. Foley, C. W. Doecke, J. Y. Buser, J. M. Merritt, L. Murphy, M. Kissane, S. G. Collins, A. R. Maguire and A. Kaerner, J. Org. Chem., 2011, 76, 9630–9640 CrossRef CAS PubMed.
- J. Y. Buser and A. D. McFarland, Chem. Commun., 2014, 50, 4234–4237 RSC.
- S. T. Knox, S. Parkinson, R. Stone and N. J. Warren, Polym. Chem., 2019, 10, 4774–4778 RSC.
- A. M. R. Hall, D. B. G. Berry, J. N. Crossley, A. Codina, I. Clegg, J. P. Lowe, A. Buchard and U. Hintermair, ACS Catal., 2021, 11, 13649–13659 CrossRef CAS PubMed.
- K. Hirose, J. Inclusion Phenom. Macrocyclic Chem., 2001, 39, 193–209 CrossRef CAS.
- L. Rocchigiani, Isr. J. Chem., 2015, 55, 134–149 CrossRef CAS.
- D. W. Stephan and G. Erker, Angew. Chem., Int. Ed., 2010, 49, 46–76 CrossRef CAS PubMed.
- D. W. Stephan and G. Erker, Angew. Chem., Int. Ed., 2015, 54, 6400–6441 CrossRef CAS PubMed.
- D. W. Stephan, J. Am. Chem. Soc., 2015, 137, 10018–10032 CrossRef CAS PubMed.
- S. Mukherjee and P. Thilagar, J. Chem. Sci., 2015, 127, 241–255 CrossRef CAS.
- N. Li and W. X. Zhang, Chin. J. Chem., 2020, 38, 1360–1370 CrossRef CAS.
- S. J. Geier, A. L. Gille, T. M. Gilbert and D. W. Stephan, Inorg. Chem., 2009, 48, 10466–10474 CrossRef CAS PubMed.
- R. J. Mayer, N. Hampel and A. R. Ofial, Chem. – Eur. J., 2021, 27, 4070–4080 CrossRef CAS PubMed.
- E. Follet, H. Zipse, S. Lakhdar, A. Ofial and G. Berionni, Synthesis, 2017, 49, 3495–3504 CrossRef CAS.
- D. Wu, D. Jia, L. Liu, L. Zhang and J. Guo, J. Phys. Chem. A, 2010, 114, 11738–11745 CrossRef CAS PubMed.
- C. Narayanan, D. N. Bernard, K. Bafna, D. Gagné, P. K. Agarwal and N. Doucet, Front. Mol. Biosci., 2018, 5, 54 CrossRef PubMed.
- J. T. Sheff, A. L. Lucius, S. B. Owens and G. M. Gray, Organometallics, 2011, 30, 5695–5709 CrossRef CAS.
- L. Helm, Coord. Chem. Rev., 2008, 252, 2346–2361 CrossRef CAS.
- Y. Ben-Tal, P. J. Boaler, H. J. A. Dale, R. E. Dooley, N. A. Fohn, Y. Gao, A. García-Domínguez, K. M. Grant, A. M. R. Hall, H. L. D. Hayes, M. M. Kucharski, R. Wei and G. C. Lloyd-Jones, Prog. Nucl. Magn. Reson. Spectrosc., 2022, 129, 28–106 CrossRef CAS PubMed.
- A. Sen and T.-W. Lai, J. Am. Chem. Soc., 1981, 103, 4627–4629 CrossRef CAS.
- T. W. Lai and A. Sen, Organometallics, 1984, 3, 866–870 CrossRef CAS.
- S. Carrasco and B. Martín-Matute, Eur. J. Inorg. Chem., 2019, 2019, 1951–1955 CrossRef CAS.
- B. Gouilleux, L. Rouger and P. Giraudeau, in Annual Reports on NMR Spectroscopy, ed. G. A. Webb, Academic Press, 2018, vol. 93, pp. 75–144 Search PubMed.
- C. Jacquemmoz, F. Giraud and J.-N. Dumez, Analyst, 2020, 145, 478–485 RSC.
- M. Tabatabaei Anaraki, R. Dutta Majumdar, N. Wagner, R. Soong, V. Kovacevic, E. J. Reiner, S. P. Bhavsar, X. Ortiz Almirall, D. Lane, M. J. Simpson, H. Heumann, S. Schmidt and A. J. Simpson, Anal. Chem., 2018, 90, 7912–7921 CrossRef CAS PubMed.
- K. Zangger, Prog. Nucl. Magn. Reson. Spectrosc., 2015, 86–87, 1–20 CrossRef CAS PubMed.
- S. H. Smallcombe, S. L. Patt and P. A. Keifer, J. Magn. Reson., Ser. A, 1995, 117, 295–303 CrossRef CAS.
- P. Kiraly, N. Kern, M. P. Plesniak, M. Nilsson, D. J. Procter, G. A. Morris and R. W. Adams, Angew. Chem., Int. Ed., 2021, 60, 666–669 CrossRef CAS PubMed.
- A. M. R. Hall, P. Dong, A. Codina, J. P. Lowe and U. Hintermair, ACS Catal., 2019, 9, 2079–2090 CrossRef CAS.
- Nanalysis, NMReady-flow, https://www.nanalysis.com/nmready-flow, (accessed 01/06/2021).
- Magritek, Reaction Monitoring, https://magritek.com/applications/reaction-monitoring/.
- O. Instruments, Benchtop NMR Spectrometer X-Pulse, https://nmr.oxinst.com/x-pulse, (accessed 01/06/2021).
- Y. Chae, S. Min, E. Park, C. Lim, C.-H. Cheon, K. Jeong, K. Kwak and M. Cho, Anal. Chem., 2021, 93, 2106–2113 CrossRef CAS PubMed.
- M. Wallace, J. A. Iggo and D. J. Adams, Soft Matter, 2015, 11, 7739–7747 RSC.
- M. Wallace, D. J. Adams and J. A. Iggo, Anal. Chem., 2018, 90, 4160–4166 CrossRef CAS PubMed.
- Y. Mitrev, S. Simova and D. Jeannerat, Chem. Commun., 2016, 52, 5418–5420 RSC.
- T. Niklas, D. Stalke and M. John, Chem. Commun., 2015, 51, 1275–1277 RSC.
Footnotes |
| † Electronic supplementary information (ESI) available. See DOI: https://doi.org/10.1039/d2re00123c |
| ‡ Recent developments in NMR titrations have introduced the use of pH gradients along a single sample tube in combination with slice-selective acquisitions, however, these experiments require careful control of temperature and composition, and are based on the use of indicator compounds.107–110 |
| § The review of NMR-controlled titrations (ref. 14) is found in the NMR guide as part of Topspin™ NMR processing software. It can be found in the tutorials section under the heading ‘Part V: NMR Titration’. |
| ¶ A discussion of tubing materials, pumps, and thermal control in these FlowNMR setups and their effect on the acquisition of NMR data can be found in previous literature.24 |
| || OH peak shifts were apparent in the spectra of toluene and acetonitrile. Peak intensity in THF was too low for plotting but was observable and traceable in the stack plot (Fig. S13†). |
| ** Times and volumes were quoted for a 31P NMR titration on a 200 MHz installation, exact titration conditions were not given for the Leu-Ala example but are presumed to be of the same magnitude.19 |
| This journal is © The Royal Society of Chemistry 2022 |

