 Open Access Article
Creative Commons Attribution 3.0 Unported Licence
Continuous stirred-tank reactor cascade platform for self-optimization of reactions involving solids†
Kakasaheb Y.
Nandiwale
 a,
Travis
Hart
a,
Andrew F.
Zahrt
a,
Travis
Hart
a,
Andrew F.
Zahrt
 a,
Anirudh M. K.
Nambiar
a,
Prajwal T.
Mahesh
a,
Yiming
Mo
a,
Anirudh M. K.
Nambiar
a,
Prajwal T.
Mahesh
a,
Yiming
Mo
 a,
María José
Nieves-Remacha
 b,
Martin D.
Johnson
 c,
Pablo
García-Losada
 b,
Carlos
Mateos
 b,
Juan A.
Rincón
 b and
Klavs F.
Jensen
 *a
*a
aDepartment of Chemical Engineering, Massachusetts Institute of Technology, 77 Massachusetts Avenue, Cambridge, Massachusetts 02139, USA. E-mail: kfjensen@mit.edu
bCentro de Investigación Lilly S.A., Avda. de la Industria 30, Alcobendas-Madrid 28108, Spain
cSmall Molecule Design and Development, Eli Lilly and Company, Indianapolis, Indiana 46285, USA
First published on 30th March 2022
Abstract
Continuous manufacturing of pharmaceuticals and fine chemicals is attractive due to its small physical footprint, consistent product quality, and demonstrated benefits from safety, economic, and environmental perspectives. However, handling solids in research-scale flow reactors creates hurdles, as the solids often lead to reactor channel clogging. To tackle this problem, we present a continuous stirred-tank reactor (CSTR) cascade that can handle slurries/solids during a chemical transformation in flow. Additionally, the design includes a light emitting photo diode (LED) array with photon flux characterized by chemical actinometry. We employ mixed-integer nonlinear programming (MINLP) and Bayesian optimization algorithms for single and multi-objective optimization, respectively. We demonstrate the autonomous optimization of three multiphase catalytic reactions of synthetic importance involving solid substrates, catalysts, and inorganic bases in an automated flow platform comprising a CSTR cascade, newly developed photoreactor, slurries feeding pumps, and an online process analytical technology (PAT). The two first case studies involve MINLP optimization of yield for a Pd-catalyzed Suzuki–Miyaura cross-coupling reaction involving both solid substrates and catalyst for the synthesis of an advanced intermediate, and a metallaphotoredox-catalyzed sp3–sp3 cross-coupling of carboxylic acids with alkyl halides in the presence of solid inorganic base. The third study presents Bayesian multi-objective optimization of a diastereoselective, metallaphotoredox cross-coupling reaction between trans-4-hydroxy proline and 4-bromoacetophenone for which both yield and amount of the trans isomer were optimized while handling potential formation of a solid product.
Introduction
Reaction optimization in organic synthesis is traditionally time consuming with repetitive tasks and exhaustive experimentation. Owing to the numerous reaction parameters tunable in chemical systems, mathematically-guided optimization protocols are an attractive alternative to intuition-guided or one-parameter-at-a-time approaches to optimization.1–6 One particularly promising avenue of research is pairing these mathematically-guided optimization approaches with automated flow experimentation systems.7–17 Flow reactors are an enabling technology for accessing an expanded reaction space (e.g., elevated temperatures and pressures for intensification) and facilitating photochemistry.18–25 Additionally, integration of analytical techniques and controls of reactions conditions produces closed-loop systems that, when paired with an optimization protocol, enable automatic selection and evaluation of new sets of reaction conditions based on prior data.4,26–41 Such systems have the potential to reduce the burden of repeated manual experiments for optimization, allowing time for more creative tasks.A significant limitation of such flow platforms based on tubular reactors is clogging of narrow channels due to the incompatibility of insoluble reaction components.42 Typically, when adapting a reaction protocol developed in batch for a flow system, it is common to replace solid reagents with soluble components, but such modifications can be sub-optimal for the chemistry of interest. As such, it would be preferable to develop flow platforms that tolerate solids, such as insoluble bases or precipitates formed as reactions progress. One method by which this has been achieved is by using a continuous stirred-tank reactor (CSTR) cascade,24,43–45 which have achieved long continuous run times and good mixing for heterogeneous mixtures.46–48 Alternative strategies include acoustic irradiation,49–51 continuous oscillatory baffled reactors (COBRs),24,52–54 and oscillatory flow reactor (OFR).55,56
Herein we report an automated CSTR cascade flow platform capable of leveraging a number of automated optimization protocols along with three case studies demonstrating handling of solid catalysts and bases, as well as precipitates formed during reaction. Additionally, automated single- and multi-objective optimization routines using mixed-integer nonlinear program (MINLP) and Bayesian optimization algorithms are employed. In particular we use two case studies to demonstrate MINLP optimization of yield for (1) a Pd-catalyzed Suzuki–Miyaura cross-coupling reaction involving both solid substrates and catalyst for the synthesis of an advanced intermediate, and (2) a metallaphotoredox-catalyzed sp3–sp3 cross-coupling of carboxylic acids with alkyl halides in the presence of different solid inorganic bases. The third study takes advantage of Bayesian multi-objective optimization to find optimum conditions for achieving high yield and amount of the trans-isomer for a diastereoselective, metallaphotoredox cross-coupling reaction between trans-4-hydroxy proline and 4-bromoacetophenone in which solid product can be formed.
Design, fabrication, and operation of the automated optimization platform
Design, fabrication, and characterization of photoreactor
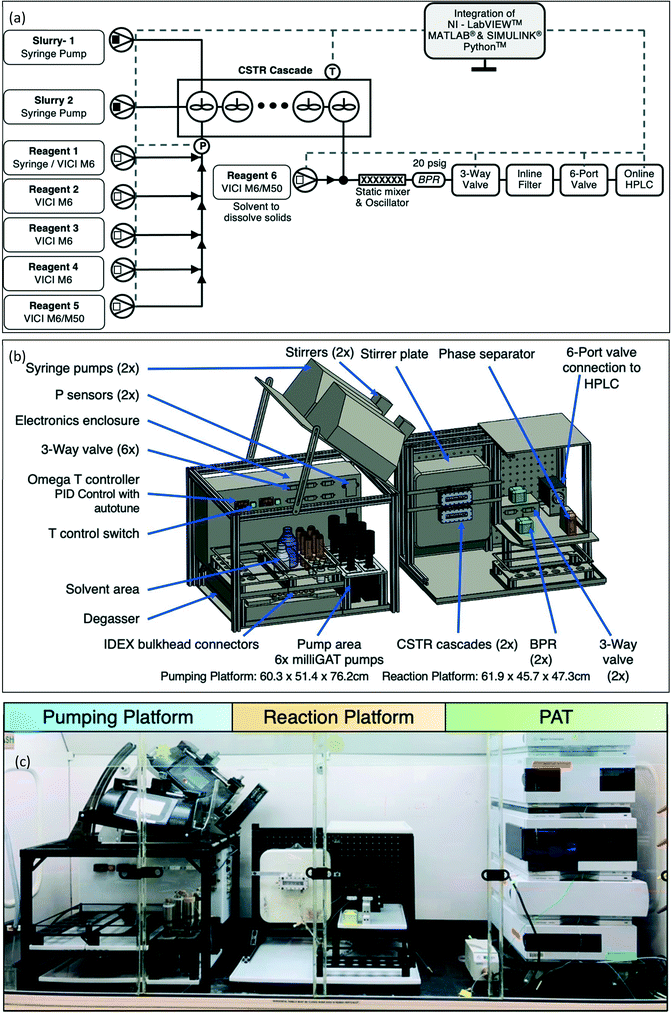
The CSTR cascade reactor consists of five CSTR wells in series (∼5.3 mL total volume). (Fig. 1 and S1†).47,48 Each well houses a small stir bar, spun by a magnetic stirrer behind the reactor, allowing for high solid content slurries to move through the system. A pair of 65 W cartridge heaters work with K-type thermocouples to regulate reactor temperature. For the CSTR cascade geometry, we designed and fabricated a new light emitting diode (LED) array for photochemical reactions and a thermoelectric cooler to control temperature (Fig. 1).57,58 The LED consists of three, 1.5 W, 455 nm blue LEDs placed in front of each CSTR cascade well to maximize the absorbed photon flux. Chemical actinometry was performed to measure the actual absorbed photon flux in a specific reactor volume (details in ESI†). When compared with a more traditional approach to photochemistry,48 utilizing large 40 W LED, the photoreactor with LED array design matched or exceeded performance as characterized by absorbed photon flux (Table S1†). A Peltier on the backside of the CSTR cascade offset the heating generated by the array of LED lights adjacent to the reactor. This addition allowed for the operation of the CSTR cascade at temperatures as low as 17 °C, while operating the photoreactor at full LED power (Fig. S1 and Table S2†).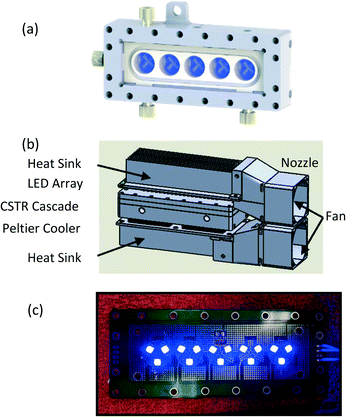 | ||
| Fig. 1 (a) Schematic of cascade CSTR reactor. (b) Schematic of photoreactor with LED array and Peltier (thermoelectric) cooler, and (c) LED array, diode placement. CAD design, and (c) actual system. | ||
Design and fabrication of automated optimization platform
In order to develop the platform, we started by constructing a system in a fume hood based on the individual process units (Fig. S2†), the experiences gained informed the development of the new automated reaction optimization platform (Fig. 2). The final system integrated two platforms built within a hard-coat anodized aluminum substructure, (1) a pumping and control platform (60.3 × 51.4 × 76.2 cm, height variable based on pump angle) and (2) a reaction platform (61.9 × 45.7 × 47.3 cm). The system designed was compact enough to fit inside standard fume hood.LabVIEW (National Instrument, NI ver. 19.0.1f3), MATLAB and SIMULINK (MathWorks, Inc., ver. R2019a), and Python were used to control all the hardware and perform the optimization campaign. The LabVIEW software was designed and written in-house for the purpose of on-demand reaction optimization, with the exception of some drivers provided from NI or supplier (Fig. S3 and S4†). Control and monitoring of the system were performed through USB communication with the control unit at the back side of the pumping platform. NI data acquisition (MCC DAQs) devices and serial to USB converters facilitated effective communication with the user's LabVIEW user interface. The control unit also provided power to all components on the pumping and reaction platforms, including motor controllers, three-way valves, LED array, CSTR cartridge heaters, temperature controllers, the selector valve, and line vibrators. The LabVIEW routine comprised a central virtual instrument (VI) that executed simultaneous loops for automated design of experiments (DoE) based on MINLP, flow rate manipulation, online monitoring, temperature control, HPLC sampling, HPLC analysis, and optimization (Fig. S5†).
The pumping platform consisted of pumps, temperature control, pressure transducers, reagent storage, degasser storage, three-way valves, and hardware controls. The external hardware components were powered from the control box at the back of the pumping platform and process analytical technology (PAT) passed data back to the LabVIEW user interface through the control box. Two types of pumps were housed on the platform, (1) six positive displacement pumps (Vici Valco M6/M50) and (2) two syringe pumps (Harvard Apparatus PhD Ultra).
The positive displacement pumps served as an all-purpose component for flow chemistry applications, utilizing a ceramic rotor and polytetrafluoroethylene (PTFE) cross-linked stator for excellent chemical compatibility. These pumps were able to deliver liquids from ∼5 nL min−1 to ∼5 mL min−1 up to ∼17.5 bar for over one million cycles. In the current platform, the number of these pumps dictate the number of discrete variables accessible in optimization campaigns. In future iterations, this number can be significantly increased by incorporating a selector valve between the pumps and reagent vials. The syringe pumps on the system allowed for the handling of slurry solutions in the system. The syringe pumps were mounted are on a variable angle shelf along with the magnetic tumbler/stirrers (V&P Scientific VP 710D3-4) and PTFE coated magnetic stir bars inside the syringe, which kept solids suspended in the solution inside the syringes. Moreover, enhanced transport of slurries, while avoiding clogging was accomplished by attaching an oscillator (Precision Microdrives 306-10H) at the connecting tube between the syringe and the CSTR cascade.47 This approach to delivering and handling slurries was based on our initial experience with optimization of Suzuki–Miyaura cross-coupling with solid substrates (discussed in the Results section). Proportional-integral-derivative (PID) temperature control (omega engineering) and inline pressure monitoring (DJ instruments) were part of the control unit on the pumping platform.
The reaction platform consisted of the CSTR cascade, stir plate, back pressure regulators (BPRs), three-way valves, and six-port two position valve. The combination of the three-way valve and six-port two position valve controlled by LabVIEW allowed for automated sampling and online HPLC analysis (Fig. S6†). Specifically, upon exiting the reactor the reaction mixture was diluted with solvent (the identity of which depends on the specific reaction) to solubilize bulk solids via a T-connection. This mixture was passed through a static mixer, which aids to dissolve solids and avoids clogging in the outlet tubes. The LabVIEW automation controls the openings of 3-way valve to the mixture then passed through an inline filter prior to reaching the sample loop in the 6-port 2-position valve leading to the HPLC. For further details, including system start-up and operation, please see the ESI.†
Optimization methods
In order to simultaneously optimize both continuous (e.g., temperature, residence time, reagent concentration, and LED brightness) and discrete (e.g., catalysts and bases) process variables, we employed a previously reported MINLP algorithm in MATLAB and SIMULINK59–61 as well as the open-source Bayesian optimization package, Dragonfly62,63 The MINLP algorithm is based on optimal design of experiments (DoE) and the sequential response surface method (RSM). In the initialization phase, the algorithm generates a D-optimal experimental design with diversified variable settings to conduct an efficient initial scan of the design space. The results from these initial experiments are used to fit a quadratic response surface model using least squares regression for the optimization objective (e.g., yield) as a function of the continuous variables for each discrete variable candidate. In each round of the refinement phase, the algorithm generates a G-optimal experiment for each discrete variable candidate where the goal is to minimize the model's uncertainty at the predicted optimum objective function value (yield). Discrete variable candidates with relatively low or poor performance are dropped/fathomed during the subsequent refinement iterations if their maximum predicted objective function value is below the lower bound of the 99% confidence interval of the optimum predicted objective function value. The algorithm sequentially updates the models after each round of refinement experiments and gradually narrows the pool of discrete candidates until a convergence criterion (three successive experiments without objective function value improvement greater than 1%) is met (the ESI† has further details about the automated optimization system including planning of optimization campaign, automated design of experiments, automated sampling, online analysis, and response surface models).The Dragonfly62,63 open-source Bayesian optimization package constructs a Gaussian process surrogate model to describe the relationship between input variables and objective functions. Both continuous and discrete variables can be defined in the optimization domain. In the initialization phase, a space-filling design of experiments is generated by using Latin hypercube sampling (LHS) for continuous variables and random sampling for discrete variables. Once the initialization results are returned to the algorithm, either the upper confidence bound (UCB) or Thompson sampling (TS) acquisition functions are selected (with equal probability) to generate each refinement experiment. These acquisition functions balance an exploitative strategy (query regions where the output is expected to be high) with an explorative one (query regions where uncertainty is high) to help ensure that globally optimal points are found.62,63 In multi-objective optimization, the goal is to identify Pareto optimal points that represent the trade-off between potentially conflicting objectives.3 To find multiple Pareto optimal points, Dragonfly employs a random scalarization strategy, where different weights (relative importance) for each objective are sampled at each refinement iteration and the weighted sum is maximized.63 To assess algorithm convergence, the hypervolume indicator was utilized.3 For a two-objective optimization, the hypervolume corresponds to the area enclosed by the current Pareto points.
Results and discussion
Optimization of a Suzuki–Miyaura cross-coupling involving solid substrates and catalyst
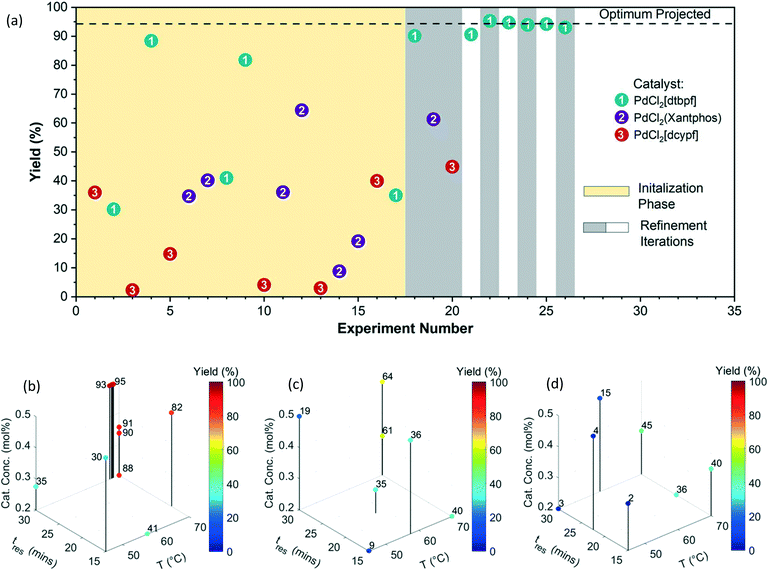
A Pd-catalyzed Suzuki–Miyaura cross-coupling reaction involving both solid substrates (1 and 2) and catalyst (ID 3) for the synthesis of an advanced merestinib fragment was chosen as the first demonstration example (Fig. 3).2 The automated optimization campaign was performed on the initial test optimization platform (Fig. S2†) with the goal of maximizing the yield of product 3 with respect to discrete variables (the Pd precatalyst with three possible ligands) and three continuous variables (catalyst concentration, temperature, and residence time). The corresponding quadratic response surface model involved 14 model parameters; consequently, the MINLP algorithm proposed a D-optimal DoE of 17 experiments for the initialization phase involving 3 extra experiments to ensure that the number of data points exceeds the number of parameters [Table S3,†Fig. 4(a)]. During the initialization phase (yellow block), 17 initial D-optimal experiments were divided about roughly equally by the algorithm among the three catalyst candidates. The continuous variable settings in the initial D-optimal design were diversified combinations of low, medium, and high values with midpoint evaluations permitting the estimation of curvature in the yield surface. Catalyst 1 (PdCl2[dtbpf]) exhibited the highest yield of 3 (∼30 to ∼88%), followed by the catalysts 2 (∼9 to ∼64%), and 3 (∼2 to ∼40%).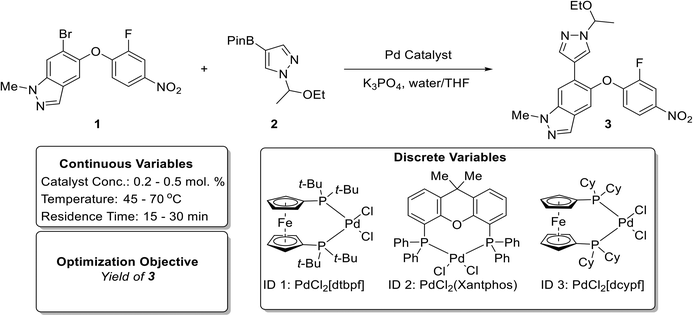 | ||
| Fig. 3 Reaction scheme (top) and optimization variables (bottom) for the Suzuki–Miyaura cross-coupling reaction example involving solid substrates and catalyst based on prior work by Cole et al.2 | ||
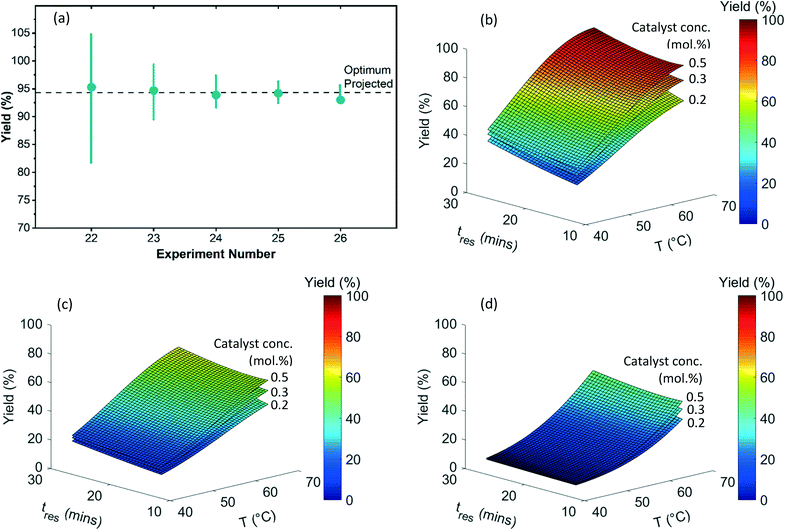
In the first refinement iteration (experiment number 18 to 20, first gray block containing 3 experiments), the algorithm proposed one experiment for each catalyst with similar conditions (0.3 mol% catalyst conc., 70 °C, and 30 minutes). The yields of 90%, 61%, and 45% going from the catalyst ID 1 to 3 confirmed the relative ranking observed during the initial experiments. For subsequent refinement iterations (alternating white and gray blocks), the algorithm fathomed the poor performing catalysts 2 and 3 from the consideration and focused on the highest performing catalyst 1. By increasing the catalyst concentration from 0.3 to 0.5 mol%, an optimum yield of ∼94% was achieved. Fig. 4(b–d) exhibits 3D plots with continuous variable values on the three axes and yield of 3 indicated by color. Fig. 5(a) focuses on the end of the campaign where the algorithm's predicted optimal yield converges and the 99% confidence interval gets progressively narrower as more data is collected close to the predicted optimum.
Fig. 5(b–d) shows the fitted quadratic response surface models for yields as a continuous function of temperature and residence time for each catalyst. The surfaces correspond to low (0.20 mol%), medium (0.35 mol%), and high (0.50 mol%) catalyst concentration. (Model parameters and their associated uncertainties can be found in Tables S4 and S5 in the ESI†). The response surface plots help to visualize the relative sensitivity of yield with respect to the continuous variables, with temperature having the greatest effect in this case. The ability to create mathematical models to quantitatively predict the reaction yield with good accuracy (for all three catalyst types) using a small number of efficiently designed experiments demonstrates the utility of this approach for achieving process understanding while decreasing the use of raw material and the number of experiments during process development.
Optimization of a photoredox reaction involving a solid inorganic base
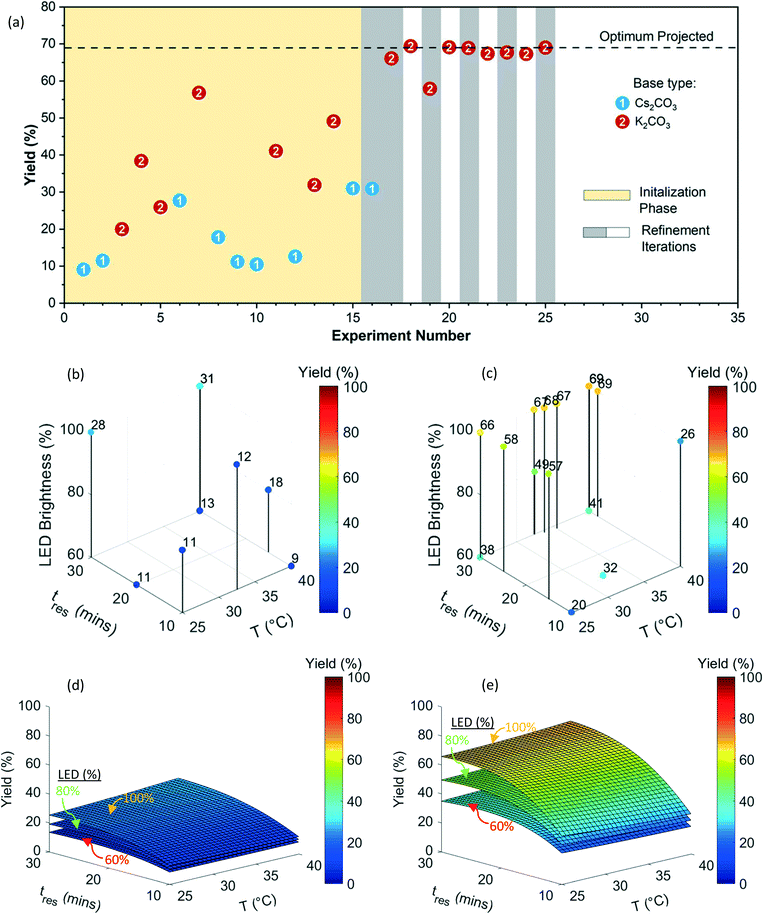
In order to demonstrate the heterogeneous photochemical reaction capability of the newly developed photoreactor (Fig. 1), and automated reaction optimization platform (Fig. 2), we chose metallaphotoredox-catalyzed sp3–sp3 cross-coupling of carboxylic acids with alkyl halides1 (Fig. 6) involving inorganic base slurries as the second case study. The optimization objective was to maximize yield of product 6 with respect to a discrete variable (two inorganic bases) and three continuous variables (residence time, temperature, and LED brightness). Fig. 7(a) shows the experimental yields of 6 obtained over the course of the optimization campaign with data points labeled by base (full details for each experiment can be found in ESI† Table S6). The quadratic response surface model involved 12 model parameters, and the initialization phase contained 15 D-optimal experiments [Fig. 7(a)].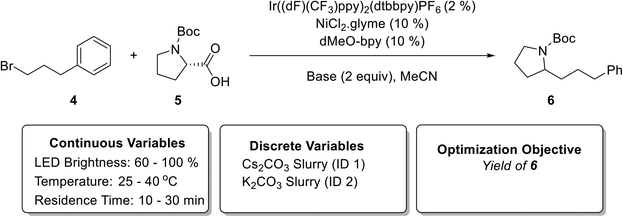 | ||
| Fig. 6 Metallaphotoredox-catalyzed sp3–sp3 cross-coupling of carboxylic acids with alkyl halides1 used in the second case study (top). Continuous and discrete optimization variables (bottom). | ||
Fig. 7(b and c) exhibits 3D plots with continuous variable values on the three axes and yield of 6 indicated by color. During the initialization phase (yellow block, experiment number 1 to 15) within the explored conditions, the K2CO3 (base 2) exhibited superior performance compared to Cs2CO3 (base 1). The first refinement iteration (experiment number 16 and 17, first gray block) confirmed that K2CO3 has a better performance than the Cs2CO3 and the algorithm focused on K2CO3 for the subsequent optimization campaign. After 25 total experiments, the algorithm predicted an optimum yield of 68.9 ± 4.7% at the following conditions 38.7 °C, 29.9 min, and 100% LED brightness (Fig. 7 and Table S6†).
Fig. 7(d and e) shows the quadratic response surface plots of the predicted yield of 6 for each base. The model parameters and their associated uncertainties can be found in the ESI† (Tables S7 and S8). Predicted yield is plotted on the vertical axis as a continuous function of temperature and residence time for each base, whereas different surfaces correspond to low (60%), medium (80%), and high (100%) LED power. In contrast to the previous Suzuki–Miyaura example, the temperature did not have much of an effect on yield of 6 with either base. Although longer residence time resulted in higher yield, increasing the LED power had the most significant effect on yield of 6, demonstrated by the roughly 10% spacing in yield between the surfaces for K2CO3. By extrapolating this trend, it seems likely that if the photon flux was increased beyond the maximum capacity of the LED array used in this study, higher yields would be achieved. However, it might lead to heat generation and it would demand higher capacity heat removal system. Although this was not pursued, it is worth mentioning that including LED power as a variable was beneficial since it highlighted the possibility of achieving higher yields for this reaction with LED array improvements.
Automated Bayesian optimization of multiphase diastereoselective metallaphotoredox cross-coupling
The newly developed automated optimization platform was further updated with integration of multi-objective Python-based Bayesian optimization package, Dragonfly,62–64 with LabVIEW. As a final case study, we chose to investigate the diastereoselective, metallaphotoredox cross-coupling reaction between trans-4-hydroxy proline and 4-bromoacetophenone (Fig. 8). This reaction was selected for numerous reasons, including: (1) in some solvents the reaction generates solids, further testing the capabilities of the automated platform, (2) the reaction has previously been investigated in flow, allowing direct comparison to the literature method,65 and (3) there are two outcomes to optimize, yield and diastereoselectivity, which necessitated the use of a multi-objective algorithm. In recent years, significant advances have been made in the development of multi-objective optimization algorithms66,67 and their application for automated reaction development.28,31,64,68 The Dragonfly Bayesian optimization package was chosen due to its ability to optimize multiple objectives and to handle both continuous and discrete variables.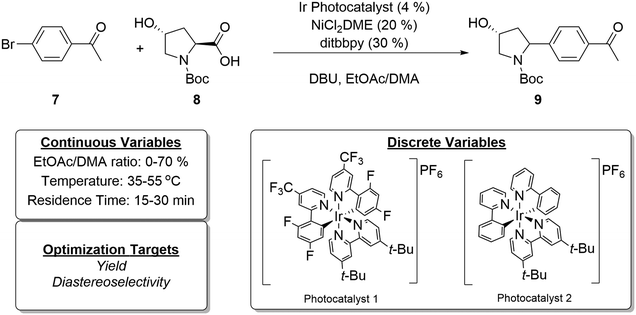 | ||
| Fig. 8 Model reaction for multi-objective Bayesian optimization (top) and optimization variables and objectives (bottom). | ||
At the outset of the Dragonfly Bayesian optimization, a number of discrete and continuous variables were defined, specifically, photocatalyst 1 and 2 were discrete variables, and residence time, temperature, and solvent mixture composition represented continuous variables (Fig. 8). The solvent mixture composition variable was defined as percent ethyl acetate in a mixture of ethyl acetate and dimethylacetamide (DMA). These solvents were selected with consideration given to a prior report in which DMA was determined as the optimal solvent for flow conditions.65 However, in the same study, preliminary batch reaction results indicated ethyl acetate might be a superior solvent but was not suitable for flow chemistry, owing to the formation of insoluble particulates over the course of the reaction. Because the developed experimental system in this report tolerates the formation of solids, examining this solvent was no longer problematic. Further, it was possible that tuning the solvent mixture could increase yield or diastereoselectivity. As such, the bounds of percent ethyl acetate were set from zero to 70%. The choice of nickel source, ligand, and base were kept consistent with previous studies.
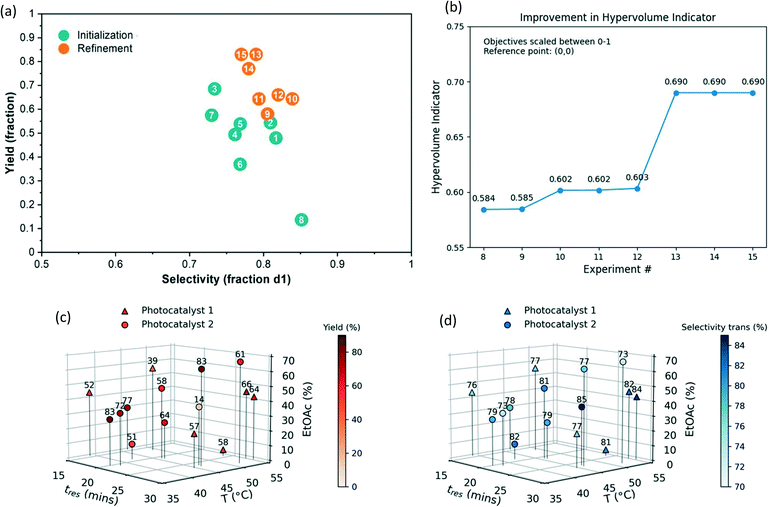
The optimization process proceeds first with the selection of initialization points. Continuous variable values are selected using Latin hypercube sampling, while discrete variable values are randomly sampled. The selection process was repeated until four initialization reactions with each photocatalyst 1 and 2 were included in the initial set. In this way, equal coverage over the discrete variables is obtained. The initial reaction conditions and reaction outcomes are tabulated in runs 1–8 of Table 1. In order to provide a convenient continuous output for diastereoselectivity (dr), it was converted to the percent trans-isomer formed, whereas yield refers to the total yield of both diastereomers.
| Initialization runs | Refinement runs | ||||||||||||||
|---|---|---|---|---|---|---|---|---|---|---|---|---|---|---|---|
| Run no. | 1 | 2 | 3 | 4 | 5 | 6 | 7 | 8 | 9 | 10 | 11 | 12 | 13 | 14 | 15 |
| Photocatalyst ID | 2 | 1 | 2 | 1 | 1 | 1 | 2 | 2 | 2 | 1 | 2 | 1 | 2 | 2 | 2 |
| Temperature (°C) | 41.3 | 52.8 | 37.1 | 38.3 | 43.7 | 48.1 | 50.8 | 45.5 | 44.9 | 54.2 | 45.1 | 54 | 36.1 | 45.6 | 45.3 |
| Residence time (min) | 19.8 | 25.1 | 21.6 | 15.3 | 27.7 | 17.4 | 29.1 | 27.0 | 21.6 | 28.7 | 21.9 | 27.7 | 20.8 | 15.2 | 27.5 |
| EtOAc (%) | 10.2 | 4.2 | 34.7 | 43.7 | 22.5 | 57.7 | 67.5 | 38.7 | 47.7 | 42.5 | 24.5 | 45.4 | 30.5 | 29.5 | 64.0 |
| Yield (%) | 50.7 | 57.5 | 72.5 | 52.3 | 57.0 | 39.1 | 60.8 | 14.4 | 58.0 | 64.0 | 64.3 | 66.0 | 83.0 | 77.0 | 83.0 |
| Selectivity (% trans) | 81.7 | 81.0 | 73.4 | 76.1 | 76.9 | 76.8 | 73.0 | 85.1 | 81.0 | 84.0 | 79.4 | 82.0 | 79.0 | 78.0 | 77.0 |
A number of interesting observations become evident upon examination of the initialization data. First, even at the outset of experimentation, higher yields were obtained with respect to the previous report, as observed in run 3. Second, it is clear that the multidimensional relationship governing how catalyst choice, solvent composition, reaction time, and temperature influence reaction outcome is not intuitive. For example, one would expect the diastereoselectivity to generally decrease as temperature increases. However, comparison of runs 1 and 2 with 3 and 4 defies this expectation, with reactions at higher temperature resulting in higher selectivity. It is likely that this is a result from the difference in solvent composition. Finally, when comparing runs 3 and 8, it is likely that an error occurred during run 8, as the reaction conditions are relatively too similar to reasonably account for the difference in reaction outcome. Rather than discarding or repeating these conditions, this run was left in to assess the tolerance of the optimization process to experimental error.
The refinement runs were executed using a batch size of 2 reactions. Notably, after completion of run 10, the next batch included two nearly identical reaction conditions within 1 unit of each other. In this case, only one condition was manually chosen and performed before selecting the next batch. This manual intervention can be automated by computing the distance between points to see if it falls below a certain threshold. The first four refinement runs (runs 9–12) select both catalysts, and it appears that a local maximum for catalyst 1 is identified in run 12. Run 13 discovers conditions which give higher yield but lower selectivity. To assess the convergence behaviour of the multi-objective algorithm, the hypervolume indicator (which corresponds to the area enclosed by the current Pareto points) was computed after each refinement experiment (Fig. 9b). While there was modest improvement during runs 9–12, the identification of Pareto optimal condition 13 led to a significant increase in the hypervolume. The optimization was terminated after run 15 since high-performing conditions that are likely sufficiently close to the true Pareto front had been identified within our experimental budget (Fig. S12†). Given the total quantity of the desired stereoisomer formed (i.e., yield x selectivity), condition 13 was selected as the optimal reaction conditions. Notably, the best reaction conditions (run 13) are very similar to the conditions evaluated in the erroneous reaction (run 8). Thus, despite this erroneous data point, the algorithm was still able to find a high-performing condition. This bodes well for future use of the algorithm, as it demonstrates robustness to error and noise arising from run-to-run reproducibility common to many optimization campaigns. This is clearly indicated when visualizing the results in a yield vs. selectivity plot (Fig. 9a). The initialization runs generally have lower yield and selectivity, whereas the refinement runs aggregate at the top right corner, optimally balancing yield and selectivity. To verify the conditions in run 13, the same reaction conditions were run for two residence times. The crude mixture was diluted with water, extracted with ethyl acetate, concentrated and purified to afford 252 mg of the desired product (78% yield) in 4![[thin space (1/6-em)]](https://www.rsc.org/images/entities/char_2009.gif) :
:![[thin space (1/6-em)]](https://www.rsc.org/images/entities/char_2009.gif) 1 dr.
1 dr.
Conclusions
An automated optimization platform comprising of a CSTR cascade, newly developed photoreactor with LED array, slurry feeding, and inline online HPLC was developed. The hardware control and automation were achieved with an integration of LabVIEW, MATLAB and SIMULINK, Python, and online HPLC. We demonstrated the use of automated MINLP and Bayesian optimizations of heterogeneous coupling photochemistry in which the substrates, catalysts, bases, and products could be solids. Specifically, the MINLP algorithm served to optimize the yield for a Pd-catalyzed Suzuki–Miyaura cross-coupling reaction involving both solid substrates and catalyst for the synthesis of an advanced intermediate, and a metallaphotoredox-catalyzed sp3–sp3 cross-coupling of carboxylic acids with alkyl halides in the presence of solid inorganic base. The Dragonfly Bayesian optimization protocol algorithm was demonstrated for multi-objective optimization of yield and trans-isomer for a diastereoselective, metallaphotoredox cross-coupling reaction between trans-4-hydroxy proline and 4-bromoacetophenone. Even though this reaction generates solids, it was optimized beyond what has been previously reported. This research-scale fully automated flow platform for reaction self-optimization with solids/slurries feeding and handling while consuming the reduced amounts of raw materials promises to facilitate identification of optimal reaction conditions for manufacturing process development.Author contributions
Kakasaheb Y. Nandiwale: conceptualization, formal analysis, investigation, methodology, software, validation, visualization, and writing – original draft. Travis Hart: conceptualization, methodology, validation, and writing – original draft. Andrew F. Zahrt: conceptualization, formal analysis, investigation, methodology, validation, visualization, and writing – original draft. Anirudh M. K. Nambiar: formal analysis, software, visualization, writing – original draft. Prajwal T. Mahesh: conceptualization, methodology, and validation Yiming Mo: conceptualization and methodology. María José Nieves-Remacha: project administration, conceptualization, funding adquisition, supervision, resources, investigation, methodology, validation, and writing- review & editing. Martin D. Johnson: project administration, conceptualization, funding acquisition, supervision, resources, investigation, methodology, validation, and writing – review & editing. Pablo García-Losada: project administration, conceptualization, funding acquisition, supervision, resources, investigation, methodology, validation, and writing – review & editing. Carlos Mateos: conceptualization, funding acquisition, supervision, resources, investigation, methodology, validation, and writing-review & editing. Juan A. Rincón: conceptualization, funding acquisition, supervision, resources, investigation, methodology, validation, and writing-review & editing. Klavs F. Jensen: project administration, conceptualization, funding acquisition, supervision, resources, investigation, methodology, validation, writing – review & editing.Conflicts of interest
There are no conflicts to declare.Acknowledgements
Authors would like to acknowledge the funding from Eli Lilly and Company under the Lilly Research Award Program (LRAP). Authors would like to thank Prof. Connor W. Coley (MIT) and Dr. Romaric Gerardy (MIT) for the useful discussions on the LabVIEW automation and photochemical reactions, respectively.References
- C. P. Johnston, R. T. Smith, S. Allmendinger and D. W. C. MacMillan, Nature, 2016, 536, 322–325 CrossRef CAS PubMed.
- K. P. Cole, B. M. Campbell, M. B. Forst, J. McClary Groh, M. Hess, M. D. Johnson, R. D. Miller, D. Mitchell, C. S. Polster, B. J. Reizman and M. Rosemeyer, Org. Process Res. Dev., 2016, 20, 820–830 CrossRef CAS.
- A. D. Clayton, J. A. Manson, C. J. Taylor, T. W. Chamberlain, B. A. Taylor, G. Clemens and R. A. Bourne, React. Chem. Eng., 2019, 4, 1545–1554 RSC.
- F. Häse, L. M. Roch and A. Aspuru-Guzik, Trends Chem., 2019, 1, 282–291 CrossRef.
- S. A. Weissman and N. G. Anderson, Org. Process Res. Dev., 2015, 19, 1605–1633 CrossRef CAS.
- B. J. Shields, J. Stevens, J. Li, M. Parasram, F. Damani, J. I. M. Alvarado, J. M. Janey, R. P. Adams and A. G. Doyle, Nature, 2021, 590, 89–96 CrossRef CAS.
- C. W. Coley, N. S. Eyke and K. F. Jensen, Angew. Chem., Int. Ed., 2020, 59, 22858–22893 CrossRef CAS.
- C. W. Coley, N. S. Eyke and K. F. Jensen, Angew. Chem., Int. Ed., 2020, 59, 23414–23436 CrossRef CAS.
- A. Gioiello, A. Piccinno, A. M. Lozza and B. Cerra, J. Med. Chem., 2020, 63, 6624–6647 CrossRef CAS.
- S. V. Ley, D. E. Fitzpatrick, R. J. Ingham and R. M. Myers, Angew. Chem., Int. Ed., 2015, 54, 3449–3464 CrossRef CAS PubMed.
- S. V. Ley, D. E. Fitzpatrick, R. M. Myers, C. Battilocchio and R. J. Ingham, Angew. Chem., Int. Ed., 2015, 54, 10122–10136 CrossRef CAS.
- C. Mateos, M. J. Nieves-Remacha and J. A. Rincón, React. Chem. Eng., 2019, 4, 1536–1544 RSC.
- B. J. Reizman and K. F. Jensen, Acc. Chem. Res., 2016, 49, 1786–1796 CrossRef CAS.
- V. Sans and L. Cronin, Chem. Soc. Rev., 2016, 45, 2032–2043 RSC.
- A. R. Bogdan and A. W. Dombrowski, J. Med. Chem., 2019, 62, 6422–6468 CrossRef CAS PubMed.
- C. P. Breen, A. M. K. Nambiar, T. F. Jamison and K. F. Jensen, Trends Chem., 2021, 3, 373–386 CrossRef.
- M. M. Flores-Leonar, L. M. Mejía-Mendoza, A. Aguilar-Granda, B. Sanchez-Lengeling, H. Tribukait, C. Amador-Bedolla and A. Aspuru-Guzik, Curr. Opin. Green Sustain. Chem., 2020, 25, 100370 CrossRef.
- M. B. Plutschack, B. Pieber, K. Gilmore and P. H. Seeberger, Chem. Rev., 2017, 117, 11796–11893 CrossRef CAS.
- K. P. Cole and M. D. Johnson, Expert Rev. Clin. Pharmacol., 2018, 11, 5–13 CrossRef CAS PubMed.
- K. F. Jensen, AIChE J., 2017, 63, 858–869 CrossRef CAS.
- K. P. Cole, J. M. Groh, M. D. Johnson, C. L. Burcham, B. M. Campbell, W. D. Diseroad, M. R. Heller, J. R. Howell, N. J. Kallman, T. M. Koenig, S. A. May, R. D. Miller, D. Mitchell, D. P. Myers, S. S. Myers, J. L. Phillips, C. S. Polster, T. D. White, J. Cashman, D. Hurley, R. Moylan, P. Sheehan, R. D. Spencer, K. Desmond, P. Desmond and O. Gowran, Science, 2017, 356, 1144 CrossRef CAS PubMed.
- K. P. Cole, B. J. Reizman, M. Hess, J. M. Groh, M. E. Laurila, R. F. Cope, B. M. Campbell, M. B. Forst, J. L. Burt, T. D. Maloney, M. D. Johnson, D. Mitchell, C. S. Polster, A. W. Mitra, M. Boukerche, E. W. Conder, T. M. Braden, R. D. Miller, M. R. Heller, J. L. Phillips and J. R. Howell, Org. Process Res. Dev., 2019, 23, 858–869 CrossRef CAS.
- B. J. Reizman, K. P. Cole, M. Hess, J. L. Burt, T. D. Maloney, M. D. Johnson, M. E. Laurila, R. F. Cope, C. V. Luciani, J. Y. Buser, B. M. Campbell, M. B. Forst, D. Mitchell, T. M. Braden, C. K. Lippelt, M. Boukerche, D. R. Starkey, R. D. Miller, J. Chen, B. Sun, M. Kwok, X. Zhang, S. Tadayon and P. Huang, Org. Process Res. Dev., 2019, 23, 870–881 CrossRef CAS.
- M. Di Filippo, C. Bracken and M. Baumann, Molecules, 2020, 25, 356 CrossRef CAS.
- L. Buglioni, F. Raymenants, A. Slattery, S. D. A. Zondag and T. Noel, Chem. Rev., 2022, 122, 2752–2906 CrossRef CAS PubMed.
- B. J. Reizman and K. F. Jensen, Org. Process Res. Dev., 2012, 16, 1770–1782 CrossRef CAS.
- N. S. Eyke, W. H. Green and K. F. Jensen, React. Chem. Eng., 2020, 5, 1963–1972 RSC.
- P. Jorayev, D. Russo, J. D. Tibbetts, A. M. Schweidtmann, P. Deutsch, S. D. Bull and A. A. Lapkin, Chem. Eng. Sci., 2022, 247, 116938 CrossRef CAS.
- N. Vasudevan, E. Wimmer, E. Barré, D. Cortés-Borda, M. Rodriguez-Zubiri and F.-X. Felpin, Adv. Synth. Catal., 2021, 363, 791–799 CrossRef CAS.
- N. Sugisawa, H. Sugisawa, Y. Otake, R. V. Krems, H. Nakamura and S. Fuse, Chem. Methods, 2021, 1, 484–490 CrossRef.
- M. I. Jeraal, S. Sung and A. A. Lapkin, Chem. Methods, 2021, 1, 71–77 CrossRef.
- D. Cortés-Borda, K. V. Kutonova, C. Jamet, M. E. Trusova, F. Zammattio, C. Truchet, M. Rodriguez-Zubiri and F.-X. Felpin, Org. Process Res. Dev., 2016, 20, 1979–1987 CrossRef.
- B. J. Reizman, Y.-M. Wang, S. L. Buchwald and K. F. Jensen, React. Chem. Eng., 2016, 1, 658–666 RSC.
- B. J. Reizman and K. F. Jensen, Chem. Commun., 2015, 51, 13290–13293 RSC.
- J. P. McMullen and K. F. Jensen, Org. Process Res. Dev., 2010, 14, 1169–1176 CrossRef CAS.
- D. E. Fitzpatrick, C. Battilocchio and S. V. Ley, Org. Process Res. Dev., 2016, 20, 386–394 CrossRef CAS.
- A.-C. Bédard, A. Adamo, K. C. Aroh, M. G. Russell, A. A. Bedermann, J. Torosian, B. Yue, K. F. Jensen and T. F. Jamison, Science, 2018, 361, 1220–1225 CrossRef.
- V. Fath, N. Kockmann, J. Otto and T. Röder, React. Chem. Eng., 2020, 5, 1281–1299 RSC.
- R. W. Epps, A. A. Volk, M. Y. S. Ibrahim and M. Abolhasani, Chem, 2021, 7, 2541–2545 CAS.
- A. D. Clayton, L. A. Power, W. R. Reynolds, C. Ainsworth, D. R. J. Hose, M. F. Jones, T. W. Chamberlain, A. J. Blacker and R. A. Bourne, J. Flow Chem., 2020, 10, 199–206 CrossRef.
- E. C. Aka, E. Wimmer, E. Barré, N. Vasudevan, D. Cortés-Borda, T. Ekou, L. Ekou, M. Rodriguez-Zubiri and F.-X. Felpin, J. Org. Chem., 2019, 84, 14101–14112 CrossRef CAS.
- R. L. Hartman, Org. Process Res. Dev., 2012, 16, 870–887 CrossRef CAS.
- M. R. Chapman, M. H. T. Kwan, G. King, K. E. Jolley, M. Hussain, S. Hussain, I. E. Salama, C. González Niño, L. A. Thompson, M. E. Bayana, A. D. Clayton, B. N. Nguyen, N. J. Turner, N. Kapur and A. J. Blacker, Org. Process Res. Dev., 2017, 21, 1294–1301 CrossRef CAS.
- Y. Mo and K. F. Jensen, React. Chem. Eng., 2016, 1, 501–507 RSC.
- Y. Mo, H. Lin and K. F. Jensen, Chem. Eng. J., 2018, 335, 936–944 CrossRef CAS.
- R. Duvadie, A. Pomberger, Y. Mo, E. I. Altinoglu, H.-W. Hsieh, K. Y. Nandiwale, V. L. Schultz, K. F. Jensen and R. I. Robinson, Org. Process Res. Dev., 2021, 25, 2323–2330 CrossRef CAS.
- A. Wood, K. Y. Nandiwale, Y. Mo, J. Bo, A. Pomberger, V. Shultz, F. Gallou, K. F. Jensen and B. H. Lipshutz, Green Chem., 2020, 22, 3441–3444 RSC.
- A. Pomberger, Y. Mo, K. Y. Nandiwale, V. L. Schultz, R. Duvadie, R. I. Robinson, E. I. Altinoglu and K. F. Jensen, Org. Process Res. Dev., 2019, 23, 2699–2706 CrossRef CAS.
- R. L. Hartman, J. R. Naber, N. Zaborenko, S. L. Buchwald and K. F. Jensen, Org. Process Res. Dev., 2010, 14, 1347–1357 CrossRef CAS.
- S. Kuhn, T. Noël, L. Gu, P. L. Heider and K. F. Jensen, Lab Chip, 2011, 11, 2488–2492 RSC.
- C. Delacour, D. S. Stephens, C. Lutz, R. Mettin and S. Kuhn, Org. Process Res. Dev., 2020, 24, 2085–2093 CrossRef CAS.
- T. Hart, V. Schultz, D. A. Thomas, T. Kulesza and K. F. Jensen, Org. Process Res. Dev., 2020, 24, 2105–2112 CrossRef CAS.
- B. J. Doyle, B. Gutmann, M. Bittel, T. Hubler, A. Macchi and D. M. Roberge, Ind. Eng. Chem. Res., 2020, 59, 4007–4019 CrossRef CAS.
- Z. Dong, S. D. A. Zondag, M. Schmid, Z. Wen and T. Noël, Chem. Eng. J., 2022, 428, 130968 CrossRef CAS.
- W. Debrouwer, W. Kimpe, R. Dangreau, K. Huvaere, H. P. L. Gemoets, M. Mottaghi, S. Kuhn and K. Van Aken, Org. Process Res. Dev., 2020, 24, 2319–2325 CrossRef CAS.
- P. Bianchi, J. D. Williams and C. O. Kappe, J. Flow Chem., 2020, 10, 475–490 CrossRef CAS.
- L. C. Campeau and N. Hazari, Organometallics, 2019, 38, 3–35 CrossRef CAS PubMed.
- J. A. Manson, A. D. Clayton, C. G. Niño, R. Labes, T. W. Chamberlain, A. J. Blacker, N. Kapur and R. A. Bourne, Chimia, 2019, 73, 817 CrossRef PubMed.
- L. M. Baumgartner, C. W. Coley, B. J. Reizman, K. W. Gao and K. F. Jensen, React. Chem. Eng., 2018, 3, 301–311 RSC.
- H.-W. Hsieh, C. W. Coley, L. M. Baumgartner, K. F. Jensen and R. I. Robinson, Org. Process Res. Dev., 2018, 22, 542–550 CrossRef CAS.
- L. M. Baumgartner, J. M. Dennis, N. A. White, S. L. Buchwald and K. F. Jensen, Org. Process Res. Dev., 2019, 23, 1594–1601 CrossRef CAS.
- K. Kandasamy, K. Raju Vysyaraju, W. Neiswanger, B. Paria, C. R. Collins, J. Schneider, B. Poczos and E. P. Xing, J. Mach. Learn. Res., 2019, 21, 1–27 Search PubMed.
- B. Paria, K. Kandasamy and B. Póczos, 2018, arXiv:1805.12168.
- A. M. Schweidtmann, A. D. Clayton, N. Holmes, E. Bradford, R. A. Bourne and A. A. Lapkin, Chem. Eng. J., 2018, 352, 277–282 CrossRef CAS.
- I. Abdiaj and J. Alcázar, Bioorg. Med. Chem., 2017, 25, 6190–6196 CrossRef CAS PubMed.
- E. Bradford, A. M. Schweidtmann and A. Lapkin, J. Glob. Optim., 2018, 71, 407–438 CrossRef.
- F. Häse, L. M. Roch and A. Aspuru-Guzik, Chem. Sci., 2018, 9, 7642–7655 RSC.
- M. Christensen, L. P. E. Yunker, F. Adedeji, F. Häse, L. M. Roch, T. Gensch, G. dos Passos Gomes, T. Zepel, M. S. Sigman, A. Aspuru-Guzik and J. E. Hein, Commun. Chem., 2021, 4, 112 CrossRef.
Footnote |
| † Electronic supplementary information (ESI) available: Details of photoreactor fabrication, experimental setup, operation of automated optimization system, design of experiments (DoE), experimental data and analytical methods. See DOI: https://doi.org/10.1039/d2re00054g |
| This journal is © The Royal Society of Chemistry 2022 |

