Chemically-informed data-driven optimization (ChIDDO): leveraging physical models and Bayesian learning to accelerate chemical research

Daniel Frey a, Ju Hee Shin a, Christopher Musco b and Miguel A. Modestino *a
aDepartment of Chemical and Biomolecular Engineering, Tandon School of Engineering, New York University, 6 Metrotech Center, Brooklyn, NY, USA. E-mail: modestino@nyu.edu; Tel: +1 646 997 3594
bComputer Science and Engineering, Tandon School of Engineering, New York University, 370 Jay Street, Brooklyn, NY, USA

Received 6th January 2022 , Accepted 24th February 2022

First published on 4th March 2022


Abstract

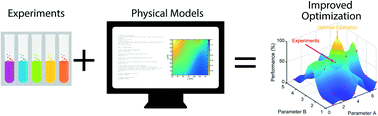
Current methods of finding optimal experimental conditions, Edisonian systematic searches, often inefficiently evaluate suboptimal design points and require fine resolution to identify near optimal conditions. For expensive experimental campaigns or those with large design spaces, the shortcomings of the status quo approaches are more significant. Here, we extend Bayesian optimization (BO) and introduce a chemically-informed data-driven optimization (ChIDDO) approach. This approach uses inexpensive and low-fidelity information obtained from physical models of chemical processes and subsequently combines it with expensive and high-fidelity experimental data to optimize a common objective function. Using common optimization benchmark objective functions, we describe scenarios in which the ChIDDO algorithm outperforms the traditional BO approach, and then implement the algorithm on a simulated electrochemical engineering optimization problem.


Introduction

Edisonian search approaches are widely used in the chemical sciences to discover reactions, process conditions, material compositions, or product formulations with optimal performance for their intended application. These experimental design methods rely on the generation of grids of variables where experimentally accessible conditions are systematically and/or combinatorically explored. While these methods are simple to implement, they often evaluate a suboptimal parameter space where the quality of information derived depends on the numbers of combinations of variables explored, slowing and sometimes preventing the identification of optimal conditions.1 These shortcomings represent significant impediments for expensive experimental campaigns (e.g., during process scale-up, in fine chemicals or pharmaceuticals) or those with large design spaces that can only afford the implementation of coarse experimental grids, underscoring the need for more efficient experimental optimization methods.2

Bayesian optimization (BO) has been widely implemented in different fields of research to accelerate experimental optimization.3–9 BO methods use a surrogate model (SM) that describes an objective function and its probability distribution in the design space to guide the optimization campaign. Each time new experimental data is obtained, the SM is updated to increase its accuracy. In this way, Bayesian statistics and reasoning can be used to select the most informative sequence of experiments and accelerate optimization campaigns.10 In recent years, BO has been implemented for various applications in the chemical sciences including materials discovery and prediction of their properties,11–21 design of reactors and chemical processes,22–33 and the optimization of energy storage materials and devices.34–38 Data-driven optimization methods such as BO learn and evolve with new experimental data, but they lack a priori knowledge of the physical laws that dictate the behavior of the chemical system under study. This can result in the need for large experimental campaigns to accurately model and find the optimal combination of parameters for a given objective function. On the other hand, physical models (e.g., density functional theory, molecular dynamics, continuum models, etc.) could be used to identify optima without the need to perform experimental searches, but they often lack the accuracy to effectively capture the complexity of real systems or require inaccessibly-large computational power. Given the advantages and shortcomings of both optimization approaches, there is an opportunity to leverage a priori chemical knowledge in data-driven optimization to reduce the data needs and allow for faster identification of optima.

Herein, we introduce a chemically-informed data-driven optimization (ChIDDO) approach, which is a type of multi-information source optimization (MISO), where inexpensive and low-fidelity information obtained from physical models of chemical processes are combined with high-fidelity experimental data to optimize a common objective function. In this study, we leverage simulated data to develop a ChIDDO approach that can be implemented broadly in experimental campaigns. While MISO algorithms have been previously implemented to improve BO in computational problems,39–41 the implementation of ChIDDO can extend these advantages to chemical experimentation. In addition, we introduce a new acquisition function, modified ranked batch (MRB) that could improve the selection of a batch of experiments.42

Experimental

BO algorithm description

BO algorithms consist of two main components: an SM and an acquisition function. The SM is used to predict the value of the experimental objective function, ypred, for any set of conditions, x. x is a vector of length d, the number of dimensions in the design space. x is bounded by lower and upper bounds for each dimension, xLB and xUB, which are arrays of the same dimensionality of x. The SM is trained using Nexp experimental evaluations of the experimental objective function, which results in vector yexp corresponding to Xexp. Xexp is a matrix with Nexp rows and d columns. The ith row of Xexp, which we denote xexpi, corresponds to a d dimensional parameter vector to be evaluated. yexp is an array of Nexp evaluations of the experimental objective function at each condition, xexpi, in Xexp. In this study we use a Gaussian process regressor (GPR) with the radial basis function kernel as the SM.

An acquisition function is used to select the next design condition(s) to evaluate, xnext, based on how informative the design conditions will be in the goal of optimizing the cost function. Here, we can choose to select a single design condition or a batch of conditions. In the chemical sciences, it is often convenient to run multiple experiments in parallel based on equipment capabilities, so we chose to focus on selecting batches of design conditions. Many different acquisition functions for BO have been developed, and three of the most common are expected improvement (EI),43 probability of improvement (PI),44 and upper confidence bound (UCB).45 In addition to these, we have developed a modified ranked-batch (MRB) mode sampling function inspired by the work of Cardoso et al.42 The equations for each of the acquisition functions are provided in the ESI. An acquisition function uses the current information, Xexp and yexp, and the SM predictions to calculate how informative a possible design condition is expected to be based on the criteria for the respective acquisition function. To determine the most informative design point to sample next, a maximization method was used to find a local maximum of the acquisition function score. This process was repeated 25 times at different initiation points to get closer to the global maximum solution. The design point with the maximum score was subsequently added to xnext. For this study a minimization method was used and the negative of the acquisition function score was minimized. The minimization method was the L-BFGS-B method from the scipy.optimize.minimize package. Depending on the batch size used in the optimization campaign, nb, multiple design conditions can be added to xnext by repeating this acquisition function maximization step. After xnext is selected, the experimental objective function value(s) are determined to obtain ynext. Subsequently, xnext and ynext are appended to xexp and yexp.

The EI, PI, and UCB algorithms were run based on their implementation in the modAL active learning framework,46 which is described in the ESI. The general framework for the BO algorithms presented was also based on the modAL framework. The MRB acquisition function calculated a score consisting of three normalized parameters: a distance score, Δ, an uncertainty score, Γ, and the objective function prediction, Ω. The distance score was calculated as:

 
image file: d2re00005a-t1.tif(1)
where image file: d2re00005a-t2.tif is the minimum distance between the proposed set of conditions, x, and each of the known sets of conditions, xexp. The uncertainty score, Γ, is the standard deviation of the GPR prediction at x normalized compared to the maximum and minimum observed standard deviation. The objective function prediction, Ω, is ypred at x normalized compared to the maximum and minimum observed prediction. The score that is calculated at each step in the minimization process for the respective x is:
 
Score = βΔ + βΓ + Ω(2)
where β is a tradeoff value. A high value of β encourages more exploration—i.e., encourages searching unknown areas of the design space. A lower value of β encourages exploitation—i.e., searching locally near the current maximum prediction. All of the acquisition functions include a tradeoff value that decreases as more experiments are run, moving from exploration to exploitation. For MRB, β changes linearly from 1 to 0. For UCB, β changes linearly from 4 to 0. For PI and EI, β changes logarithmically from around 0.05 to 1 × 10⁻⁷.

To initiate the algorithm, Ninit evenly distributed random points were chosen as the initial set of experimental conditions. Our results show robust performance when a random initialization approach is implemented, but other methods that ensure good spatial coverage over the design space and incorporate a degree of randomness could be implemented. The random initialization approach was done by choosing random experiments to perform without considering the positions of the other initial experiments. In other words, there was no space-filling model for this initialization approach. For the BO algorithm without the use of a physics model (referred to as BO from this point on), only these initial points, xexpinit, were fit by the GPR to generate the SM. After each batch of BO, (xexp, yexp) increases in size by the batch size, nb. For the ChIDDO algorithm, before (xexp, yexp) are passed to the GPR, a certain number of design points from the a priori physics model (xphys, yphys) are appended to (xexp, yexp). The size of (xphys, yphys) decreases as the number of experiments that are run increases. For example, if it was decided that a total of 50 experiments would be run before stopping the ChIDDO optimization campaign, Ntotal, and it was chosen to start with 10 experimental points, the ChIDDO algorithm would add (Ntotal − size(xexp)) data points (40 in this case) calculated from the physics model. These added points were uniformly distributed random design points between the upper and lower bounds. This method allowed for the incorporation of knowledge of the chemical system under study to help guide the initial choice of experiments when less experimental data is available, and progressively increases the amount of experimental data used to generate an SM as more empirical evidence becomes available. A general algorithm flowchart is shown in Fig. 1 and an example of the decision process in action is shown in Fig. 2.


image file: d2re00005a-f1.tif
Fig. 1 Process diagram of the ChIDDO algorithm. The purple blocks correspond to the algorithm steps required to incorporate the physical model. The gray blocks correspond to steps related to experimental data acquisition.

image file: d2re00005a-f2.tif
Fig. 2 Example of the decision-making process of the BO algorithm using the sphere objective function. MRB was used as the acquisition function, there were 10 initial random points (black dots), and subsequent points (in red and labelled in order) were selected in batches of 3.

Benchmark objective functions

Common objective functions for optimization benchmarking were selected, filling in as a representation of a chemical sciences objective function, and they are described further in the ESI. Each objective function has its own set of parameters that affect the specific shape of the objective function. For example, for the sphere objective function (an ellipse):
 
image file: d2re00005a-t3.tif(3)
the variable, P, is an array of the 2d parameters. For each objective function there is a base set of parameters that results in a base-case objective function shape. To obtain alternate models of the objective functions, P can be randomly perturbed around the base parameters. For all of the studies, 20 alternate models were used as the experimental objective functions.

Depending on the specific objective function, we studied 2-, 3-, 4- and 6-dimensional spaces. Unless otherwise specified, the experimental objective function values, yexp, were exactly equal to the objective function calculation, given the set of parameter values.

Under conditions when noise was added, the objective function values were calculated as:

 
ynoisei = yexpi + [(ymaxymin)(2rand(0,1) − 1)]η(4)
where ymax is the maximum value of the objective function, ymin is the minimum value of the objective function, and η is the noise level, defined as the maximum allowable value that could be added or subtracted from yexpi, which can be viewed as a percentage of the range of y. Rand(0,1) is a random variable drawn uniformly from 0 to 1. The η values that were tested were 0.025, 0.05, and 0.1.

Updating the physics model parameters in ChIDDO

Each physics model was initially defined by a set of base-case parameters that could be updated during the optimization process. These base-case models were used as the a priori knowledge in the ChIDDO algorithm. The base-case model parameters used are provided in the ESI. Since the initial model parameters are only an estimate, the parameters were updated after each batch of experiments based on the new experimental observations. The parameters were updated by using a non-linear least square error regressor to minimize the error between the experimental data and the physics model. The updated model parameters were then used to calculate (xphys, yphys) for the following batch. With the relatively simple experimental objective functions used in this study, this method of updating the parameters is appropriate. However, for complex objective functions with many different unknown parameters (e.g., continuum models, molecular dynamics), other methods for updating parameters may be needed.

Baseline search algorithms

Two different baseline search methods were tested: a grid search and a random search. 100 trials were done for each search method and N experimental points were selected for each trial. For the grid search, N equally spaced experimental points were selected sequentially between the lower and upper bounds of each variable. For the random search, conditions were chosen at random from the uniform design space defined by the upper and lower bounds. This random search did not consider the locations of the previous selections, so it was possible to have poor representation of the design space (i.e., clustering of points).

Simplified physics model

To study how the algorithm performs when a physical model does not accurately represent the chemical process of interest, an objective function was built as a linear combination of two physics models, while the physics model used in ChIDDO was based on only one of them. The values of the combined objective function were calculated as:
 
ymixed = ry1 + (1 − r)y2(5)
where r is the mixing ratio, y1 is the value of the first objective function, and y2 is the value of the second objective function. For example, the Rosenbrock function could be added to the sphere function with an r of 0.9. In this case, the objective function would more closely, but not perfectly, resemble the Rosenbrock function, as seen in Fig. 3.

image file: d2re00005a-f3.tif
Fig. 3 Example of the addition of two dissimilar objective functions. The Rosenbrock function and sphere function are shown using their respective base case parameters.

Electrochemical model description

To simulate testing the BO/ChIDDO algorithms on an experimental chemical system, a hypothetical electrochemical system of reactions was considered:
 
A + B + e → C(6)
 
2A + B + e → D(7)
 
3A + B + e → E(8)
 
2B + e → F(9)

The chosen reaction resembles the electrohydrodimerization of acrylonitrile to adiponitrile, the largest organic electrosynthetic process practices in industry.1,47,48

The rates of these reactions were modelled by Butler–Volmer kinetics in the form:

 
image file: d2re00005a-t4.tif(10)
where Ji is the current density of the respective reaction, i, j0i is the exchange current density of the respective reaction, csurfj is the electrode surface concentration of the respective reactant, j (A or B), γij is the order of reaction for the respective reactant and reaction, αi is the average charge transfer coefficient between the two reactants for the respective reaction, F is Faraday's constant, ηi is the overpotential for the respective reaction, R is the gas constant, and T is the temperature in K.

The reactions are simulated in a 1-D domain, representing the diffusion boundary layer, on one end bounded by the bulk electrolyte solution and the other end the electrode surface. The Nernst–Planck equation was used to model the concentration change of each species using diffusion, migration, and generation terms:

 
image file: d2re00005a-t5.tif(11)
where cj is the concentration of the respective reactant or product, j, ∑jij is the sum of the production/consumption rates for the respective species over each reaction, i, that the species participates in, Δx is the spacing between each point in the model, z is the charge of the species (chosen to be 1), and ∂Φ/∂x is the potential gradient.

The Faradaic efficiency (FE) of product D was the value to be optimized. FE is a metric that measures how much of the current participates in the desired reaction. In this case, FE is calculated by dividing the amount of D produced by the total of all produced species (including D). In this system, the concentrations of the reactants could have a large effect on the FE. Therefore, the optimization variables in the 2D design space for this reaction were the bulk concentrations of reactants A and B. Due to the reaction rates and reaction orders of the different reactions, an optimal set of reactant concentrations could be located in the design space.

Data availability

The code used for all the experiments can be found in a public repository.49

Results

BO improvements over Edisonian approach

To demonstrate the advantages of implementing a BO strategy over an Edisonian approach, we studied the performance of the different optimization approaches on common benchmark functions. Each of these benchmark functions has a different shape and optimization complexity, and by running the algorithms on these different objective functions, we attempted to gain insights into the behavior of the different algorithms. For conciseness, here we present the results for various optimization runs using the sphere function (Fig. 4). A full list of the objective functions, their equations, the base parameters, and optimization results can be found in the ESI.
image file: d2re00005a-f4.tif
Fig. 4 d y versus number of experiments, N, comparing BO and ChIDDO with the Edisonian random and grid search. (A) 2D sphere, (B) 3D sphere, (C) 4D sphere. For each curve, 20 separate searches, S, were performed, and the average of the results are the lines shown. The shadow around each of the lines represents the standard deviation. For each of the BO/ChIDDO experiments, the MRB acquisition function was used. The objective function parameter information is provided in the ESI.

In our framework, we consider experimental sets, S, which consist of Nexp number of experiments with conditions xexp resulting in output performance, yexp. The purpose of the BO algorithm is to maximize yexp in the fewest number of experiments. The output of the algorithm generates a set of (xexp, yexp) results that can be plotted and compared to Edisonian experimental sets that follow either a grid or a random search approach. We evaluate two performance metrics: the normalized deviation from the optimum value, dy, and the minimum distance from the optimum, dx, identified by each set of experiments. These two quantities are calculated as,

 
image file: d2re00005a-t6.tif(12)
 
image file: d2re00005a-t7.tif(13)
where ymax is the maximum possible value of the cost function within the constraints of the experimental parameters and ymin is the minimum possible value of the cost function within the constraints of the experimental parameters.

In the following studies, the different algorithms (BO and ChIDDO) are run on 20 different sphere functions which serve as simulated experimental objective functions. Since the experimental objective functions are different, there was some variance in the results between the 20 runs. Therefore, the graphs shown in the following figures show the average of the 20 runs as a solid line, and a shadow around the solid line representing the standard deviation of the 20 runs. In Fig. 4, dy is plotted against the number of experiments, N, comparing the Edisonian methods with BO and ChIDDO. The plots for dx can be found in the ESI.Fig. 4A shows how the different search algorithms compare using the 2D sphere objective function. Even for this simple, parabolic function, the systematic grid search and random search underperform comparatively to BO or ChIDDO. dy values after 30 experiments, dy30, were 0.008 and 0.023 for the grid and random search algorithms, respectively. In comparison, dy30 for BO and ChIDDO were both on the order of 10−3. As the design space moves to higher dimensions, Fig. 4B and C show that the differences between the algorithms increase with dimension size. For the 3D sphere objective function the enhancements are more drastic, with dy30 being two orders of magnitude smaller for BO compared to the Edisonian algorithms. Because of the larger design space to sample, the grid and random search methods are not capable of searching a fine enough space to find values close to the optimal. It is of interest that the dy30 for BO and ChIDDO were very similar, possibly because the sphere objective function has a well-defined optimum and is therefore easy to identify. As the number of dimensions increases, ChIDDO tends to find near optimal values with fewer experiments than BO. This enhancement is likely because ChIDDO relies on the physics model initially to help more rapidly locate optimal conditions.

Comparison of different acquisition functions

In order to compare how the different acquisition functions behave at identifying optima in objective functions of different dimensionality, Hartmann functions with 3, 4, and 6 dimensions were analyzed and the results are shown in Fig. 5. This objective function was chosen due to its more complex structure (i.e., multiple local optima). Results from other objective functions are provided in the ESI.Fig. 5A and B show a comparison of performance when different acquisition functions are used on a 3D Hartmann function. The dy30 values for MRB, EI, PI, and UCB using BO were 0.041, 0.069, 0.045, and 0.183, respectively. It appears that all the acquisition functions behaved similarly except for UCB, which shows an order of magnitude worse performance. By the end of the run, it appears that all the acquisition functions reach a similar value of dy. For the comparison on the 3D Hartmann function using ChIDDO shown in Fig. 5B, PI and MRB appeared to perform the best with dy30 values of 0.003 and 0.032, respectively, compared with EI (0.056) and UCB (0.182).
image file: d2re00005a-f5.tif
Fig. 5 d y versus number of experiments, N, comparing the MRB, EI, PI, and UCB acquisition functions using BO and ChIDDO. (A) 3D Hartmann – BO, (B) 3D Hartmann – ChIDDO, (C) 4D Hartmann – BO, (D) 4D Hartmann – ChIDDO, (E) 6D Hartmann – BO, (F) 6D Hartmann – ChIDDO. For each curve, 25 separate searches, S, were performed, and the average of the results are the lines shown. The shadow around each of the lines represents the standard deviation.

Fig. 5C and D show the comparison on the 4D Hartmann function using BO and ChIDDO, respectively. Interestingly, all the acquisition functions perform similarly with dy30 values on the order of 10−3 or lower and they all reach low values very quickly. The comparison on the 6D Hartmann function is shown in Fig. 5E and F. When using BO, all the acquisition functions appear to perform similarly with dy30 values of 0.218 (MRB), 0.134 (EI), 0.195 (PI), and 0.205 (UCB). It is important to note that the standard deviations for the 6D graphs are much larger than for the smaller dimensions. This indicates that the different random starting conditions affected the dy values more for the 6D space compared with the 3D and 4D spaces, due to the larger complexity of the optimization process with increased dimensionality. Fig. 6F shows the comparison using ChIDDO. The dy30 values for MRB, EI, PI, and UCB were 0.079, 0.021, 0.027, and 0.149, respectively. In addition, the standard deviation of dy is much smaller for ChIDDO than for BO, indicating a more consistent optimization.


image file: d2re00005a-f6.tif
Fig. 6 d y versus number of experiments, N, comparing different noise levels, η, represented by lines of different colors. (A) 3D Hartmann – BO, (B) 3D Hartmann – ChIDDO, (C) 4D Hartmann – BO, (D) 4D Hartmann – ChIDDO, (E) 6D Hartmann – BO, (F) 6D Hartmann – ChIDDO. For each curve, 25 separate searches, S, were performed, and the average of the results are the lines shown. The shadow around each of the lines represents the standard deviation. For each of these studies, the MRB acquisition function was used.

When comparing the performance of BO to ChIDDO, it appears that the ChIDDO algorithm performs similarly or better for all of the objective functions. These results show that the ChIDDO algorithm does improve the performance initially, since the physics model information has a larger impact when fewer experiments are available.

Quantifying the effect of experimental noise

So far, we have assumed that experiments run under conditions, xi, result in exact values of the objective function of interest, f(xi) = yi. However, experimental measurements often possess a significant degree of noise. To quantify the effect of the experimental noise and to determine the robustness of the BO and ChIDDO algorithms to noisy experiments, different levels of random noise were added to the objective functions.

Fig. 6 compares dy for different levels of noise using the BO and ChIDDO algorithms with the MRB acquisition function. For the case of the 3D Hartmann using BO (Fig. 6A), the dy for the highest noise level studied (i.e. η = 0.1) appears to be slightly higher than the other noise values until about the 37th experiment when dy approaches the same value for all noise levels. For the 3D Hartmann function using ChIDDO in Fig. 6B, the observations are similar to that of BO as the noise had only a small impact on the optimization. Interestingly, the dy values for the experiments with noise are not substantially different to the experiments without noise, demonstrating the robustness of BO and ChIDDO.

This behavior is also observed for the case of 4D Hartmann function in Fig. 6C and D. When using BO, the dy for η = 0.1 remains higher than for the other noise levels until approximately the 32nd experiment when the dy values start to converge for other noise levels. In the case of the 4D Hartmann function using ChIDDO, the dy values for each noise level are similar after the 25th experiment. Prior to this, the dy values for η = 0.1 are higher than that of the other noise levels. Contrary to the 3D Hartmann function, the experiments with no noise for both ChIDDO and BO have lower dy values than the experiments with noise.

Fig. 6E and F show the noise comparisons for the 6D Hartmann function. When using BO, all noise levels present similar values for dy until experiment 30th, and a slightly higher values for η = 0.1 beyond that point. These results indicate that the BO algorithm may be more resistant to noise effects in low-dimensionality design spaces and that overall noise effects are weak within the levels studied. Fig. 6F shows that the ChIDDO algorithm performs much better overall for the 6D Hartmann function compared to BO. When ChIDDO is implemented on 3, 4 and 6D Hartmann functions, our observations suggest that noise has only a small impact on the optimization but the values of dy are lower than those found with BO for a given number of experiments.

Quantifying effects of physical model accuracy

Experiments in the chemical sciences are often performed under complex geometries, involve multiple kinetic and transport processes, and require molecular-level descriptions of the species involved for an accurate representation. Detailed multidimensional models of these complex chemical systems are often intractable, requiring simplified semi-empirical models that capture the experimental observations with a lower level of accuracy. These simplified physical models can still be used in ChIDDO algorithms as they serve as a guide to the optimization and can be complemented and improved by experimental data. To understand how less accurate models affect the performance of ChIDDO, we attempted to optimize a mixed objective function that consisted of a linear combination of two functions (eqn (5)), while ChIDDO used a physics model that described only one of the functions. Fig. 7A and B show dy as a function of number of experiments for the combination of the 3D sphere and 3D Hartmann objective functions, while Fig. 7C and D present similar results for 6D objective functions. For the example where the sphere function is used as the physics model, an r of 0.1 indicates that the output value for each set of conditions is 10% of the 3D sphere output value plus 90% of the 3D Hartmann output value. Therefore, a low r indicates that the physics model and the experimental points are dissimilar. Conversely, when r is high, the physics model and the objective function are close to each other, and one would expect dy to decrease more rapidly with the number of experiments than in the case of low values of r. Interestingly, it appears that the similarity between the physics model and the objective functions only makes a small difference in performance. In these figures it is important to note that since there is a combination of objective functions, the optimum values change for each r, resulting in different dy values after the initial points are run. However, the curves in Fig. 7A for r = 0.1 and Fig. 7B for r = 0.9 are based on the same objective function values. From these results, it can be observed that using the Hartmann function as the physics model allowed for improved performance. This could be due to the fact that the Hartmann function incorporates a higher degree of complexity than the sphere function. For these objective functions with parameters that are easy to regress, the simplified physics model was able to be modified enough to predict values close to the combined objective function. Even with little similarity between the simplified physics model and the combined objective function (r = 0.1), the algorithm had adequate performance. However, when implementing more complex physics models that cannot be regressed as easily to match the experimental values, a simplified physics model may show inadequate performance.
image file: d2re00005a-f7.tif
Fig. 7 d y versus number of experiments, N, for different objective function mixing ratios, r. Larger r means more similarity between physics model and experimental objective function. (A) 3D sphere mixed with 3D Hartmann using sphere as the simplified physics model. (B) 3D sphere mixed with 3D Hartmann using Hartmann as the simplified physics model. (C) 6D sphere mixed with 6D Hartmann using sphere as the simplified physics model. (D) 6D sphere mixed with 6D Hartmann using Hartmann as the simplified physics model. For each curve, 25 separate searches, S, were performed, and the average of the results are the lines shown. The shadow around each of the lines represents the standard deviation. For all of these graphs, ChIDDO was used as the AL algorithm and MRB was used as the acquisition function.

Simulation of an electrochemical optimization

In the previous sub-sections, we demonstrated the development of ChIDDO using model functions that are difficult to optimize but that are not based on chemical processes. To illustrate the implementation of ChIDDO in a chemical process, we attempted to optimize the Faradaic efficiency (FE) of product D in the simulated set of electrochemical reactions described in eqn (6)–(9). This is a common objective function in electrochemical processes, where it is often desirable to selectively generate a single product. We studied how BO and ChIDDO performed on electrochemical models with two, three, and four dimensions. For two dimensions, the bulk concentrations of two reactants were the two variables (0.1–1 mol dm−3). Voltage (2–4 V) was used as the third variable and temperature (25–80 °C) was used as the fourth variable. Fig. 8 shows the performance of the BO and ChIDDO algorithms on the different dimension electrochemical models. For the 2D and 3D optimizations, the performance of BO and ChIDDO was similar. However, when the fourth dimension was added, ChIDDO outperformed BO, especially at a low number of experiments. This shows that the physics model allowed the algorithm to identify areas close to maximum without having to search the entire space.
image file: d2re00005a-f8.tif
Fig. 8 d y versus number of experiments, N, comparing different noise levels, η, represented by lines of different colors. (A) 6D Hartmann – BO – PI, (B) 6D Hartmann – BO – EI, (C) 6D Hartmann – BO – MRB. For each curve, 25 separate searches, S, were performed, and the average of the results are the lines shown. The shadow around each of the lines represents the standard deviation. For each of these studies, the MRB acquisition function was used.

The electrochemical model used in this study has 4 different parallel reactions (eqn (6)–(9)). It is common when simulating a complex reaction network that not all the intermediates or products are known. To test the robustness of the ChIDDO algorithm to incomplete physics models, eqn (8) and/or (9) was removed from the set of physics model reactions. When the full model was used as the physics model, a continuous improvement can be seen as more experiments are incorporated, as seen in Fig. 9. However, when one or two reactions are not included in the physics model, the algorithm is not able to improve the optimal value after the first few experiments. This could be the case if the simplified physics model does not agree with the values of the true objective function, leading to experimental selections that are far from the optimal values. After observing the model data from the simplified models, the objective values for the design space have different shapes and magnitudes than the experimental objective function. Examples of the simplified physics model data are shown in the ESI. After a large number of experiments, the GPR prediction starts to become dominated by the experimental results and the exploration rate decreases, ultimately prompting the algorithm to select suboptimal experiments in close proximity to regions with low dy values found during the early stage of the optimization. This indicates that it is important to have high accuracy in the physics model, or to extend the exploration phase of the algorithm if the information used in the physics model has large uncertainty.


image file: d2re00005a-f9.tif
Fig. 9 d y versus number of experiments, N, for different electrochemical physics model information. “Full” indicates the model is predicting the same information as the objective function. “No E”, “No F”, and “No EF” indicate the removal of eqn (8) and/or (9) from the physics model information, resulting in a less informative model. (A) 2D electrochemical model. (B) 3D electrochemical model. (C) 4D electrochemical model. For each curve, 25 separate searches, S, were performed, and the average of the results are the lines shown. The shadow around each of the lines represents the standard deviation. For all of these graphs, ChIDDO was used as the AL algorithm and MRB was used as the acquisition function.

Conclusions

This work introduced the ChIDDO approach, an optimization methodology where information from physical models of chemical processes is used synergistically with experimental data to potentially improve BO performance. Our results show that both BO and ChIDDO outperform systematic grid or random searches. The ChIDDO algorithm improves the initial performance of the optimization of various types of objective functions, but as more experimental results become available, the performance of BO and ChIDDO tend to converge. The advantages of the inclusion of physical models are more pronounced in optimization problems of high dimensions. This is evident in the case of the 6D Hartmann function, where dy values for ChIDDO were substantially lower than the BO dy values, while in the case of 3D and 4D Hartmann optimizations the difference is minimal. Similar results were observed when using data with and without noise. Interestingly, the standard deviation between different experiments was smaller when using ChIDDO, indicating a more consistent optimization regardless of the experimental observations. We also explored scenarios when the physics model may not accurately describe the experimental objective function. In these scenarios, the effect of the inaccuracy of the physics model depends on how easy the physics model can be regressed and modified to take into account the experimental points. For the more constrained physics model used in the electrochemical models, the effect of an inaccurate physics model was drastic. Overall, the importance and potential performance improvements afforded by the physics model information progressively decreases as experimental information increases, and ChIDDO approaches become increasingly similar to BO. Our findings suggest that while the inclusion of physical models of chemical processes may aid the optimization of processes with a large number of optimization parameters, the improvements provided in low-dimensionality optimization problems, such as the 2-D electrochemical reaction optimization example presented, are not significant and data-only approaches are appropriate to rapidly identify optima.

Author contributions

Daniel Frey: conceptualization, formal analysis, investigation, methodology, software, visualization, writing – original draft Juhee Shin: investigation, formal analysis, software Christopher Musco: writing – review & editing, supervision Miguel A. Modestino: conceptualization, funding acquisition, methodology, project administration, supervision, writing – review & editing.

Conflicts of interest

MAM is a director and has a financial interest in Sunthetics, Inc., a startup company in the machine learning optimization space.

Acknowledgements

We thank NYU Tandon School of Engineering and the National Science Foundation for their generous financial support. This material is based upon work supported by the National Science Foundation under grant no. 1943972.

References

  1. D. E. Blanco, B. Lee and M. A. Modestino, Optimizing organic electrosynthesis through controlled voltage dosing and artificial intelligence, Proc. Natl. Acad. Sci. U. S. A., 2019, 116(36), 17683–17689 CrossRef CAS PubMed.
  2. A. Grover, T. Markov, P. Attia, N. Jin, N. Perkins and B. Cheong, 2018, arXiv preprint arXiv:180310937, et al., Best arm identification in multi-armed bandits with delayed feedback.
  3. D. Xue, P. V. Balachandran, J. Hogden, J. Theiler, D. Xue and T. Lookman, Accelerated search for materials with targeted properties by adaptive design, Nat. Commun., 2016, 7(1), 1–9 Search PubMed.
  4. A. Vahid, S. Rana, S. Gupta, P. Vellanki, S. Venkatesh and T. Dorin, New bayesian-optimization-based design of high-strength 7xxx-series alloys from recycled aluminum, JOM, 2018, 70(11), 2704–2709 CrossRef CAS.
  5. C. Li, D. R. de Celis Leal, S. Rana, S. Gupta, A. Sutti and S. Greenhill, et al., Rapid Bayesian optimisation for synthesis of short polymer fiber materials, Sci. Rep., 2017, 7(1), 1–10 CrossRef PubMed.
  6. H. Abdelrahman, F. Berkenkamp, J. Poland and A. Krause, Bayesian optimization for maximum power point tracking in photovoltaic power plants, 2016 European Control Conference (ECC), 2016, pp. 2078–2083 Search PubMed.
  7. S. Kikuchi, H. Oda, S. Kiyohara and T. Mizoguchi, Bayesian optimization for efficient determination of metal oxide grain boundary structures, Phys. B, 2018, 532, 24–28 CrossRef CAS.
  8. M. M. Khajah, B. D. Roads, R. V. Lindsey, Y.-E. Liu and M. C. Mozer, Designing engaging games using Bayesian optimization, Proceedings of the 2016 CHI conference on human factors in computing systems, 2016, pp. 5571–5582 Search PubMed.
  9. R. Lorenz, I. R. Violante, R. P. Monti, G. Montana, A. Hampshire and R. Leech, Dissociating frontoparietal brain networks with neuroadaptive Bayesian optimization, Nat. Commun., 2018, 9(1), 1–14 CrossRef CAS PubMed.
  10. P. Frazier, 2018, arXiv: 180702811, A tutorial on Bayesian optimization.
  11. H. C. Herbol, W. Hu, P. Frazier, P. Clancy and M. Poloczek, Efficient search of compositional space for hybrid organic–inorganic perovskites via Bayesian optimization, npj Comput. Mater., 2018, 4(1), 1–7 CrossRef CAS.
  12. H. C. Herbol, M. Poloczek and P. Clancy, Cost-effective materials discovery: Bayesian optimization across multiple information sources, Mater. Horiz., 2020, 7(8), 2113–2123 RSC.
  13. T. Yamashita, N. Sato, H. Kino, T. Miyake, K. Tsuda and T. Oguchi, Crystal structure prediction accelerated by Bayesian optimization, Phys. Rev. Mater., 2018, 2(1), 013803 CrossRef.
  14. S. Ju, T. Shiga, L. Feng, Z. Hou, K. Tsuda and J. Shiomi, Designing nanostructures for phonon transport via Bayesian optimization, Phys. Rev. X, 2017, 7(2), 021024 Search PubMed.
  15. T. Ueno, T. D. Rhone, Z. Hou, T. Mizoguchi and K. Tsuda, COMBO: an efficient Bayesian optimization library for materials science, Mater. Discov., 2016, 4, 18–21 CrossRef.
  16. W. Hashimoto, Y. Tsuji and K. Yoshizawa, Optimization of Work Function via Bayesian Machine Learning Combined with First-Principles Calculation, J. Phys. Chem. C, 2020, 124(18), 9958–9970 CrossRef CAS.
  17. P. V. Balachandran, B. Kowalski, A. Sehirlioglu and T. Lookman, Experimental search for high-temperature ferroelectric perovskites guided by two-step machine learning, Nat. Commun., 2018, 9(1), 1–9 CrossRef CAS PubMed.
  18. K. Higgins, S. M. Valleti, M. Ziatdinov, S. V. Kalinin and M. Ahmadi, Chemical Robotics Enabled Exploration of Stability in Multicomponent Lead Halide Perovskites via Machine Learning, ACS Energy Lett., 2020, 5(11), 3426–3436 CrossRef CAS.
  19. J. Ling, M. Hutchinson, E. Antono, S. Paradiso and B. Meredig, High-dimensional materials and process optimization using data-driven experimental design with well-calibrated uncertainty estimates, Integr. Mater. Manuf. Innov., 2017, 6(3), 207–217 CrossRef.
  20. B. P. MacLeod, F. G. Parlane, T. D. Morrissey, F. Häse, L. M. Roch and K. E. Dettelbach, et al., Self-driving laboratory for accelerated discovery of thin-film materials, Sci. Adv., 2020, 6(20), eaaz8867 CrossRef CAS PubMed.
  21. K. Min and E. Cho, Accelerated discovery of potential ferroelectric perovskite via active learning, J. Mater. Chem. C, 2020, 8(23), 7866–7872 RSC.
  22. B. Rezaeianjouybari, M. Sheikholeslami, A. Shafee and H. Babazadeh, A novel Bayesian optimization for flow condensation enhancement using nanorefrigerant: a combined analytical and experimental study, Chem. Eng. Sci., 2020, 215, 115465 CrossRef CAS.
  23. S. Park, J. Na, M. Kim and J. M. Lee, Multi-objective Bayesian optimization of chemical reactor design using computational fluid dynamics, Comput. Chem. Eng., 2018, 119, 25–37 CrossRef CAS.
  24. A. M. Schweidtmann, A. D. Clayton, N. Holmes, E. Bradford, R. A. Bourne and A. A. Lapkin, Machine learning meets continuous flow chemistry: Automated optimization towards the Pareto front of multiple objectives, Chem. Eng. J., 2018, 352, 277–282 CrossRef CAS.
  25. B. Burger, P. M. Maffettone, V. V. Gusev, C. M. Aitchison, Y. Bai and X. Wang, et al., A mobile robotic chemist, Nature, 2020, 583(7815), 237–241 CrossRef CAS PubMed.
  26. J. M. Granda, L. Donina, V. Dragone, D.-L. Long and L. Cronin, Controlling an organic synthesis robot with machine learning to search for new reactivity, Nature, 2018, 559(7714), 377–381 CrossRef CAS PubMed.
  27. Z. Guo, S. Wu, M. Ohno and R. Yoshida, Bayesian Algorithm for Retrosynthesis, J. Chem. Inf. Model., 2020, 60(10), 4474–4486 CrossRef CAS PubMed.
  28. F. Häse, L. M. Roch and A. Aspuru-Guzik, Chimera: enabling hierarchy based multi-objective optimization for self-driving laboratories, Chem. Sci., 2018, 9(39), 7642–7655 RSC.
  29. F. Häse, L. M. Roch and A. Aspuru-Guzik, Next-generation experimentation with self-driving laboratories, Trends Chem., 2019, 1(3), 282–291 CrossRef.
  30. M. Kondo, H. Wathsala, M. Sako, Y. Hanatani, K. Ishikawa and S. Hara, et al., Exploration of flow reaction conditions using machine-learning for enantioselective organocatalyzed Rauhut–Currier and [3+ 2] annulation sequence, Chem. Commun., 2020, 56(8), 1259–1262 RSC.
  31. B. J. Shields, J. Stevens, J. Li, M. Parasram, F. Damani and J. I. M. Alvarado, et al., Bayesian reaction optimization as a tool for chemical synthesis, Nature, 2021, 590(7844), 89–96 CrossRef CAS PubMed.
  32. D. Reker, E. A. Hoyt, G. J. Bernardes and T. Rodrigues, Adaptive Optimization of Chemical Reactions with Minimal Experimental Information, Cell Rep. Phys. Sci., 2020, 1(11), 100247 CrossRef.
  33. K. Kim, W. H. Lee, J. Na, Y. Hwang, H.-S. Oh and U. Lee, Data-driven pilot optimization for electrochemical CO mass production, J. Mater. Chem. A, 2020, 8(33), 16943–16950 RSC.
  34. Y. Wang, T. Xie, A. France-Lanord, A. Berkley, J. A. Johnson and Y. Shao-Horn, et al., Toward Designing Highly Conductive Polymer Electrolytes by Machine Learning Assisted Coarse-Grained Molecular Dynamics, Chem. Mater., 2020, 32(10), 4144–4151 CrossRef CAS.
  35. P. M. Attia, A. Grover, N. Jin, K. A. Severson, T. M. Markov and Y.-H. Liao, et al., Closed-loop optimization of fast-charging protocols for batteries with machine learning, Nature, 2020, 578(7795), 397–402 CrossRef CAS PubMed.
  36. H. A. Doan, G. Agarwal, H. Qian, M. J. Counihan, J. Rodríguez-López and J. S. Moore, et al., Quantum chemistry-informed active learning to accelerate the design and discovery of sustainable energy storage materials, Chem. Mater., 2020, 32(15), 6338–6346 CrossRef CAS.
  37. A. Dave, J. Mitchell, K. Kandasamy, H. Wang, S. Burke and B. Paria, et al., Autonomous Discovery of Battery Electrolytes with Robotic Experimentation and Machine Learning, Cell Rep. Phys. Sci., 2020, 100264 CrossRef CAS.
  38. M. Ebrahimi, D. S. K. Ting, R. Carriveau, A. McGillis and D. Young, Optimization of a cavern-based compressed air energy storage facility with an efficient adaptive genetic algorithm, Energy Storage, 2020, 2(6), e205 CrossRef.
  39. M. Poloczek, J. Wang and P. Frazier, Multi-information source optimization, Adv. Neural Inf. Process. Syst., 2017, 4288–4298 Search PubMed.
  40. K. Swersky, J. Snoek and R. P. Adams, Multi-task bayesian optimization, Adv. Neural Inf. Process. Syst., 2013, 2004–2012 Search PubMed.
  41. Multifidelity optimization using statistical surrogate modeling for non-hierarchical information sources, 56th AIAA/ASCE/AHS/ASC Structures, Structural Dynamics, and Materials Conference, ed. R. Lam, D. L. Allaire and K. E. Willcox, 2015 Search PubMed.
  42. T. N. Cardoso, R. M. Silva, S. Canuto, M. M. Moro and M. A. Gonçalves, Ranked batch-mode active learning, Inf. Sci., 2017, 379, 313–337 CrossRef.
  43. D. R. Jones, M. Schonlau and W. J. Welch, Efficient global optimization of expensive black-box functions, J. Glob. Optim., 1998, 13(4), 455–492 CrossRef.
  44. H. J. Kushner, A new method of locating the maximum point of an arbitrary multipeak curve in the presence of noise, 1964, pp. 97–106 Search PubMed.
  45. N. Srinivas, A. Krause, S. M. Kakade and M. Seeger, 2009, arXiv preprint arXiv:09123995, Gaussian process optimization in the bandit setting: No regret and experimental design.
  46. Acquisition funcitons modAL cited 2021 Available from: https://modal-python.readthedocs.io/en/latest/content/query_strategies/Acquisition-functions.html.
  47. M. M. Baizer, Electrolytic Reductive Coupling: I. Acrylonitrile, J. Electrochem. Soc., 1964, 111(2), 215 CrossRef CAS.
  48. G. G. Botte, Electrochemical manufacturing in the chemical industry, Electrochem. Soc. Interface, 2014, 23(3), 49 CrossRef.
  49. D. Frey, Chemically-informed-data-driven-optimization-ChIDDO, GitHub repository, 2021.

Footnote

Electronic supplementary information (ESI) available: Acquisition function descriptions, objective function descriptions, and supplementary results. See DOI: 10.1039/d2re00005a

This journal is © The Royal Society of Chemistry 2022